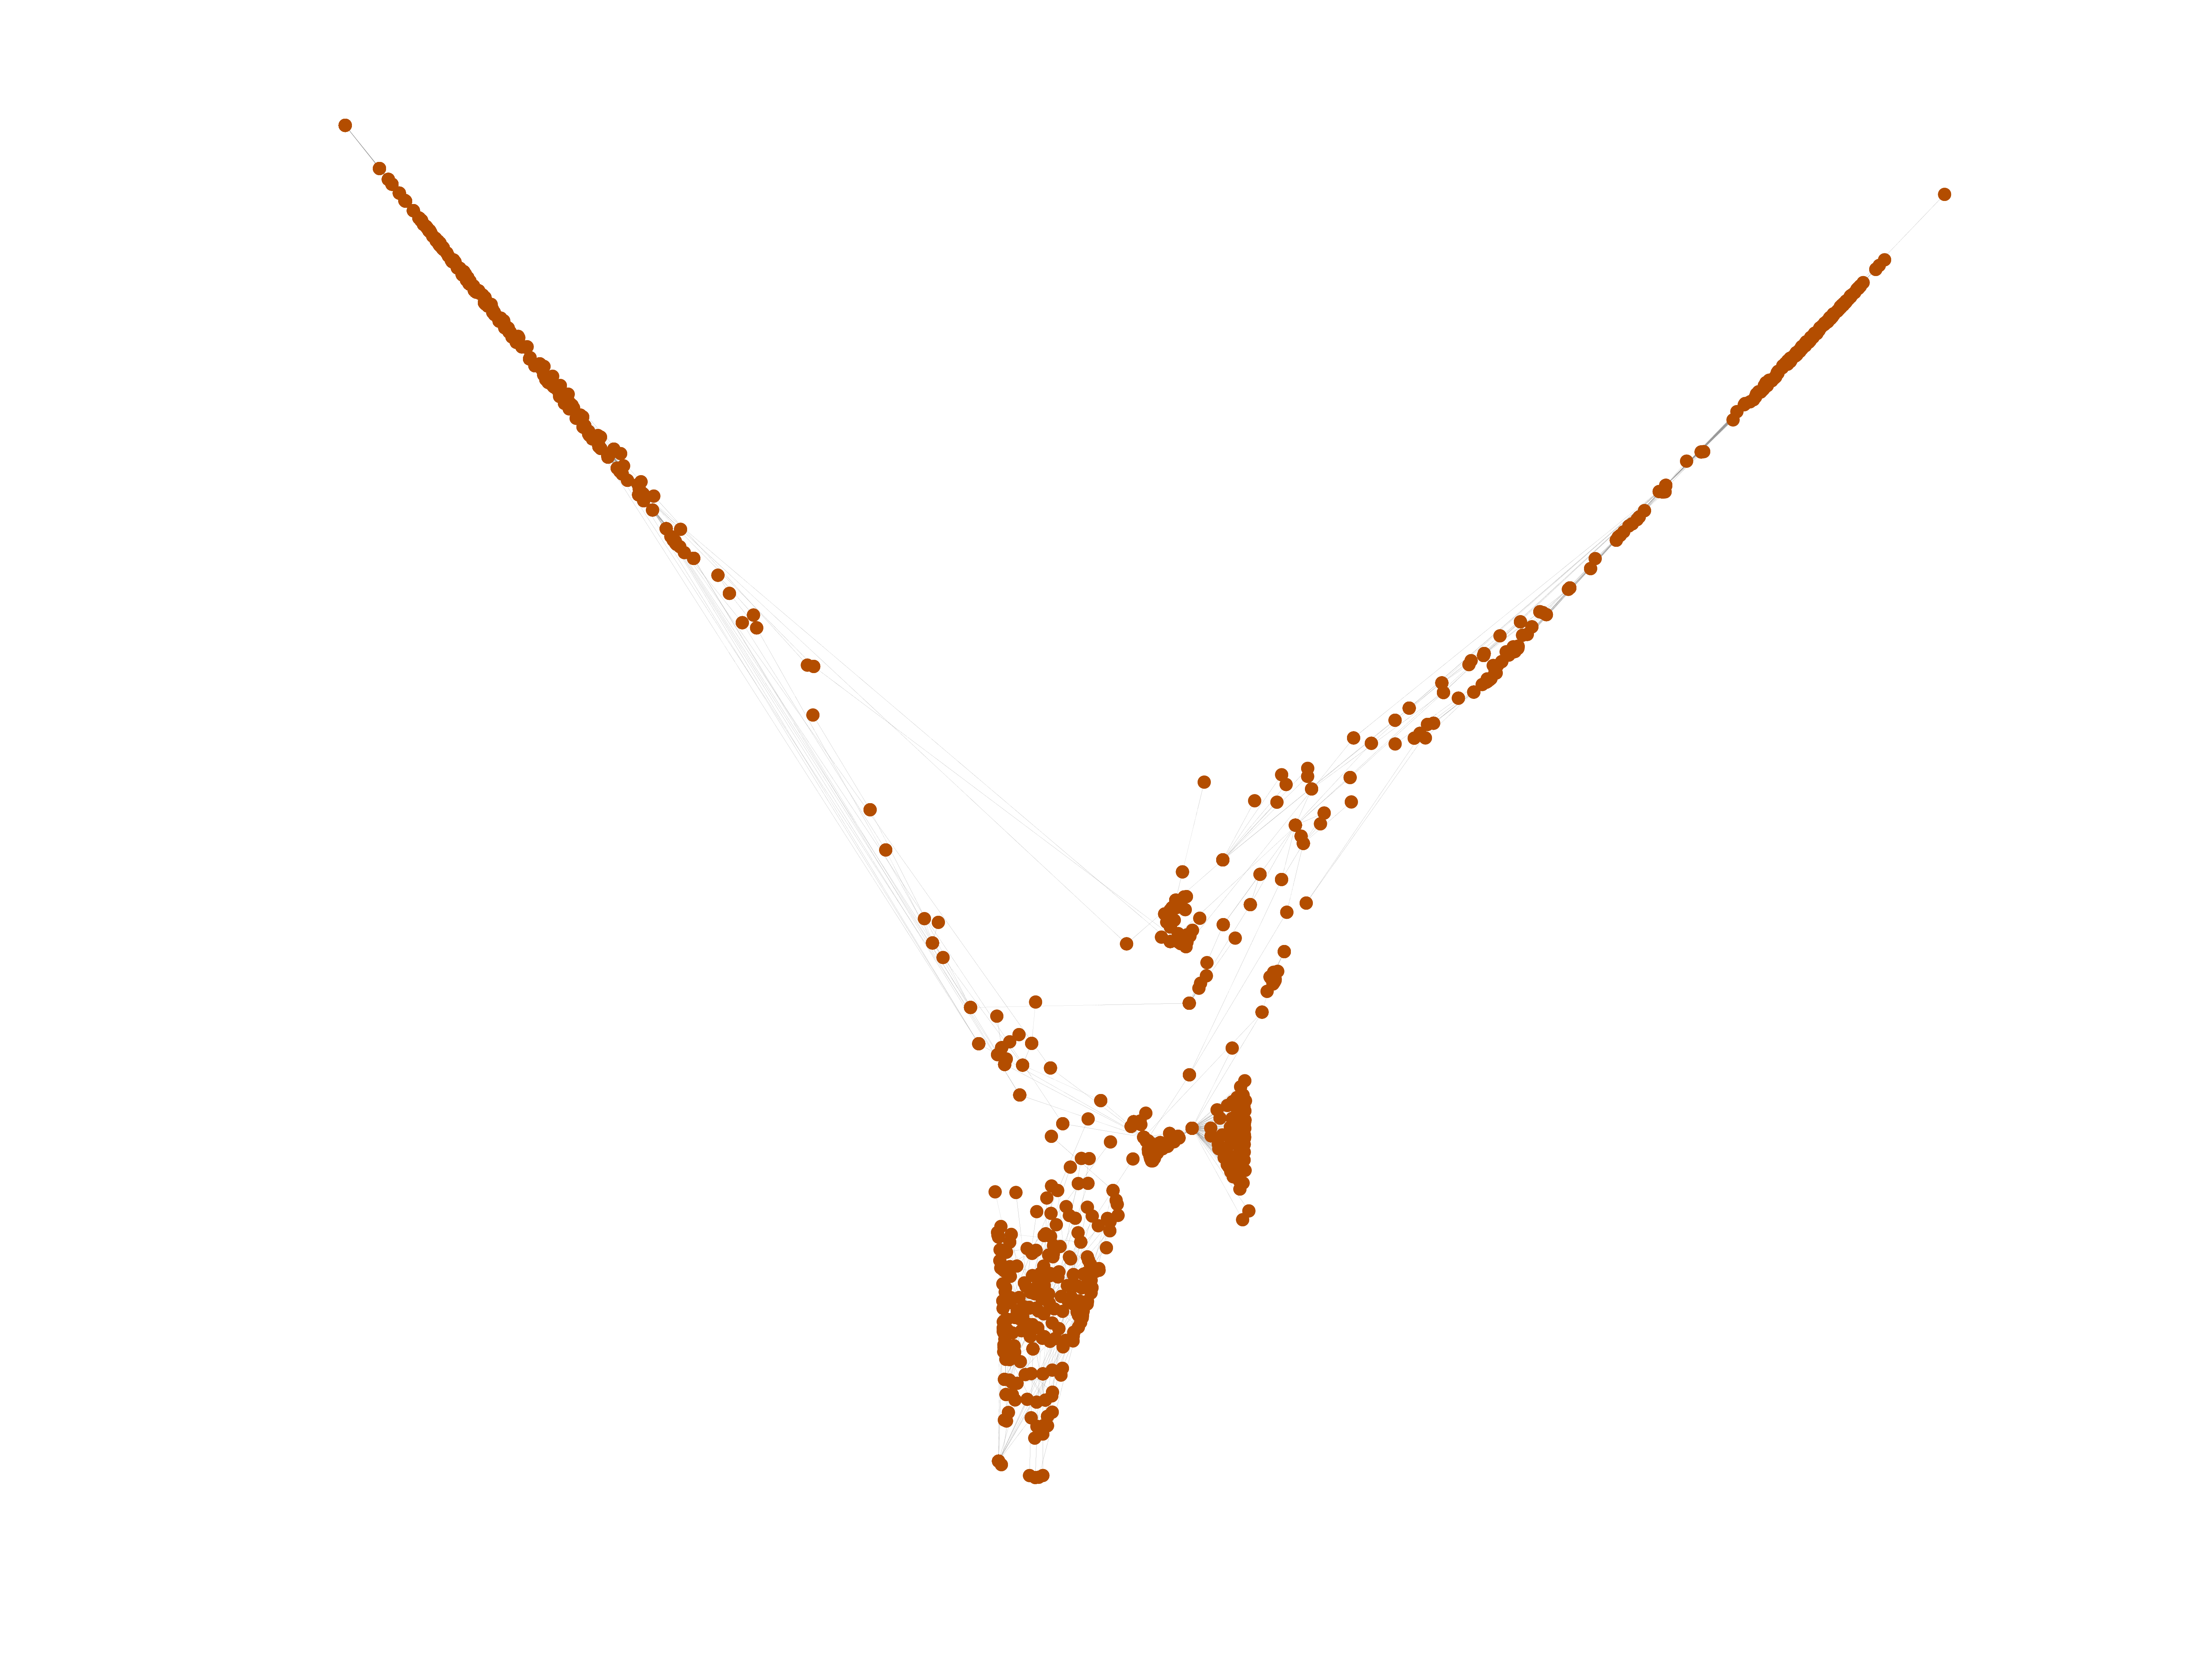
Wiktionary edits (tn)
This is the bipartite edit network of the Tswana Wiktionary. It contains users
and pages from the Tswana Wiktionary, connected by edit events. Each edge
represents an edit. The dataset includes the timestamp of each edit.
Metadata
Statistics
| Size | n = | 882
|
| Left size | n1 = | 160
|
| Right size | n2 = | 722
|
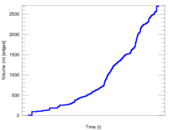
| Volume | m = | 2,716
|
| Unique edge count | m̿ = | 1,330
|
| Wedge count | s = | 46,056
|
| Claw count | z = | 1,879,536
|
| Cross count | x = | 71,419,969
|
| Square count | q = | 20,583
|
| 4-Tour count | T4 = | 351,900
|
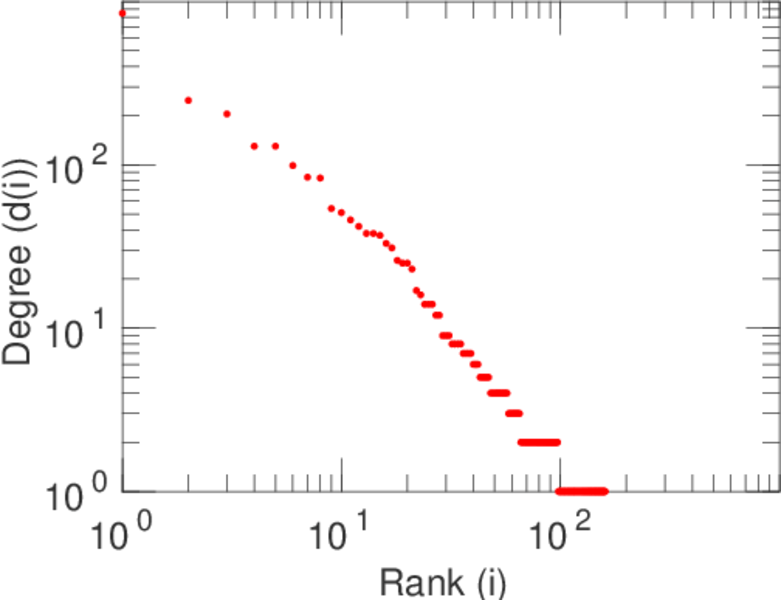
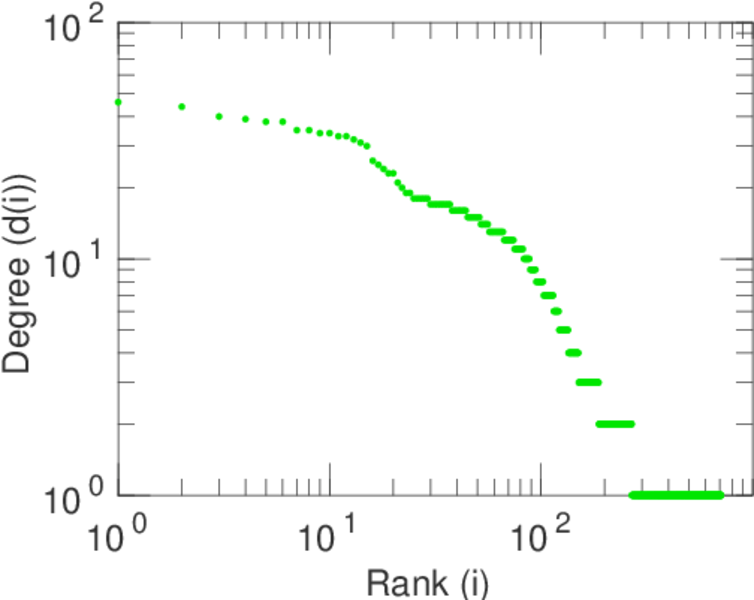
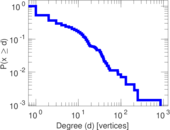
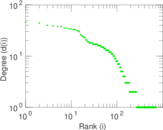
| Maximum degree | dmax = | 848
|
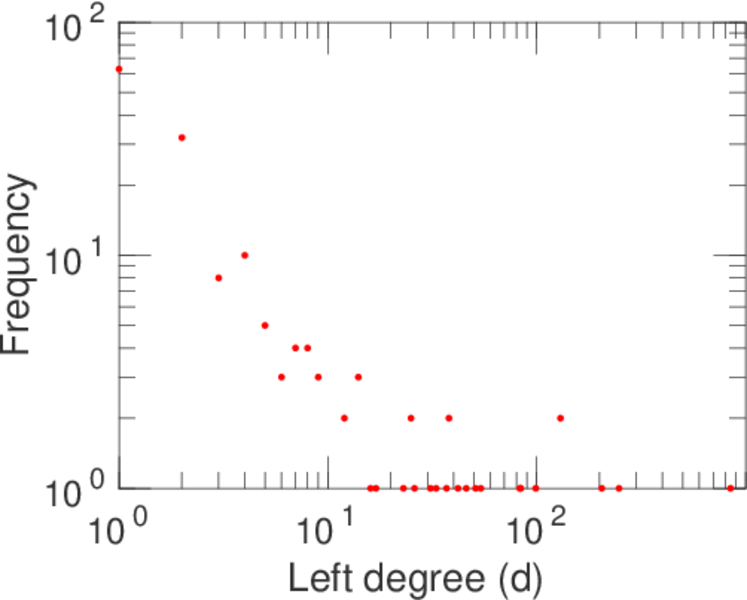
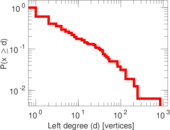
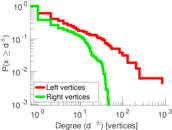
| Maximum left degree | d1max = | 848
|
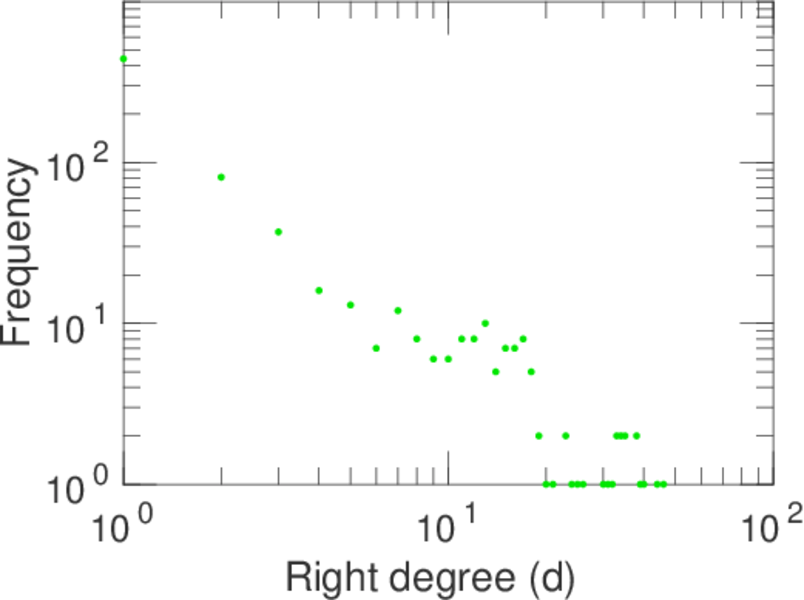
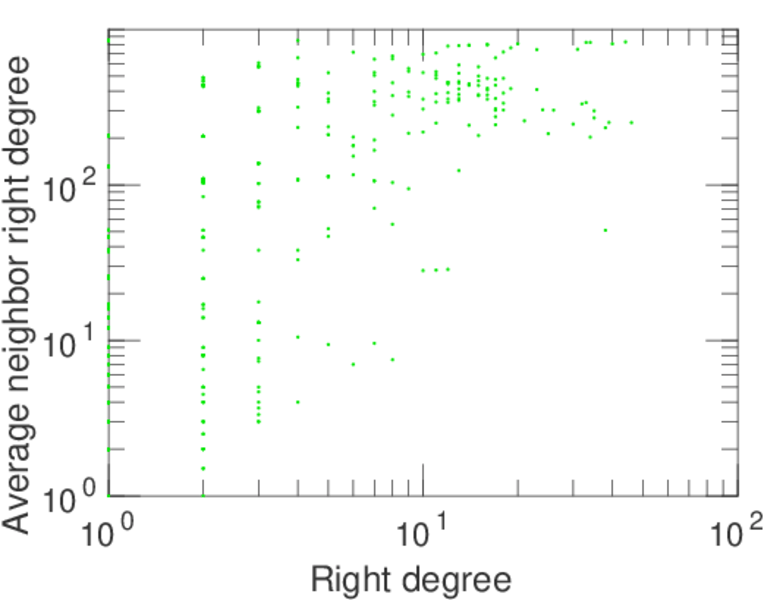
| Maximum right degree | d2max = | 46
|
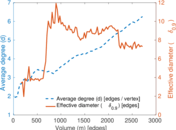
| Average degree | d = | 6.158 73
|
| Average left degree | d1 = | 16.975 0
|
| Average right degree | d2 = | 3.761 77
|
| Fill | p = | 0.011 513 2
|
| Average edge multiplicity | m̃ = | 2.042 11
|
| Size of LCC | N = | 665
|
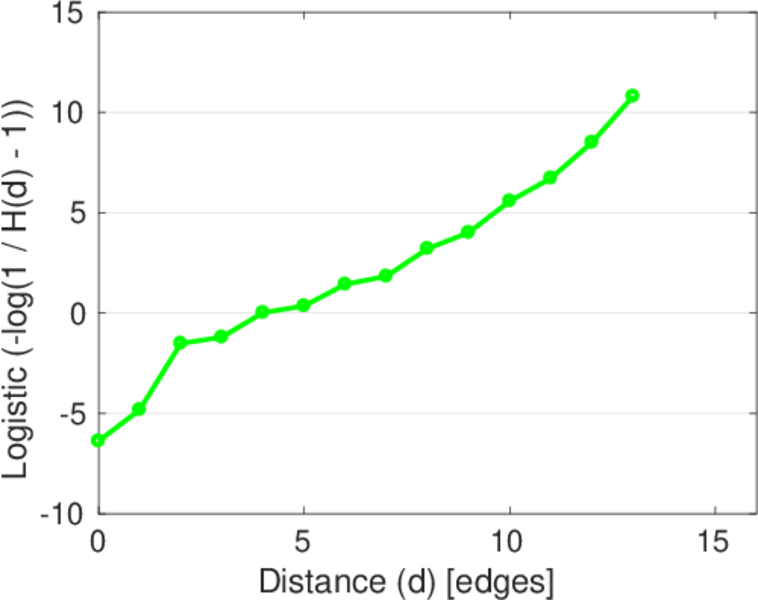
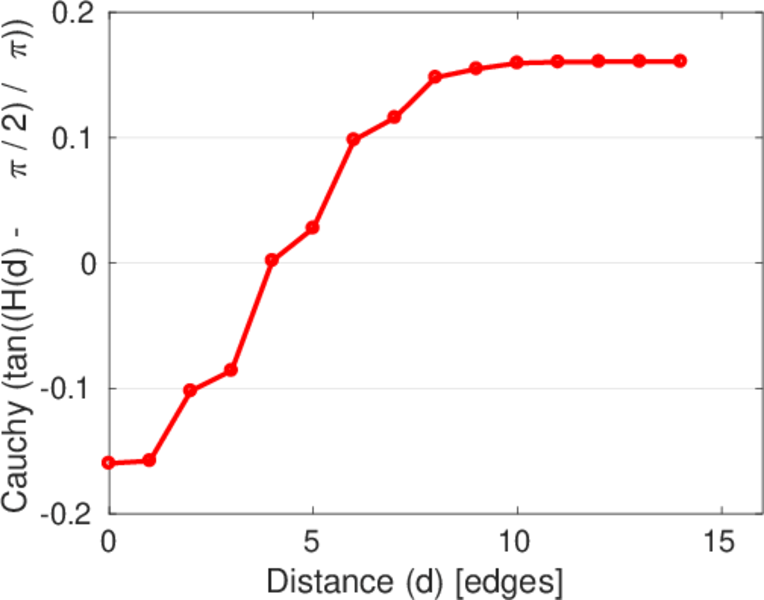
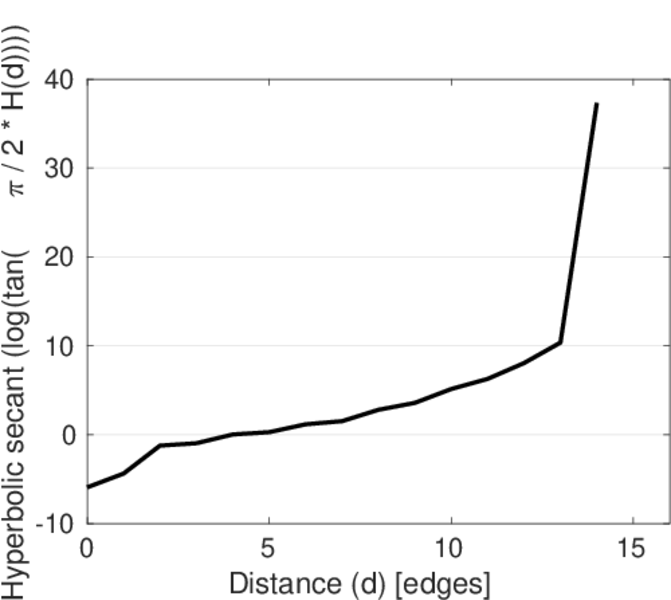
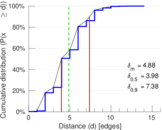
| Diameter | δ = | 15
|
| 50-Percentile effective diameter | δ0.5 = | 3.980 52
|
| 90-Percentile effective diameter | δ0.9 = | 7.383 01
|
| Median distance | δM = | 4
|
| Mean distance | δm = | 4.880 47
|
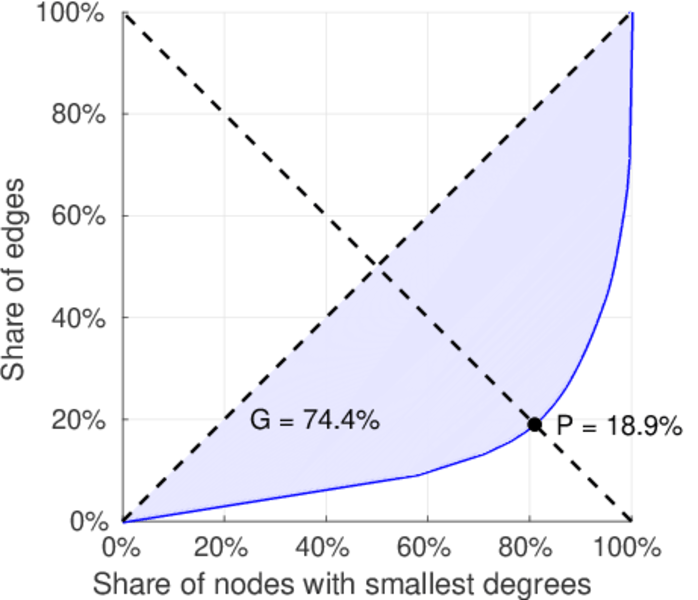
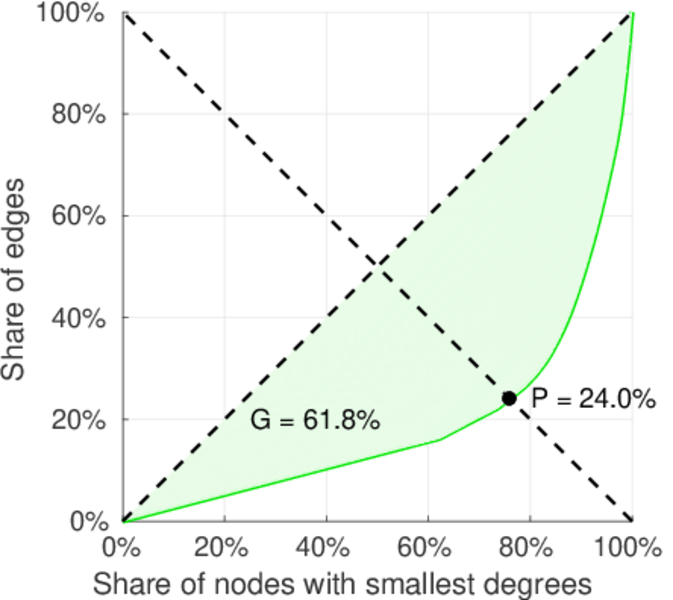
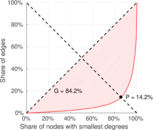
| Gini coefficient | G = | 0.743 058
|
| Balanced inequality ratio | P = | 0.193 483
|
| Left balanced inequality ratio | P1 = | 0.142 489
|
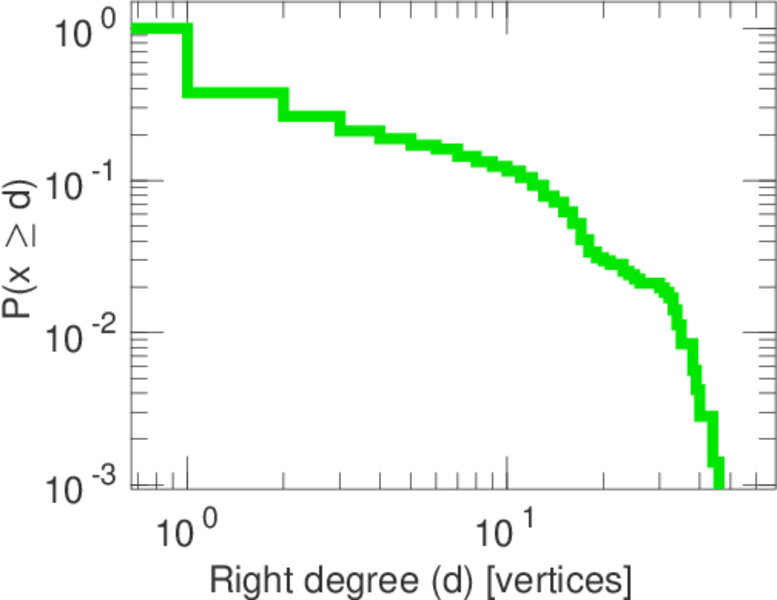
| Right balanced inequality ratio | P2 = | 0.239 691
|
| Relative edge distribution entropy | Her = | 0.839 079
|
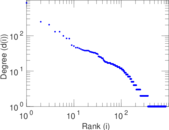
| Power law exponent | γ = | 3.122 06
|
| Tail power law exponent | γt = | 2.131 00
|
| Tail power law exponent with p | γ3 = | 2.131 00
|
| p-value | p = | 0.162 000
|
| Left tail power law exponent with p | γ3,1 = | 1.711 00
|
| Left p-value | p1 = | 0.447 000
|
| Right tail power law exponent with p | γ3,2 = | 2.311 00
|
| Right p-value | p2 = | 0.038 000 0
|
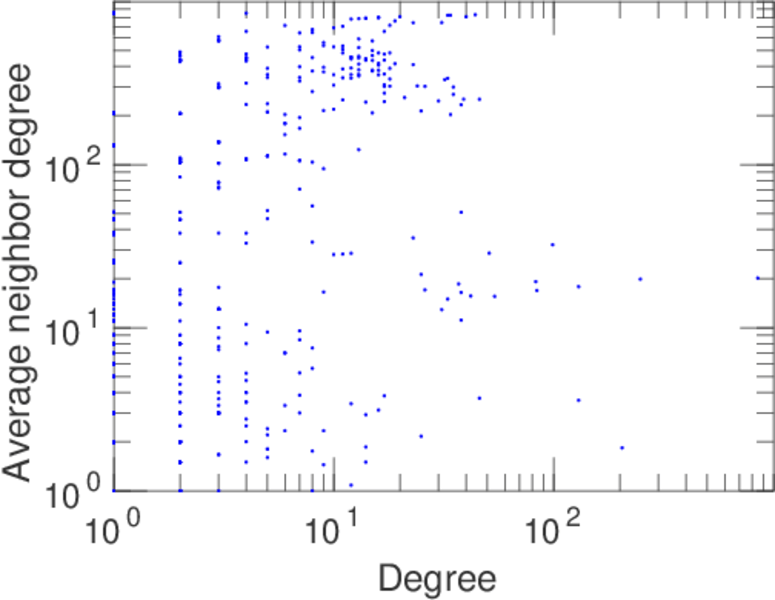
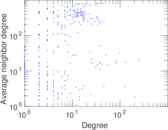
| Degree assortativity | ρ = | −0.146 952
|
| Degree assortativity p-value | pρ = | 7.308 49 × 10−8
|
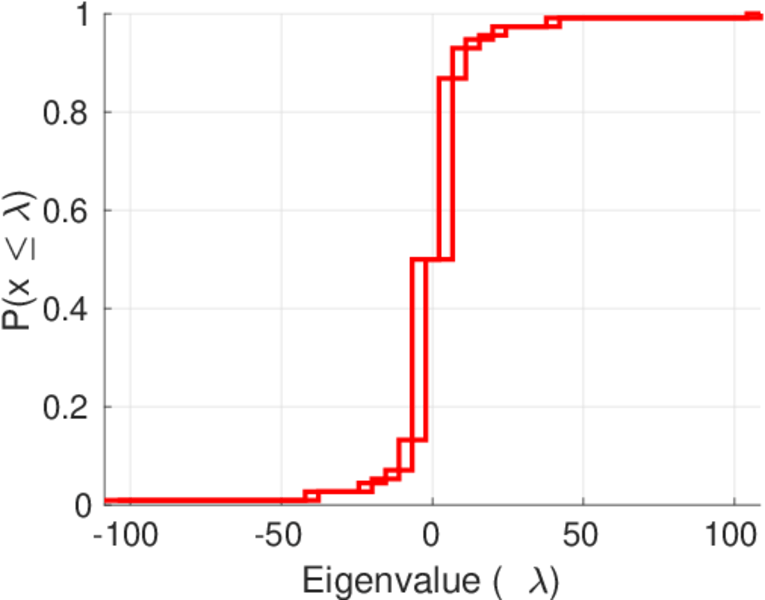
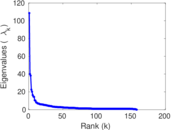
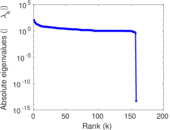
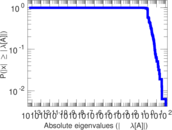
| Spectral norm | α = | 108.595
|
| Algebraic connectivity | a = | 0.015 751 3
|
| Spectral separation | |λ1[A] / λ2[A]| = | 2.711 67
|
| Controllability | C = | 555
|
| Relative controllability | Cr = | 0.638 665
|
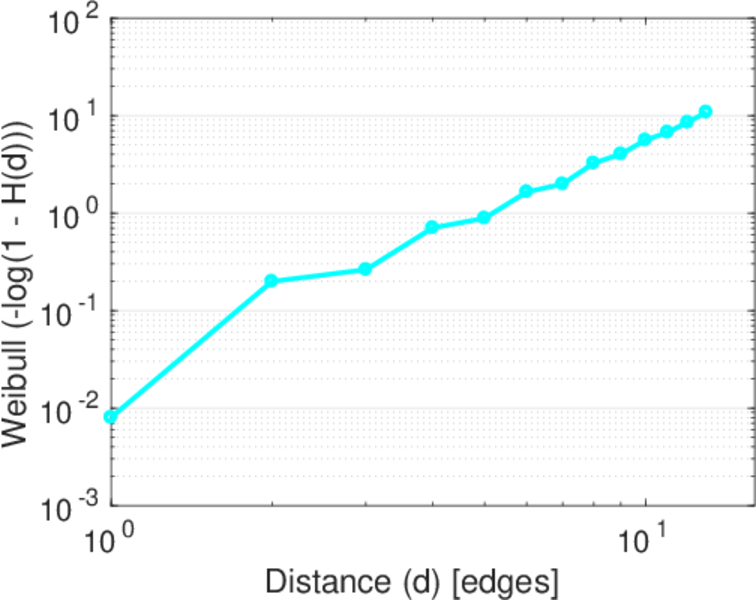
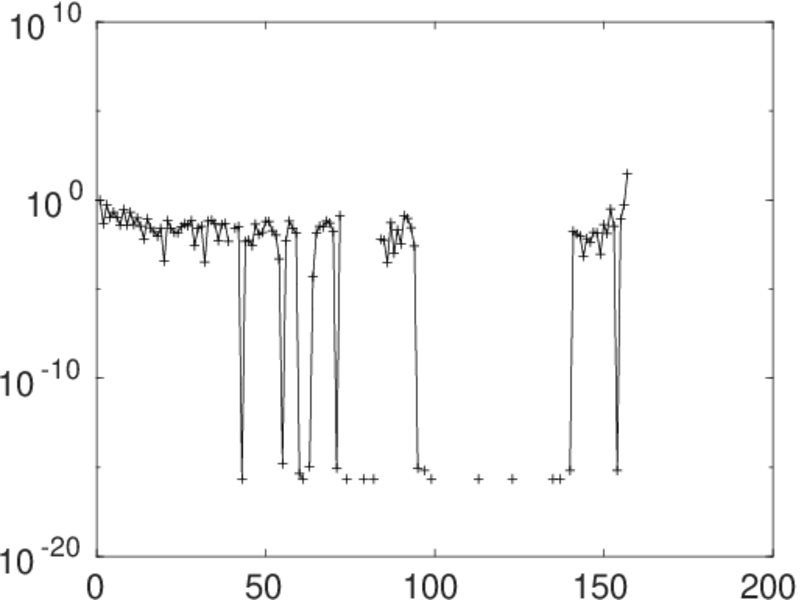
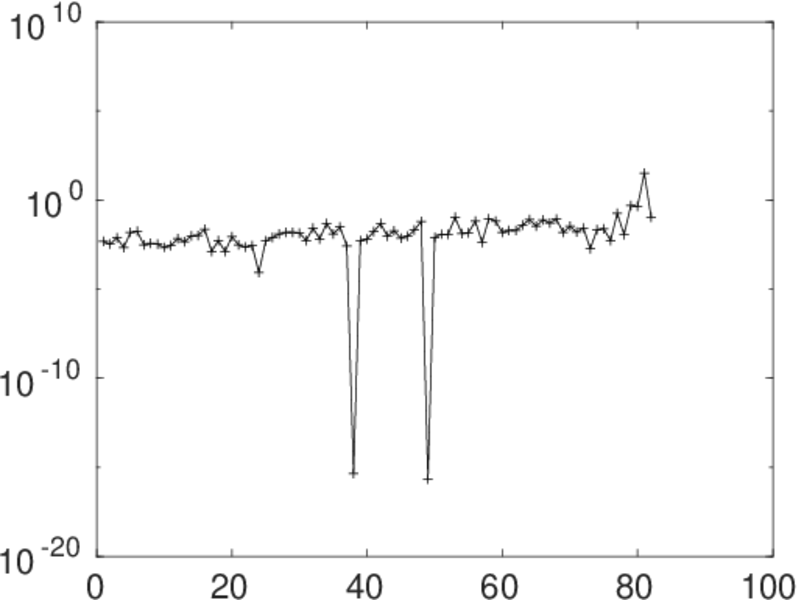
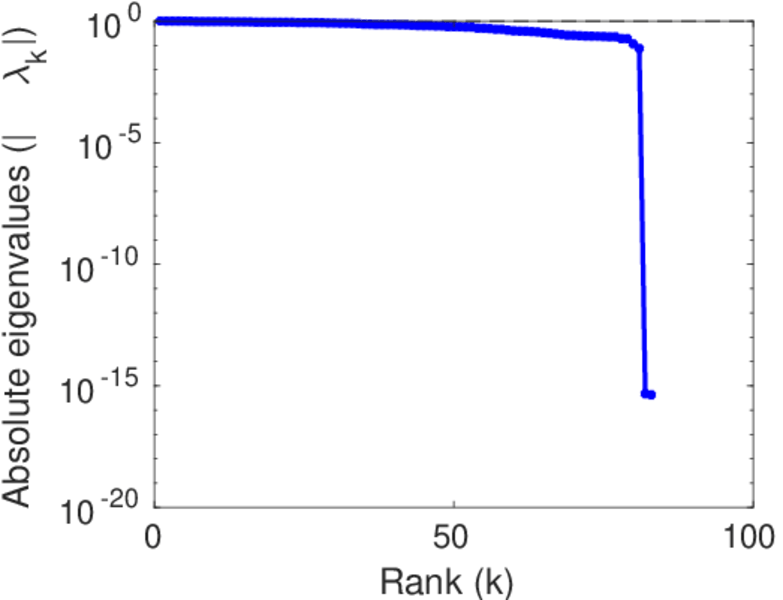
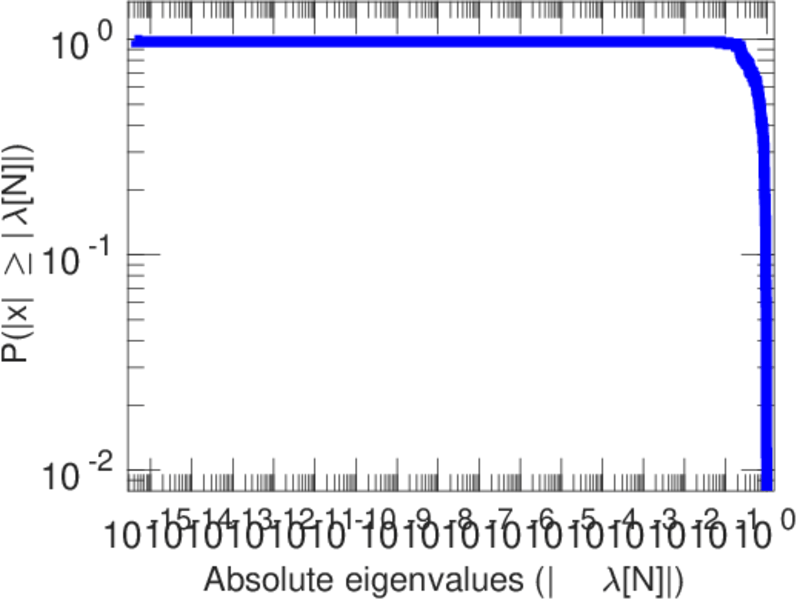
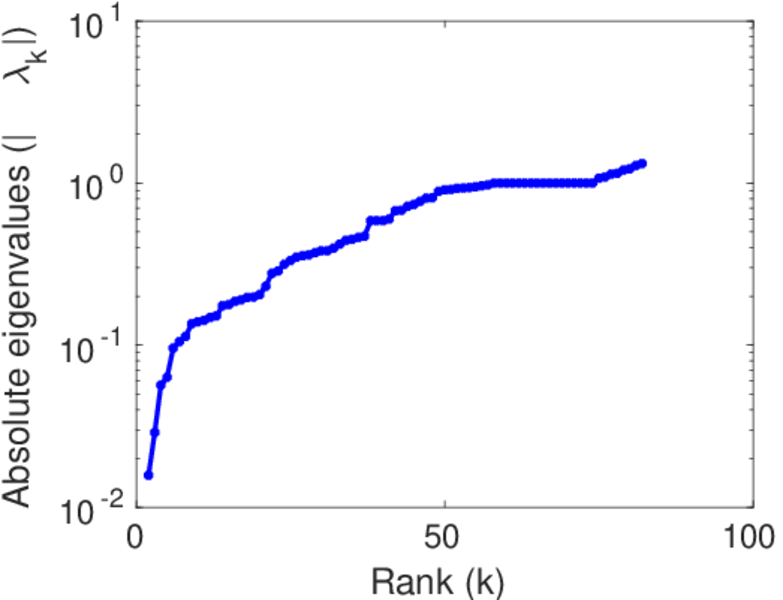
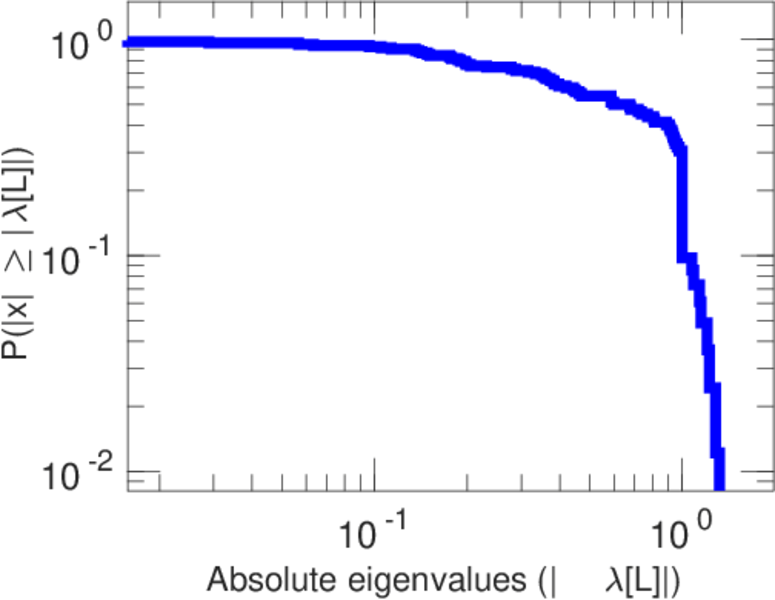
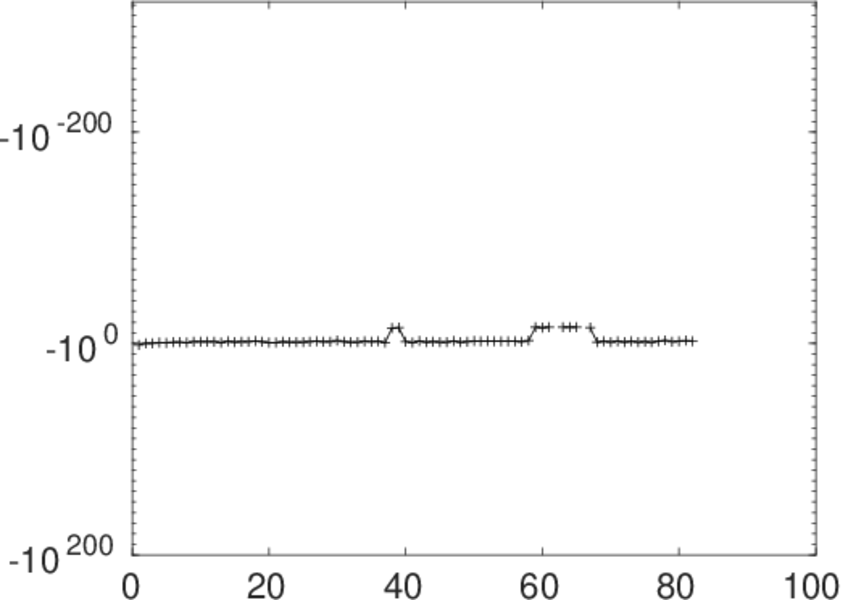
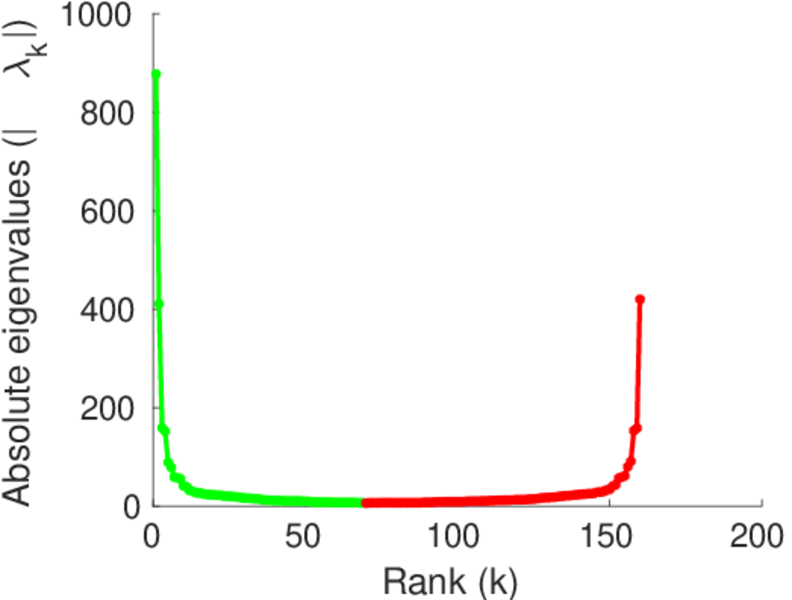
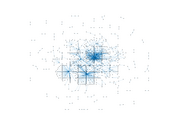
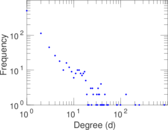
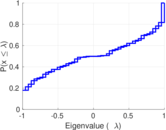
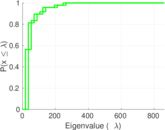
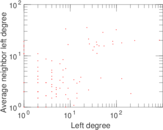
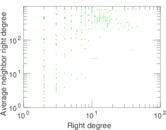
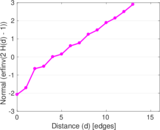
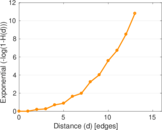
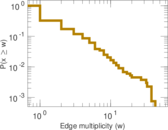
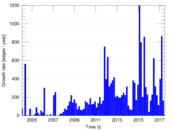
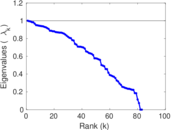
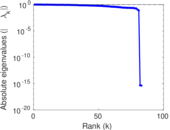
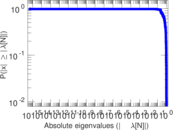
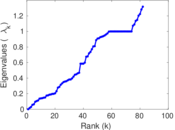
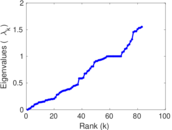
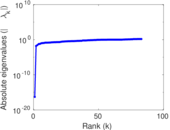
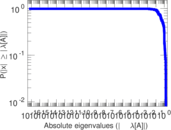
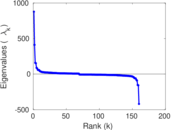
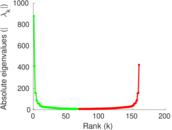
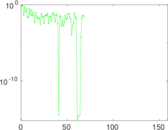
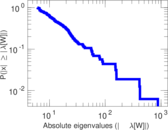
Plots


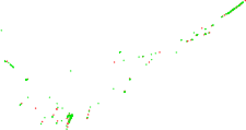
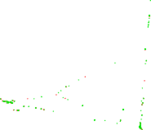


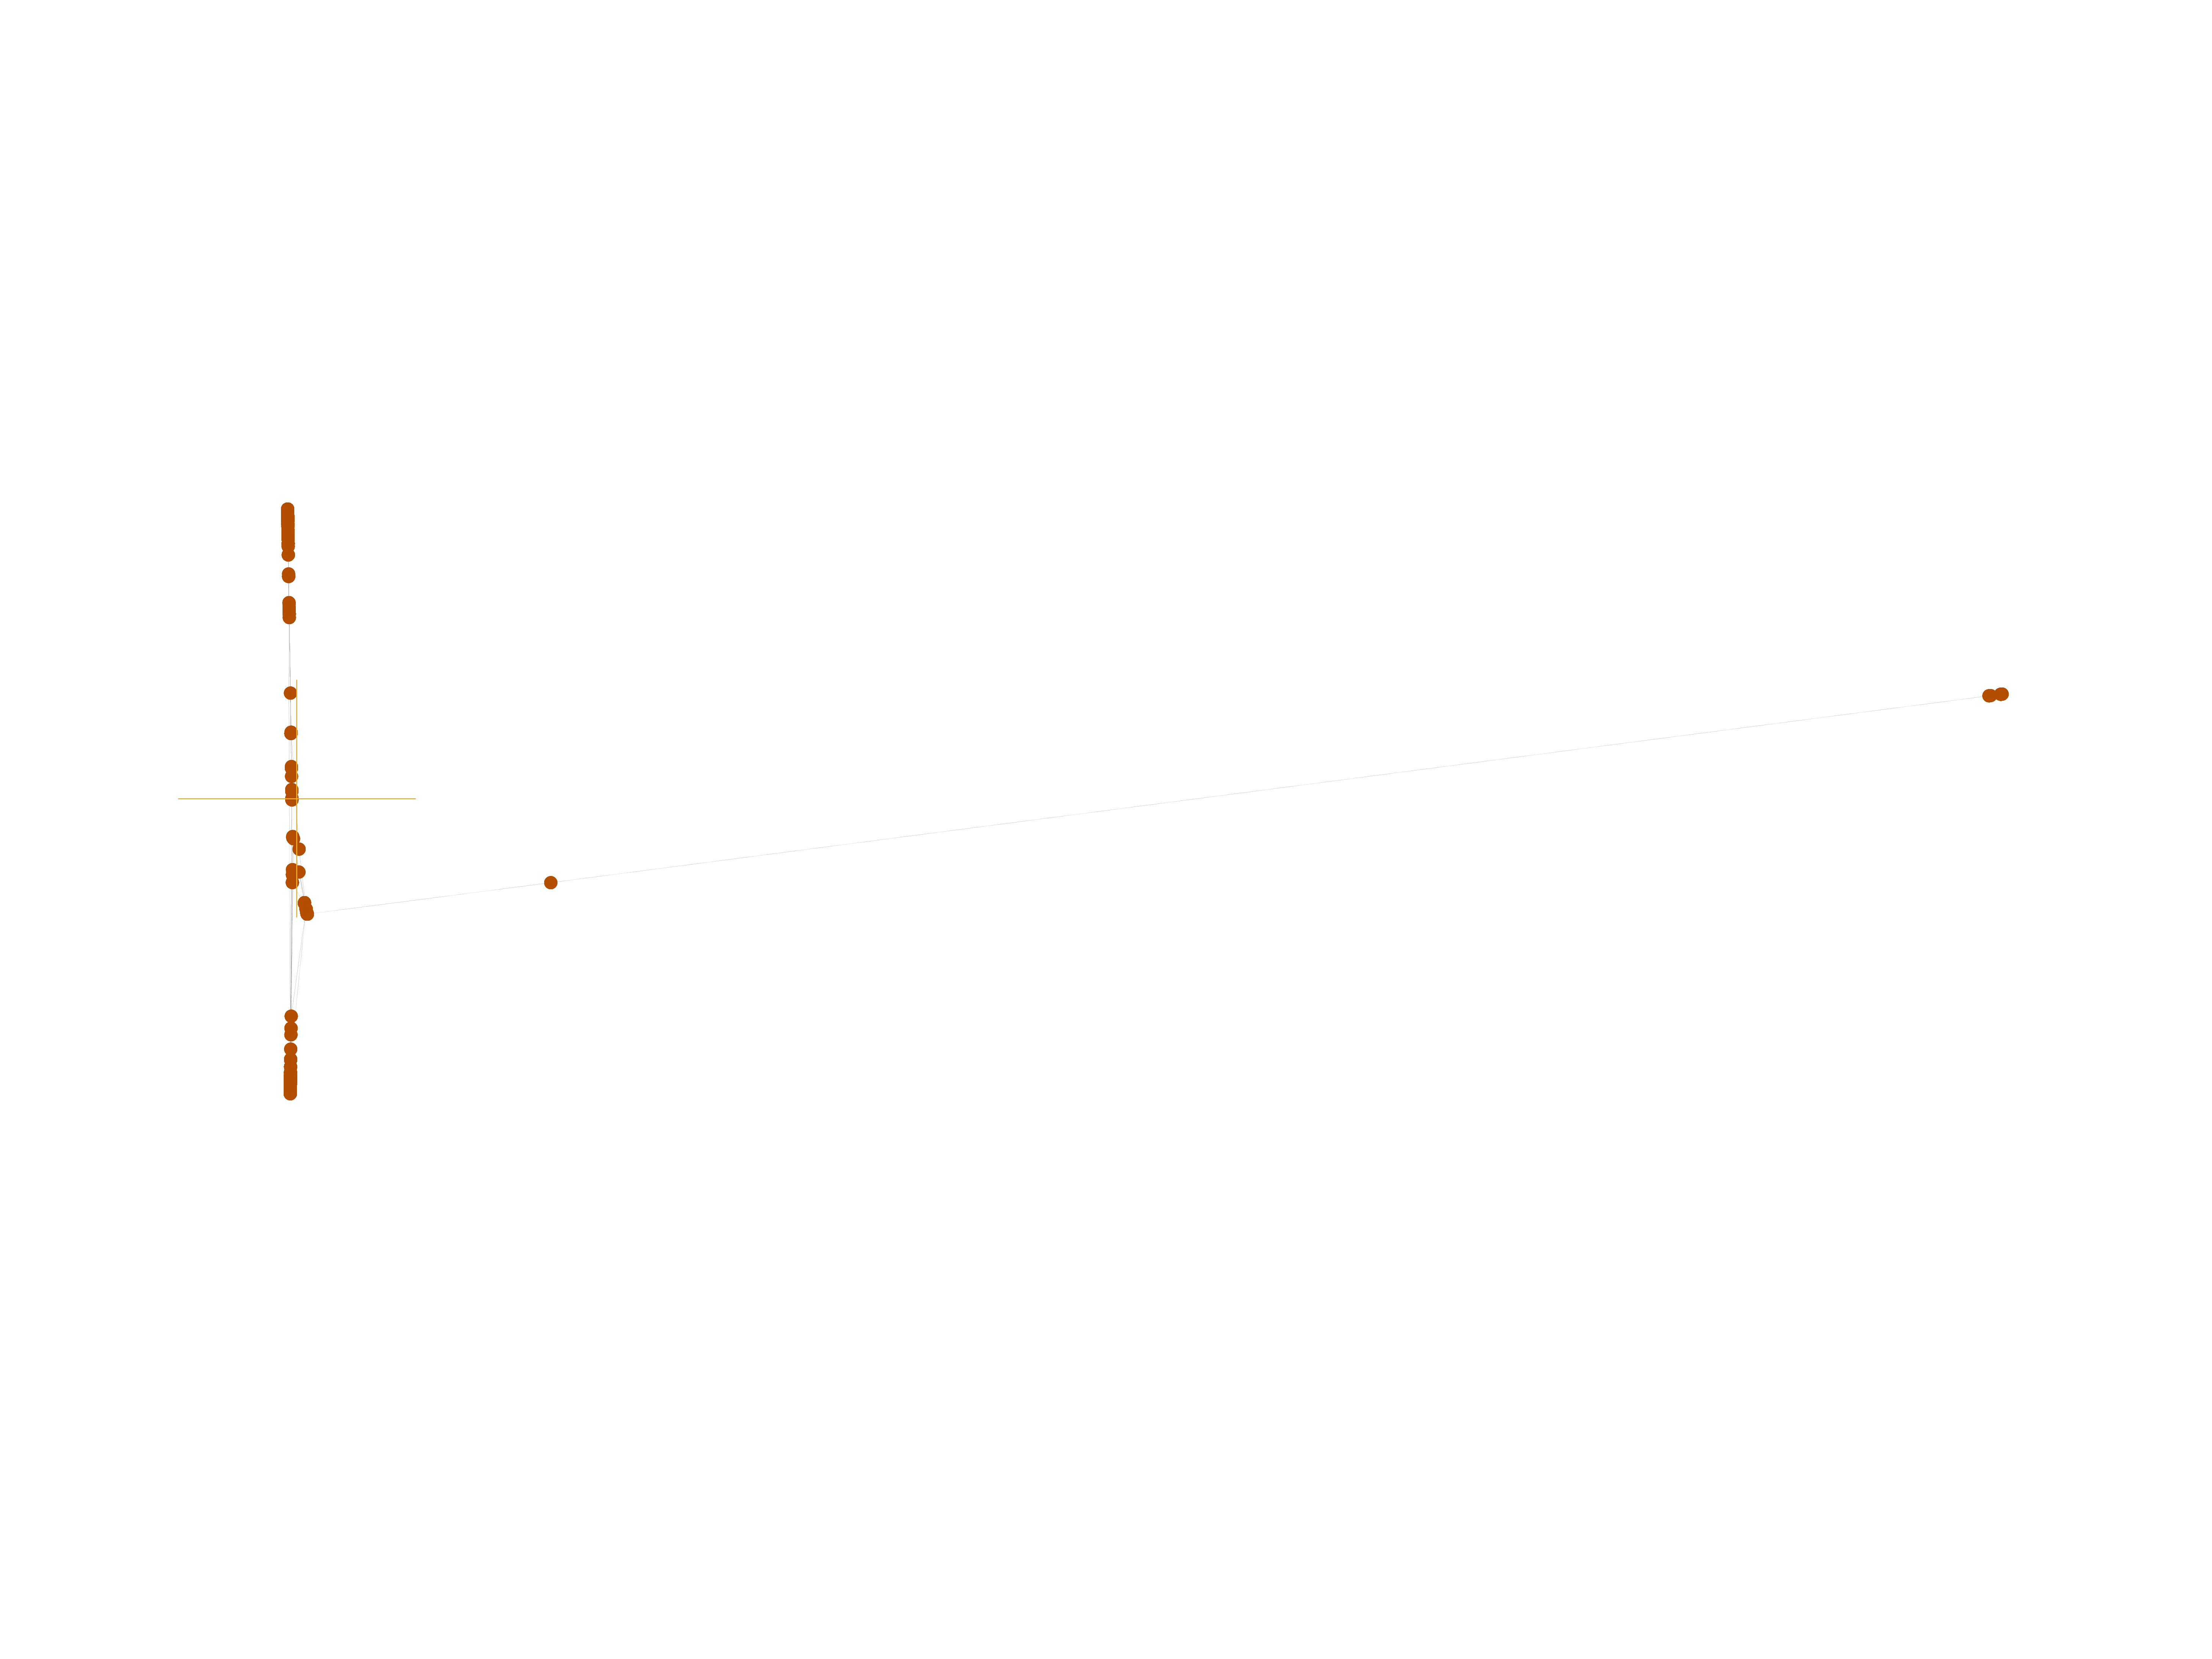
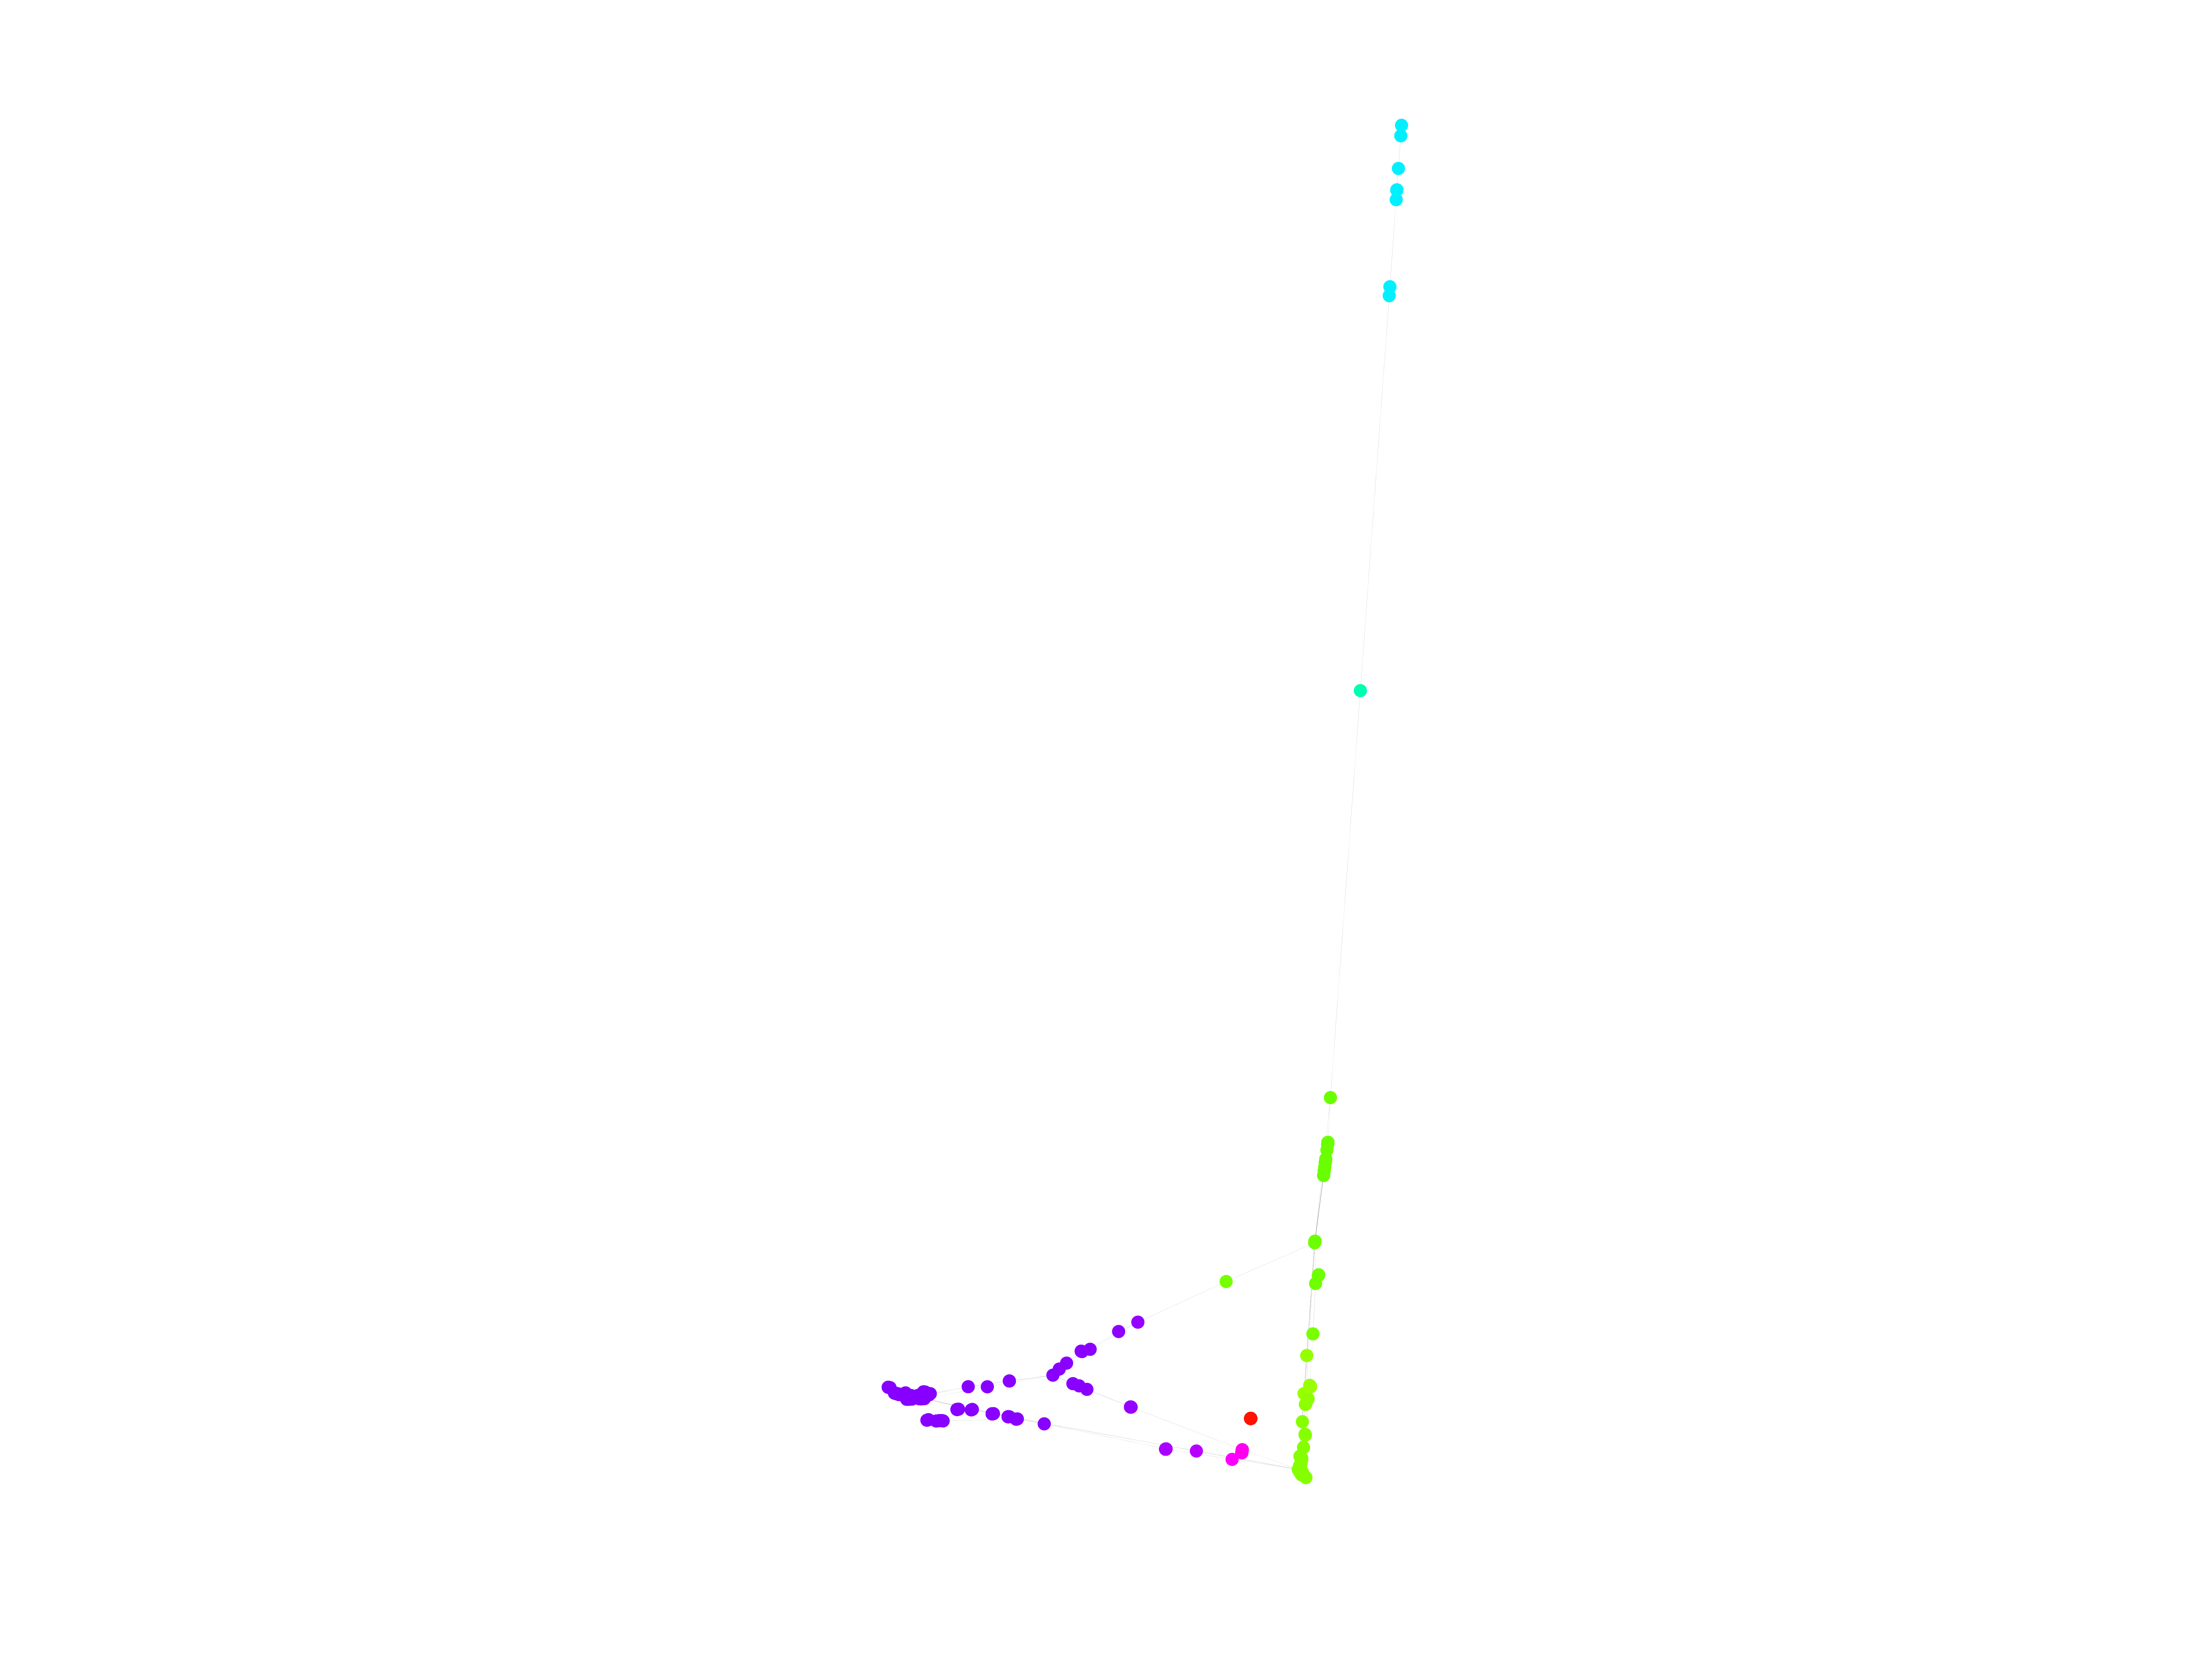
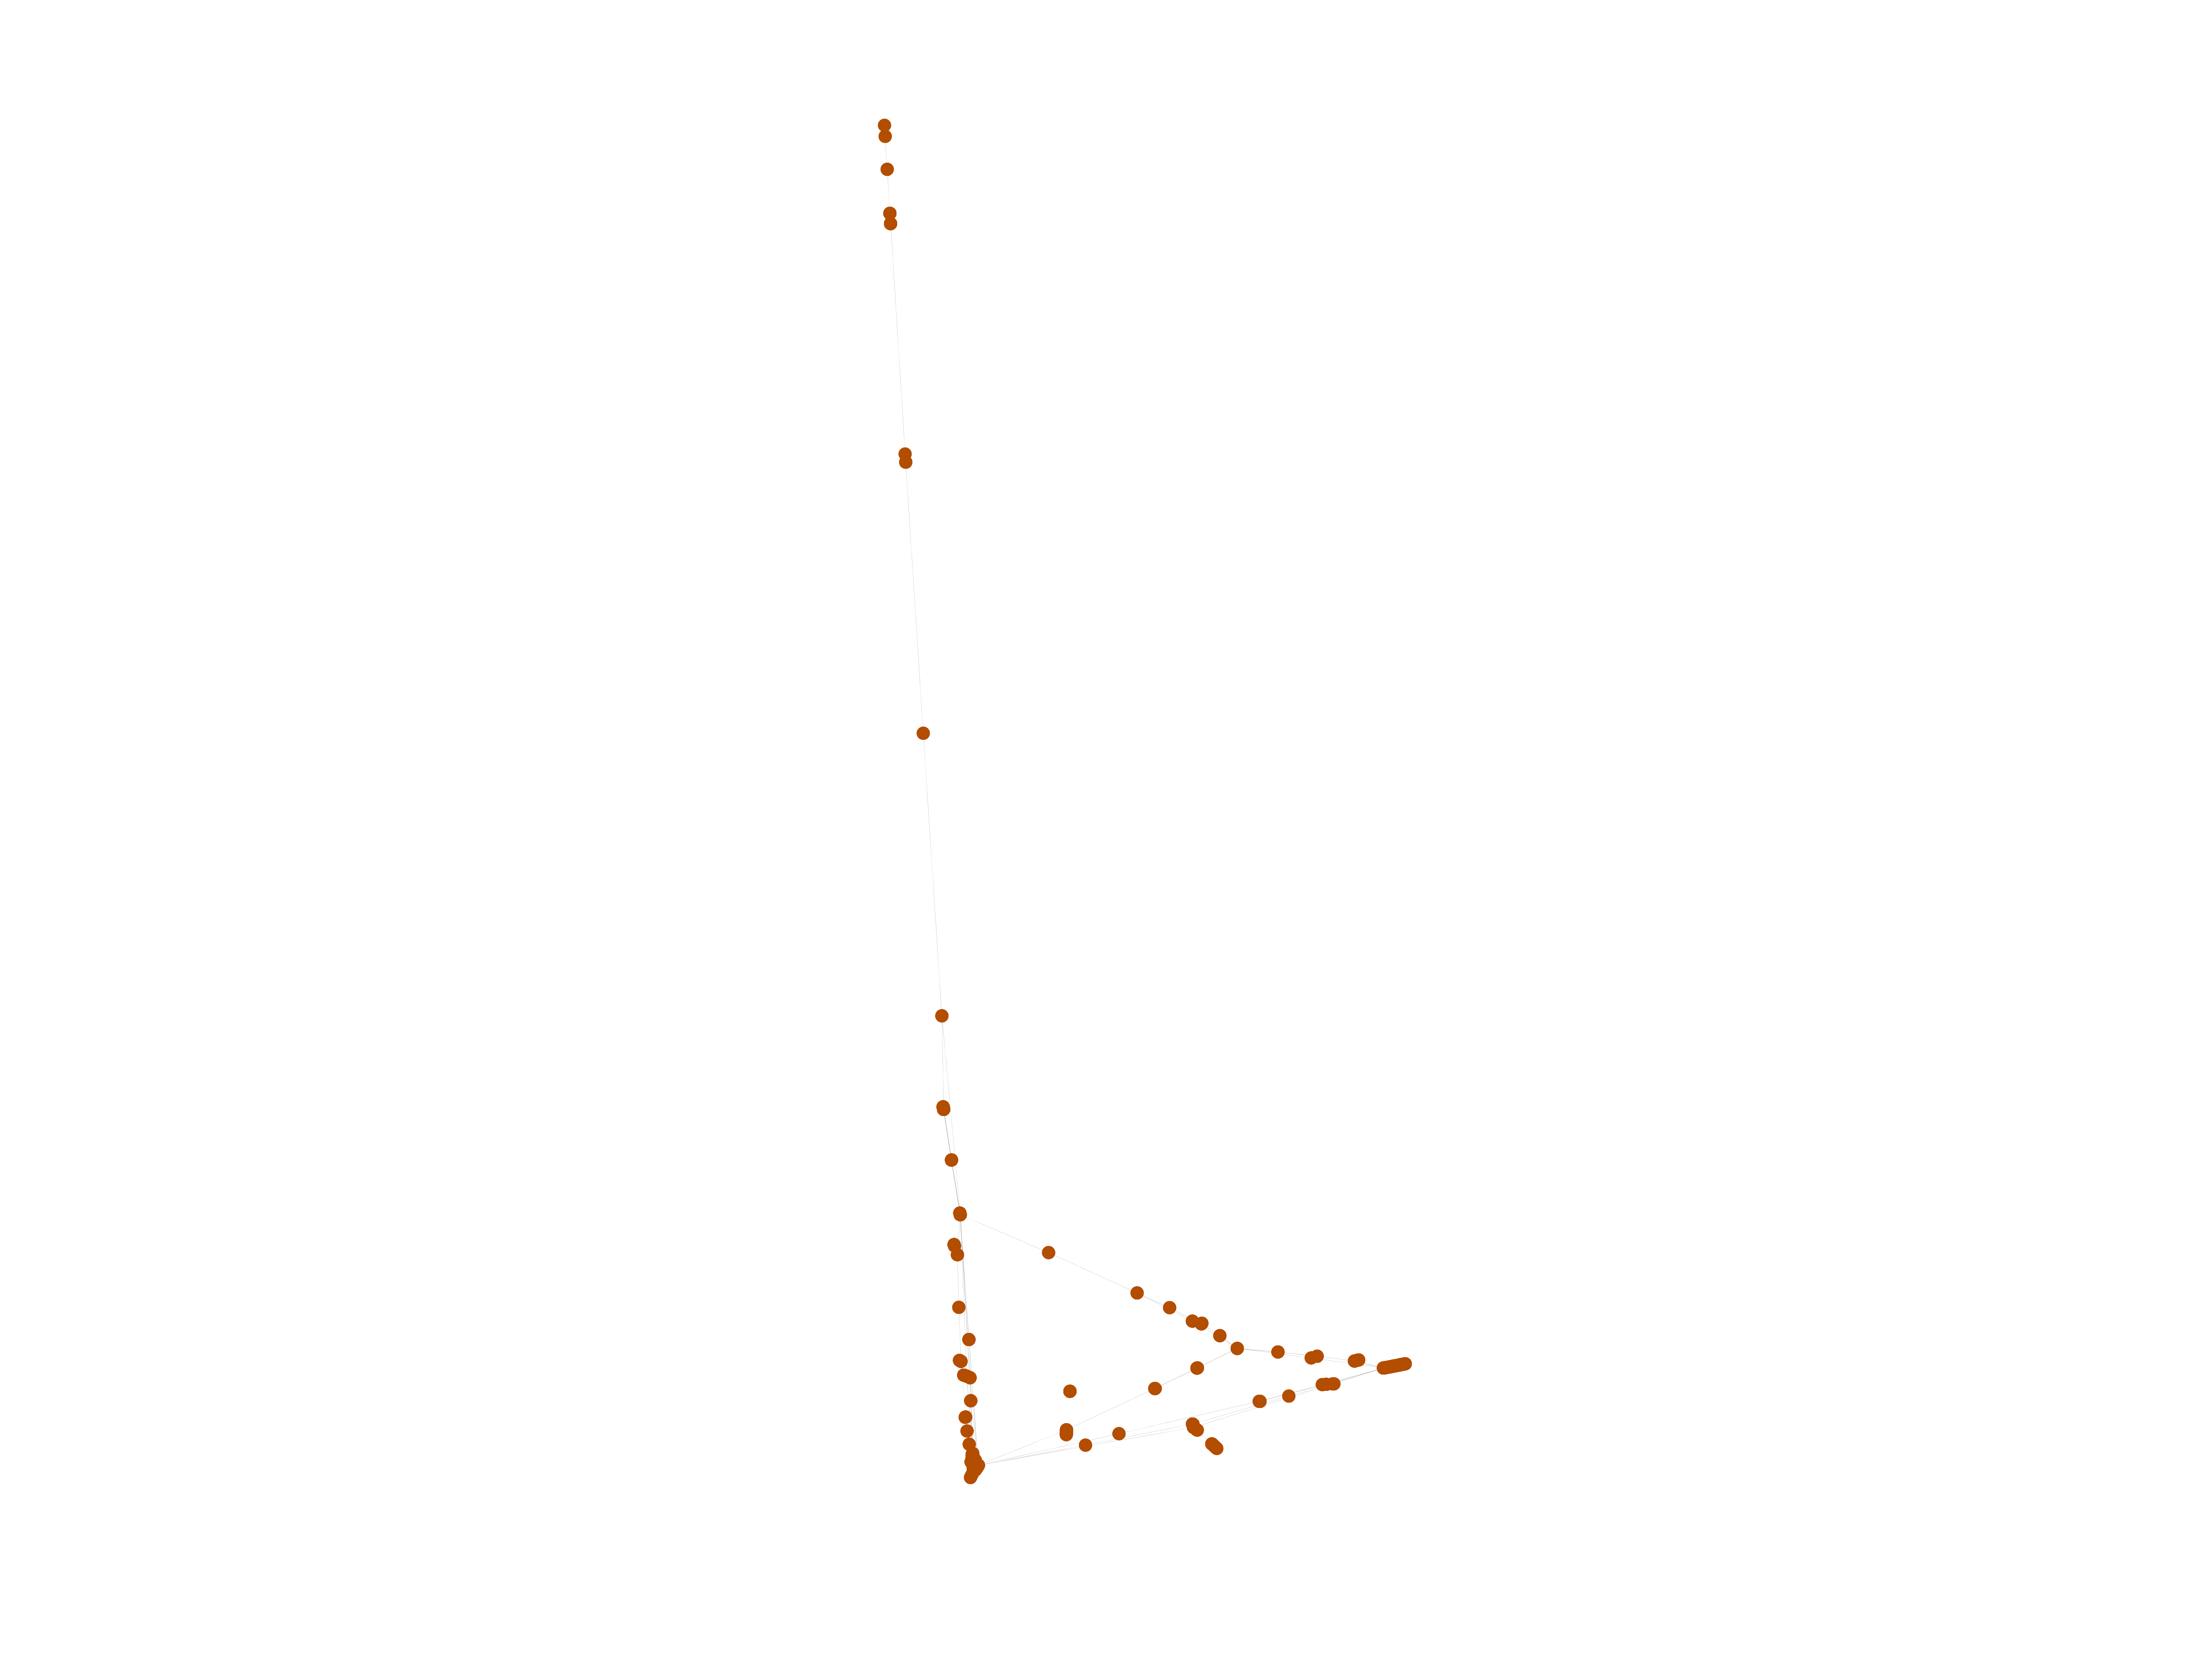
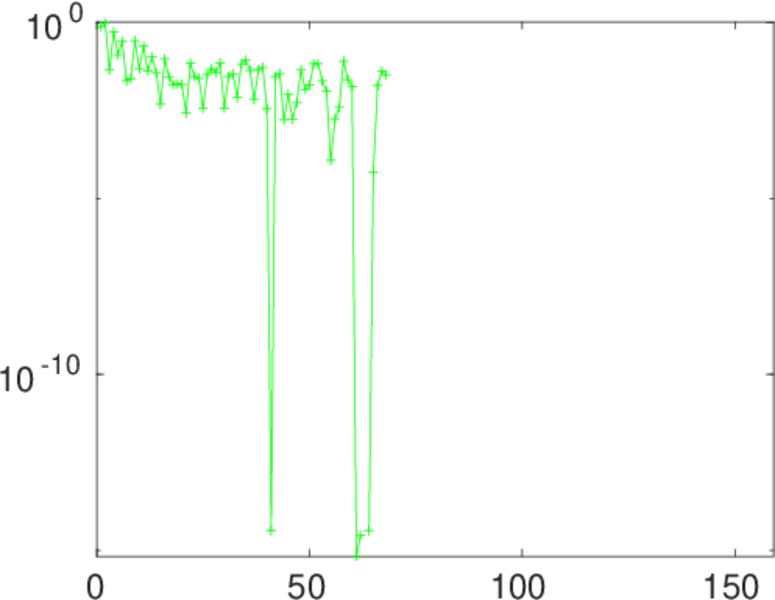
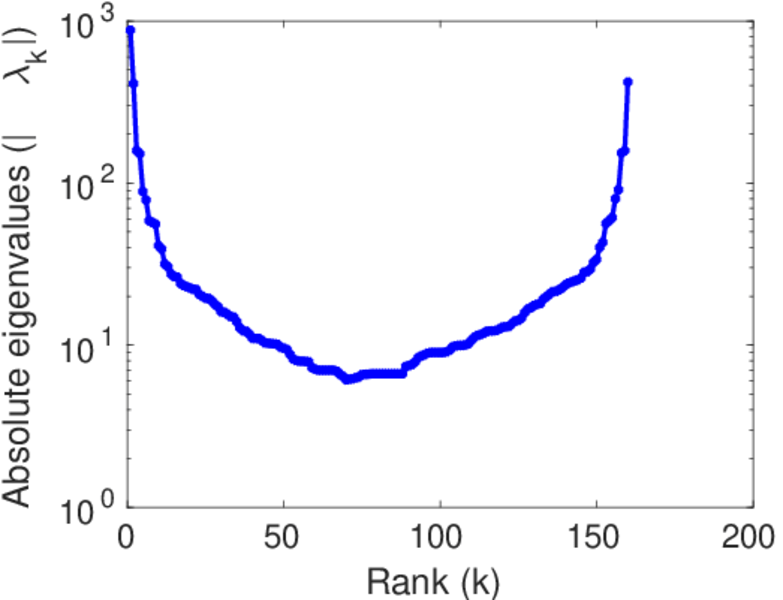
Matrix decompositions plots


Downloads
References
|
[1]
|
Jérôme Kunegis.
KONECT – The Koblenz Network Collection.
In Proc. Int. Conf. on World Wide Web Companion, pages
1343–1350, 2013.
[ http ]
|
|
[2]
|
Wikimedia Foundation.
Wikimedia downloads.
http://dumps.wikimedia.org/, January 2010.
|
 KONECT ‣ Networks ‣
Buy Me a Coffee
KONECT ‣ Networks ‣
Buy Me a Coffee