Wikipedia edits (to)
This is the bipartite edit network of the Tongan Wikipedia. It contains users
and pages from the Tongan Wikipedia, connected by edit events. Each edge
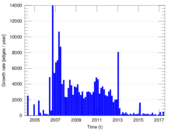
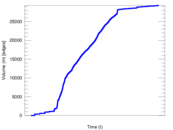
represents an edit. The dataset includes the timestamp of each edit.
Metadata
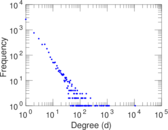
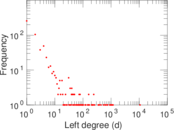
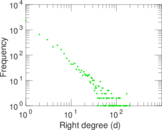
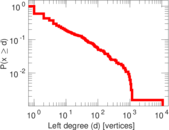
Statistics
| Size | n = | 5,581
|
| Left size | n1 = | 640
|
| Right size | n2 = | 4,941
|
| Volume | m = | 29,298
|
| Unique edge count | m̿ = | 13,317
|
| Wedge count | s = | 8,474,302
|
| Claw count | z = | 9,838,065,480
|
| Cross count | x = | 9,457,681,693,133
|
| Square count | q = | 3,069,407
|
| 4-Tour count | T4 = | 58,495,866
|
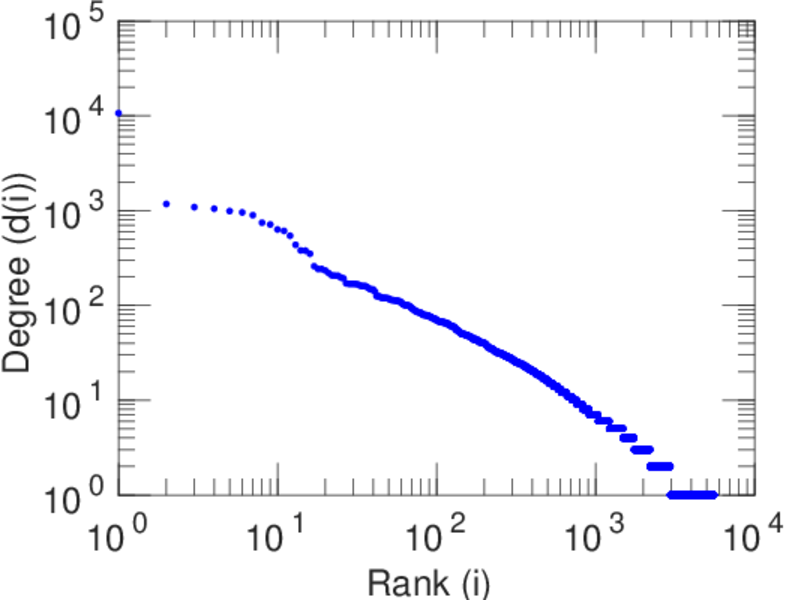
| Maximum degree | dmax = | 10,668
|
| Maximum left degree | d1max = | 10,668
|
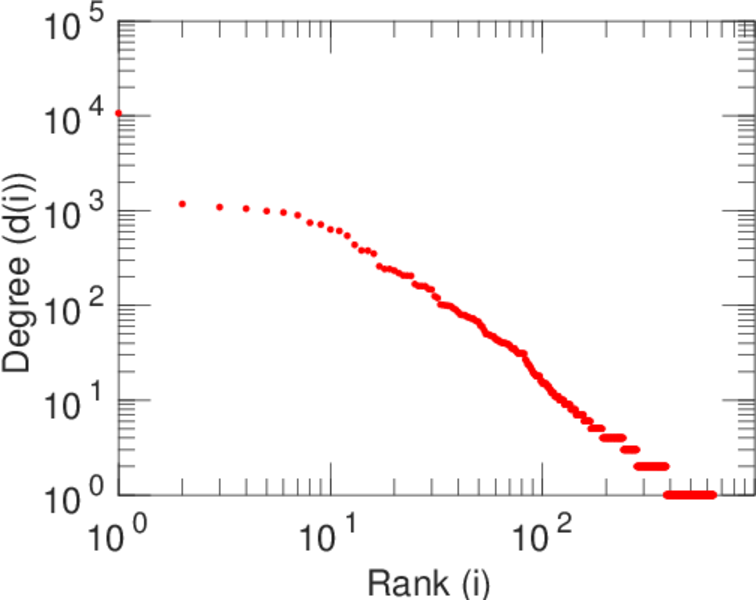
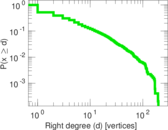
| Maximum right degree | d2max = | 197
|
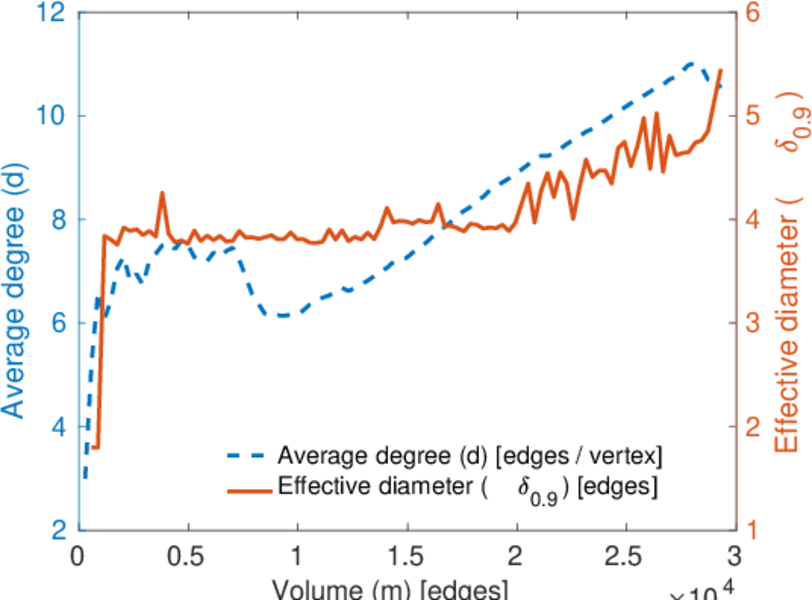
| Average degree | d = | 10.499 2
|
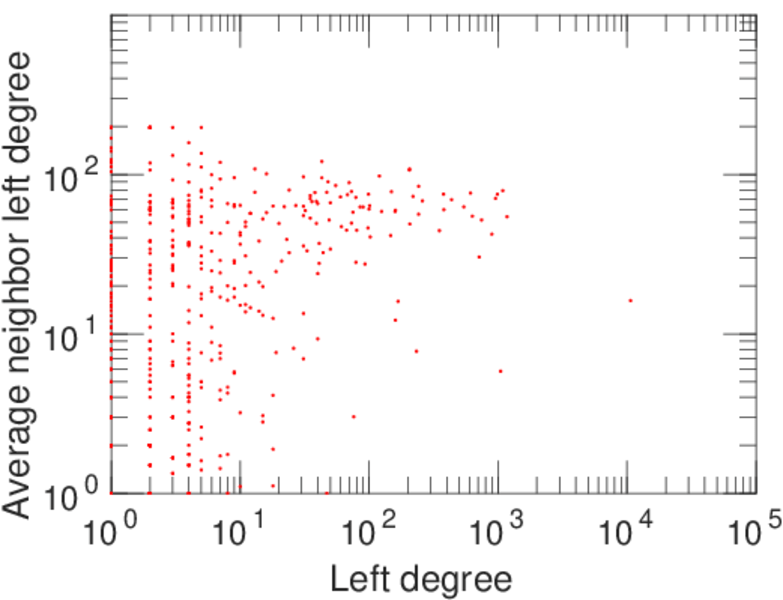
| Average left degree | d1 = | 45.778 1
|
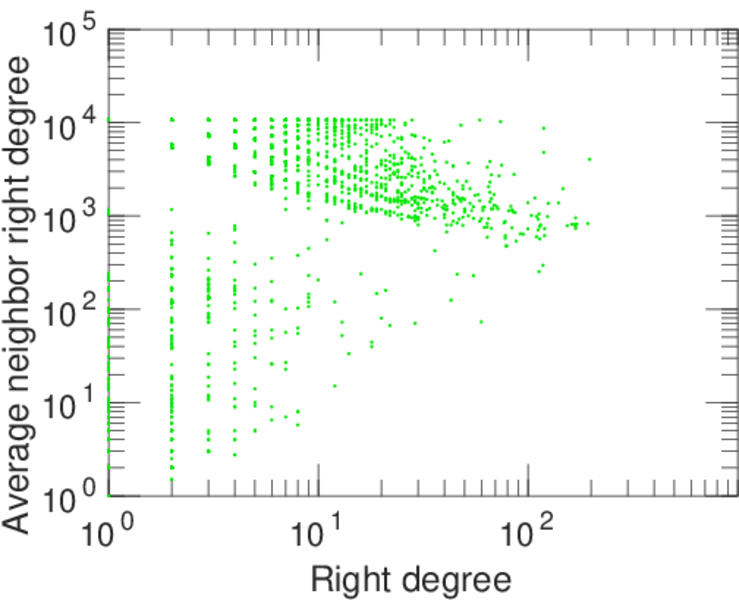
| Average right degree | d2 = | 5.929 57
|
| Fill | p = | 0.004 211 26
|
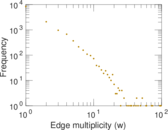
| Average edge multiplicity | m̃ = | 2.200 05
|
| Size of LCC | N = | 5,025
|
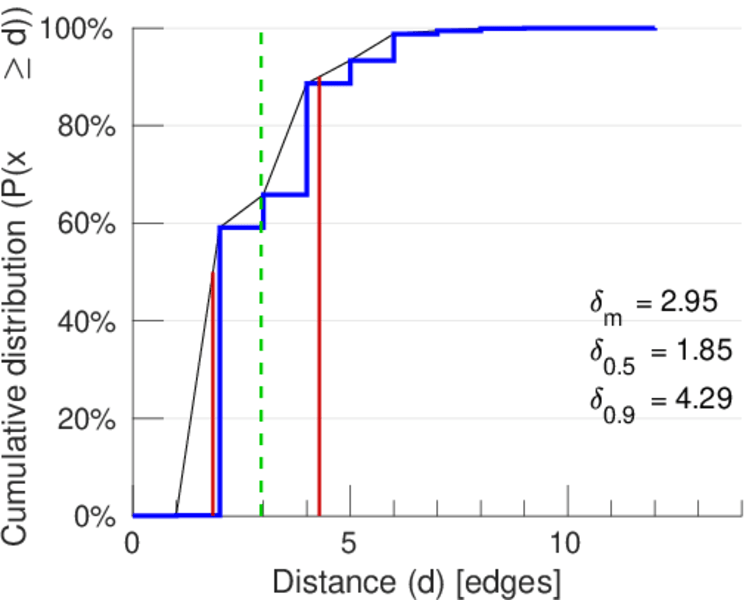
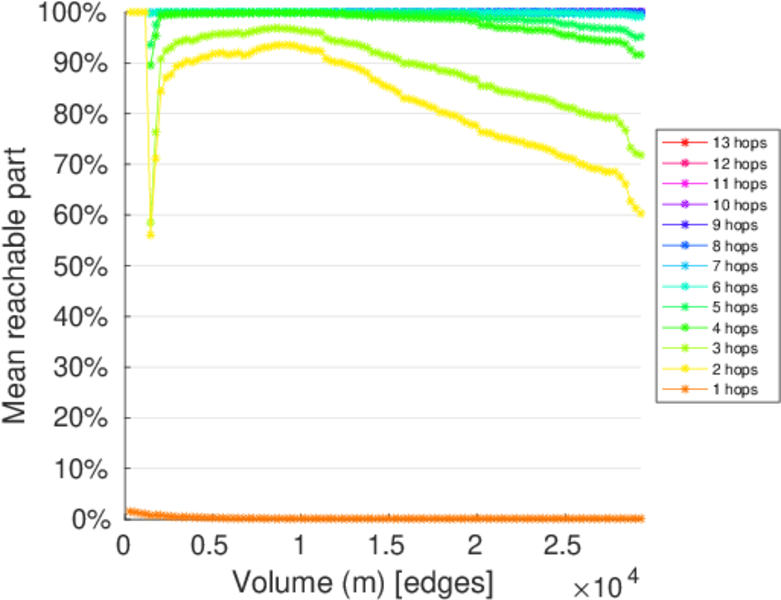
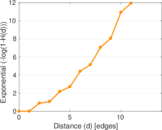
| Diameter | δ = | 13
|
| 50-Percentile effective diameter | δ0.5 = | 1.845 59
|
| 90-Percentile effective diameter | δ0.9 = | 4.292 39
|
| Median distance | δM = | 2
|
| Mean distance | δm = | 2.949 37
|
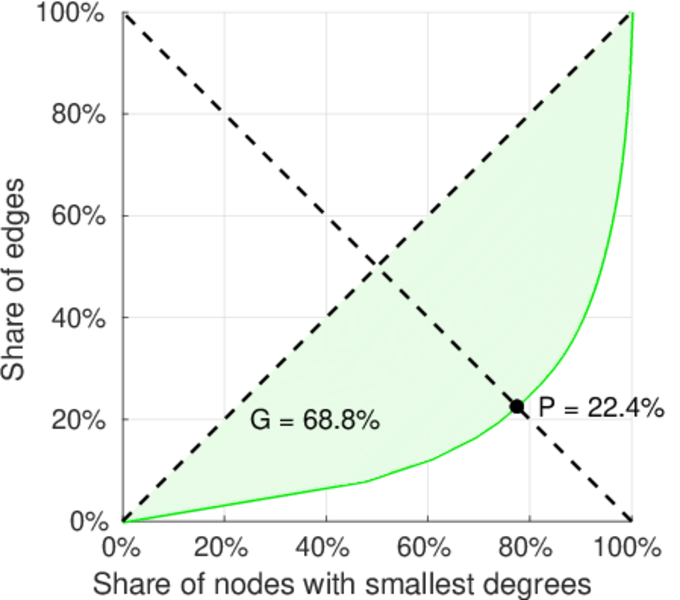
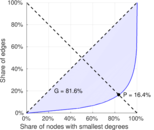
| Gini coefficient | G = | 0.820 451
|
| Balanced inequality ratio | P = | 0.164 841
|
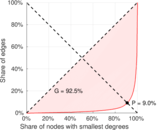
| Left balanced inequality ratio | P1 = | 0.089 664 8
|
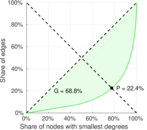
| Right balanced inequality ratio | P2 = | 0.223 735
|
| Relative edge distribution entropy | Her = | 0.752 621
|
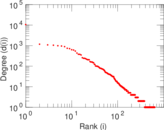
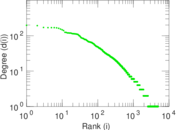
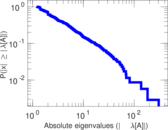
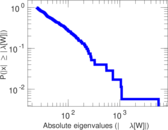
| Power law exponent | γ = | 3.076 43
|
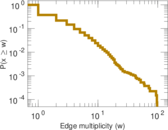
| Tail power law exponent | γt = | 2.111 00
|
| Tail power law exponent with p | γ3 = | 2.111 00
|
| p-value | p = | 0.000 00
|
| Left tail power law exponent with p | γ3,1 = | 1.671 00
|
| Left p-value | p1 = | 0.082 000 0
|
| Right tail power law exponent with p | γ3,2 = | 2.221 00
|
| Right p-value | p2 = | 0.000 00
|
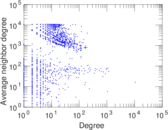
| Degree assortativity | ρ = | −0.501 250
|
| Degree assortativity p-value | pρ = | 0.000 00
|
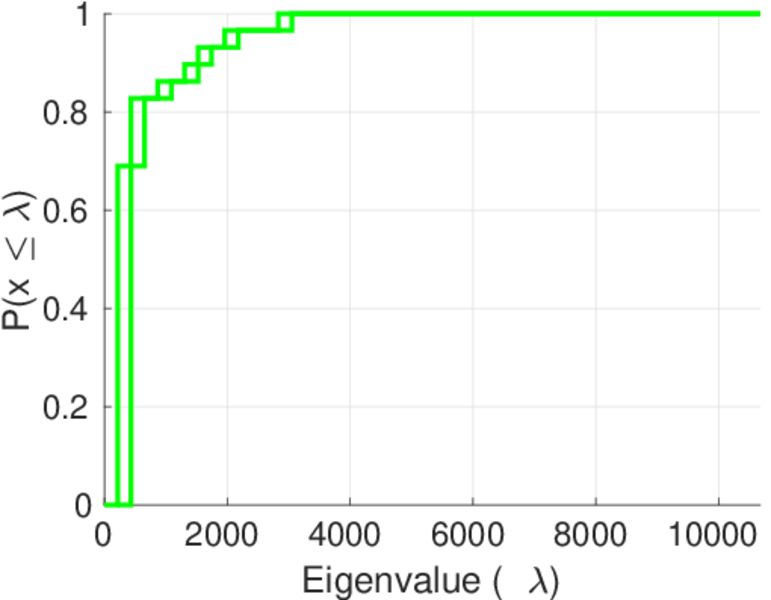
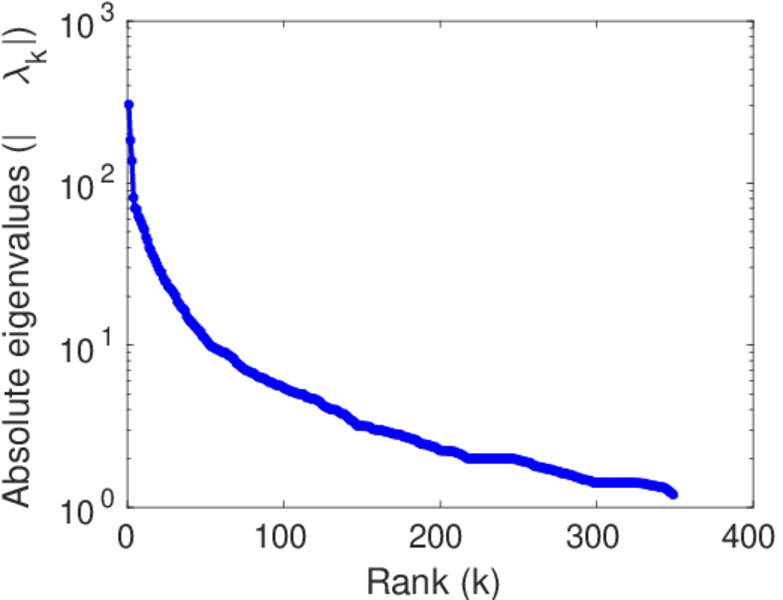
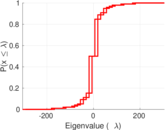
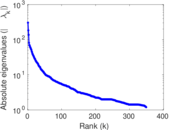
| Spectral norm | α = | 304.834
|
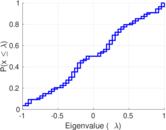
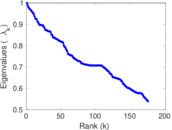
| Algebraic connectivity | a = | 0.021 616 6
|
| Spectral separation | |λ1[A] / λ2[A]| = | 1.659 78
|
| Controllability | C = | 4,348
|
| Relative controllability | Cr = | 0.782 296
|
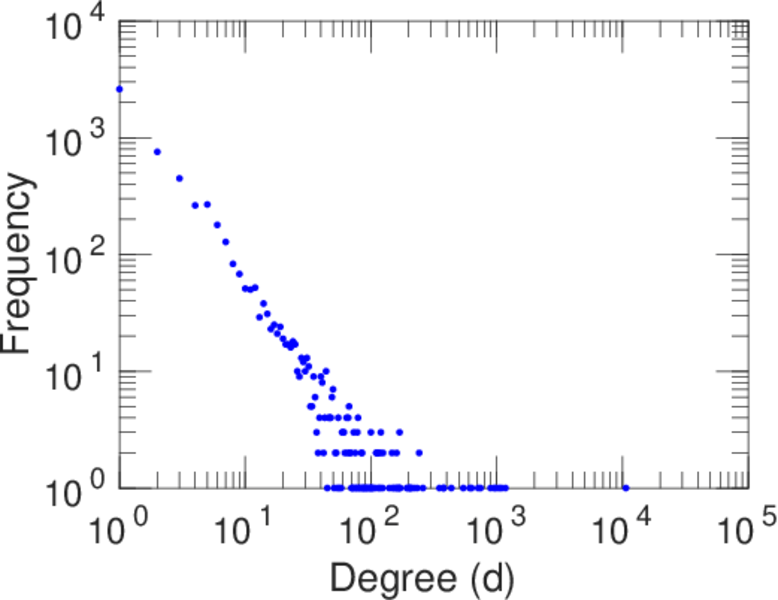
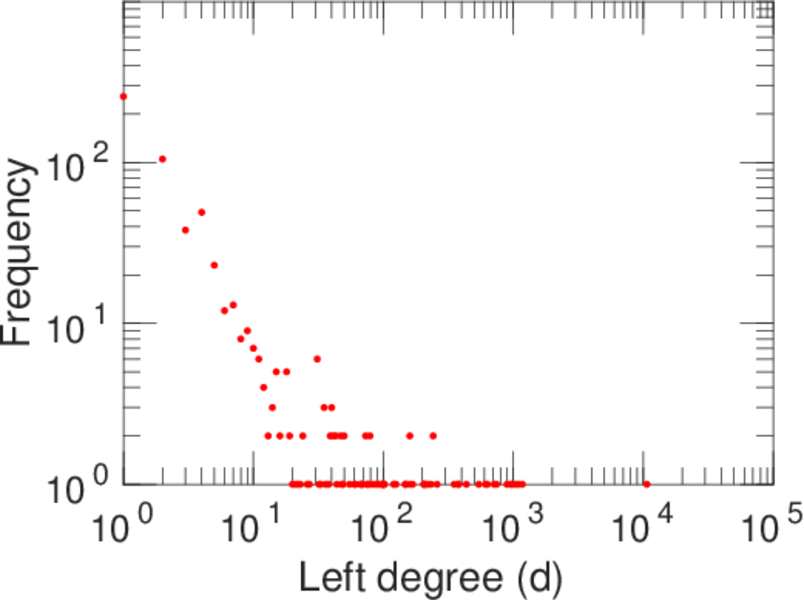
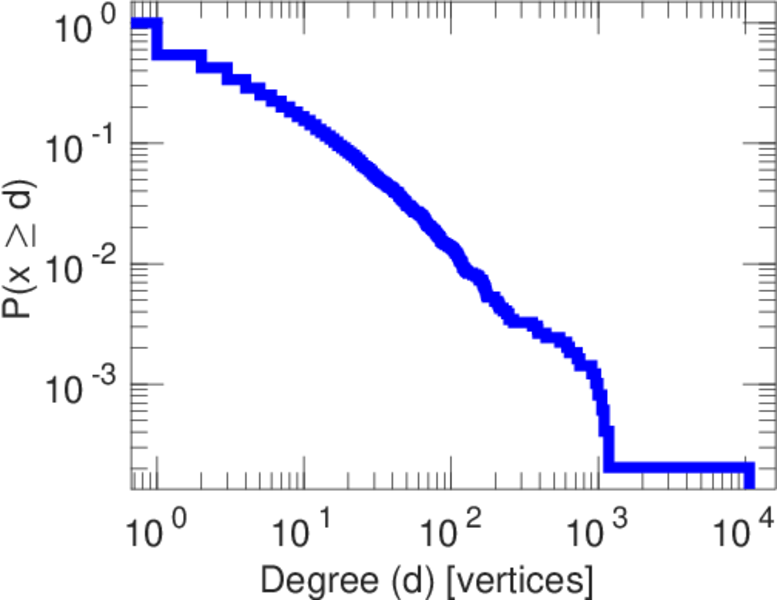
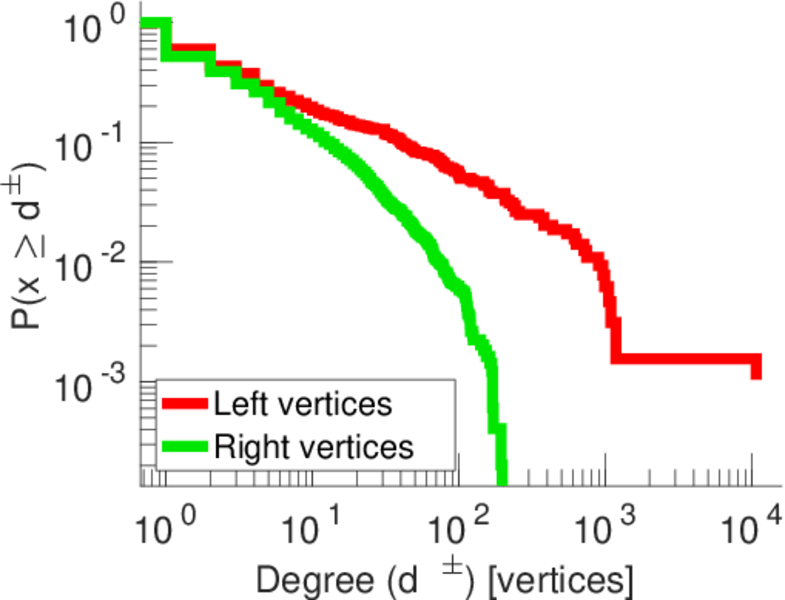
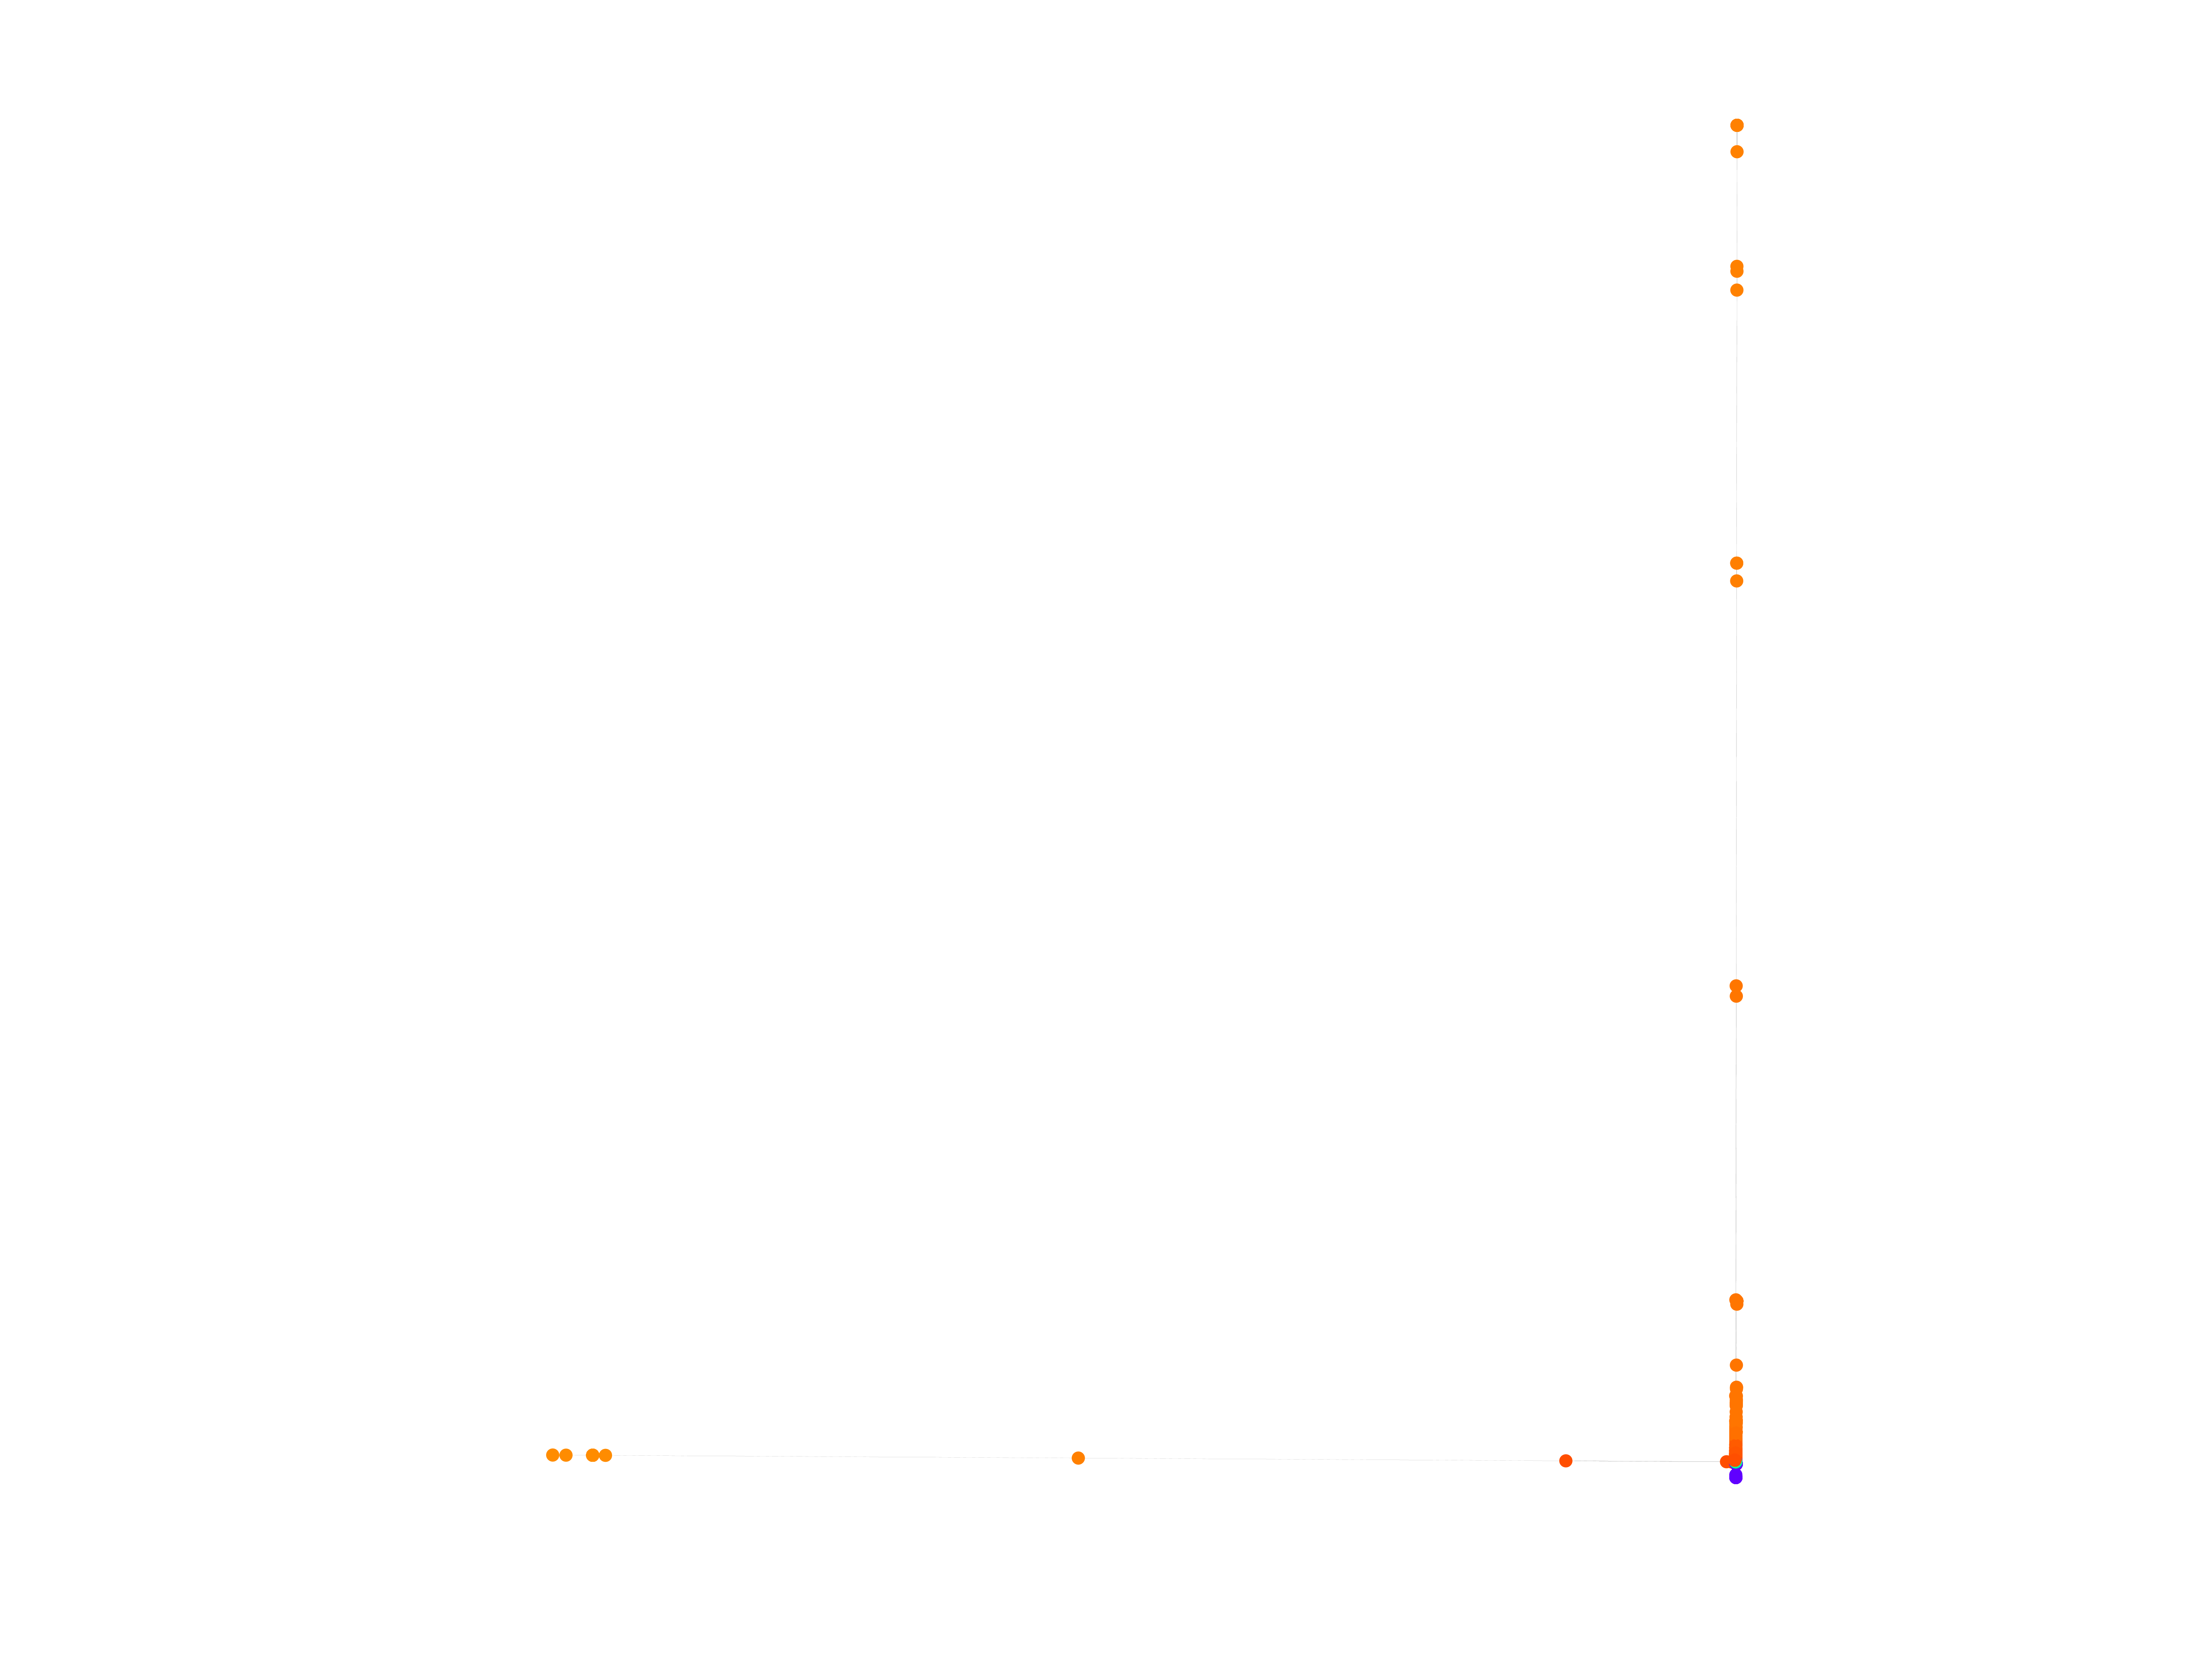
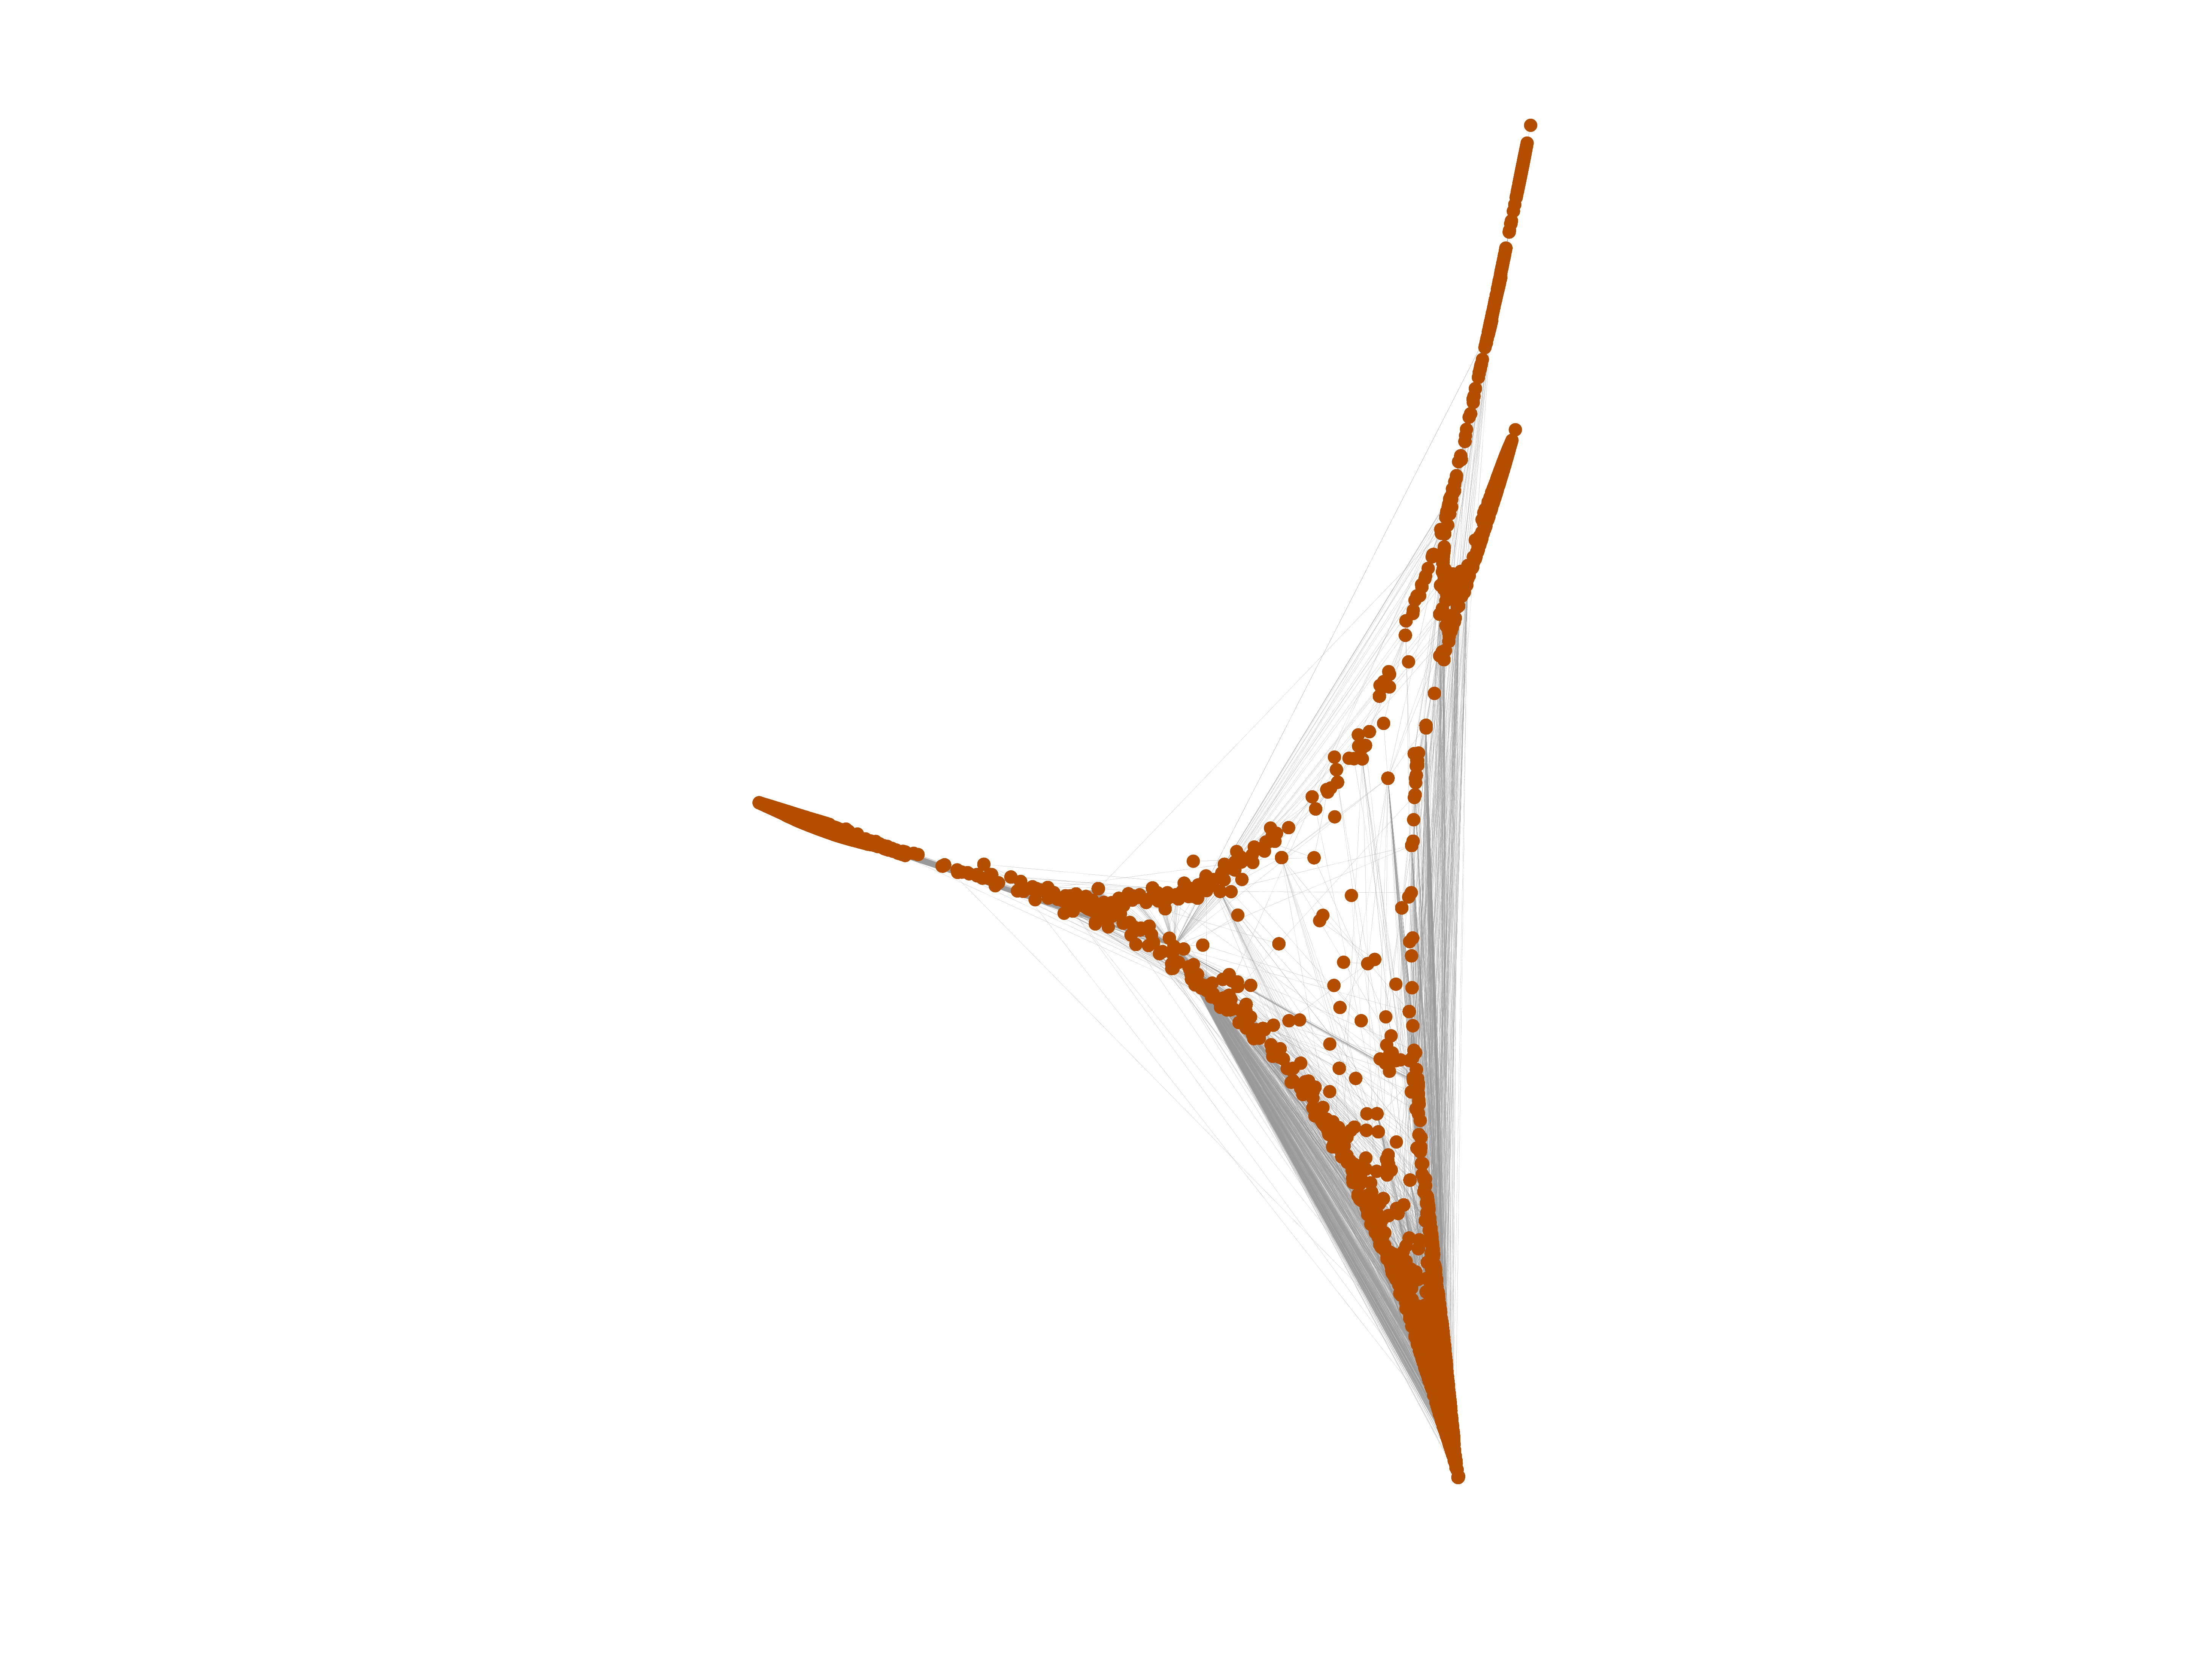
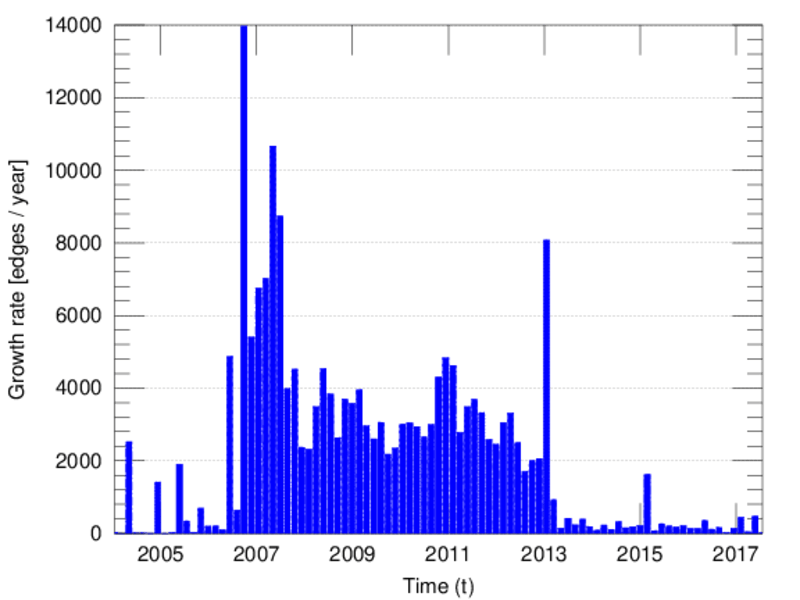
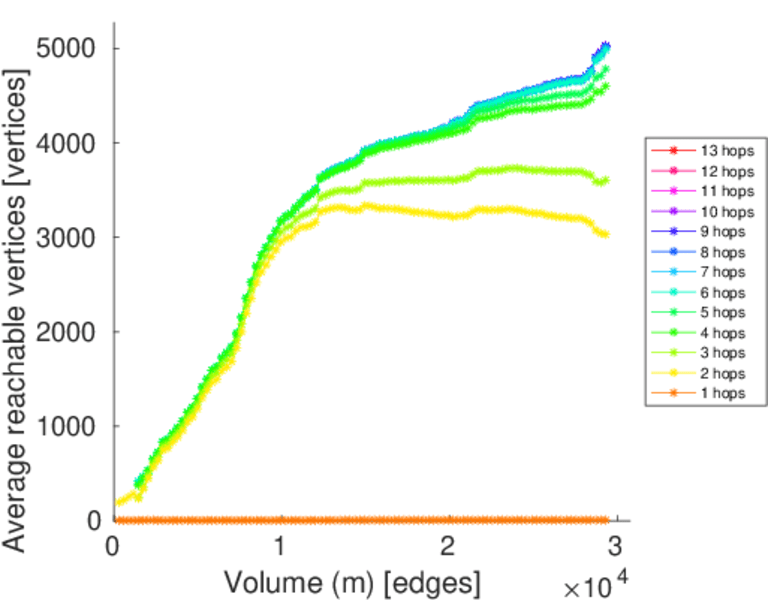
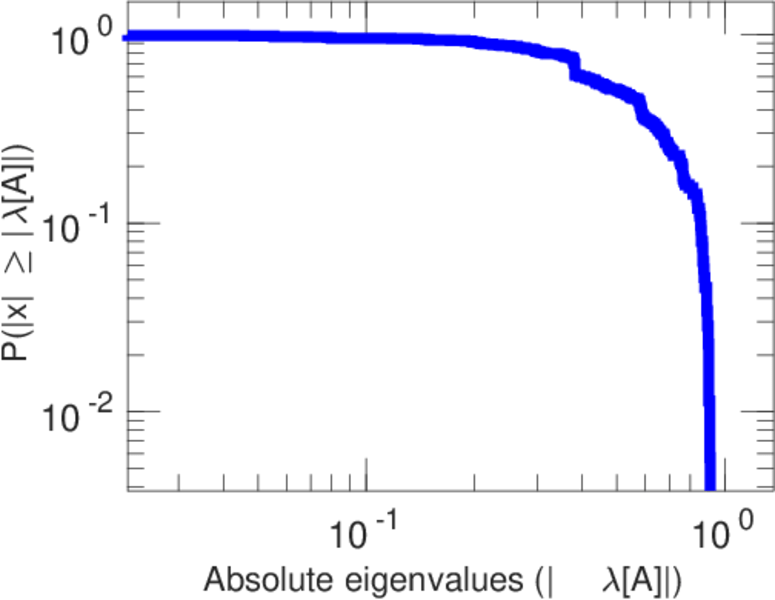
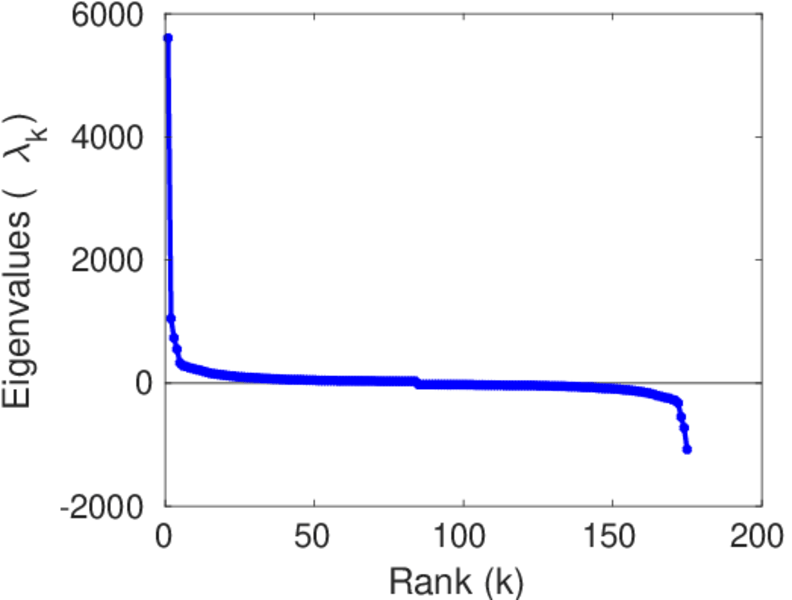
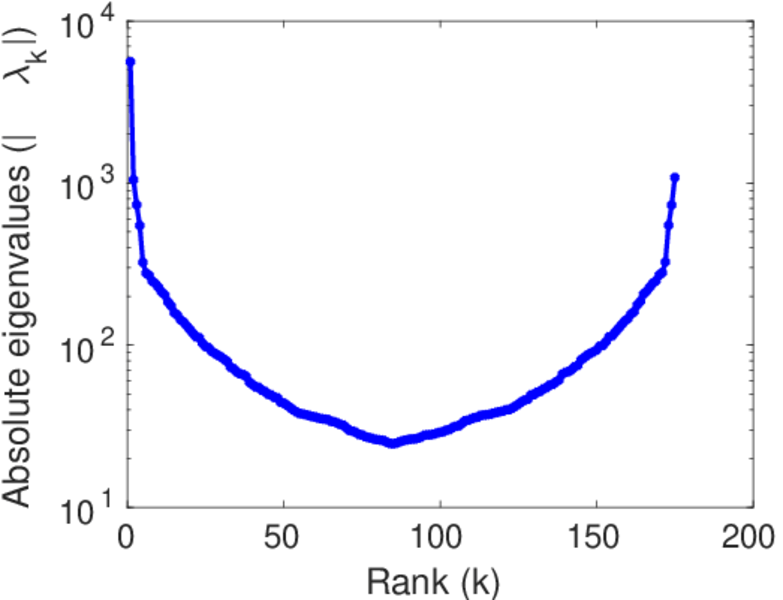
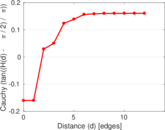
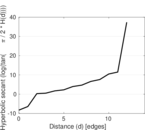
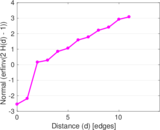
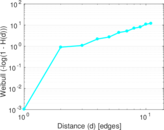
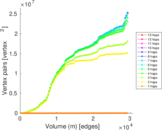
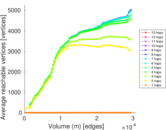
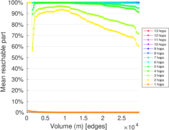
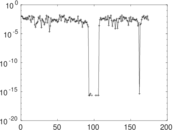
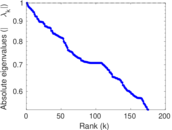
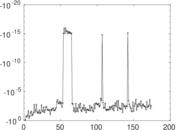
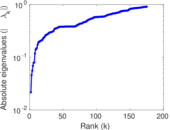
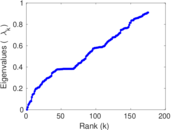
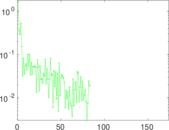
Plots


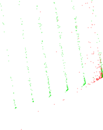
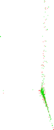


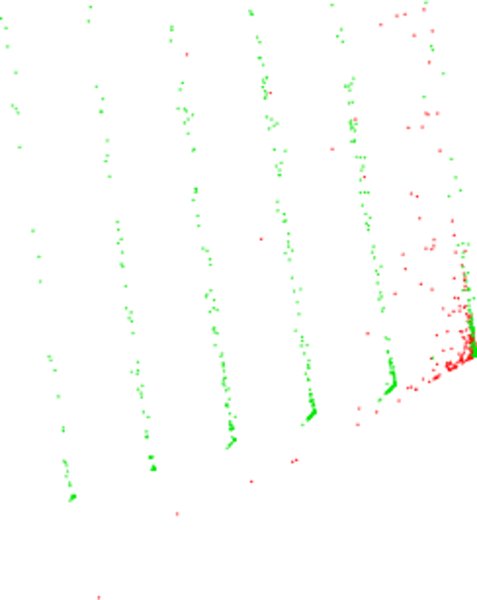
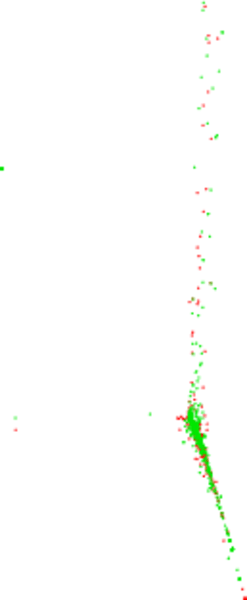
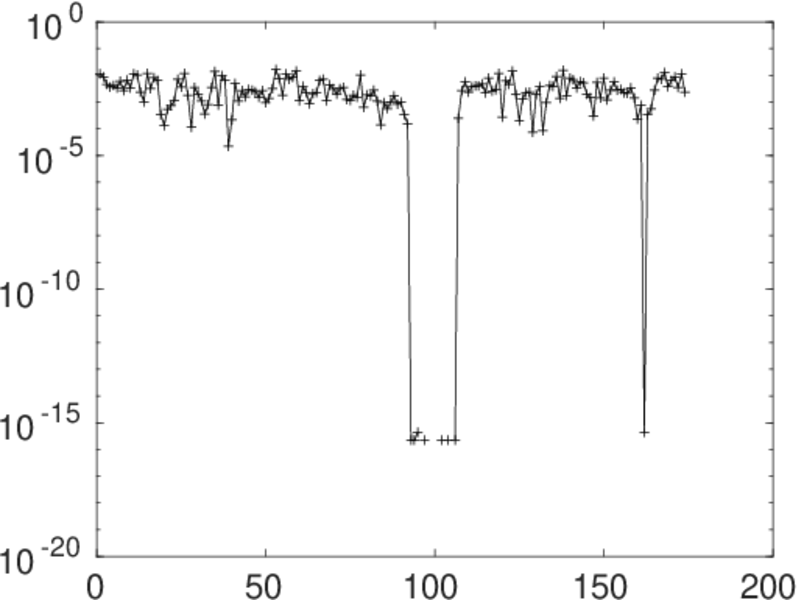
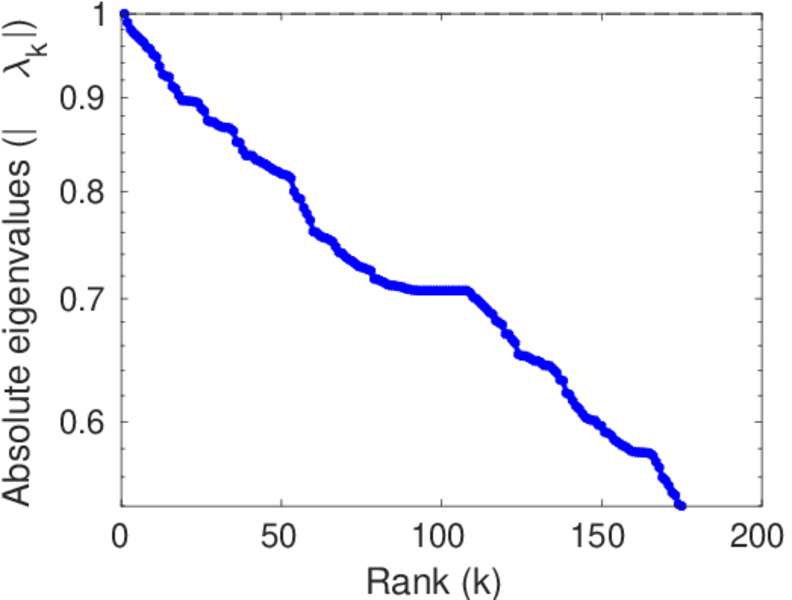
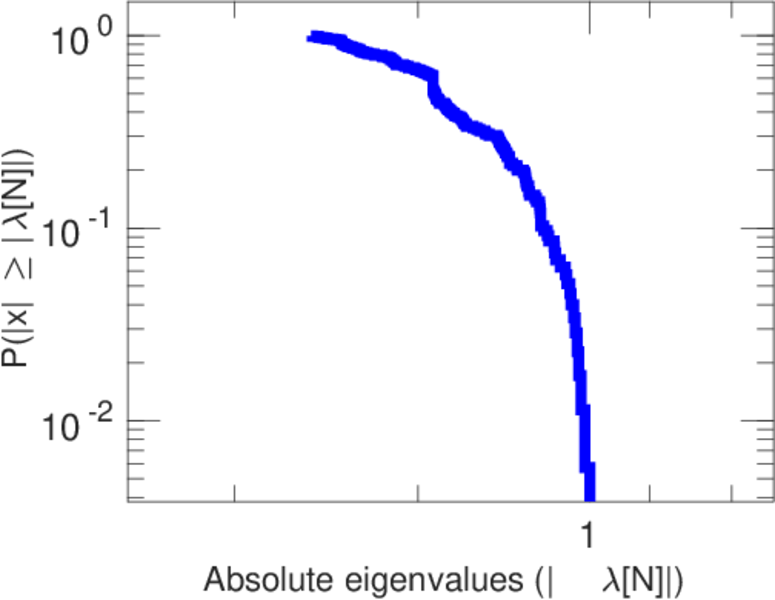
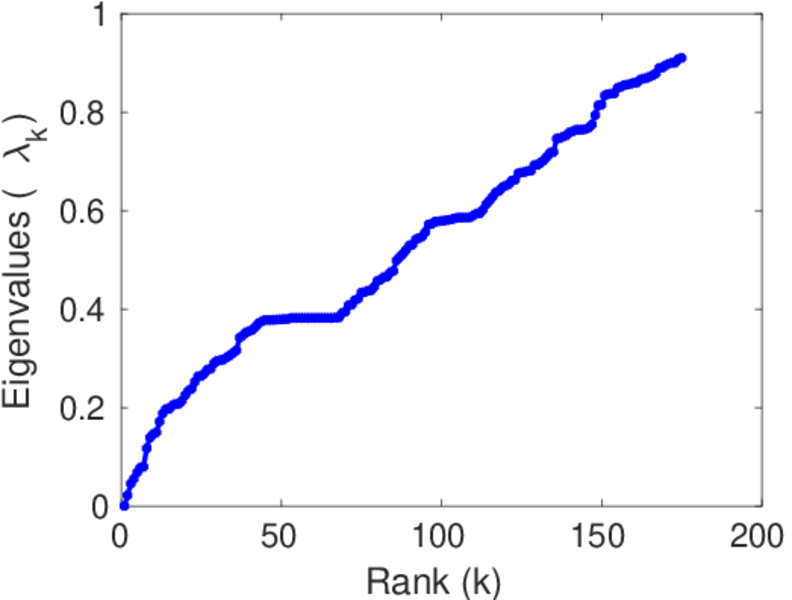
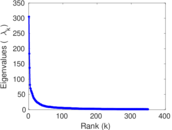
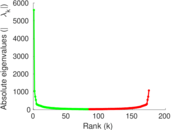
Matrix decompositions plots


Downloads
References
|
[1]
|
Jérôme Kunegis.
KONECT – The Koblenz Network Collection.
In Proc. Int. Conf. on World Wide Web Companion, pages
1343–1350, 2013.
[ http ]
|
|
[2]
|
Wikimedia Foundation.
Wikimedia downloads.
http://dumps.wikimedia.org/, January 2010.
|
 KONECT ‣ Networks ‣
Buy Me a Coffee
KONECT ‣ Networks ‣
Buy Me a Coffee