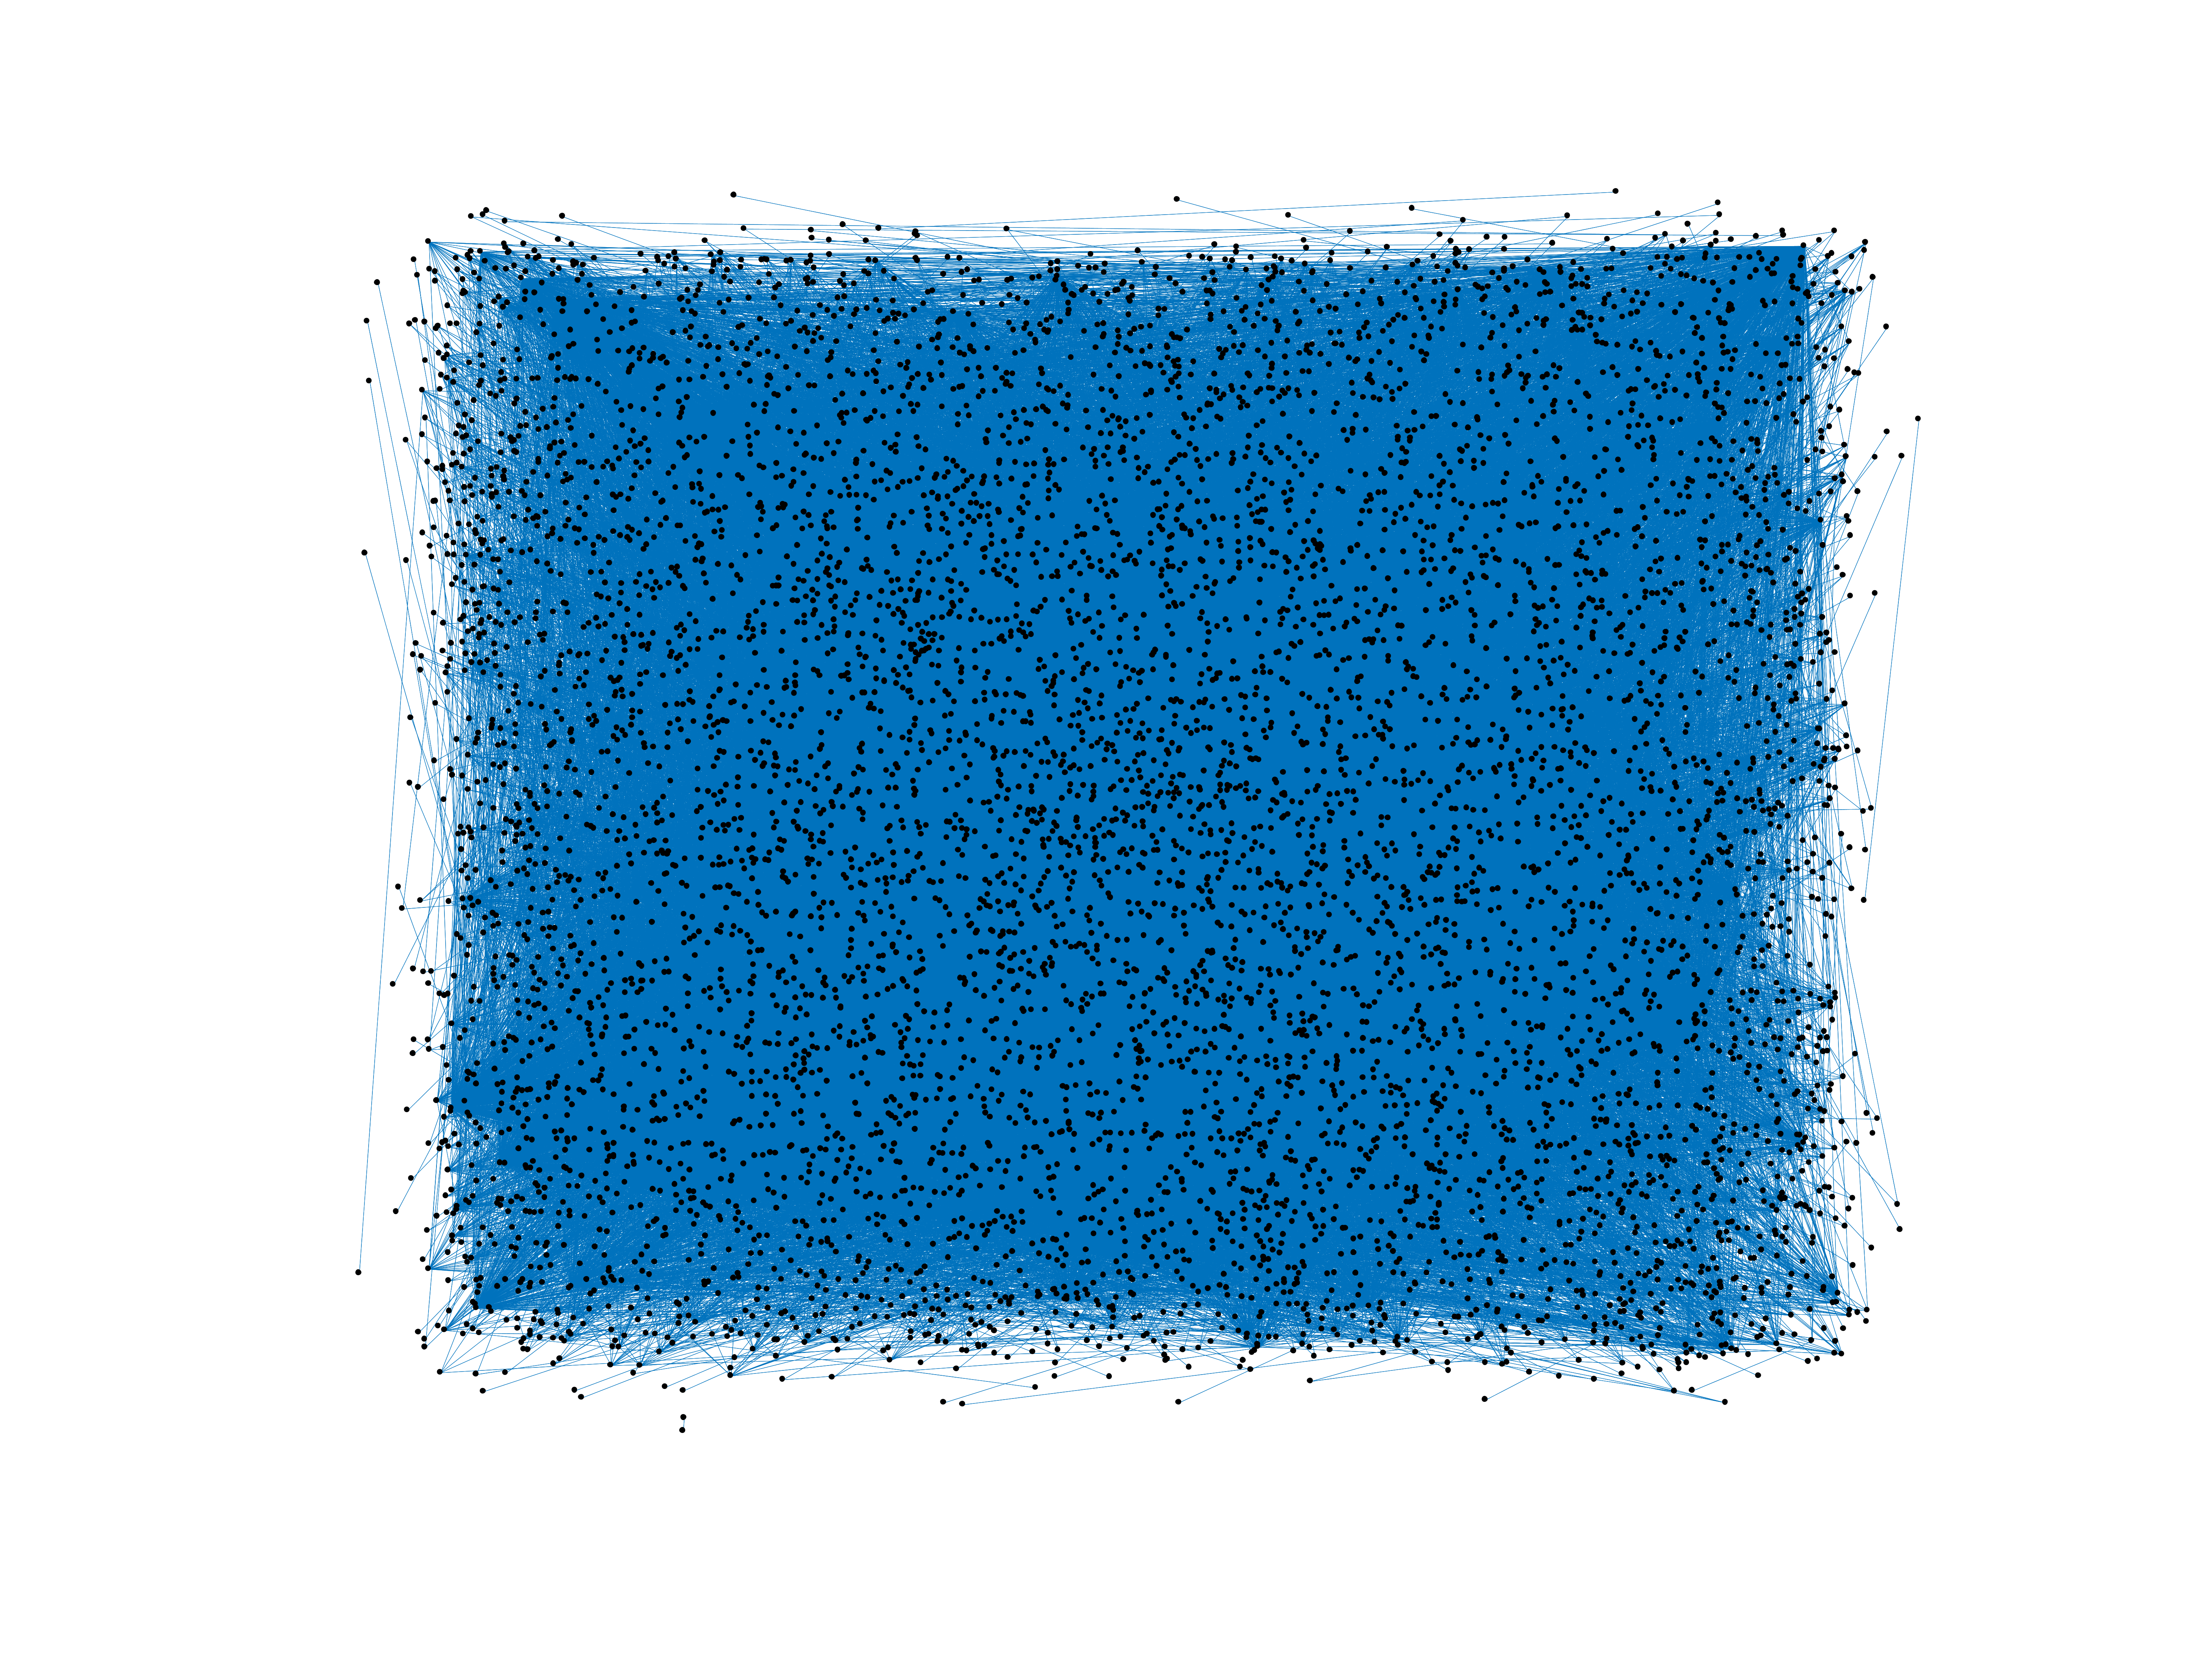
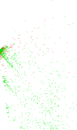
Wikipedia edits (tpi)
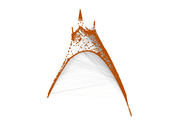
This is the bipartite edit network of the Tok Pisin Wikipedia. It contains
users and pages from the Tok Pisin Wikipedia, connected by edit events. Each
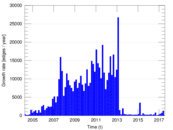
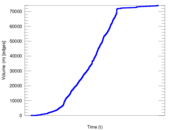
edge represents an edit. The dataset includes the timestamp of each edit.
Metadata
Statistics
| Size | n = | 7,452
|
| Left size | n1 = | 1,966
|
| Right size | n2 = | 5,486
|
| Volume | m = | 74,091
|
| Unique edge count | m̿ = | 34,313
|
| Wedge count | s = | 9,805,739
|
| Claw count | z = | 3,368,235,810
|
| Cross count | x = | 1,094,036,683,241
|
| Square count | q = | 27,393,891
|
| 4-Tour count | T4 = | 258,488,390
|
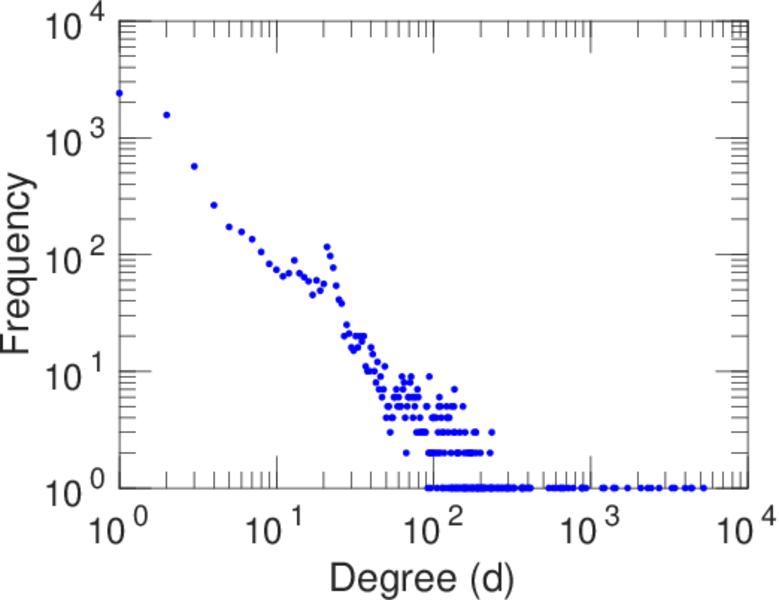
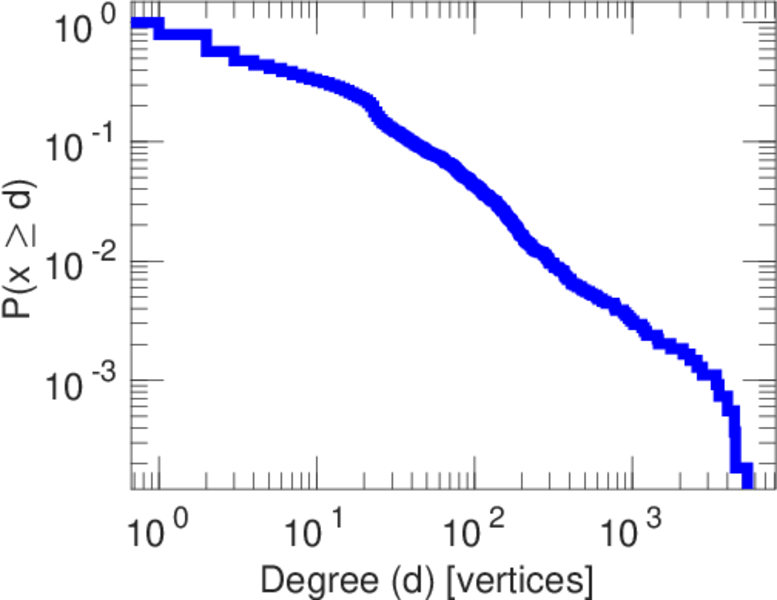
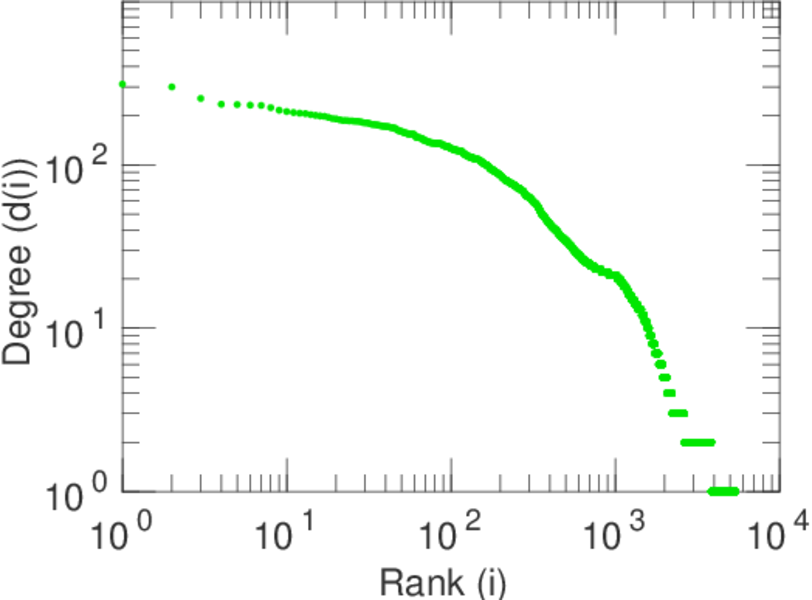
| Maximum degree | dmax = | 5,243
|
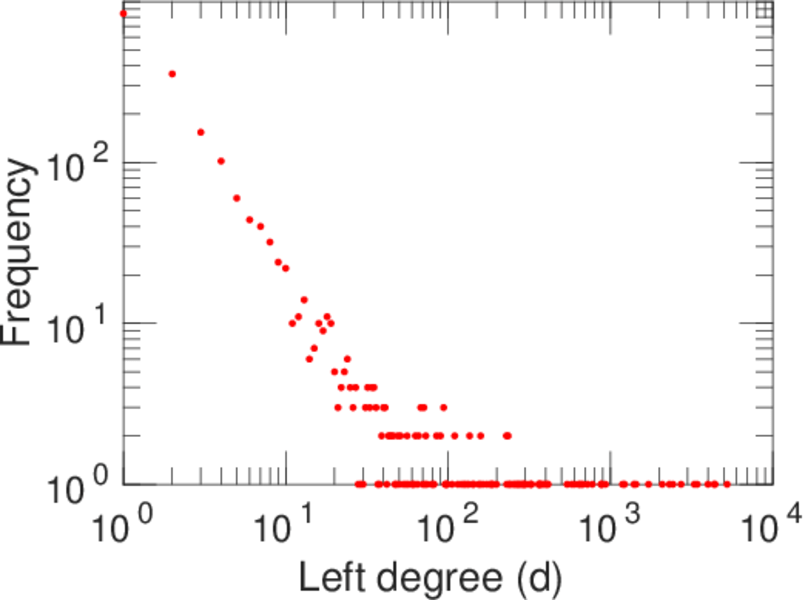
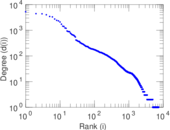
| Maximum left degree | d1max = | 5,243
|
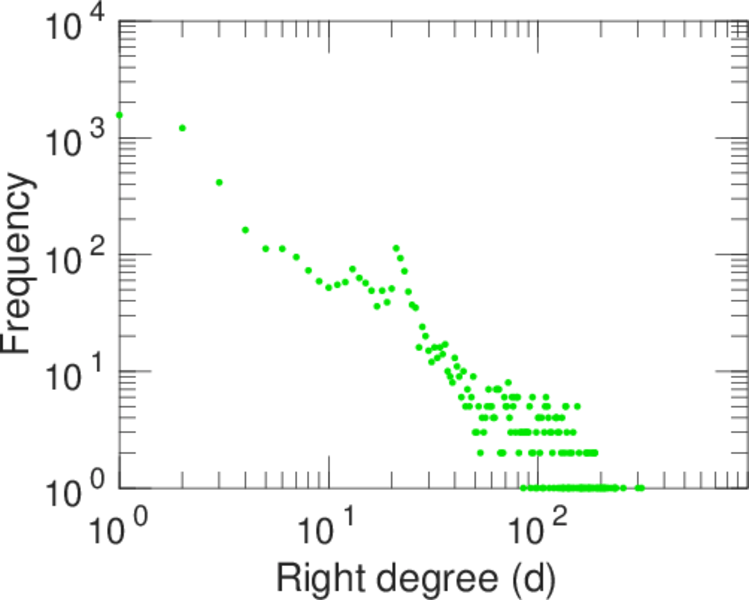
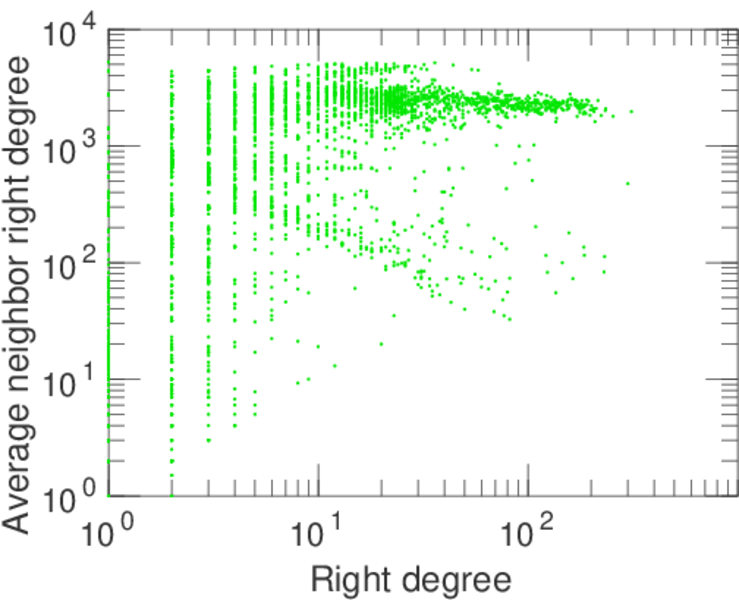
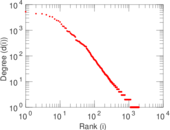
| Maximum right degree | d2max = | 312
|
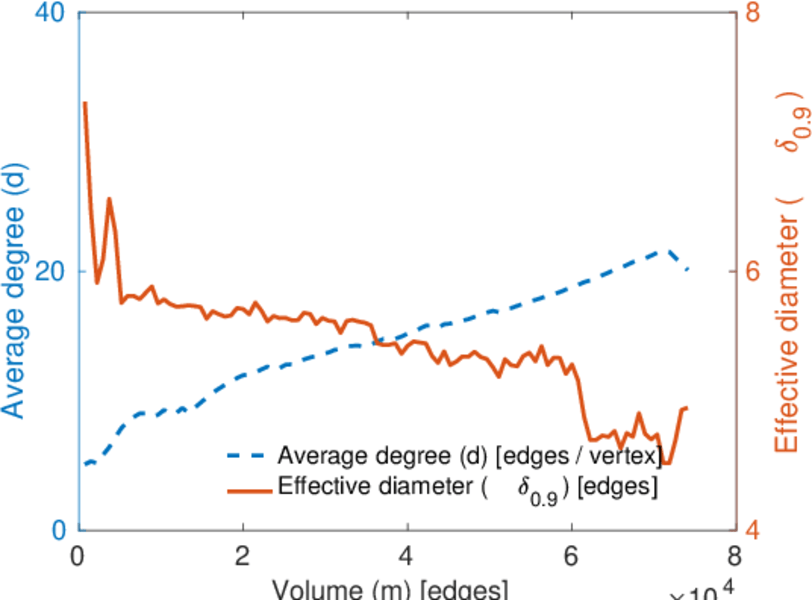
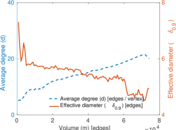
| Average degree | d = | 19.884 9
|
| Average left degree | d1 = | 37.686 2
|
| Average right degree | d2 = | 13.505 5
|
| Fill | p = | 0.003 181 41
|
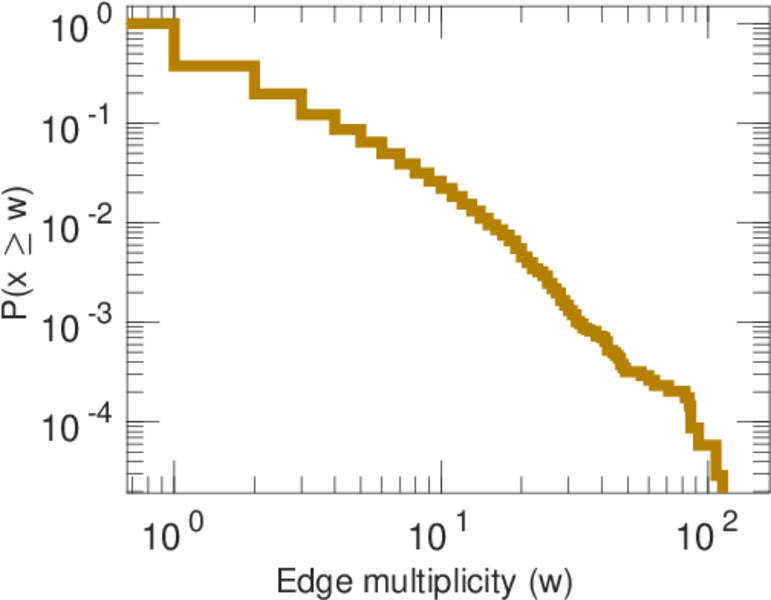
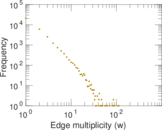
| Average edge multiplicity | m̃ = | 2.159 27
|
| Size of LCC | N = | 6,921
|
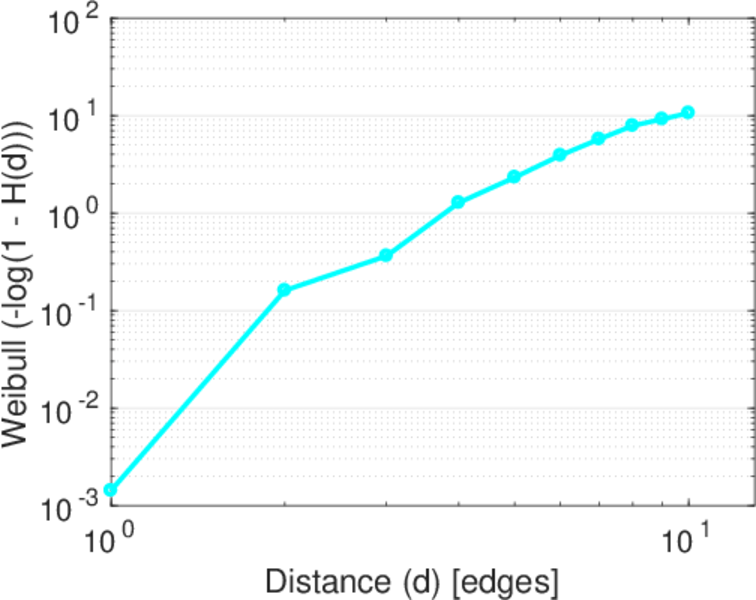
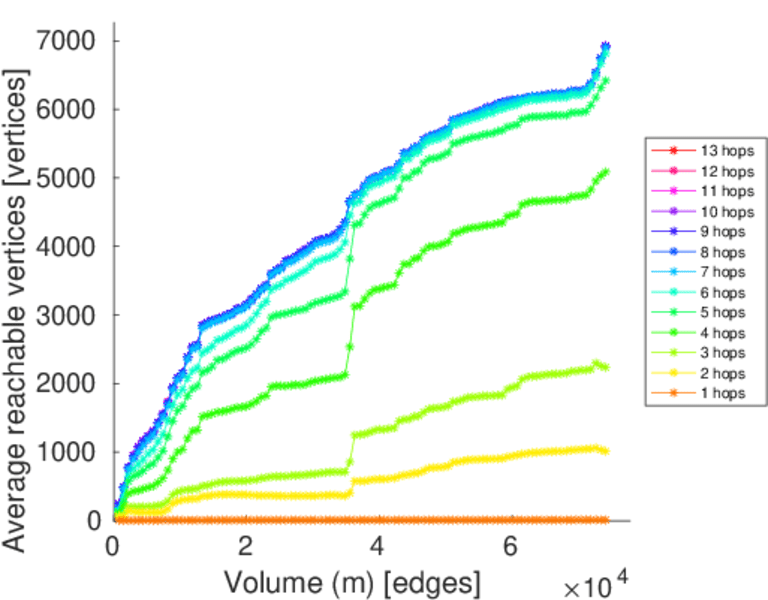
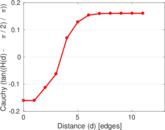
| Diameter | δ = | 13
|
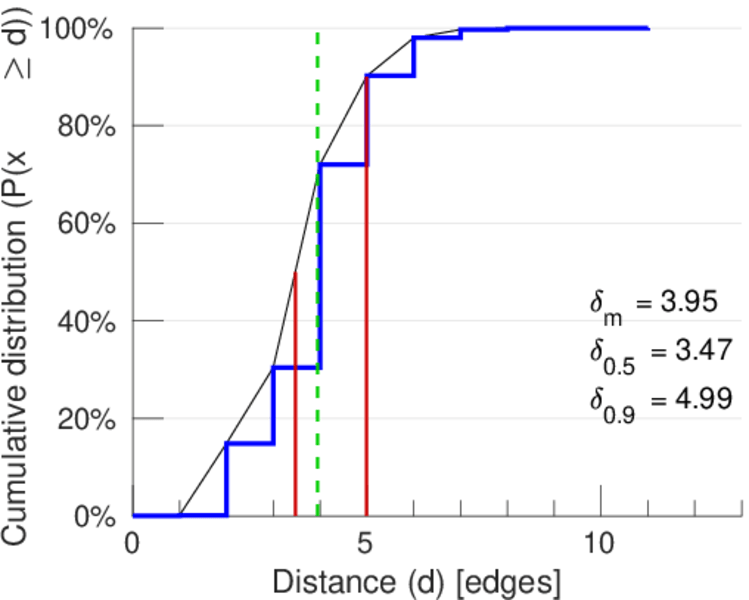
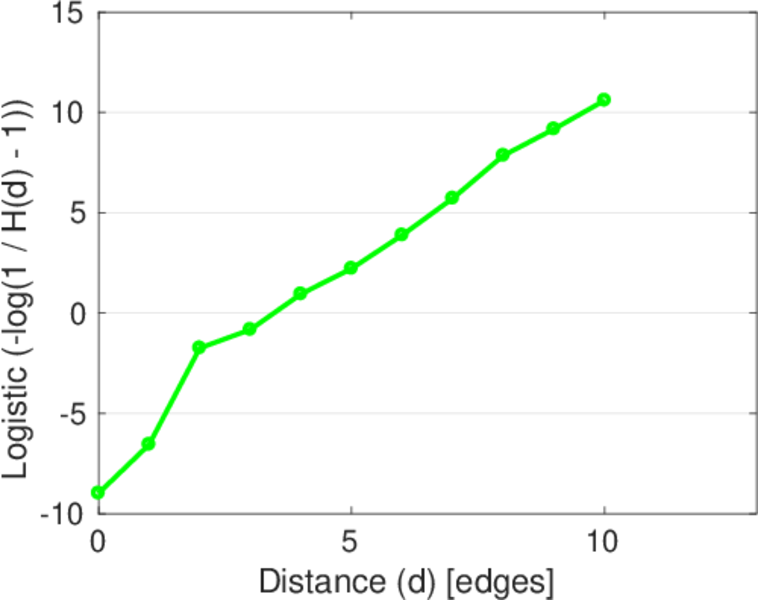
| 50-Percentile effective diameter | δ0.5 = | 3.470 58
|
| 90-Percentile effective diameter | δ0.9 = | 4.989 92
|
| Median distance | δM = | 4
|
| Mean distance | δm = | 3.947 89
|
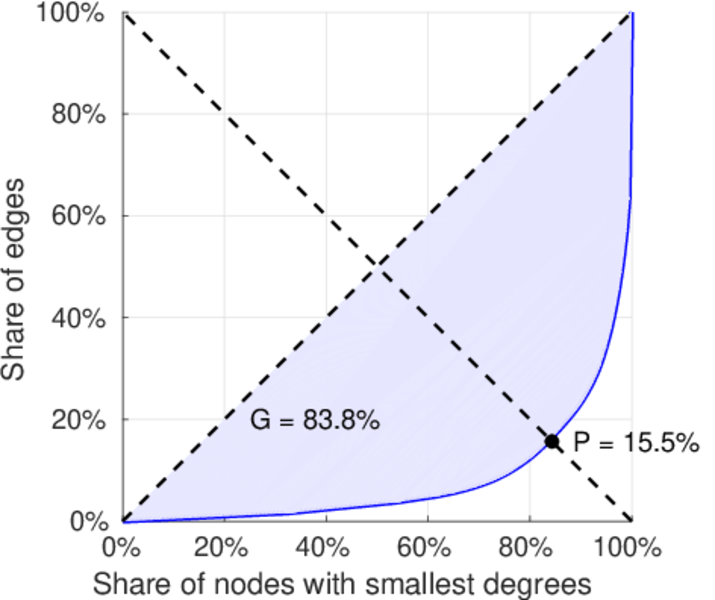
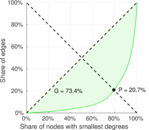
| Gini coefficient | G = | 0.829 102
|
| Balanced inequality ratio | P = | 0.169 211
|
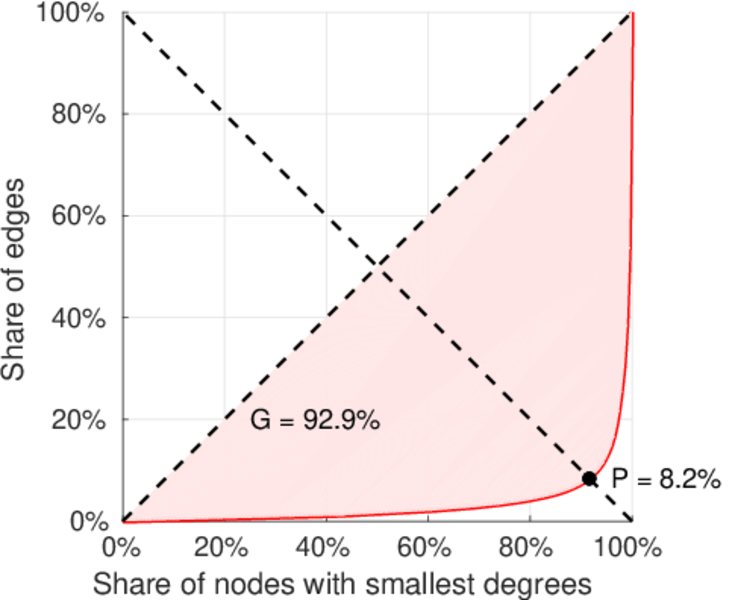
| Left balanced inequality ratio | P1 = | 0.082 277 2
|
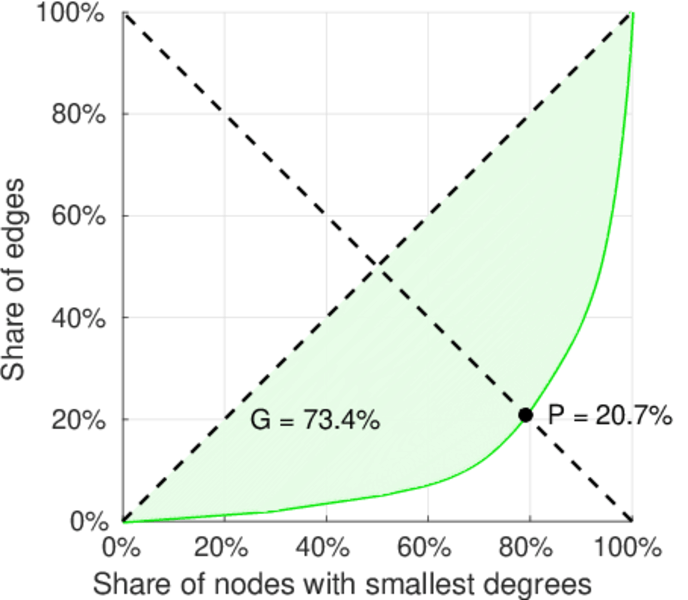
| Right balanced inequality ratio | P2 = | 0.207 164
|
| Relative edge distribution entropy | Her = | 0.801 987
|
| Power law exponent | γ = | 1.987 68
|
| Tail power law exponent | γt = | 2.341 00
|
| Tail power law exponent with p | γ3 = | 2.341 00
|
| p-value | p = | 0.000 00
|
| Left tail power law exponent with p | γ3,1 = | 1.791 00
|
| Left p-value | p1 = | 0.000 00
|
| Right tail power law exponent with p | γ3,2 = | 2.781 00
|
| Right p-value | p2 = | 0.000 00
|
| Degree assortativity | ρ = | −0.216 852
|
| Degree assortativity p-value | pρ = | 0.000 00
|
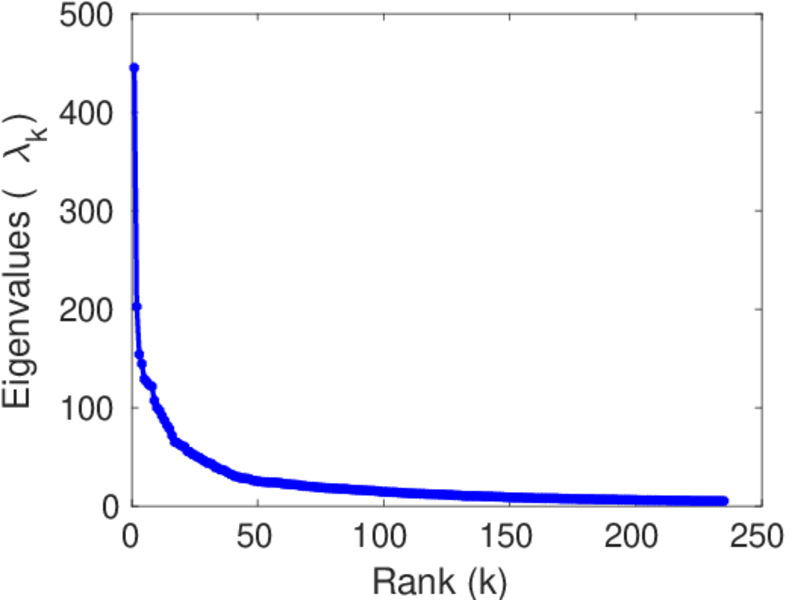
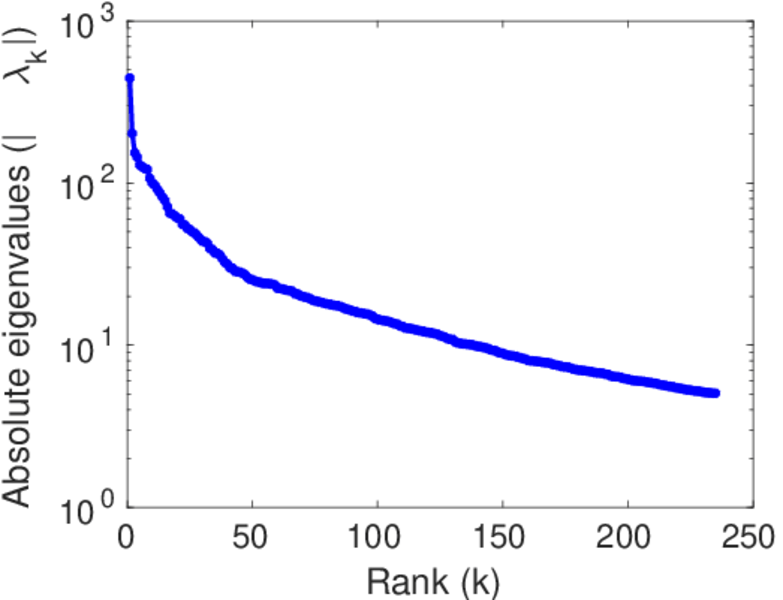
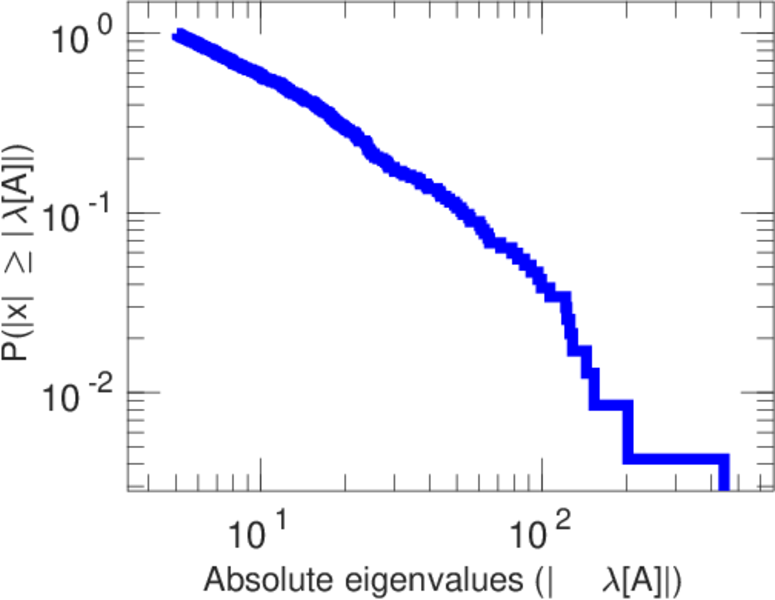
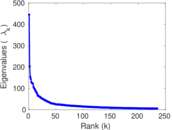
| Spectral norm | α = | 445.036
|
| Algebraic connectivity | a = | 0.031 428 5
|
| Spectral separation | |λ1[A] / λ2[A]| = | 2.197 06
|
| Controllability | C = | 5,104
|
| Relative controllability | Cr = | 0.692 162
|
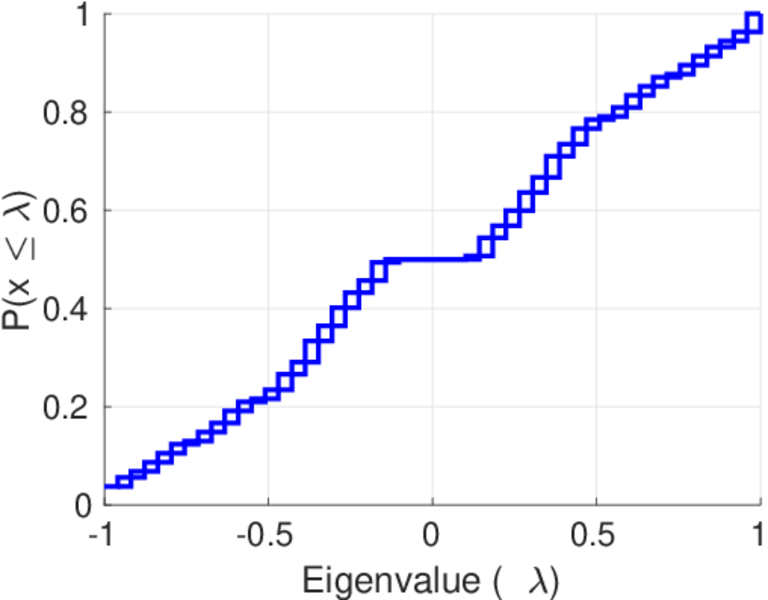
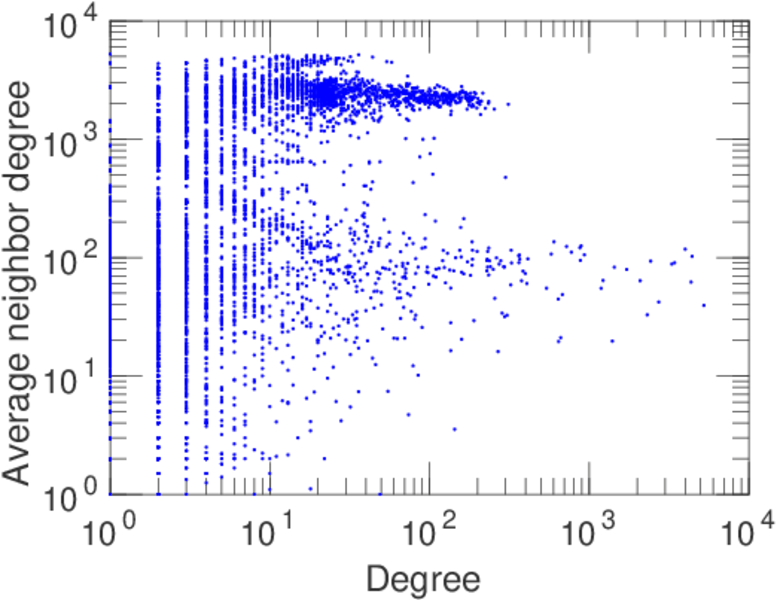
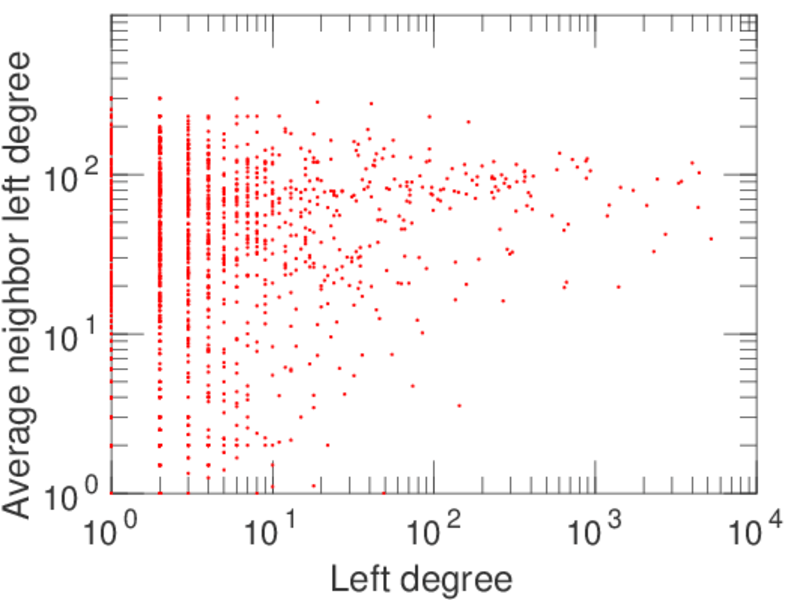
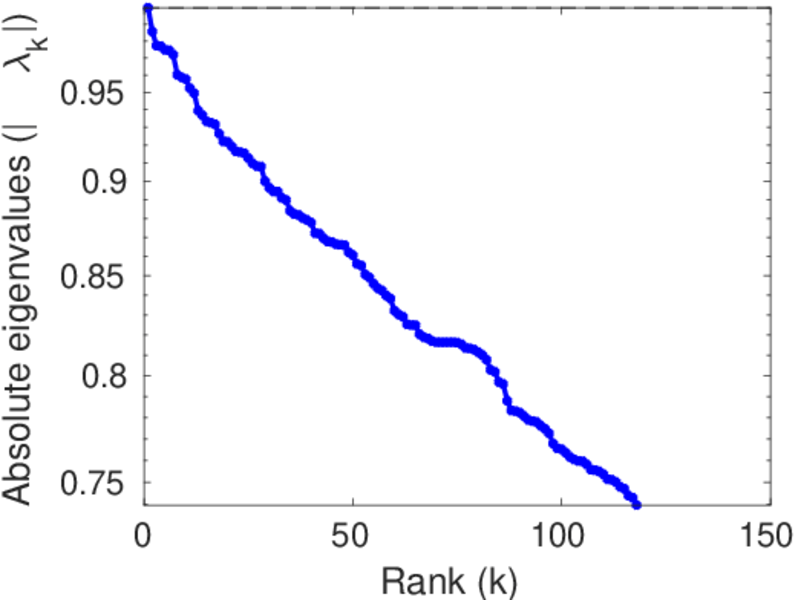
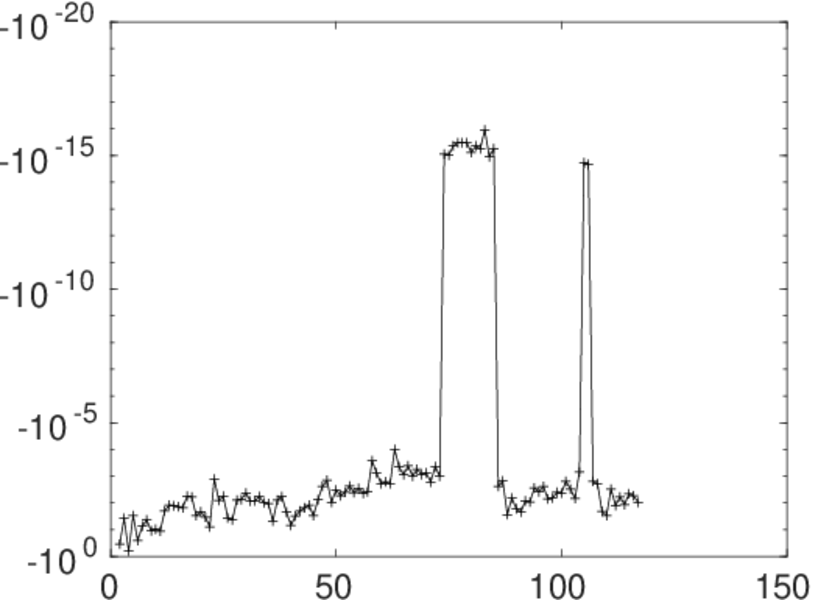
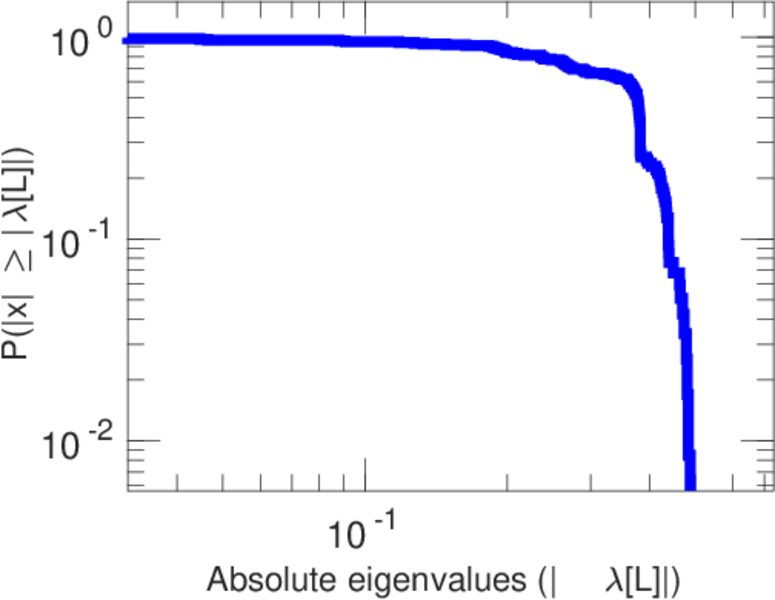
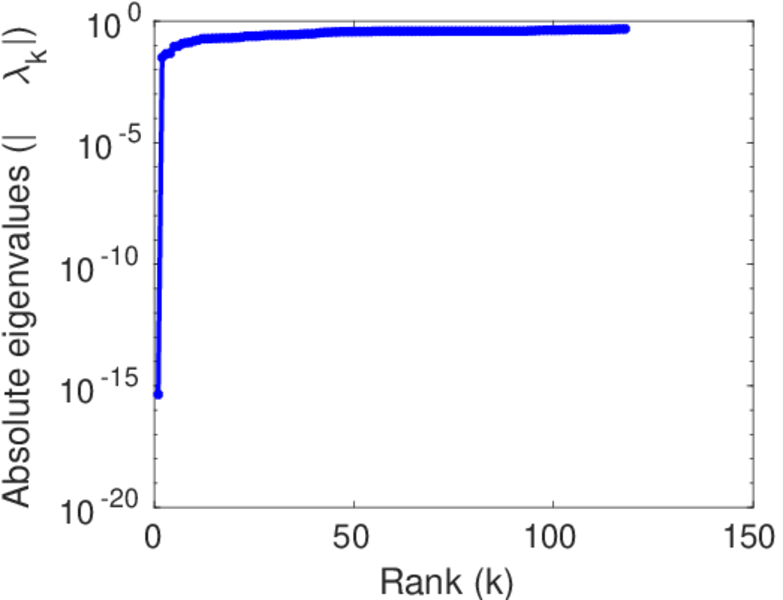
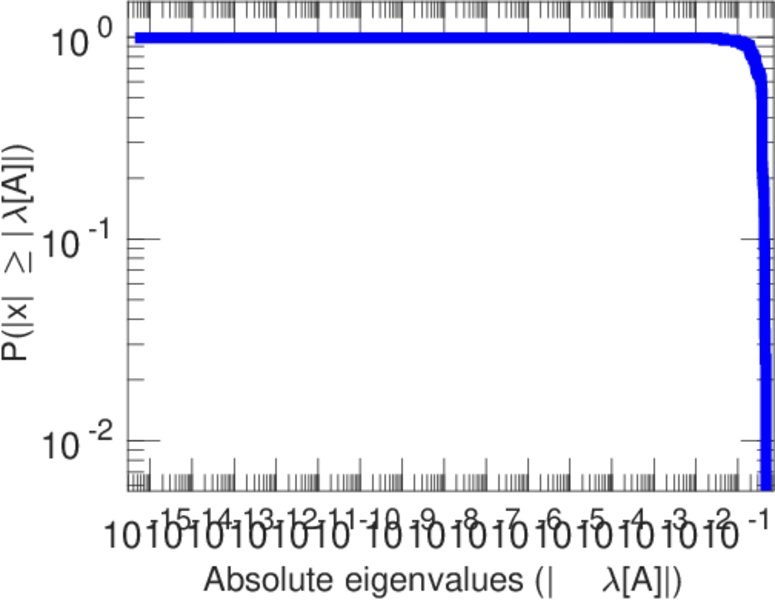
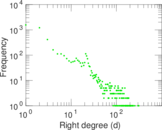
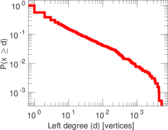
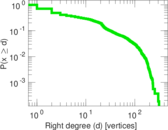
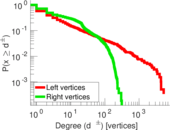
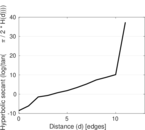
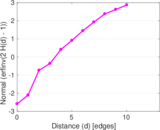
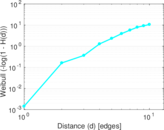
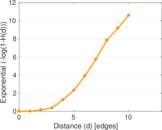
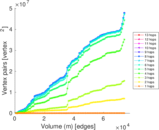
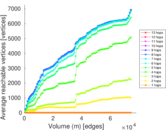
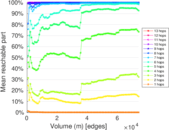
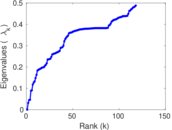
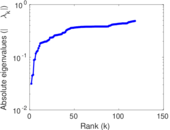
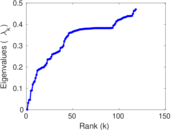
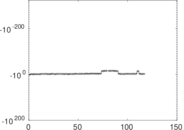
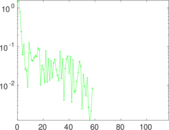
Plots


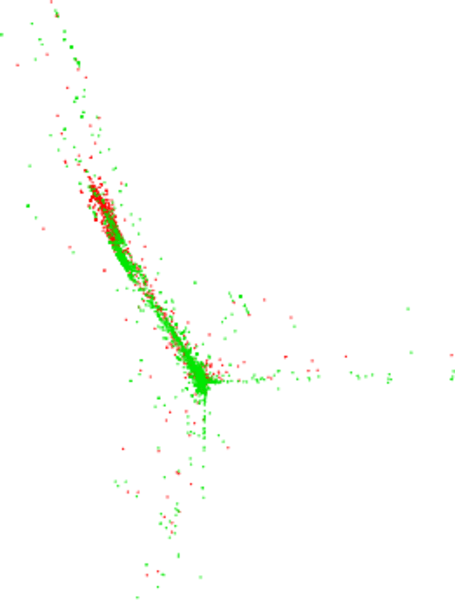
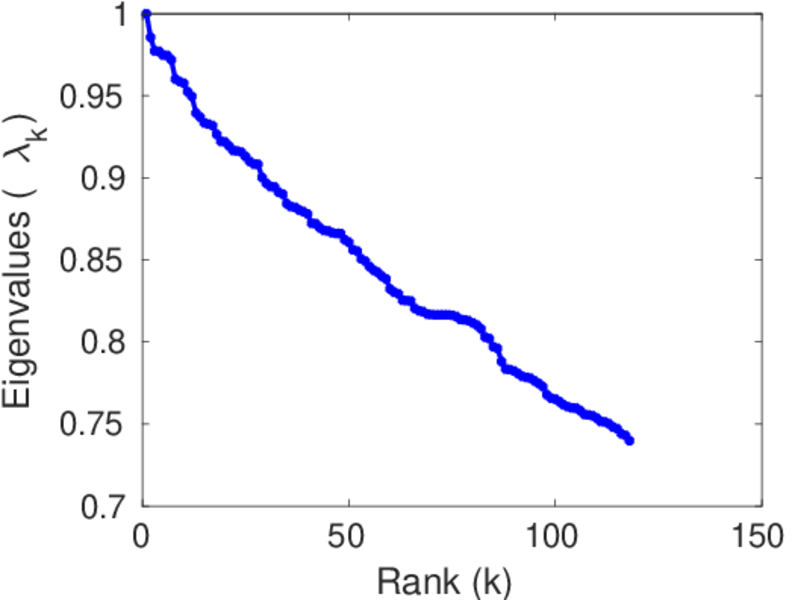
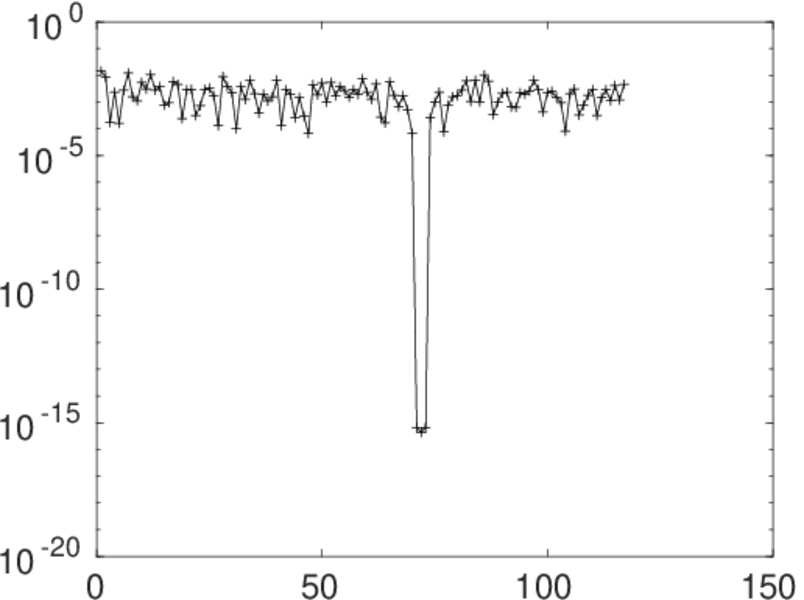
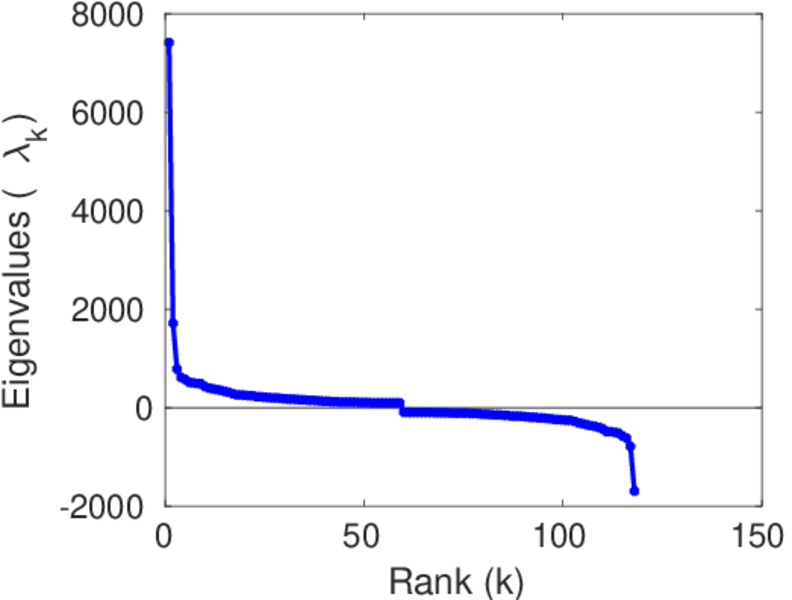
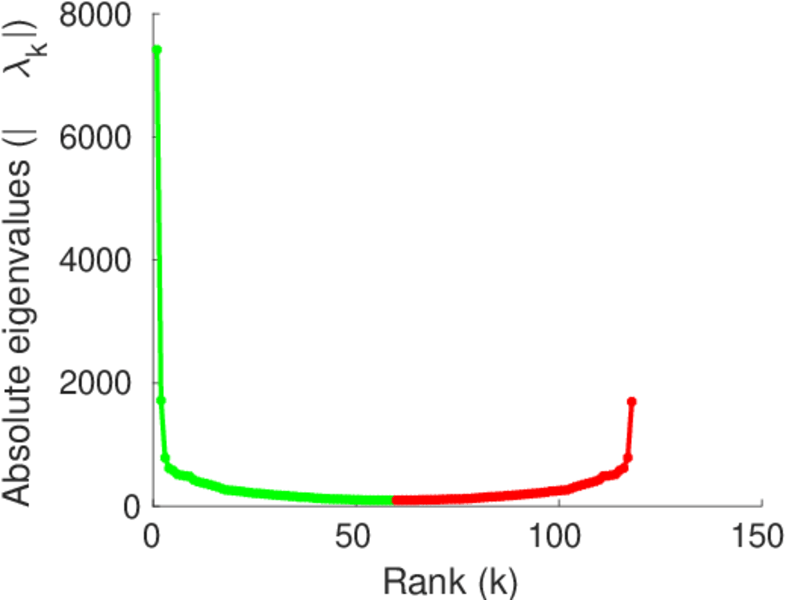
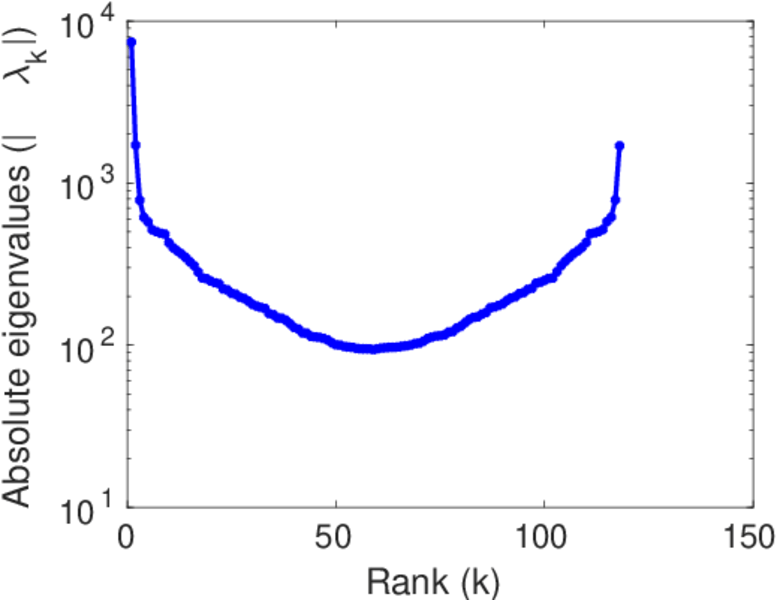
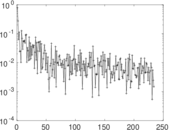
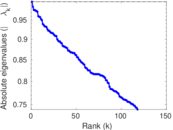
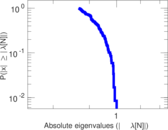
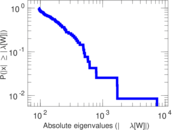
Matrix decompositions plots


Downloads
References
|
[1]
|
Jérôme Kunegis.
KONECT – The Koblenz Network Collection.
In Proc. Int. Conf. on World Wide Web Companion, pages
1343–1350, 2013.
[ http ]
|
|
[2]
|
Wikimedia Foundation.
Wikimedia downloads.
http://dumps.wikimedia.org/, January 2010.
|
 KONECT ‣ Networks ‣
Buy Me a Coffee
KONECT ‣ Networks ‣
Buy Me a Coffee