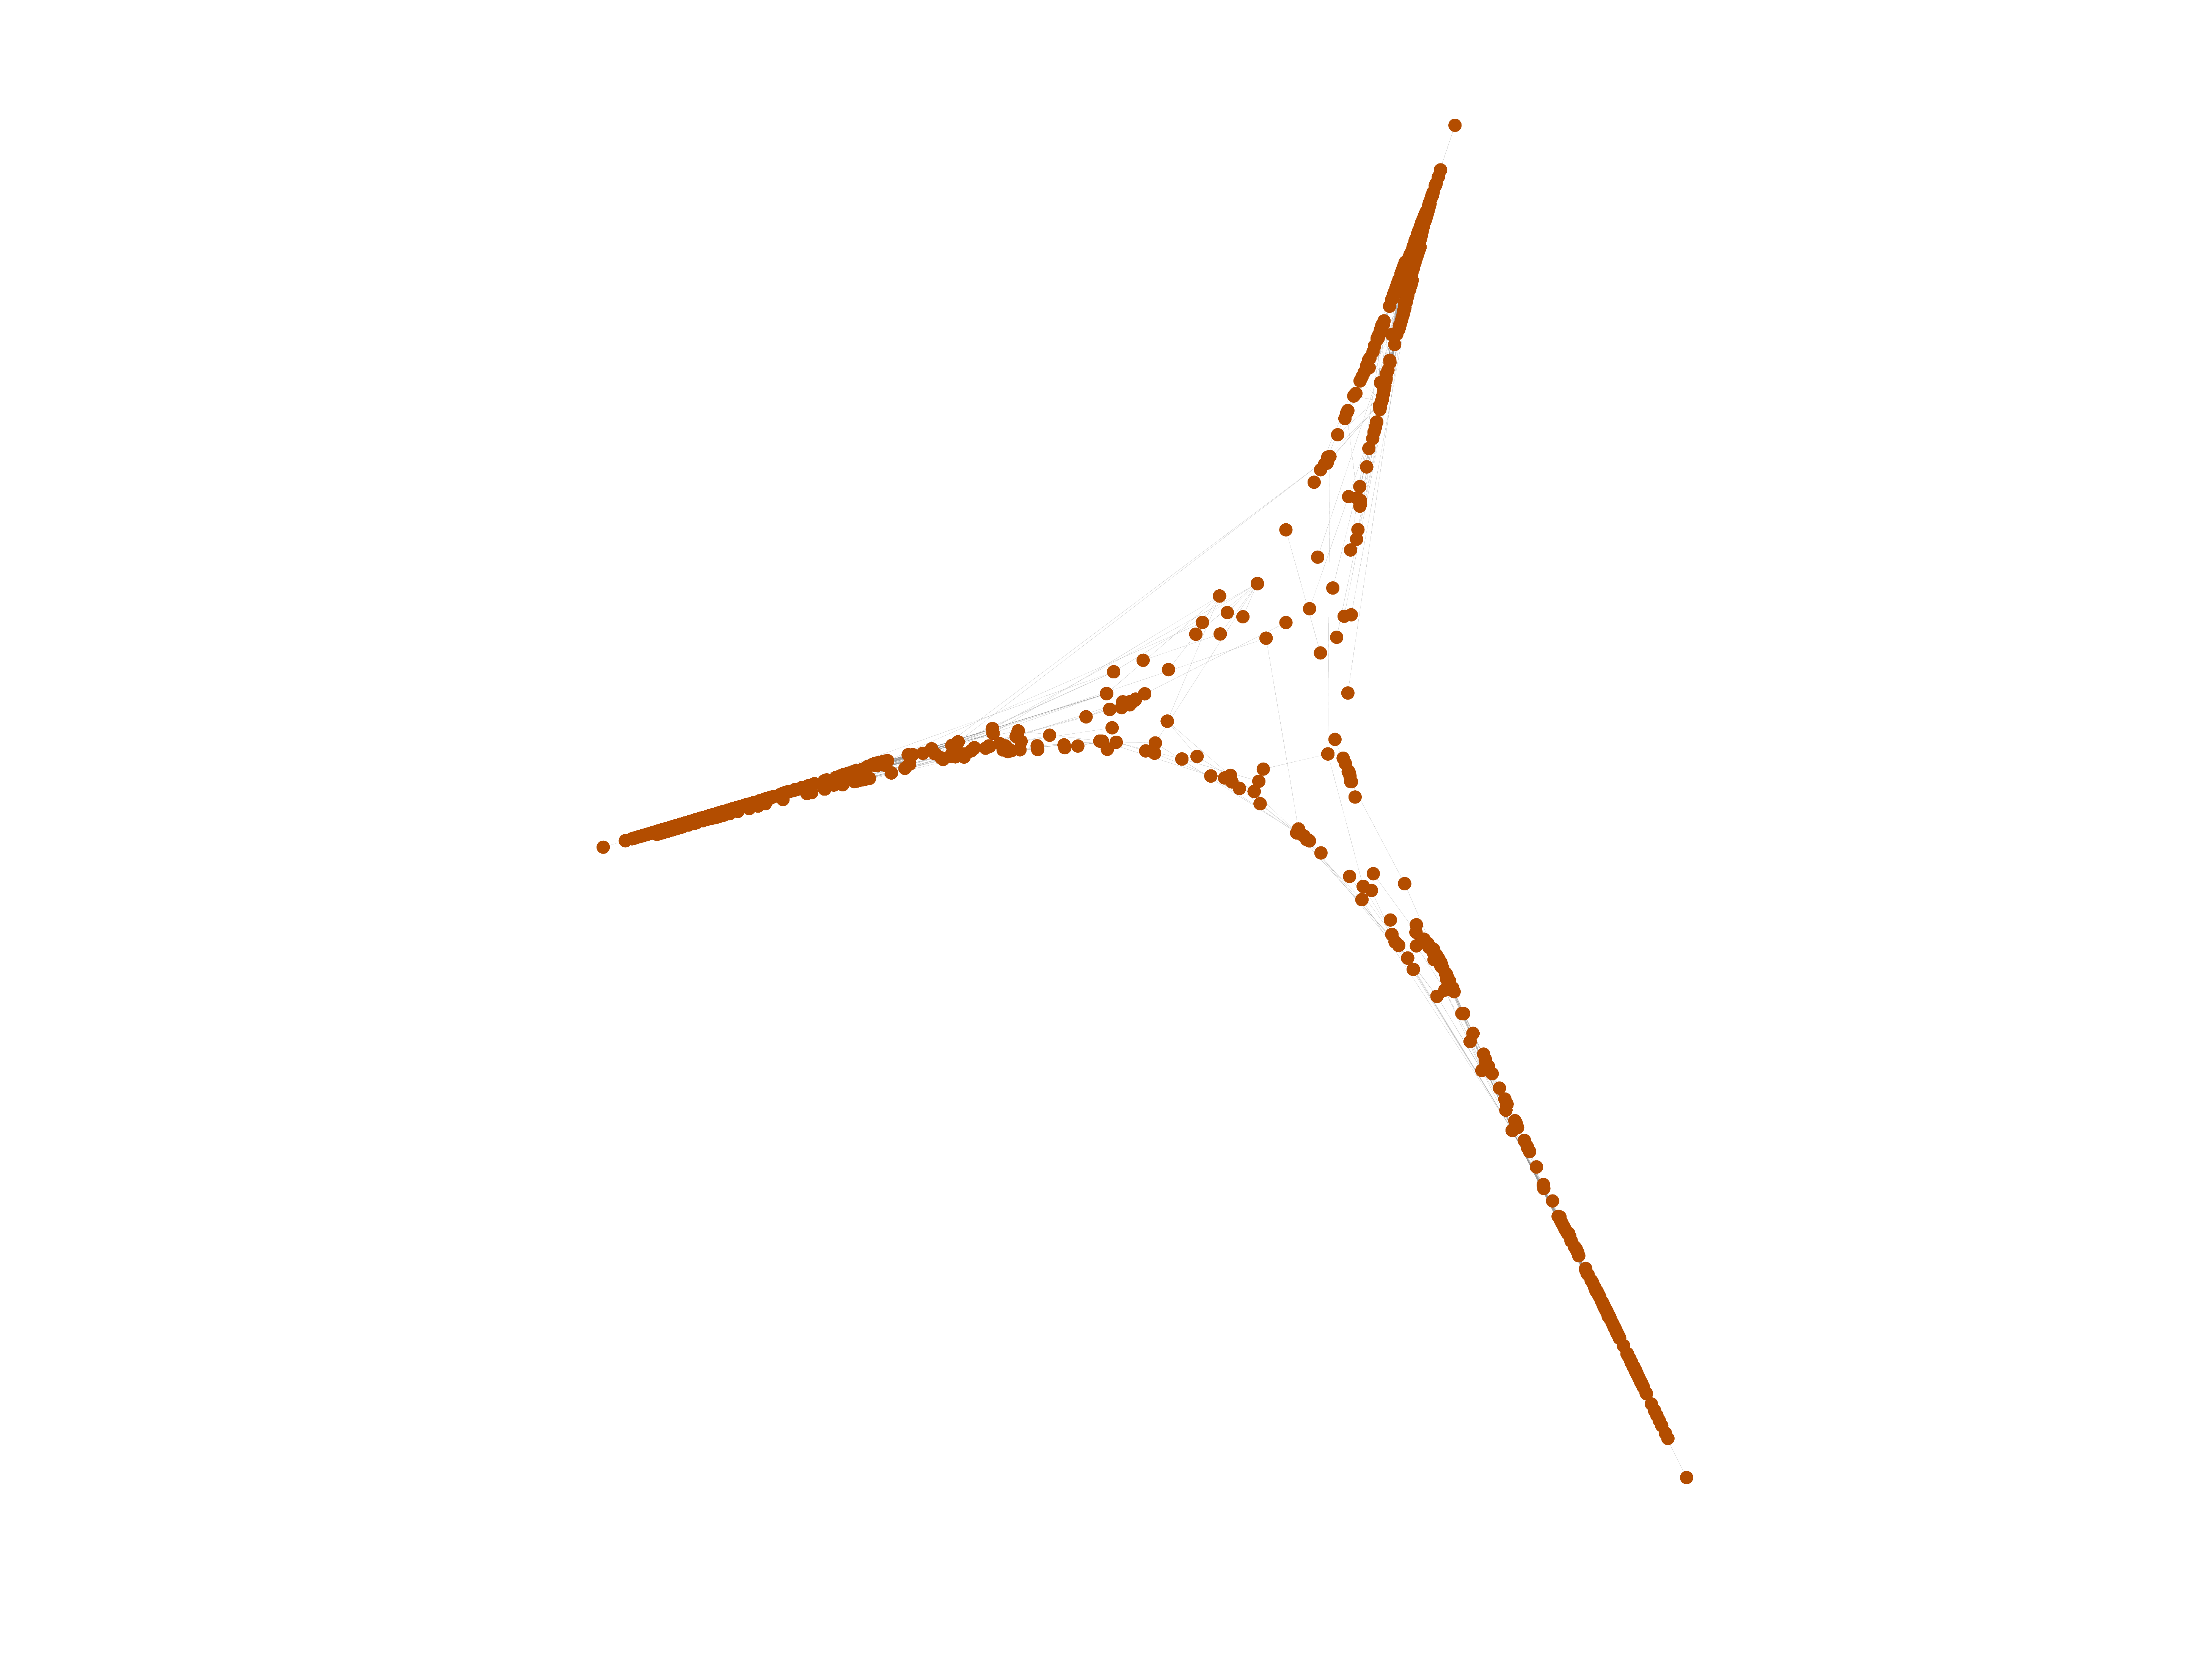
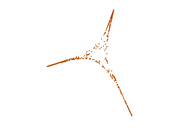
Wiktionary edits (tpi)
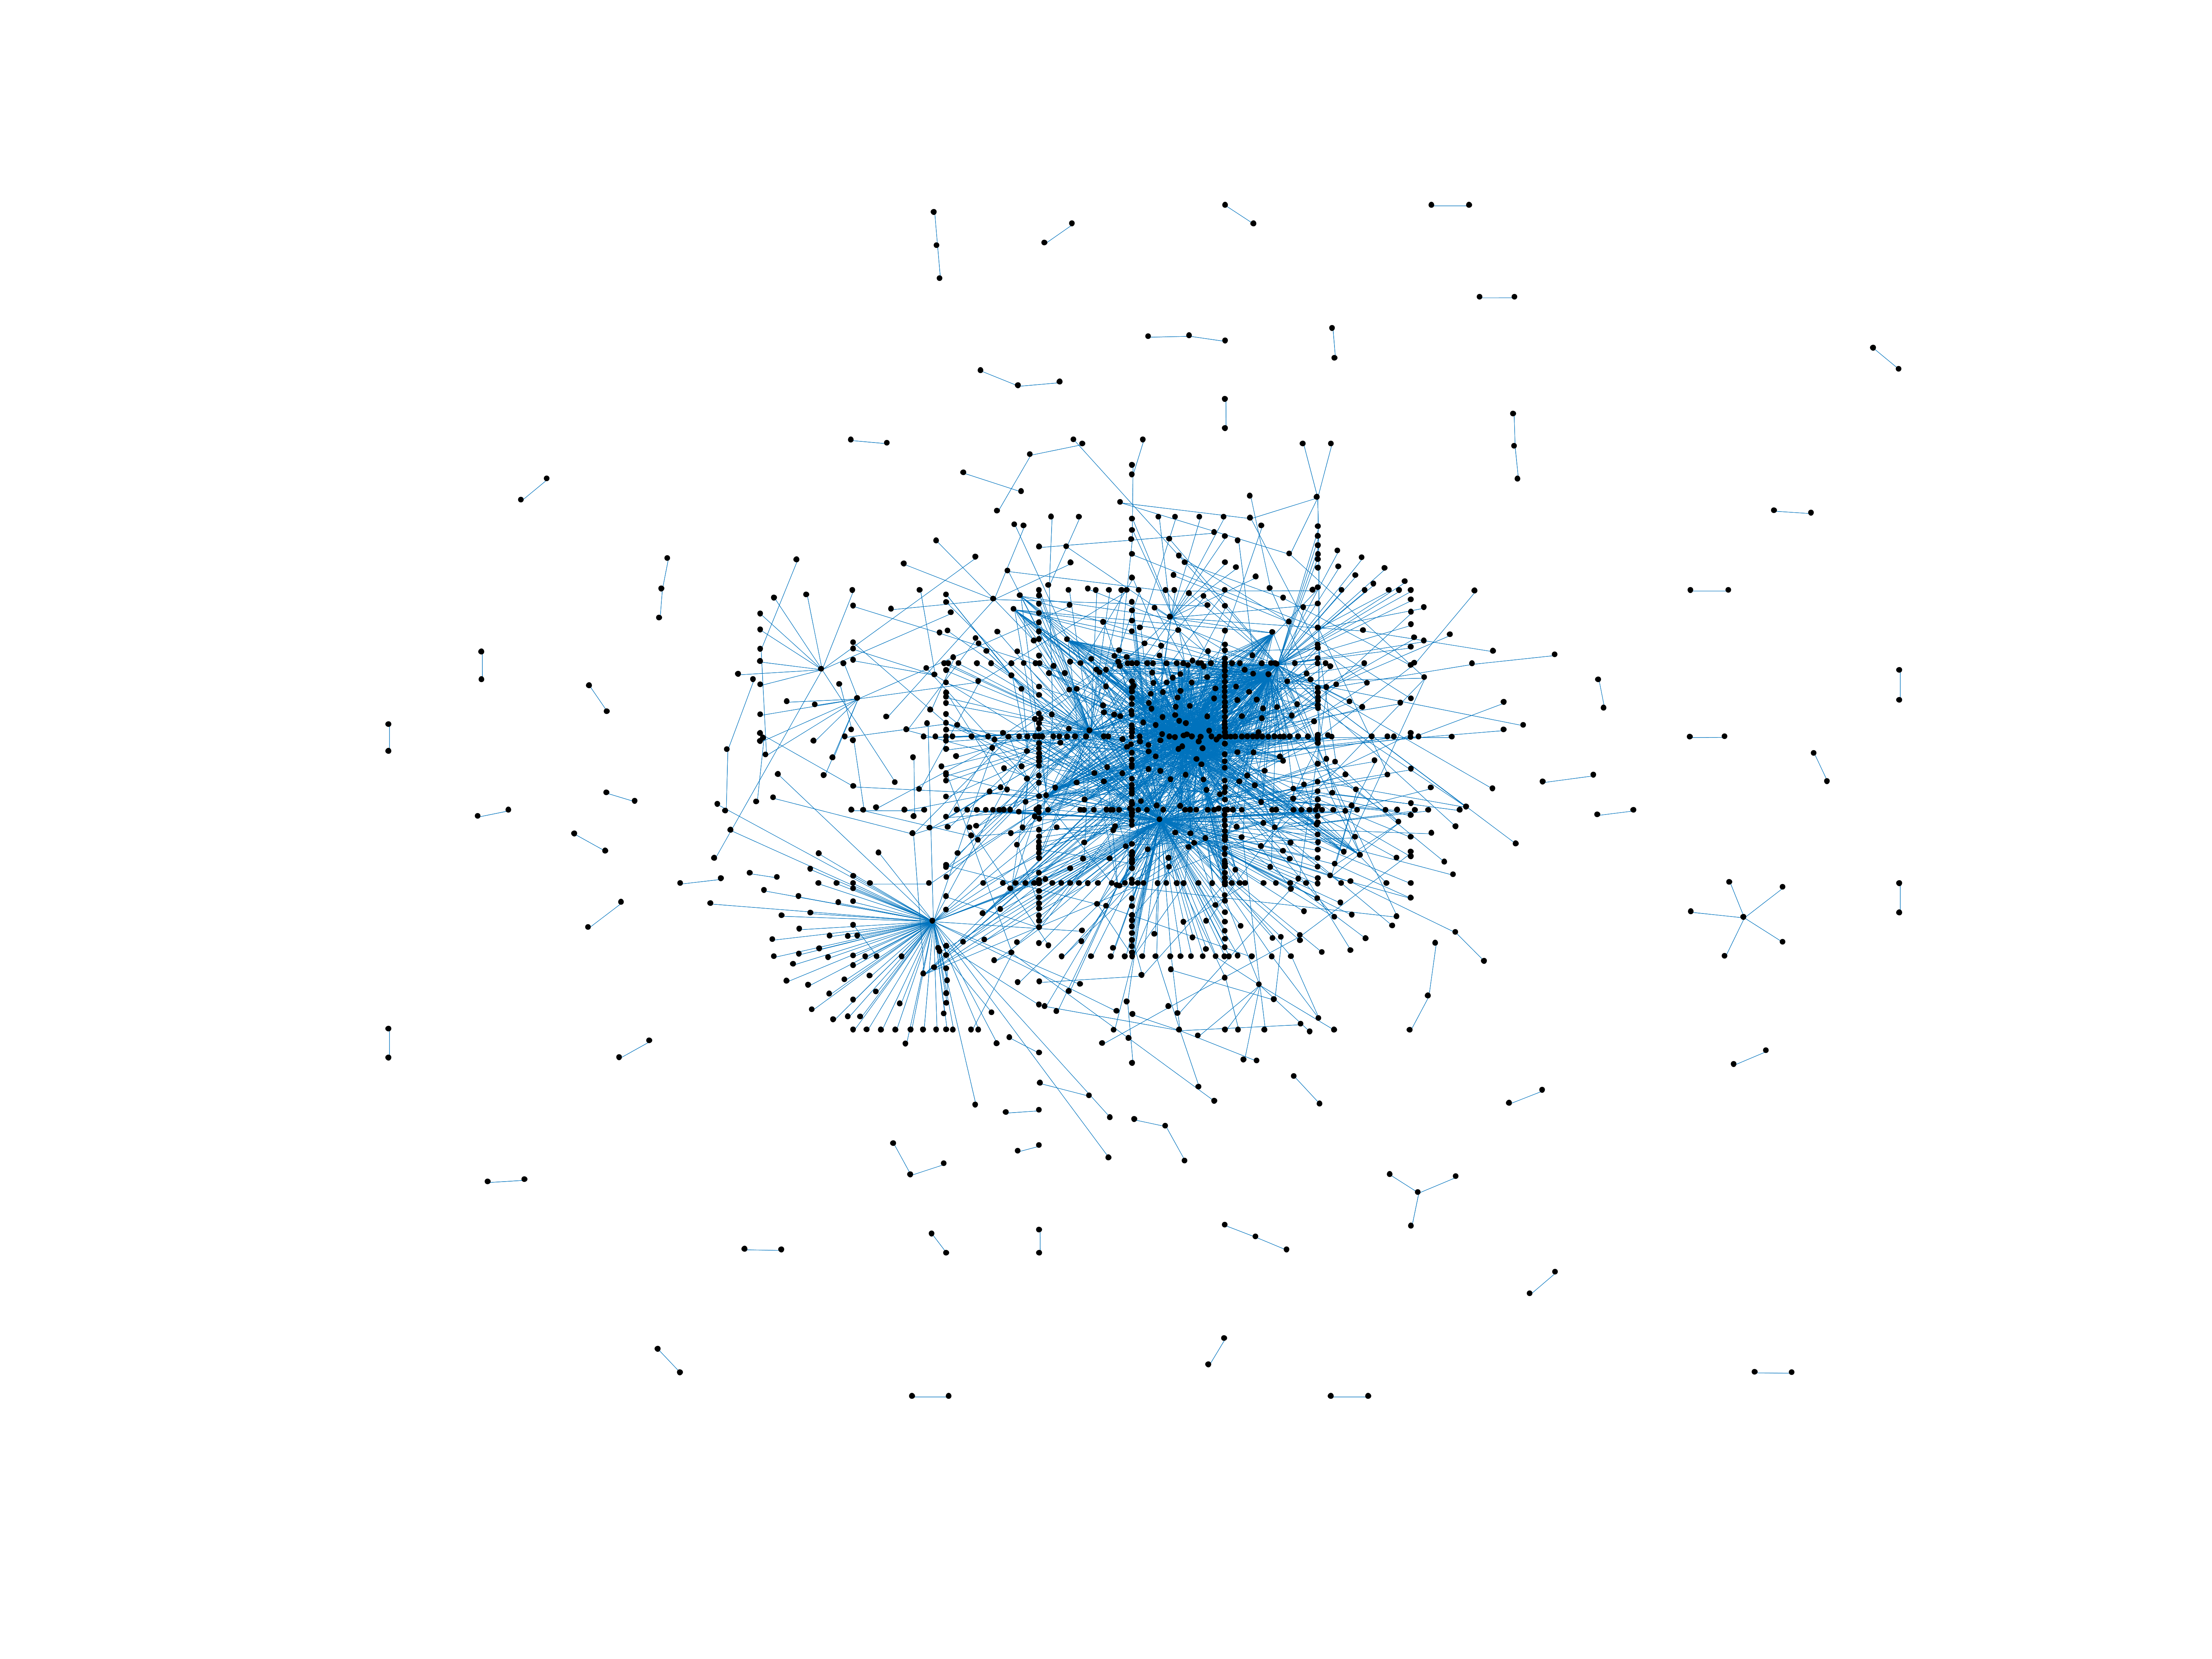
This is the bipartite edit network of the Tok Pisin Wiktionary. It contains
users and pages from the Tok Pisin Wiktionary, connected by edit events. Each
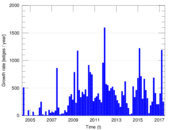
edge represents an edit. The dataset includes the timestamp of each edit.
Metadata
Statistics
| Size | n = | 1,057
|
| Left size | n1 = | 195
|
| Right size | n2 = | 862
|
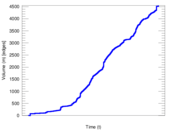
| Volume | m = | 4,552
|
| Unique edge count | m̿ = | 2,079
|
| Wedge count | s = | 90,496
|
| Claw count | z = | 3,787,800
|
| Cross count | x = | 145,569,210
|
| Square count | q = | 96,165
|
| 4-Tour count | T4 = | 1,135,766
|
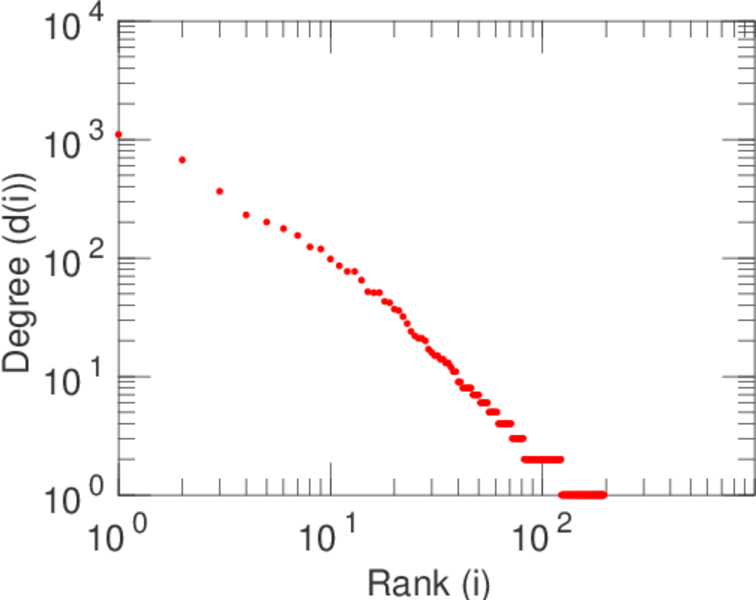
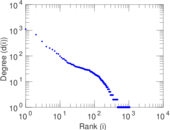
| Maximum degree | dmax = | 1,103
|
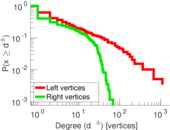
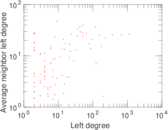
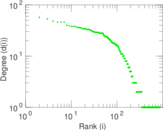
| Maximum left degree | d1max = | 1,103
|
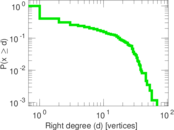
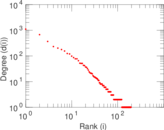
| Maximum right degree | d2max = | 69
|
| Average degree | d = | 8.613 06
|
| Average left degree | d1 = | 23.343 6
|
| Average right degree | d2 = | 5.280 74
|
| Fill | p = | 0.012 368 4
|
| Average edge multiplicity | m̃ = | 2.189 51
|
| Size of LCC | N = | 746
|
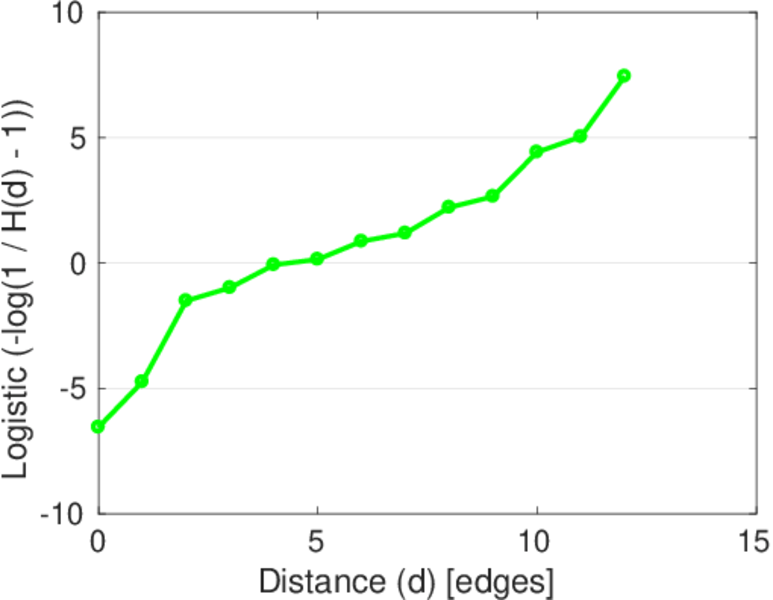
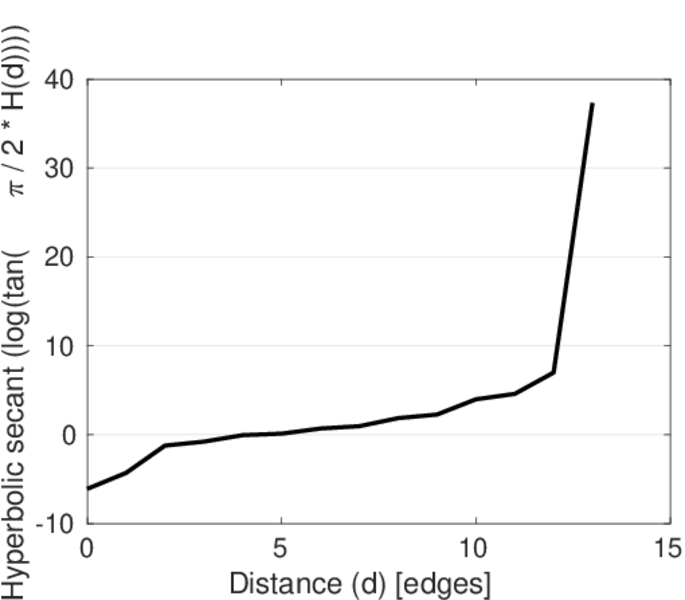
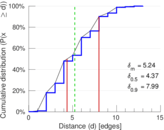
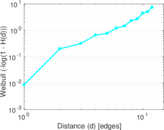
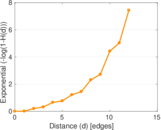
| Diameter | δ = | 14
|
| 50-Percentile effective diameter | δ0.5 = | 4.367 09
|
| 90-Percentile effective diameter | δ0.9 = | 7.991 18
|
| Median distance | δM = | 5
|
| Mean distance | δm = | 5.241 47
|
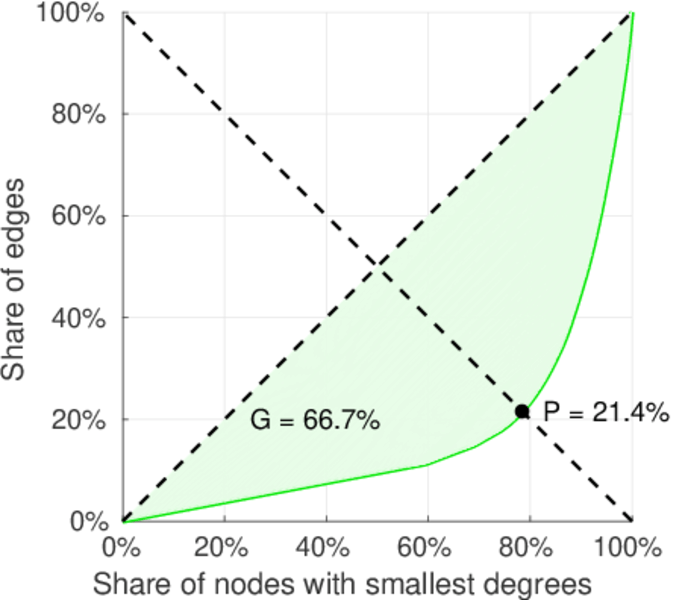
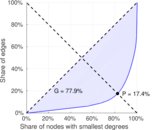
| Gini coefficient | G = | 0.772 226
|
| Balanced inequality ratio | P = | 0.186 841
|
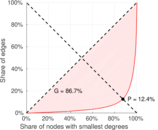
| Left balanced inequality ratio | P1 = | 0.123 682
|
| Right balanced inequality ratio | P2 = | 0.214 411
|
| Relative edge distribution entropy | Her = | 0.826 617
|
| Power law exponent | γ = | 2.744 76
|
| Tail power law exponent | γt = | 2.001 00
|
| Tail power law exponent with p | γ3 = | 2.001 00
|
| p-value | p = | 0.000 00
|
| Left tail power law exponent with p | γ3,1 = | 1.671 00
|
| Left p-value | p1 = | 0.564 000
|
| Right tail power law exponent with p | γ3,2 = | 8.661 00
|
| Right p-value | p2 = | 0.881 000
|
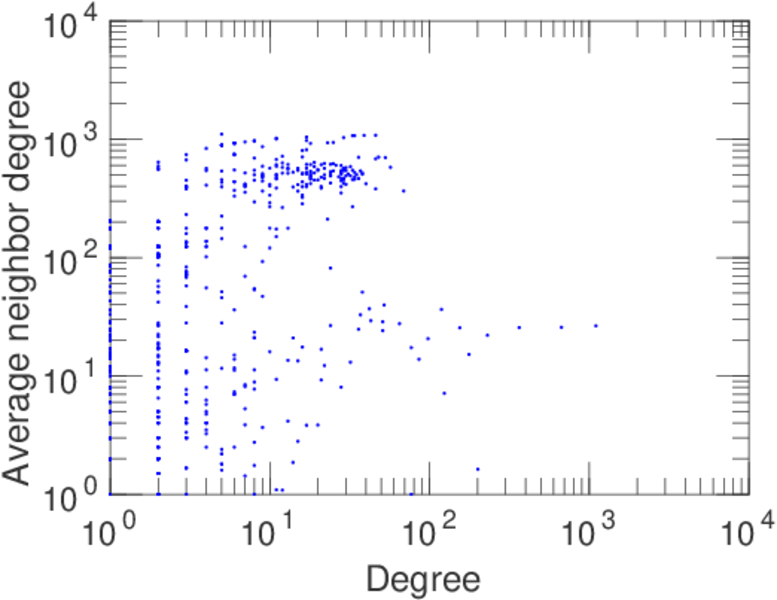
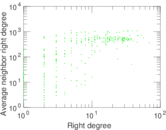
| Degree assortativity | ρ = | +0.042 048 0
|
| Degree assortativity p-value | pρ = | 0.055 248 5
|
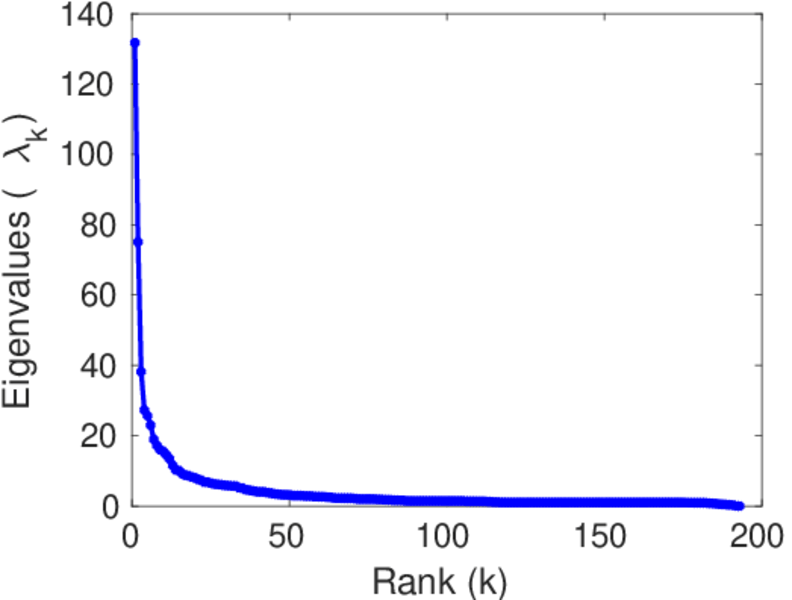
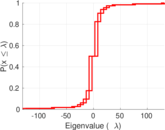
| Spectral norm | α = | 131.713
|
| Algebraic connectivity | a = | 0.009 534 35
|
| Spectral separation | |λ1[A] / λ2[A]| = | 1.754 40
|
| Controllability | C = | 674
|
| Relative controllability | Cr = | 0.638 258
|
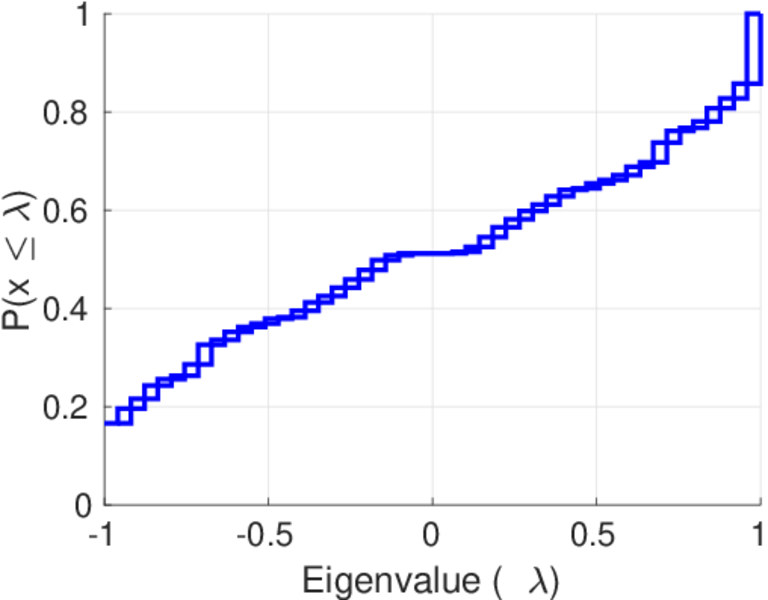
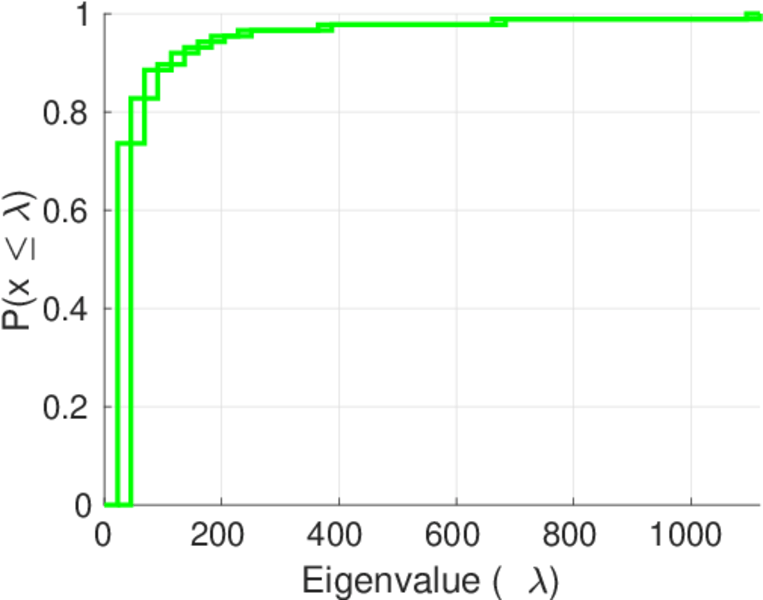
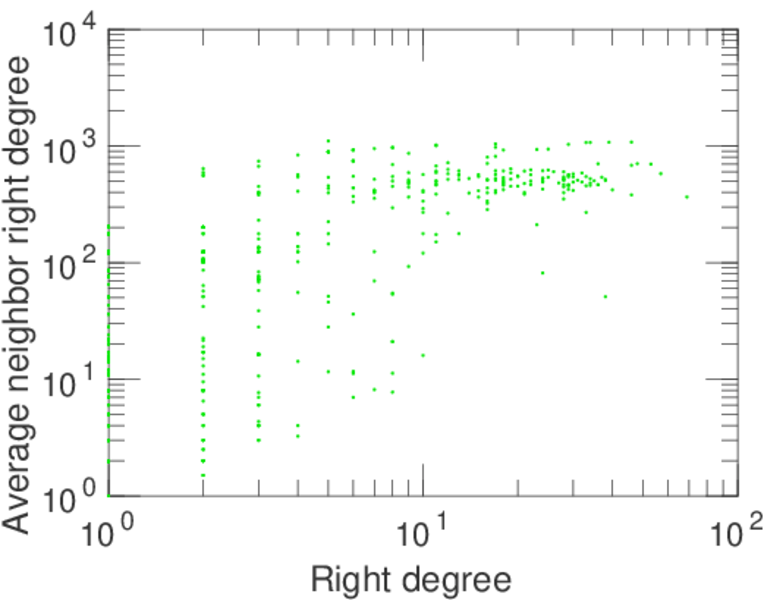
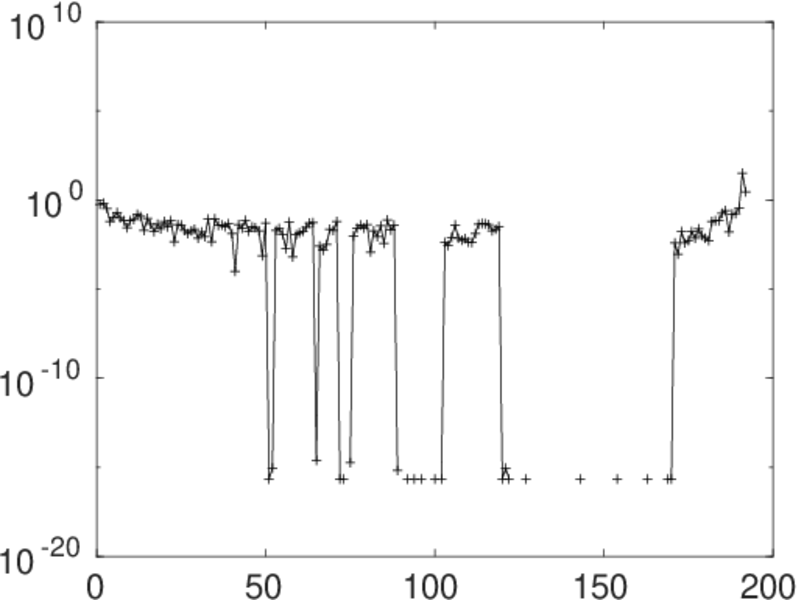
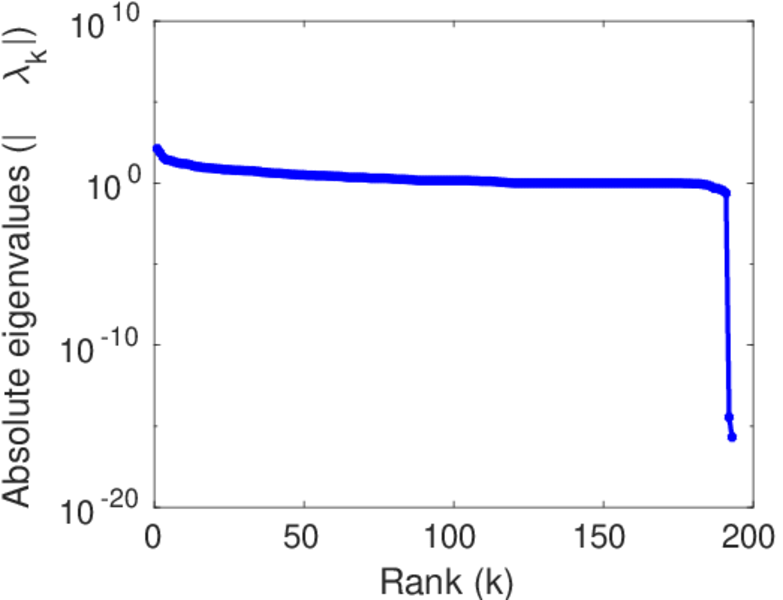
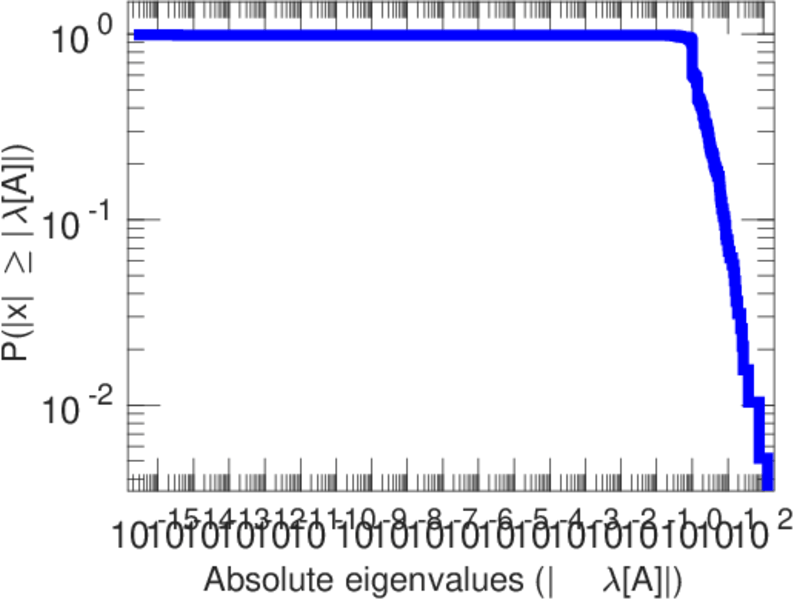
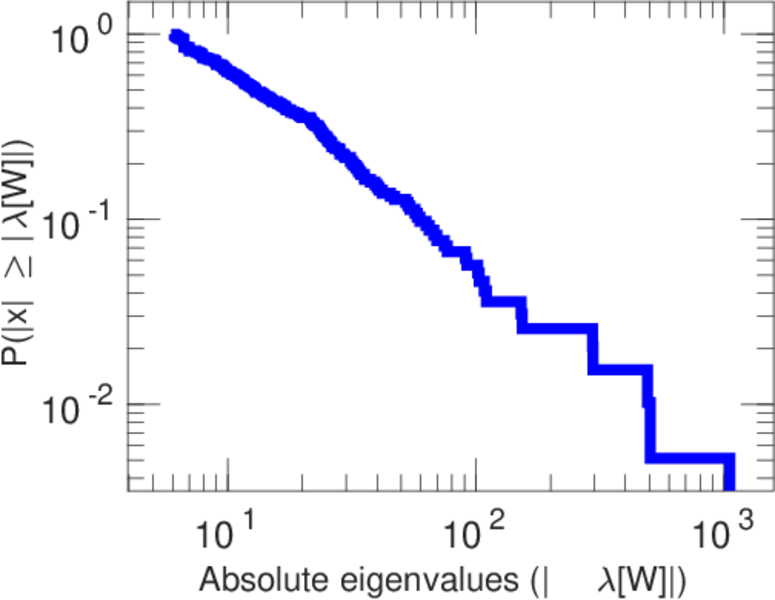
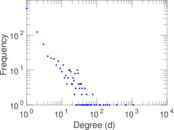
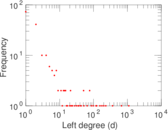
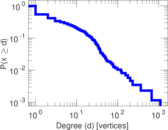
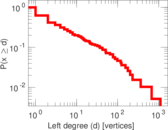
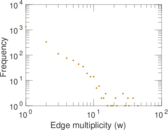
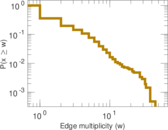
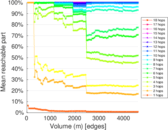
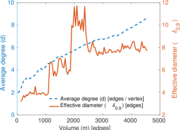
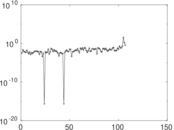
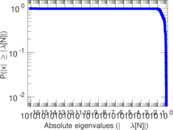
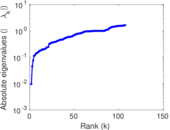
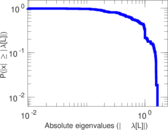
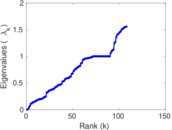
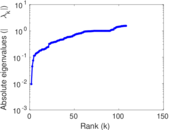
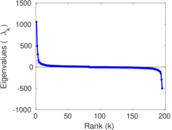
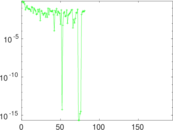
Plots


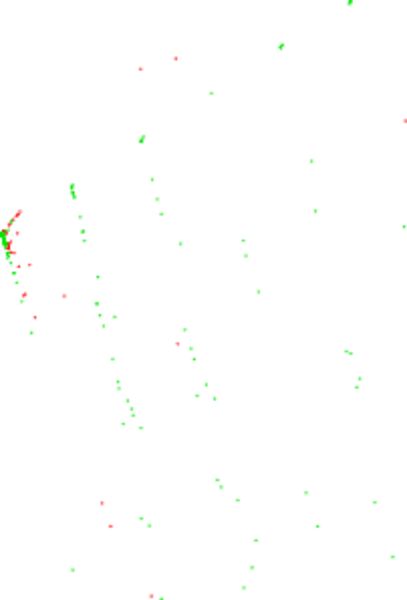
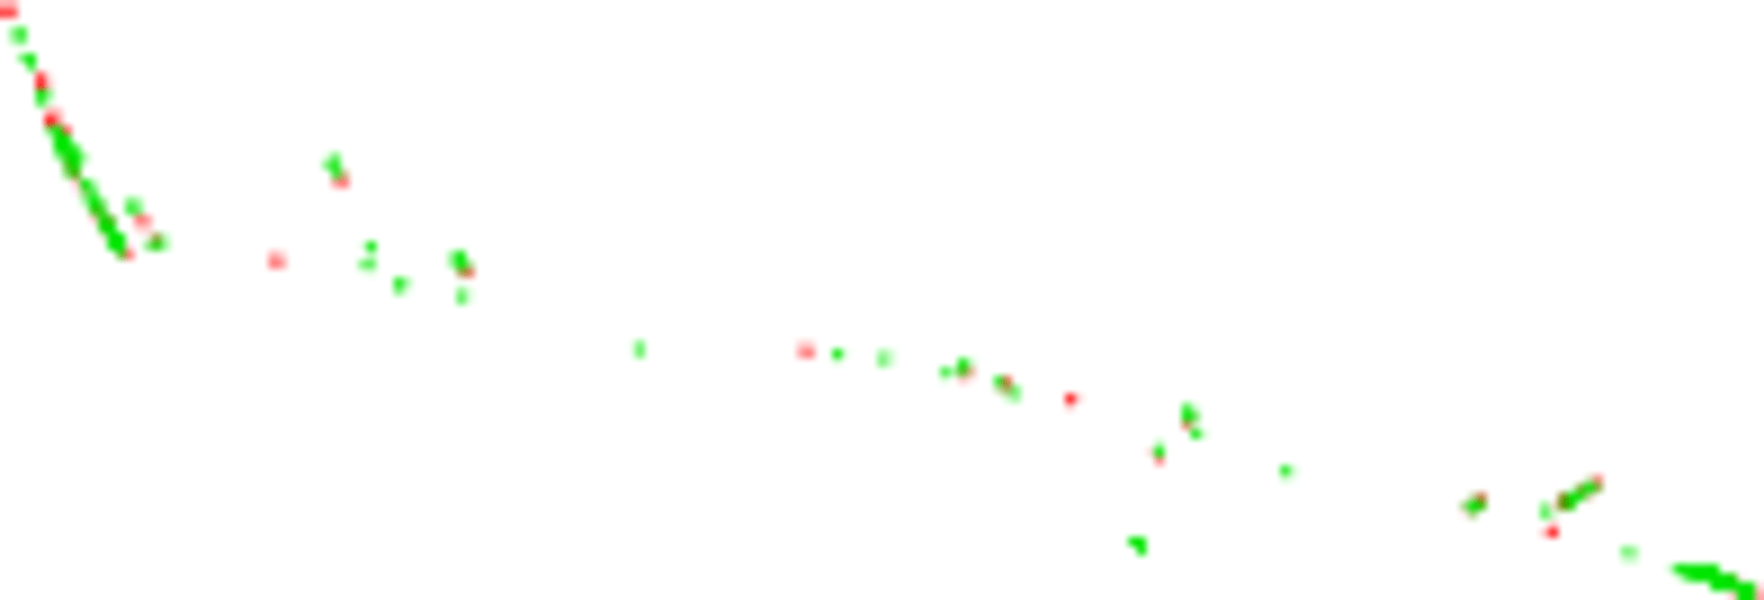
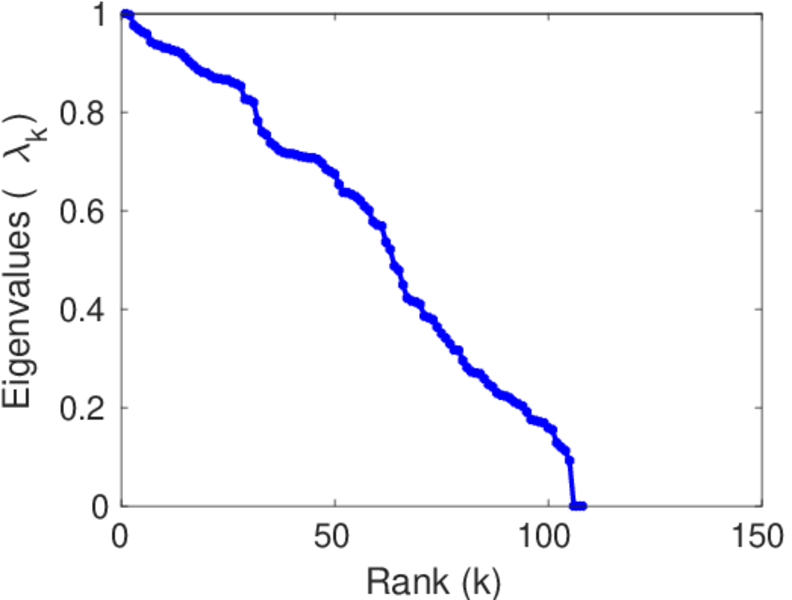
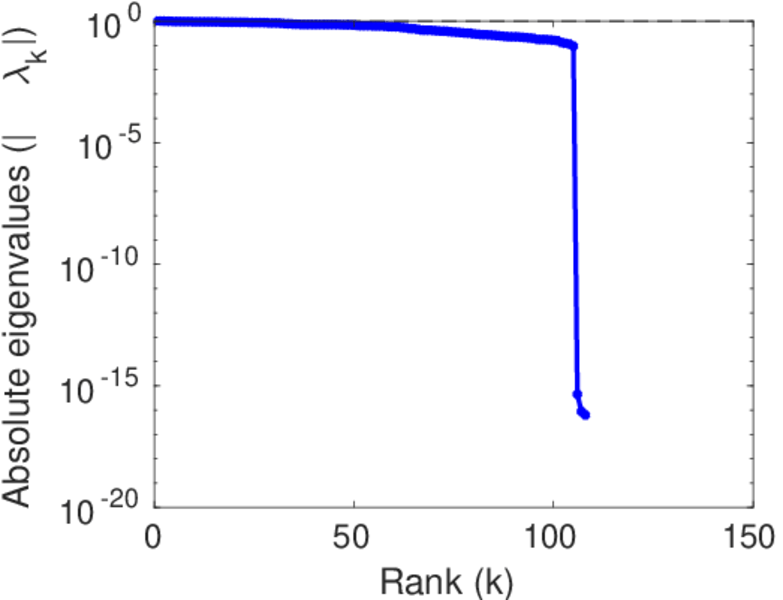
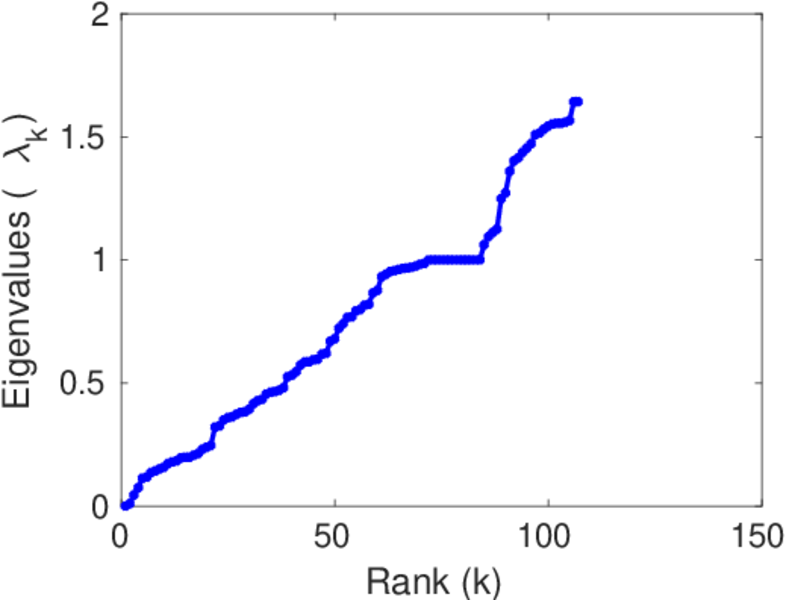
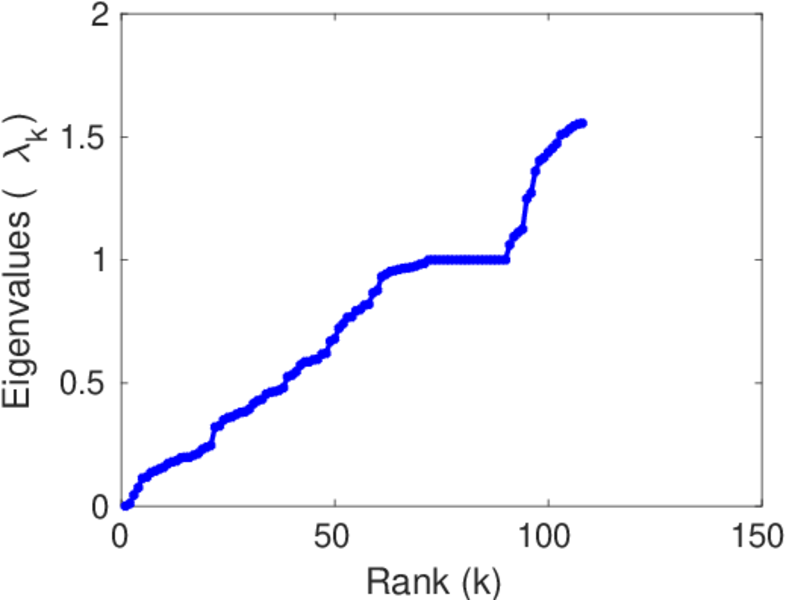
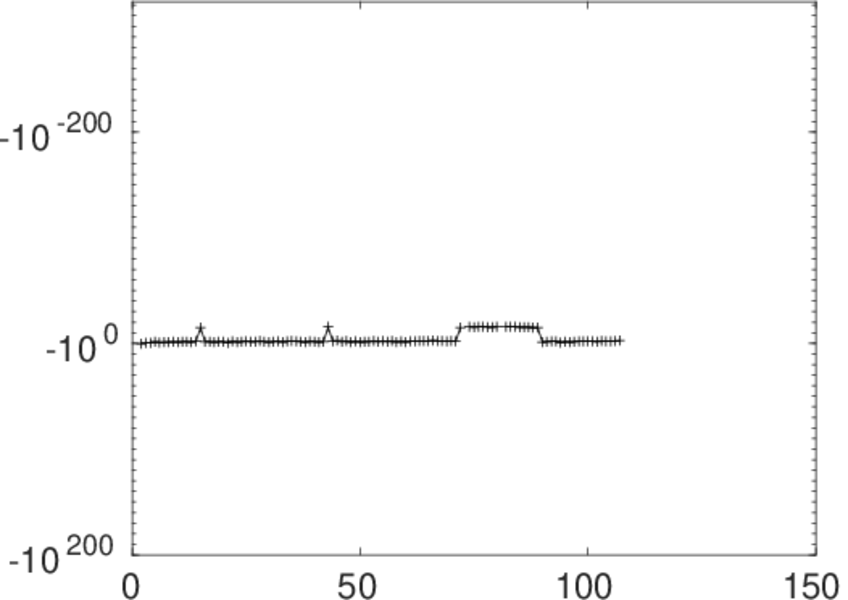
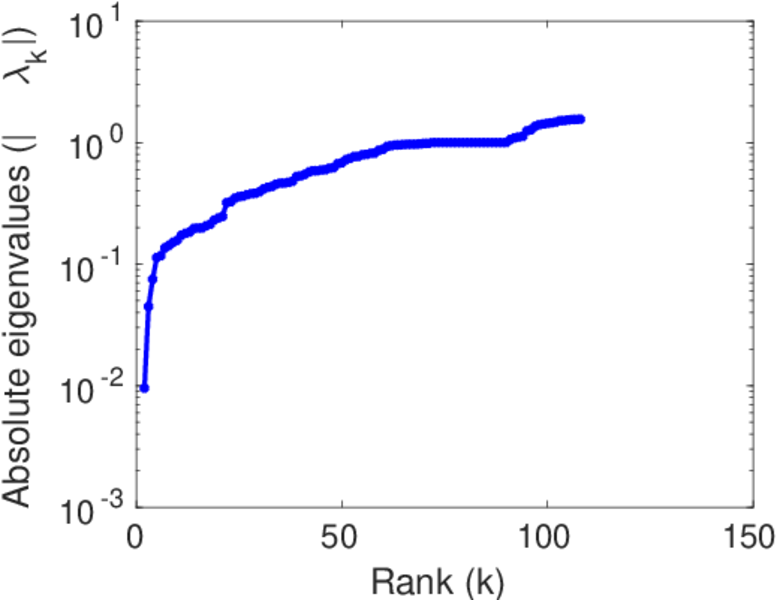
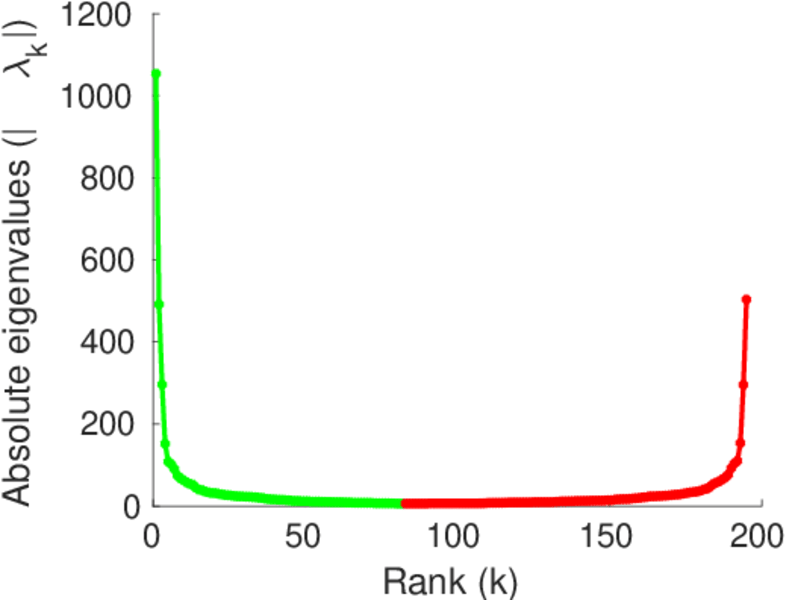
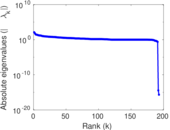
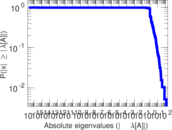
Matrix decompositions plots


Downloads
References
|
[1]
|
Jérôme Kunegis.
KONECT – The Koblenz Network Collection.
In Proc. Int. Conf. on World Wide Web Companion, pages
1343–1350, 2013.
[ http ]
|
|
[2]
|
Wikimedia Foundation.
Wikimedia downloads.
http://dumps.wikimedia.org/, January 2010.
|
 KONECT ‣ Networks ‣
Buy Me a Coffee
KONECT ‣ Networks ‣
Buy Me a Coffee