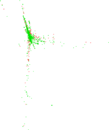
Wikibooks edits (tr)
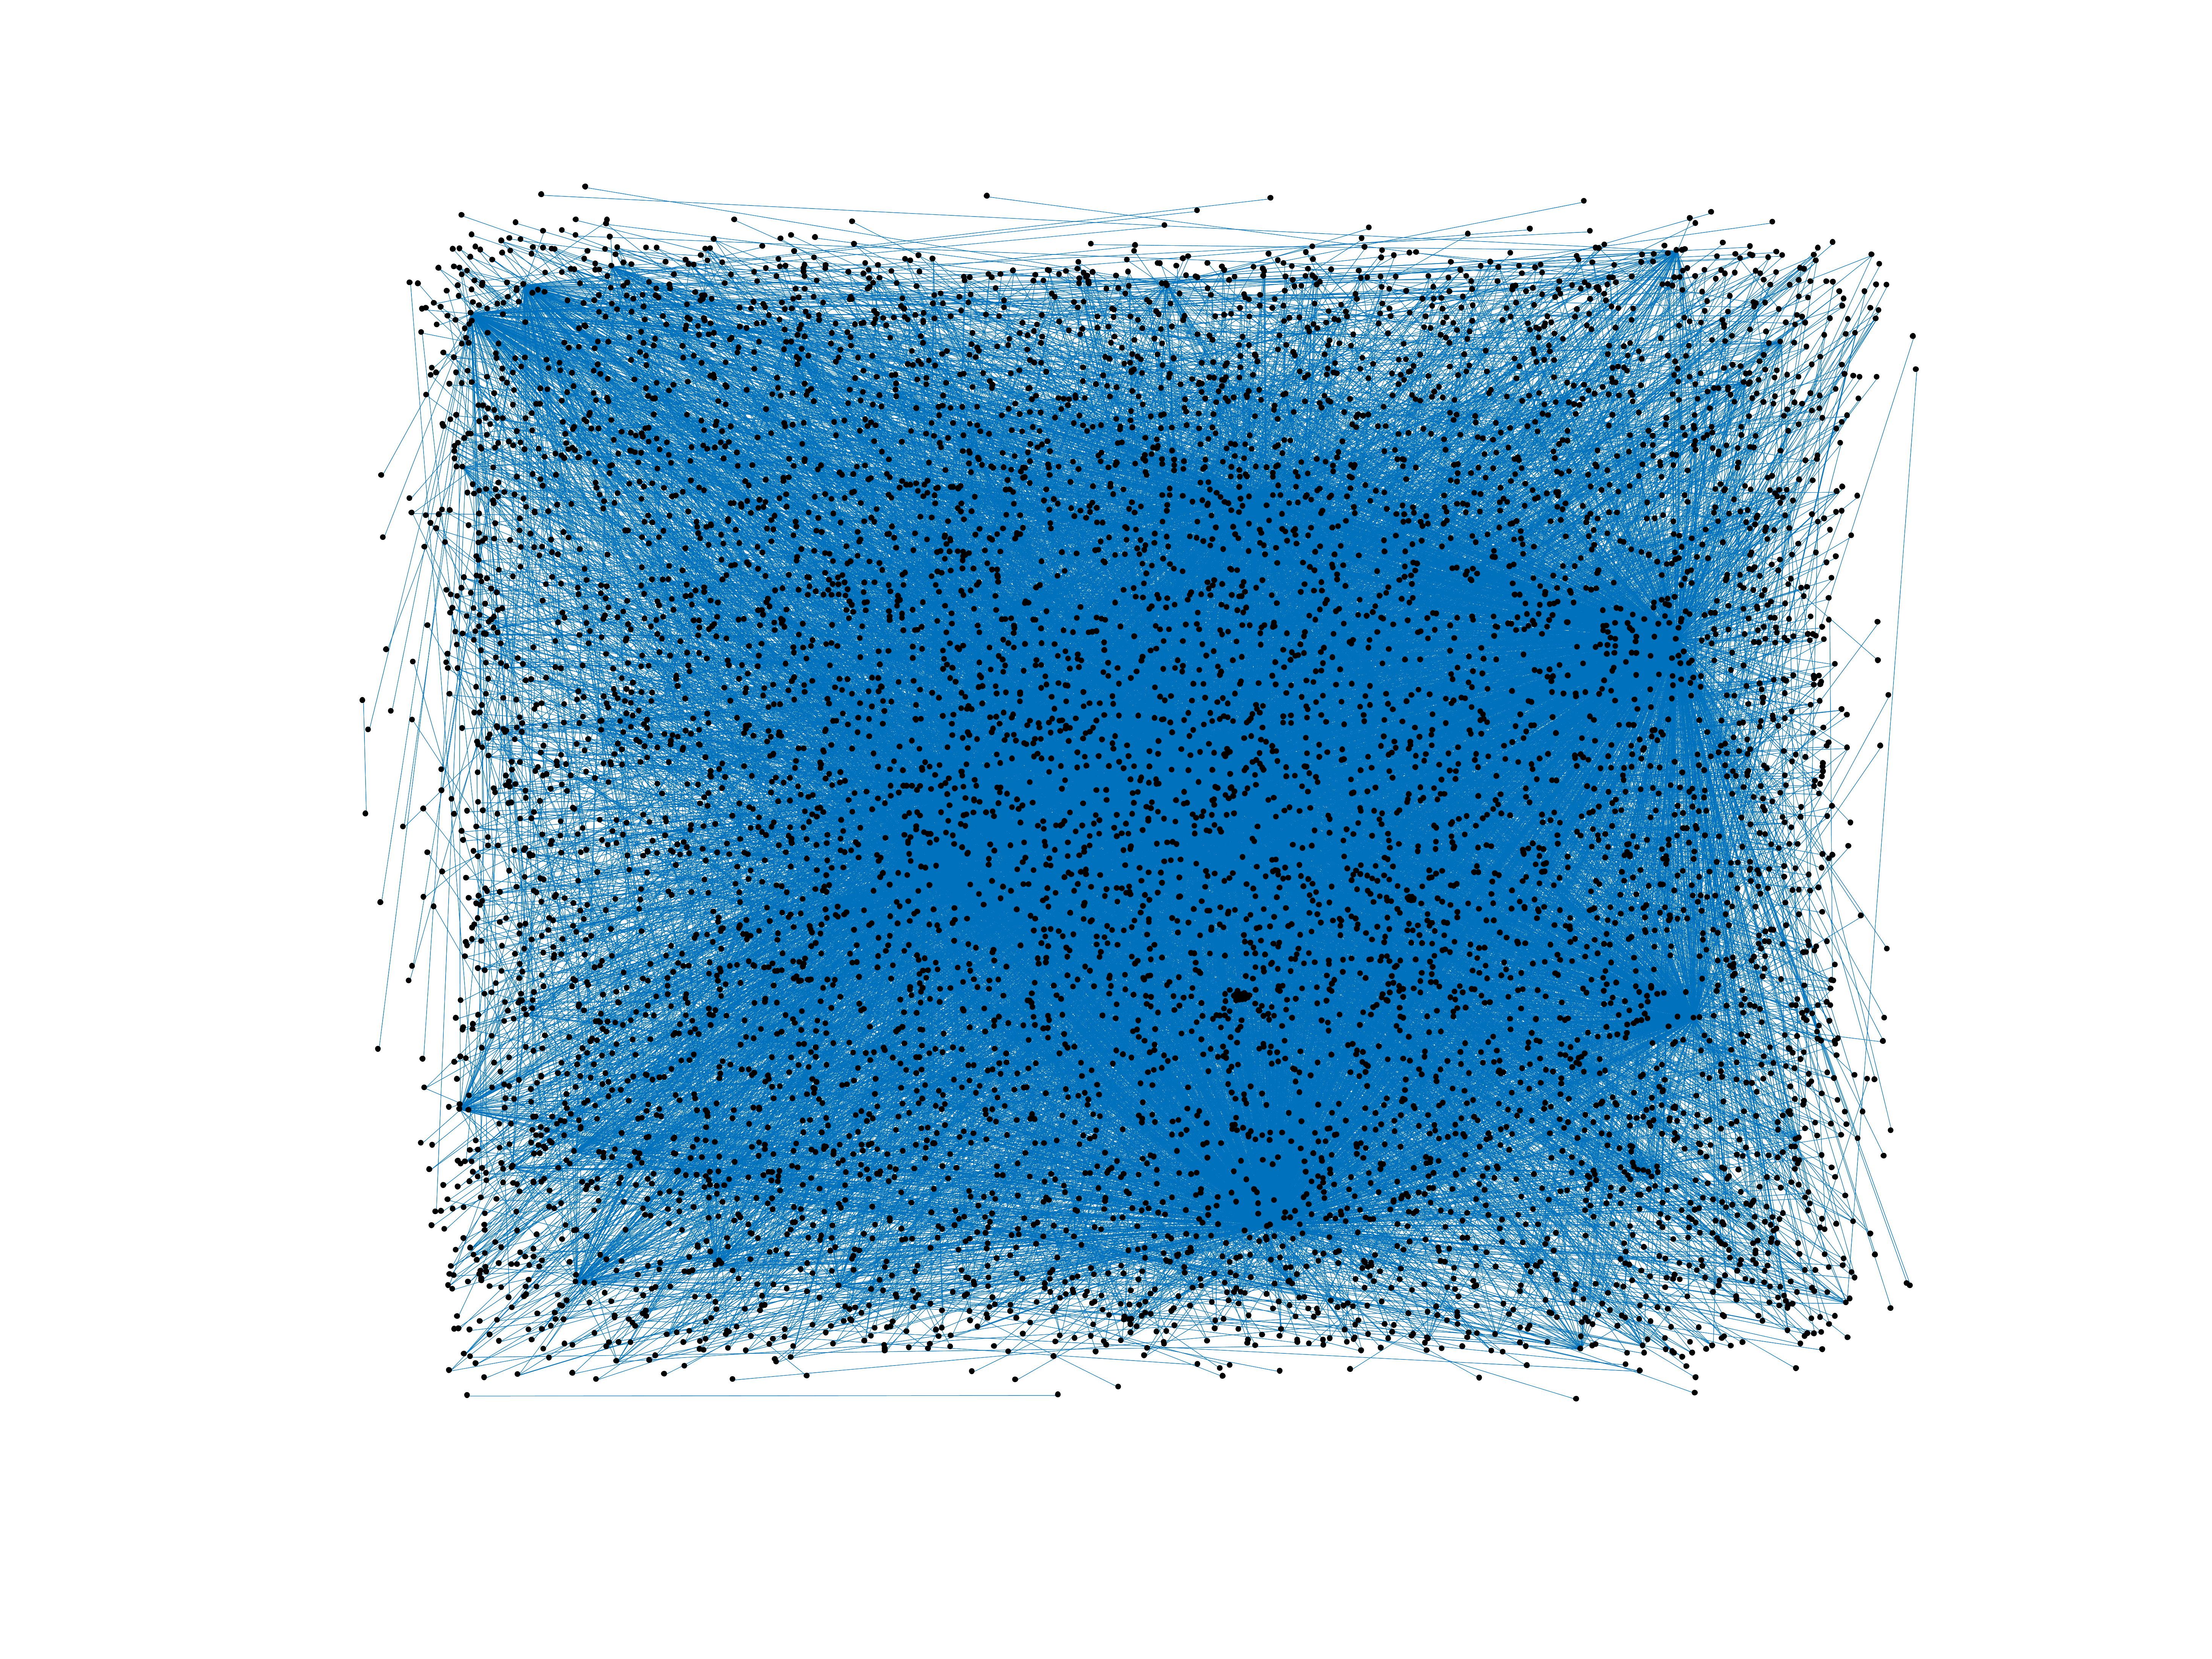
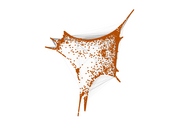
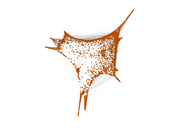
This is the bipartite edit network of the Turkish Wikibooks. It contains users
and pages from the Turkish Wikibooks, connected by edit events. Each edge
represents an edit. The dataset includes the timestamp of each edit.
Metadata
Statistics
| Size | n = | 7,395
|
| Left size | n1 = | 780
|
| Right size | n2 = | 6,615
|
| Volume | m = | 25,452
|
| Unique edge count | m̿ = | 12,504
|
| Wedge count | s = | 5,169,583
|
| Claw count | z = | 2,214,983,477
|
| Cross count | x = | 779,598,807,566
|
| Square count | q = | 1,427,123
|
| 4-Tour count | T4 = | 32,127,692
|
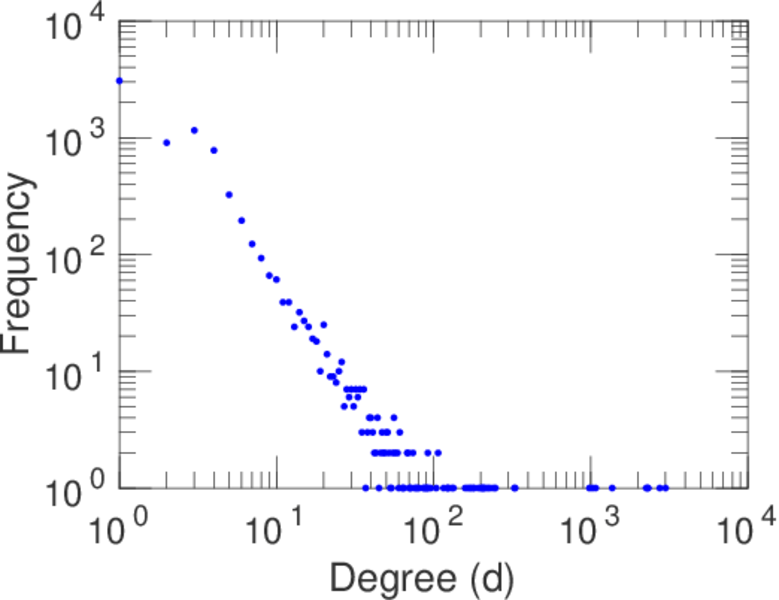
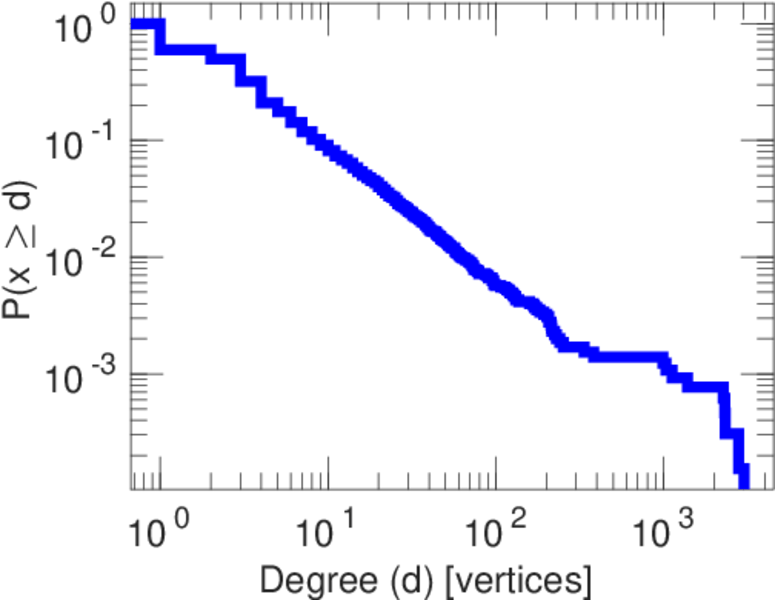
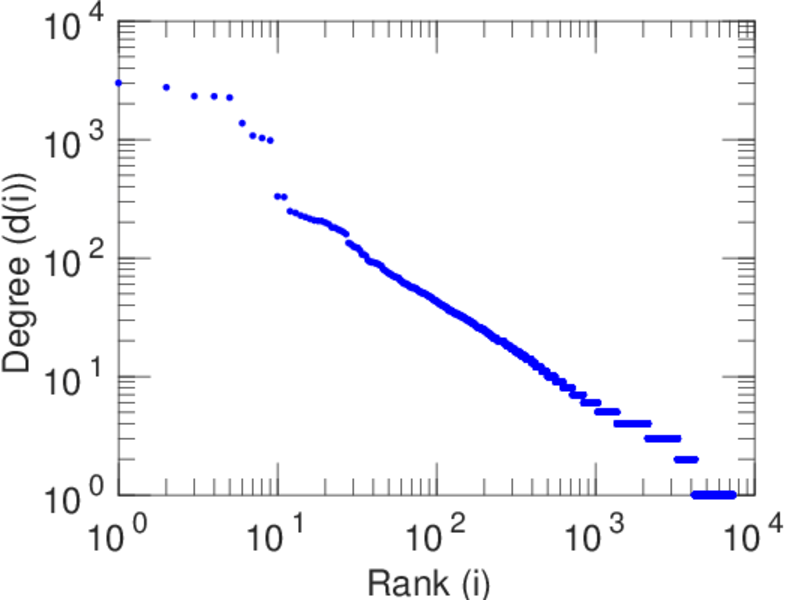
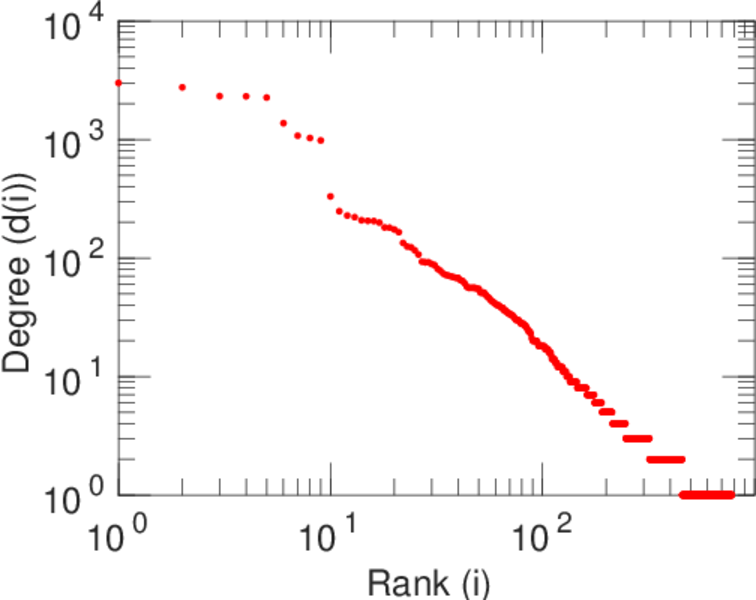
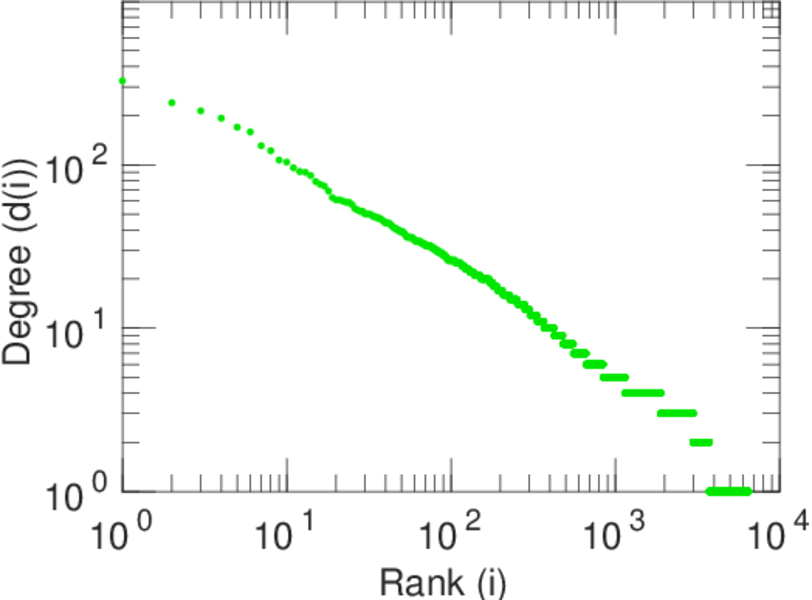
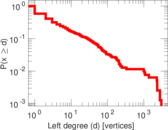
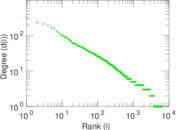
| Maximum degree | dmax = | 3,001
|
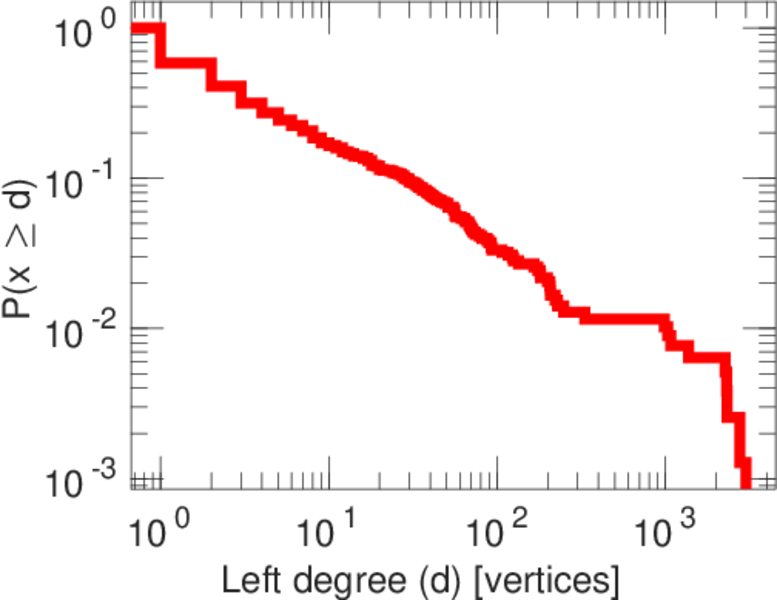
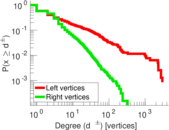
| Maximum left degree | d1max = | 3,001
|
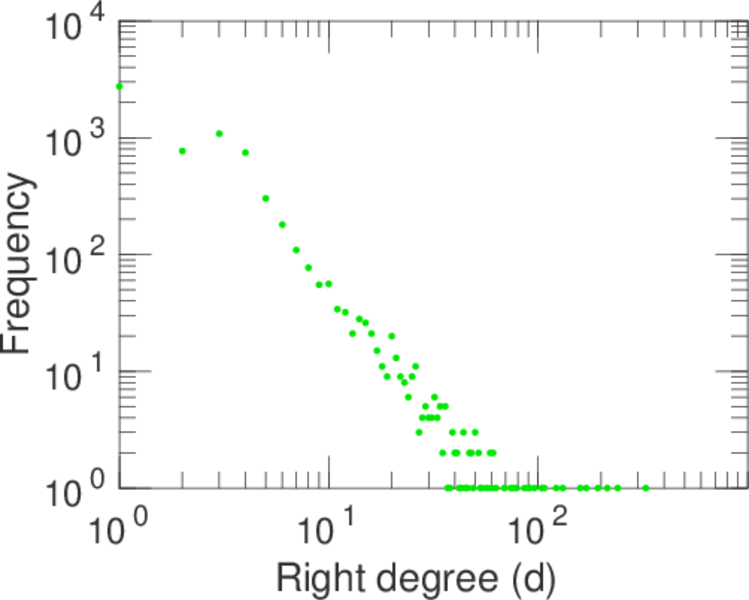
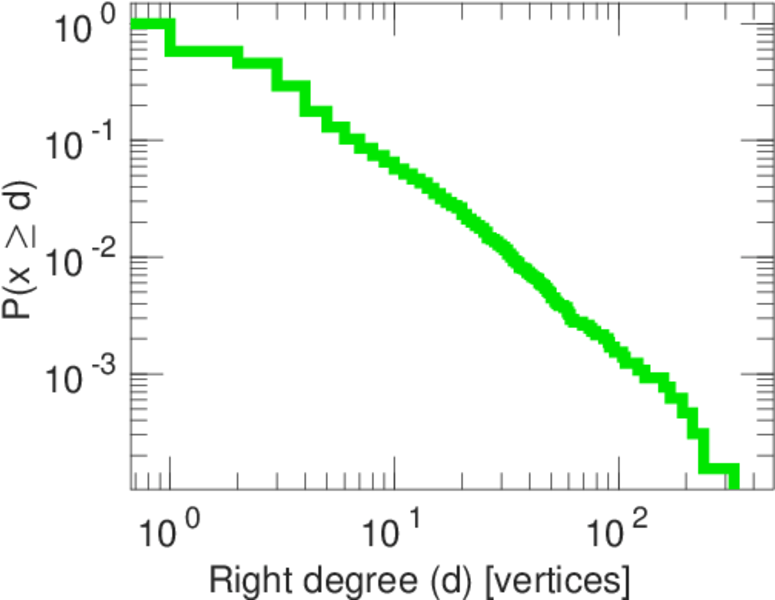
| Maximum right degree | d2max = | 327
|
| Average degree | d = | 6.883 57
|
| Average left degree | d1 = | 32.630 8
|
| Average right degree | d2 = | 3.847 62
|
| Fill | p = | 0.002 423 40
|
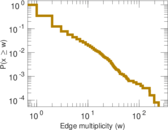
| Average edge multiplicity | m̃ = | 2.035 51
|
| Size of LCC | N = | 6,802
|
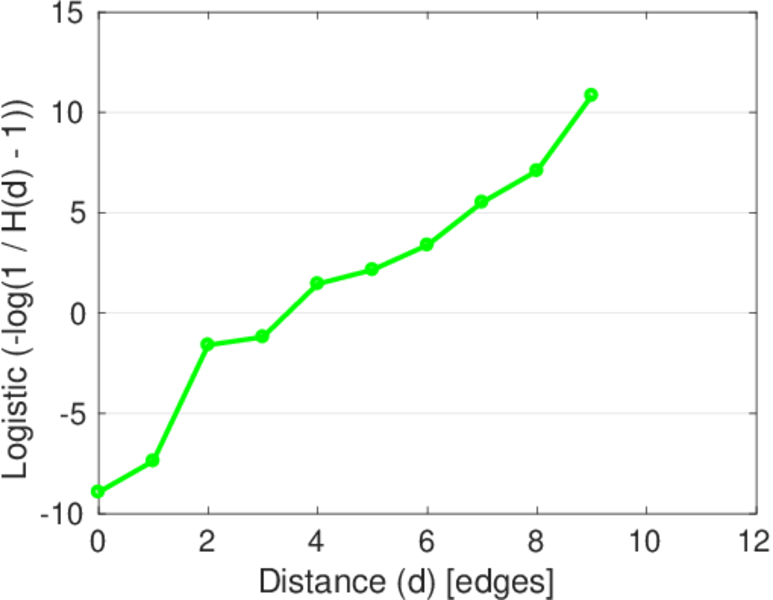
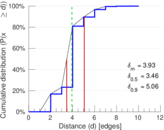
| Diameter | δ = | 11
|
| 50-Percentile effective diameter | δ0.5 = | 3.463 05
|
| 90-Percentile effective diameter | δ0.9 = | 5.057 86
|
| Median distance | δM = | 4
|
| Mean distance | δm = | 3.929 95
|
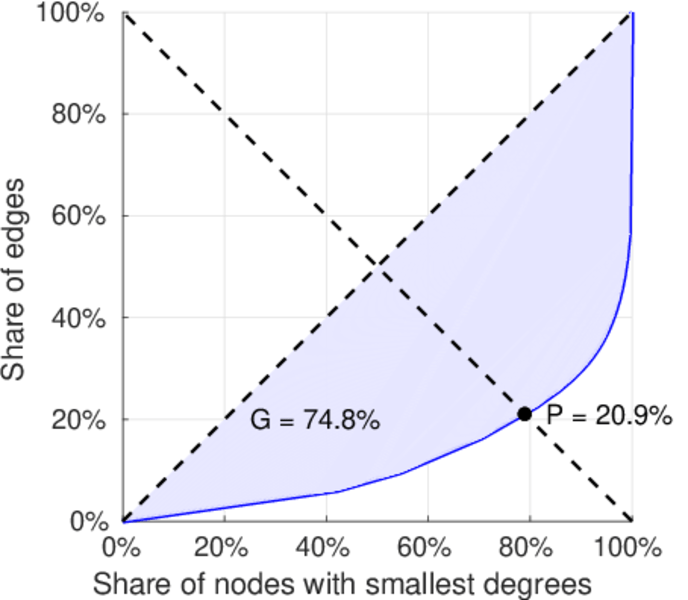
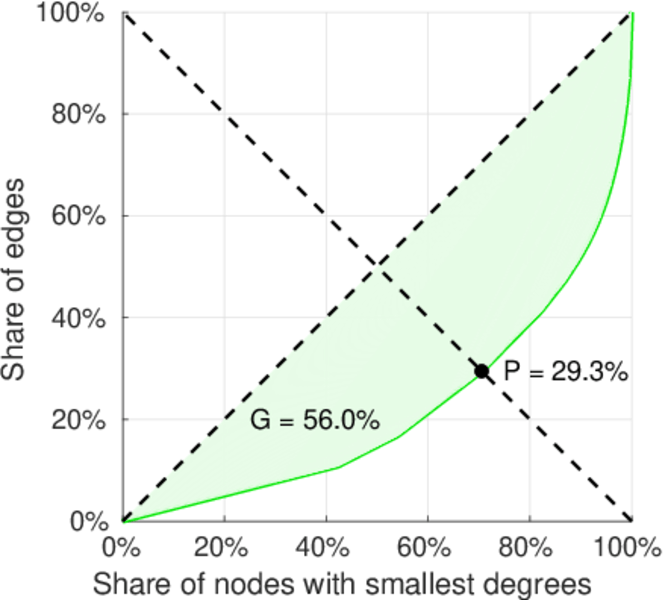
| Gini coefficient | G = | 0.758 450
|
| Balanced inequality ratio | P = | 0.203 697
|
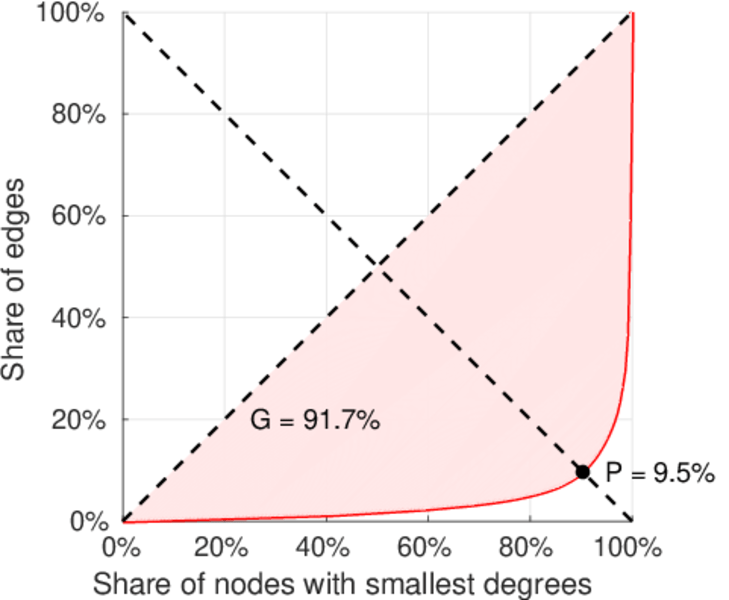
| Left balanced inequality ratio | P1 = | 0.095 041 6
|
| Right balanced inequality ratio | P2 = | 0.293 219
|
| Relative edge distribution entropy | Her = | 0.767 932
|
| Power law exponent | γ = | 2.997 58
|
| Tail power law exponent | γt = | 1.861 00
|
| Tail power law exponent with p | γ3 = | 1.861 00
|
| p-value | p = | 0.236 000
|
| Left tail power law exponent with p | γ3,1 = | 1.731 00
|
| Left p-value | p1 = | 0.606 000
|
| Right tail power law exponent with p | γ3,2 = | 4.051 00
|
| Right p-value | p2 = | 0.109 000
|
| Degree assortativity | ρ = | −0.175 147
|
| Degree assortativity p-value | pρ = | 1.058 96 × 10−86
|
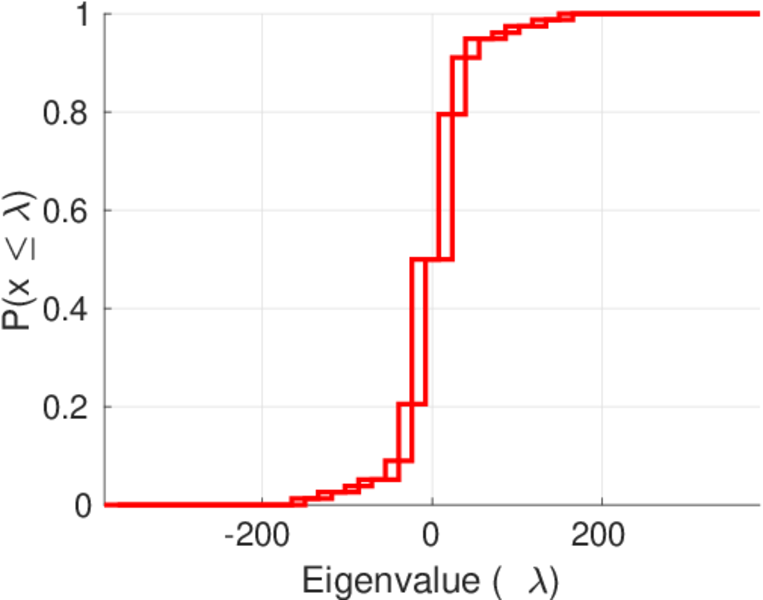
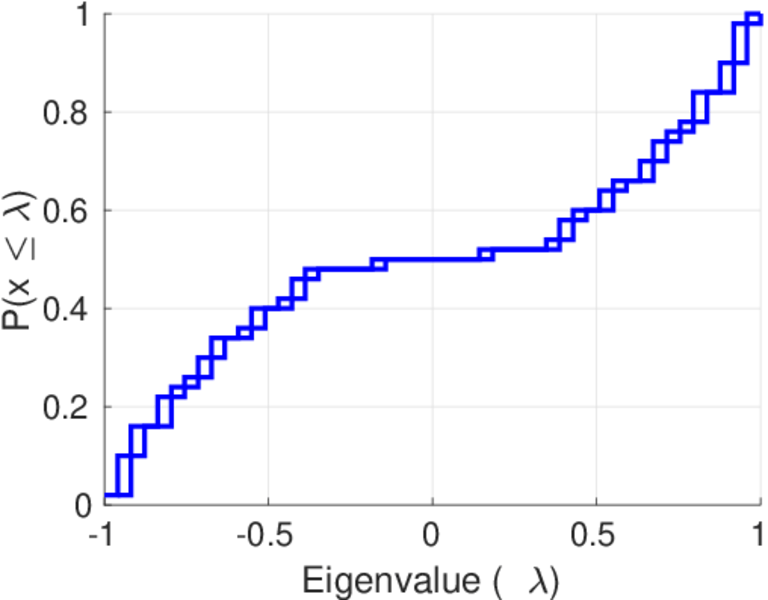
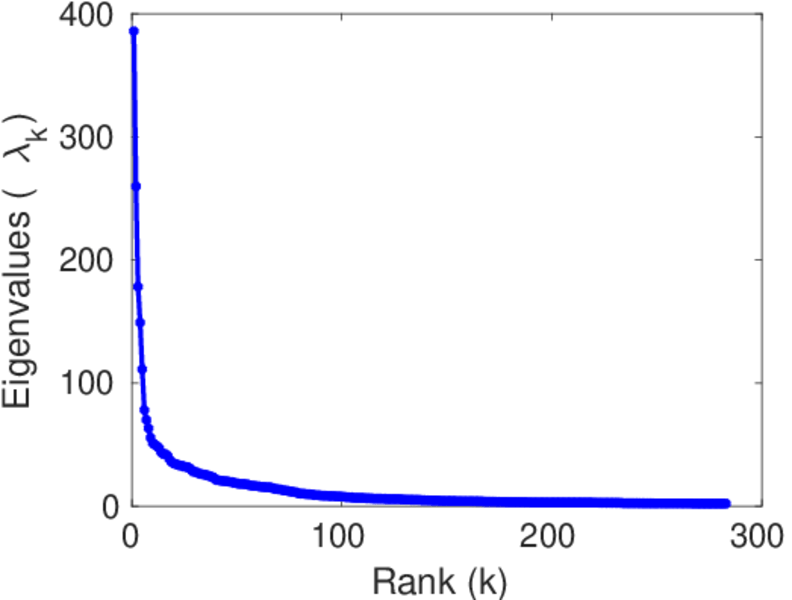
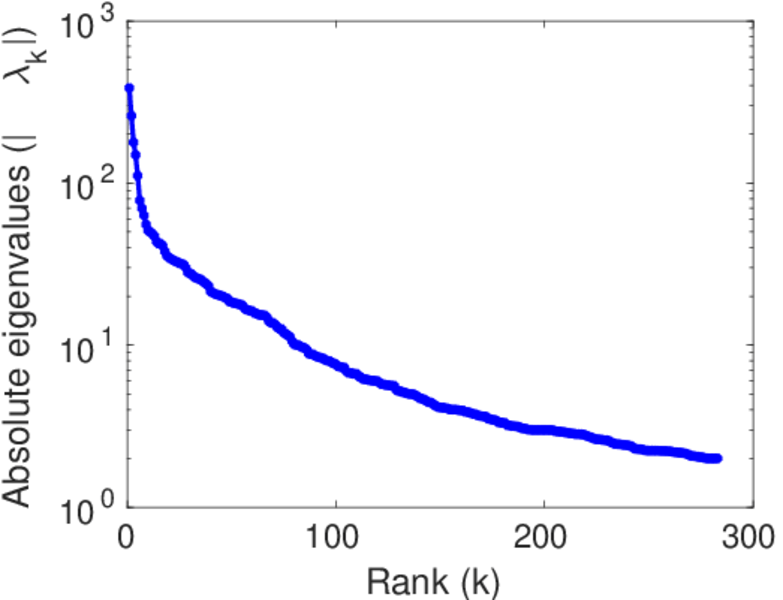
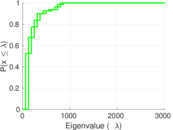
| Spectral norm | α = | 385.723
|
| Algebraic connectivity | a = | 0.032 982 0
|
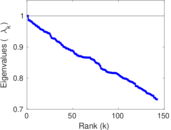
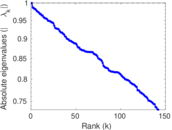
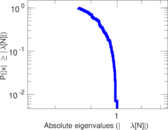
| Spectral separation | |λ1[A] / λ2[A]| = | 1.485 22
|
| Controllability | C = | 5,925
|
| Relative controllability | Cr = | 0.815 217
|
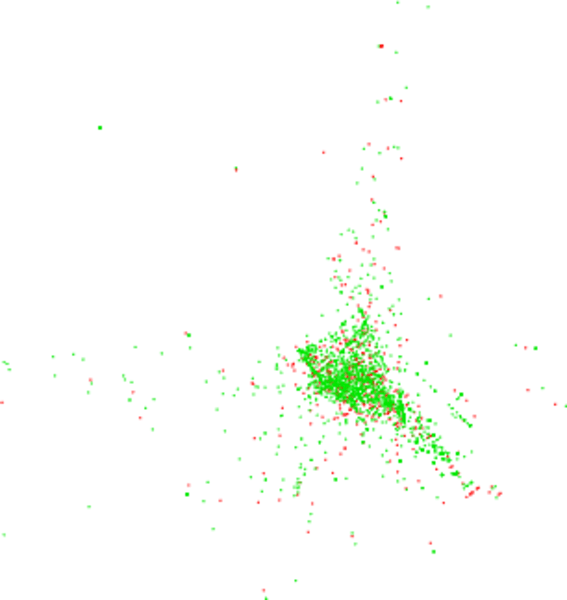
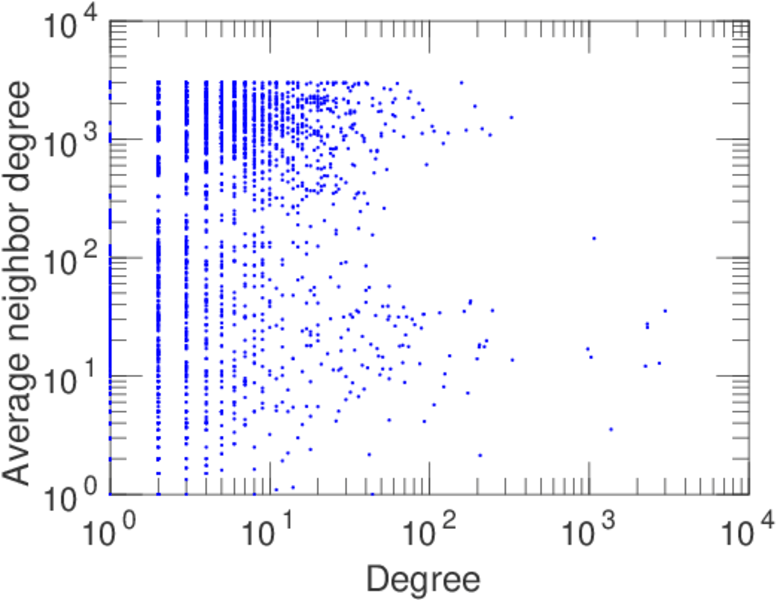
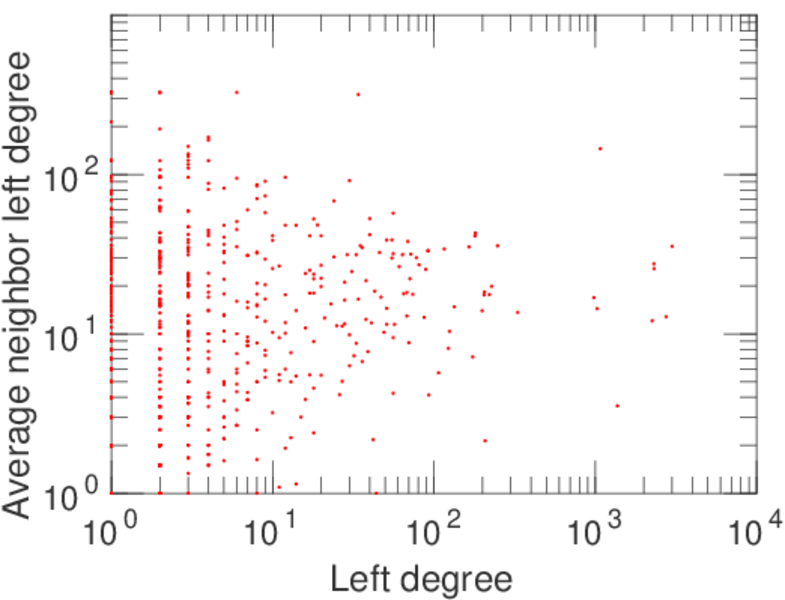
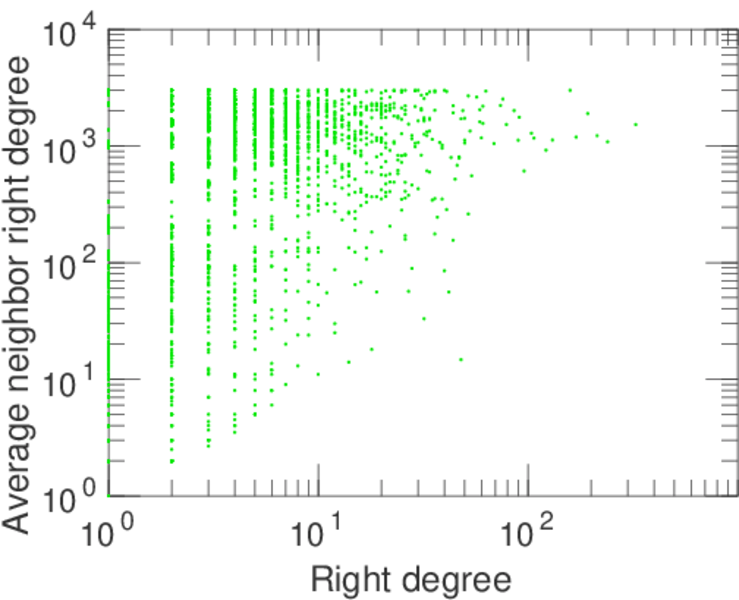
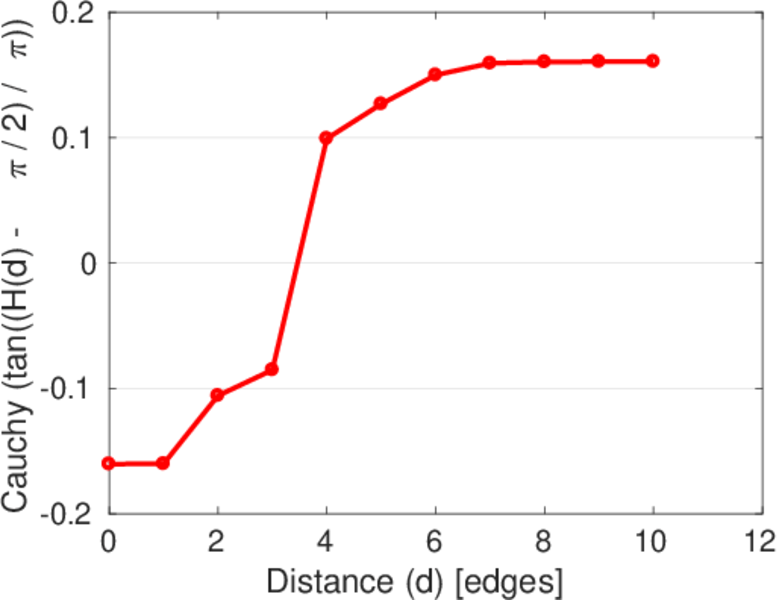
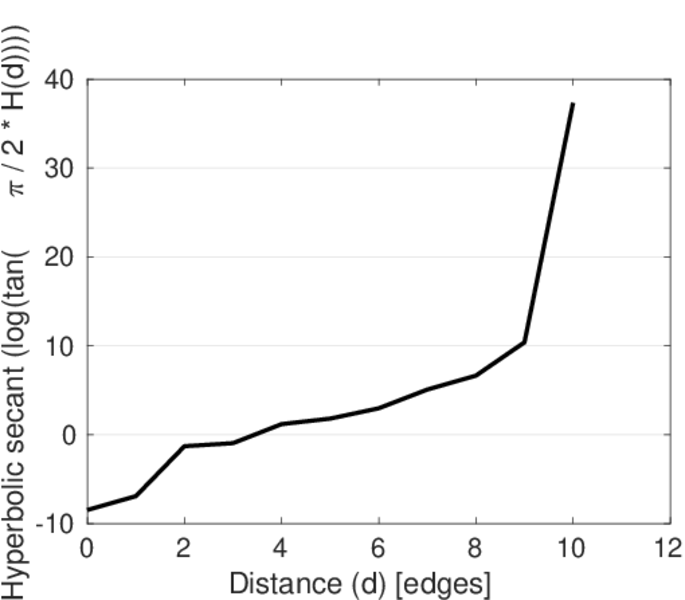
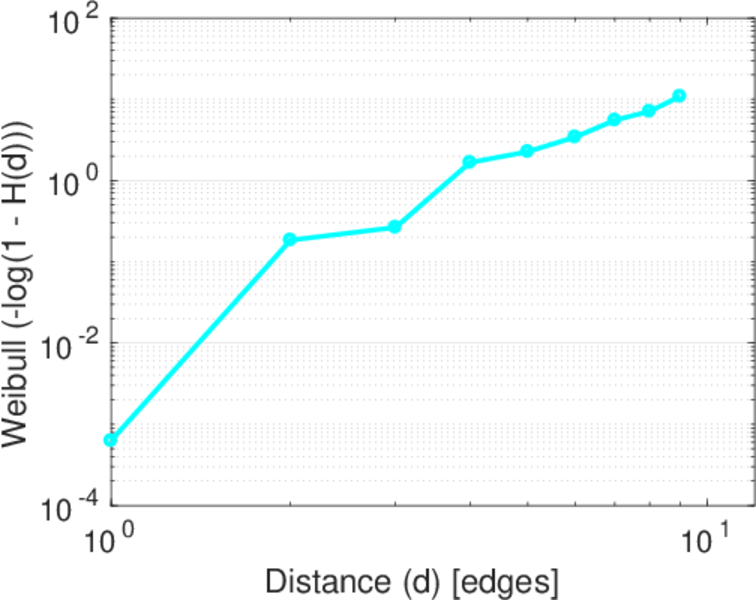
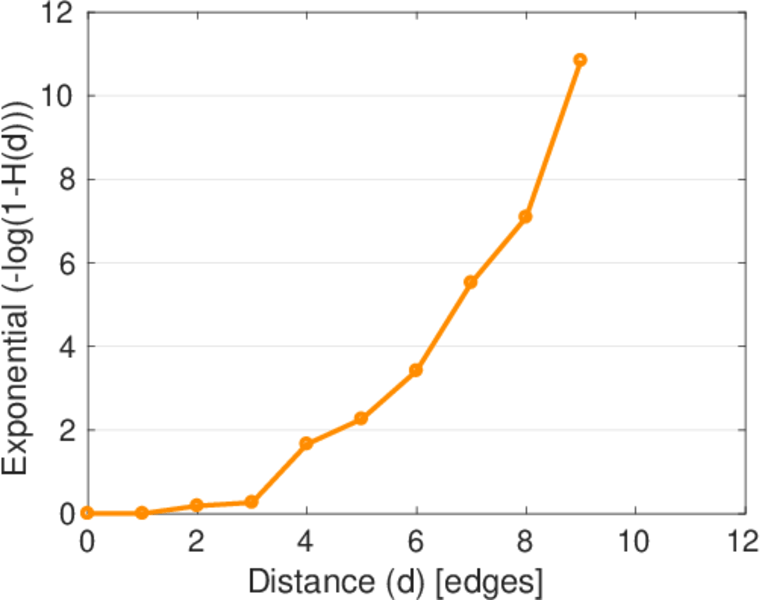
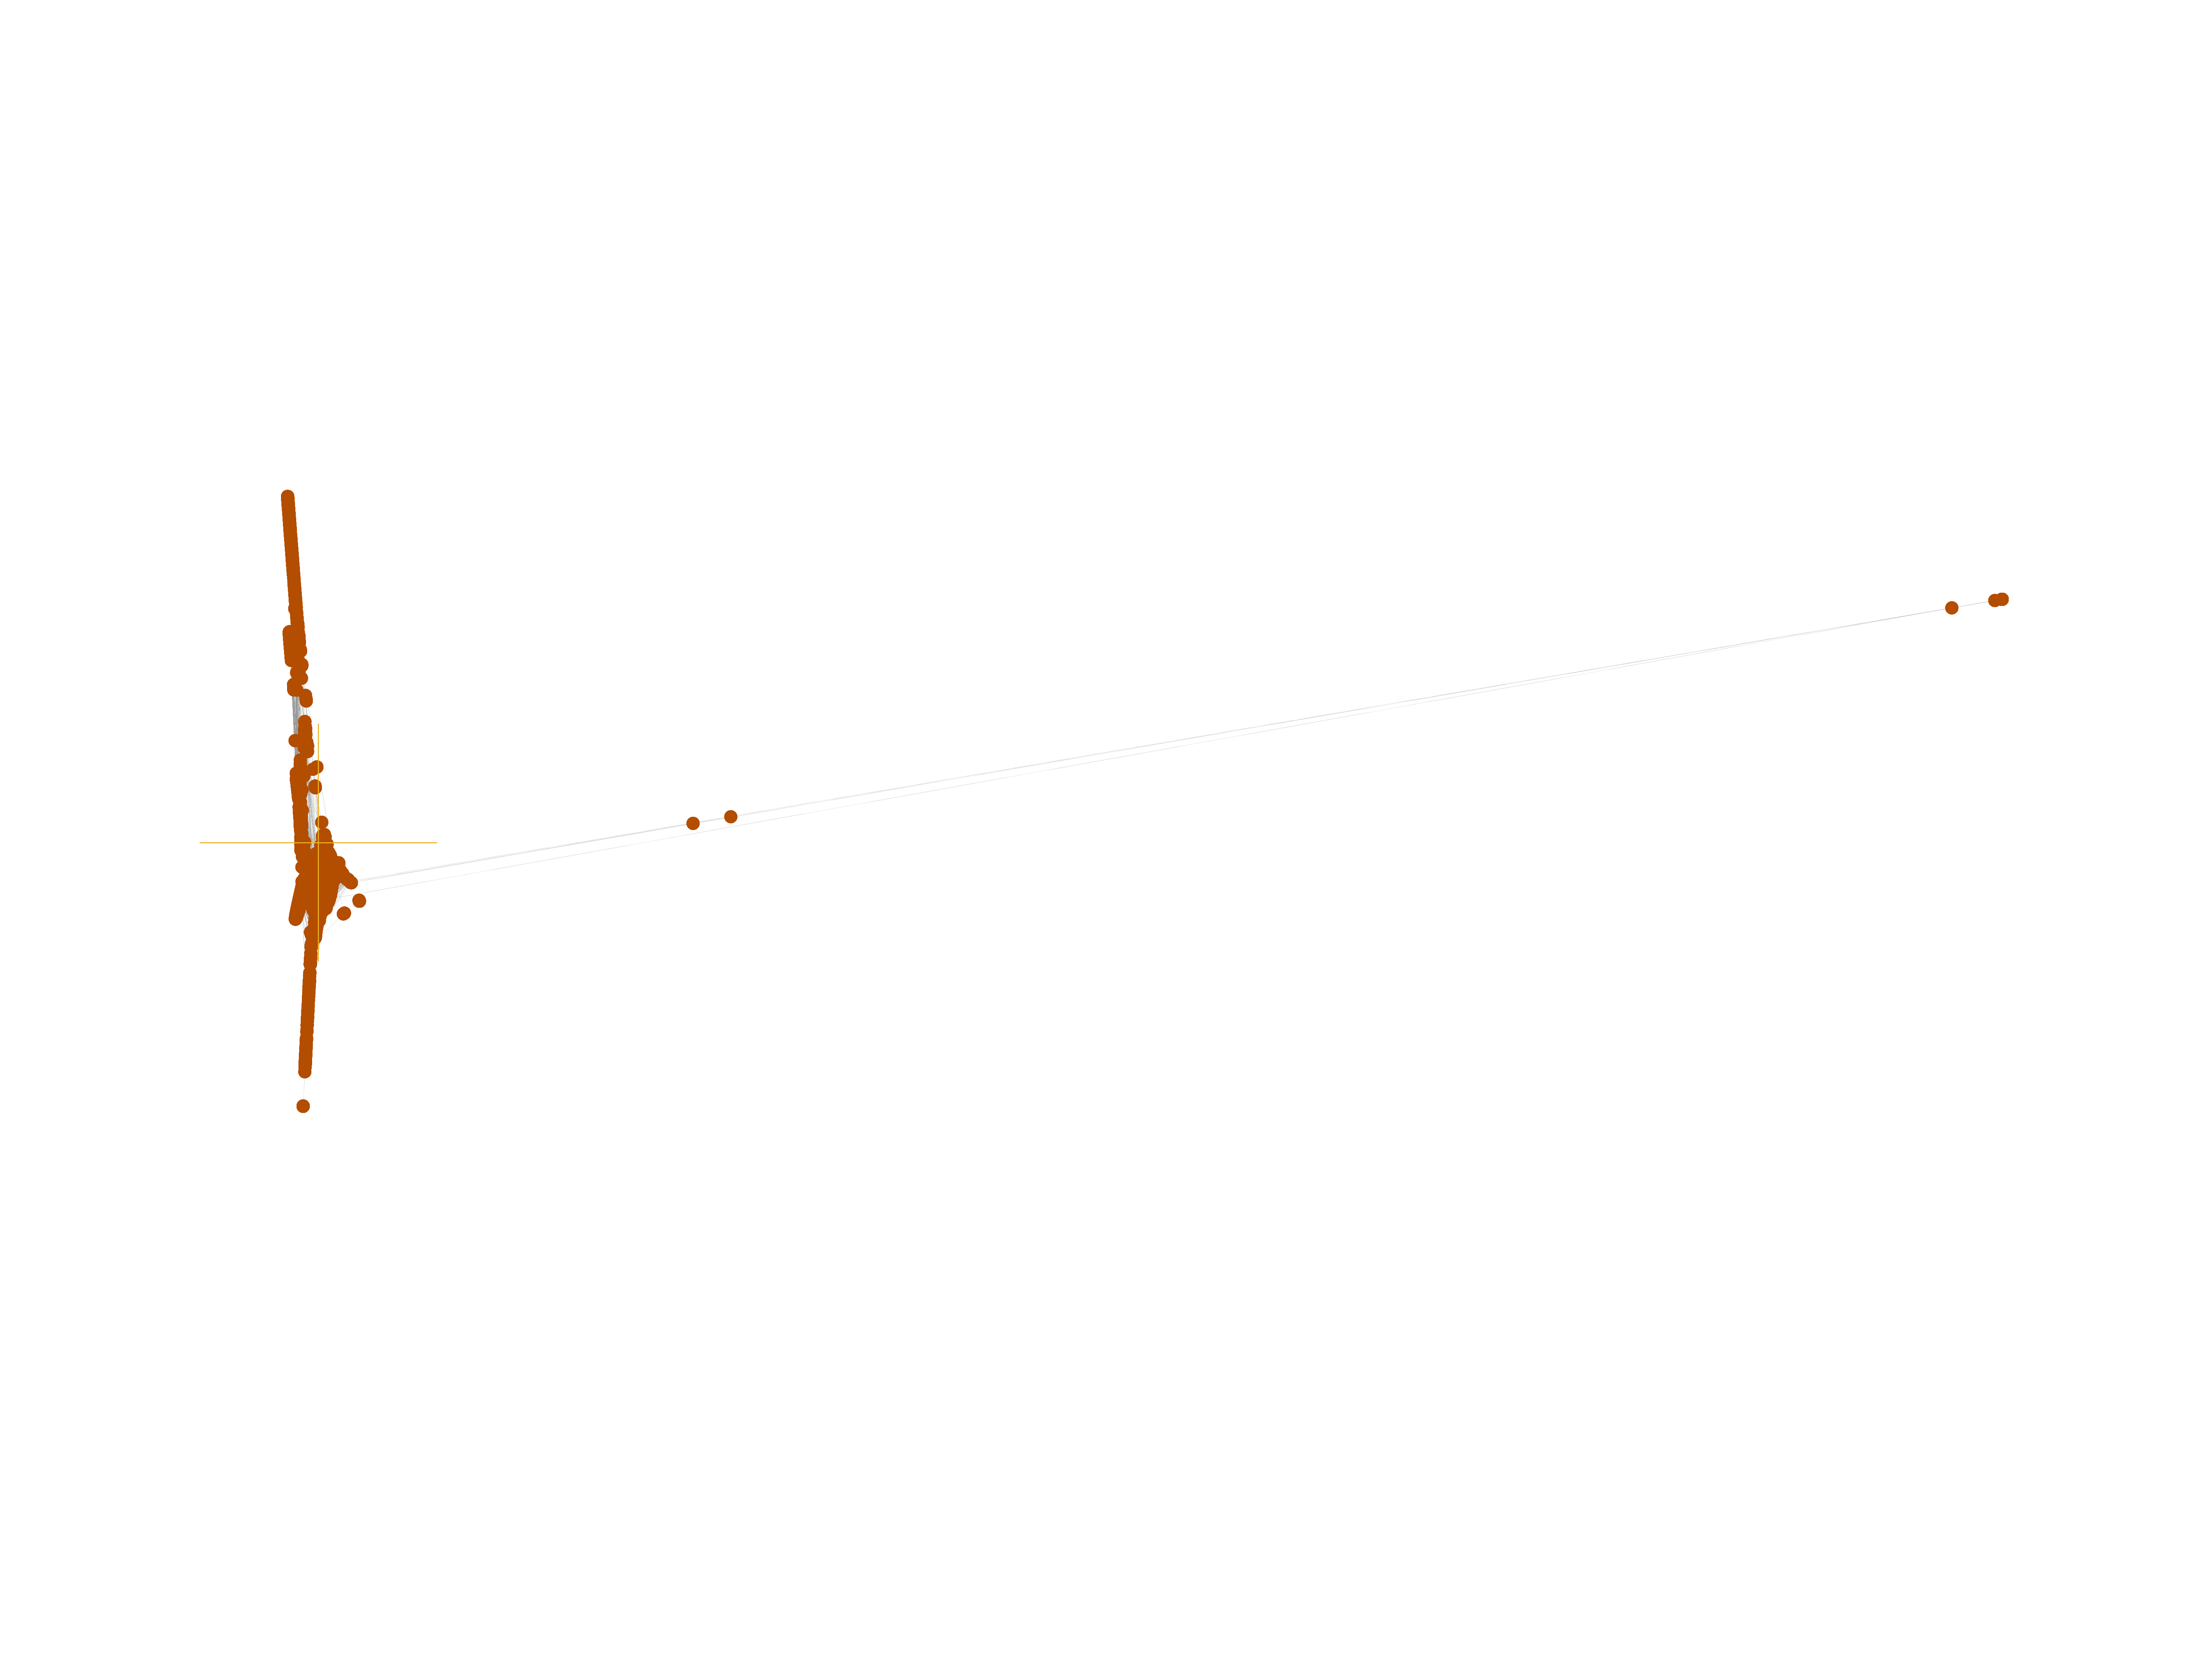
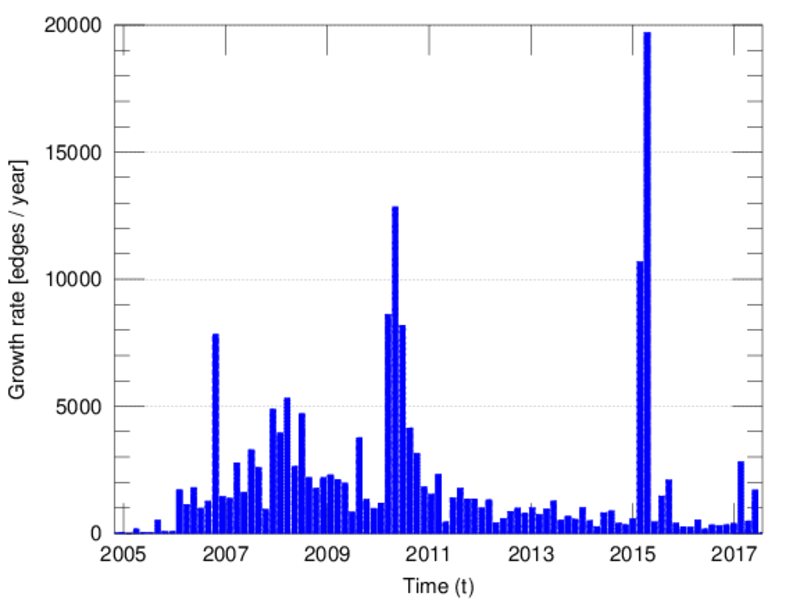
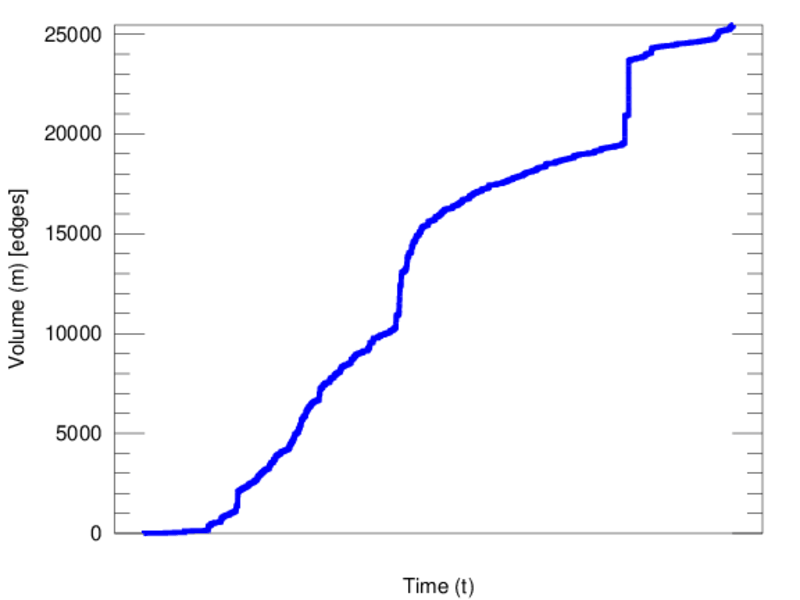
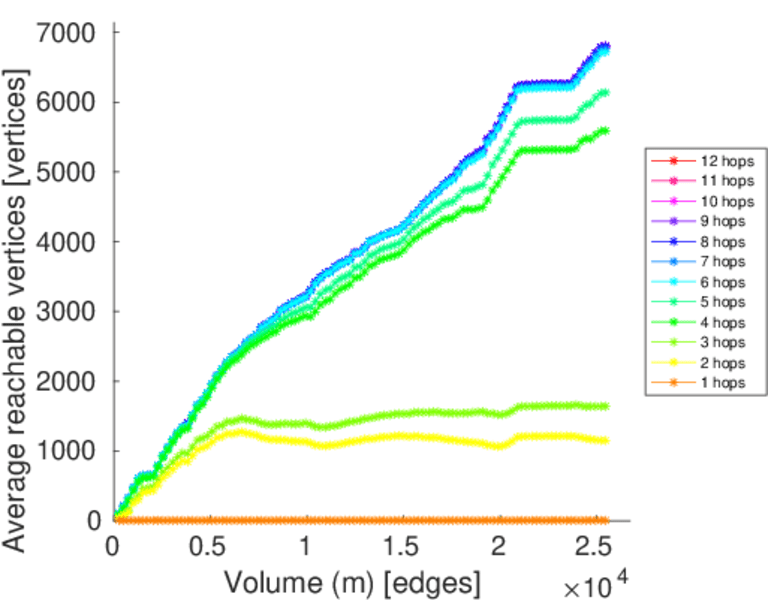
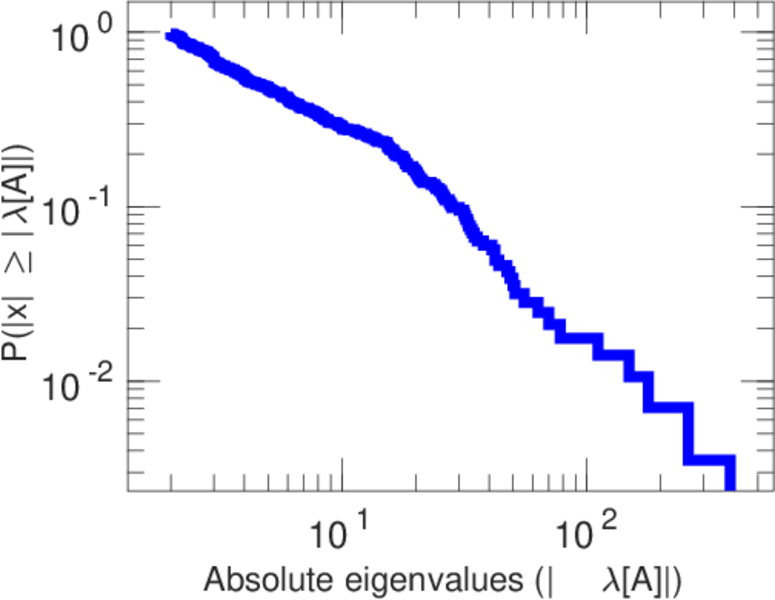
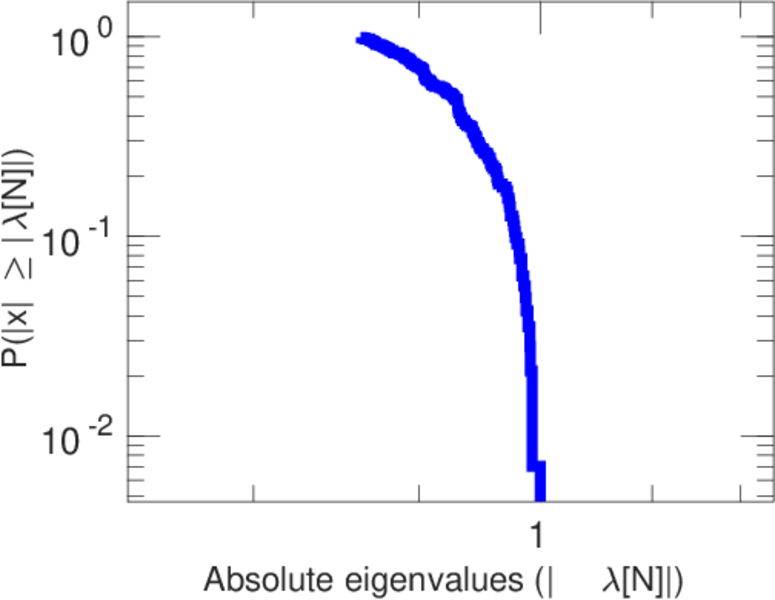
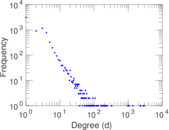
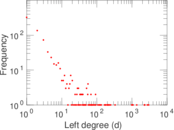
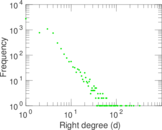
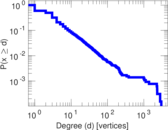
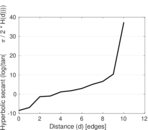
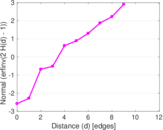
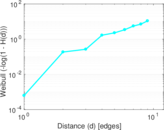
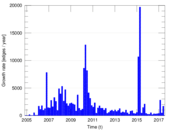
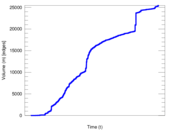
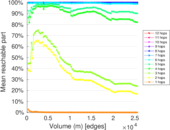
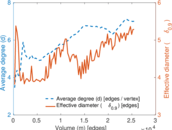
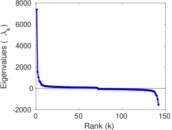
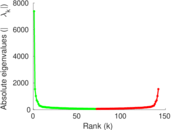
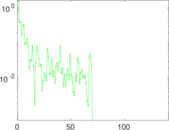
Plots


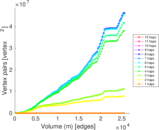
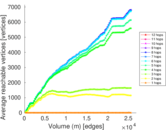
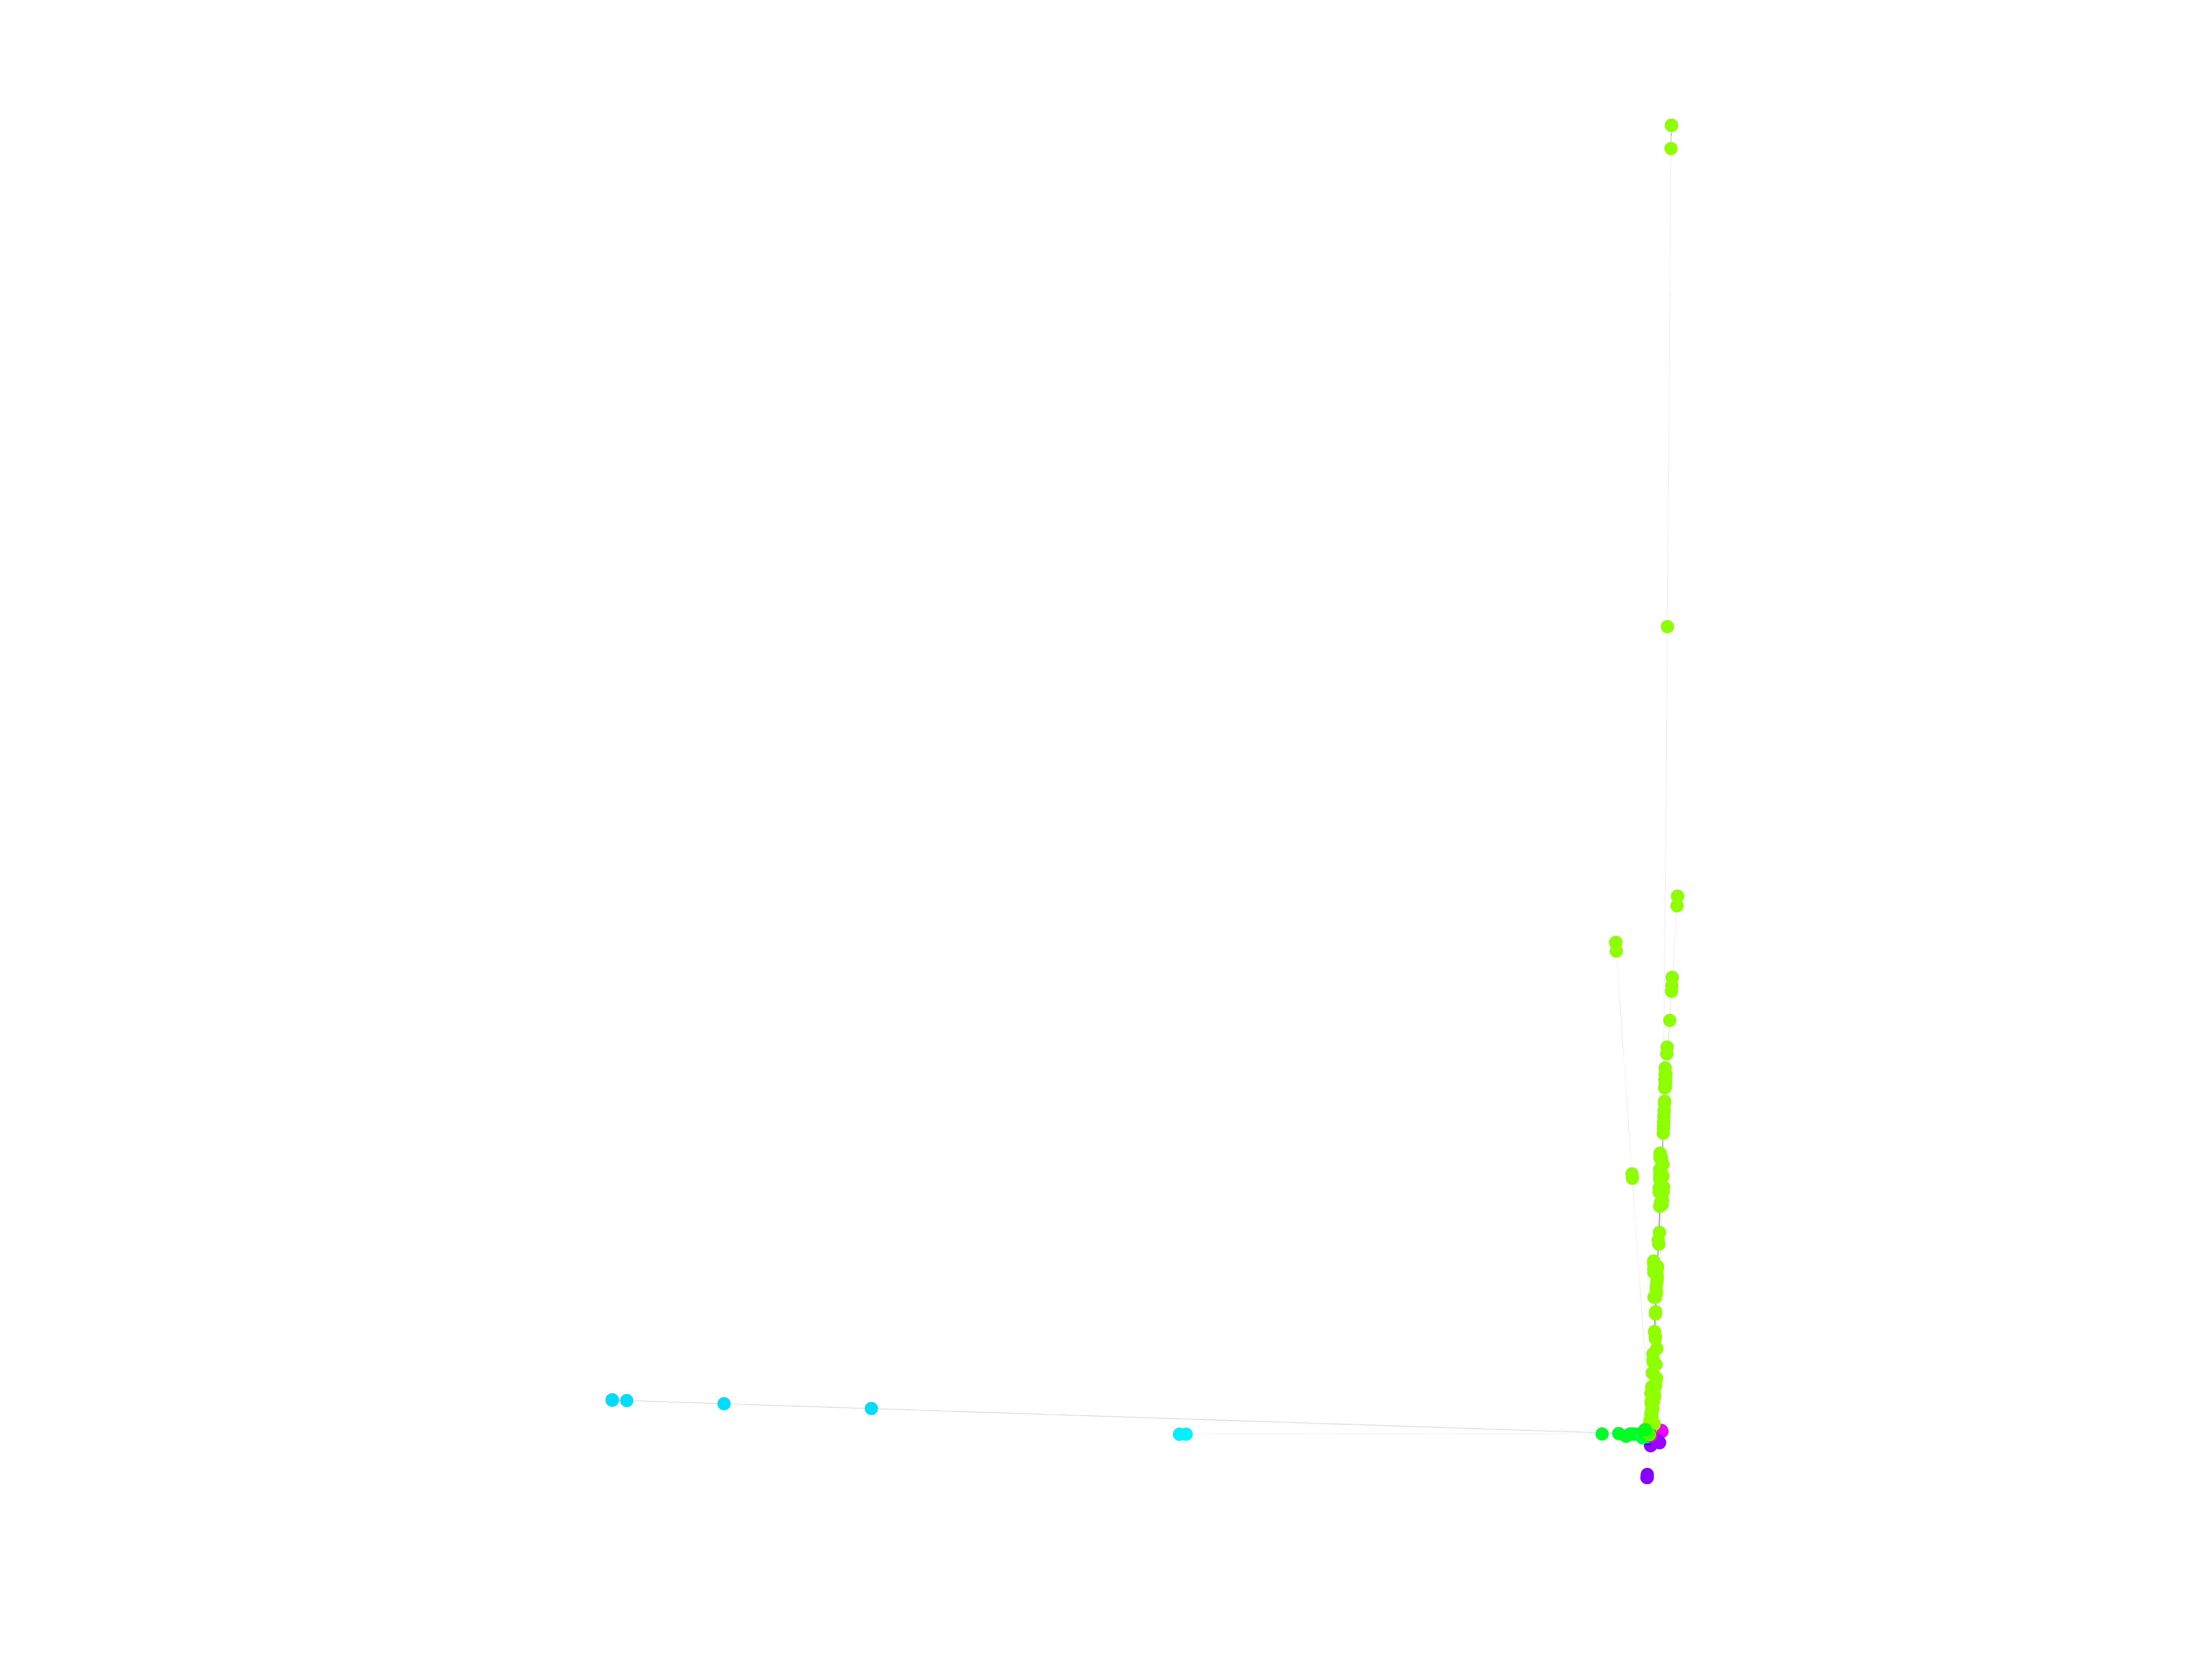
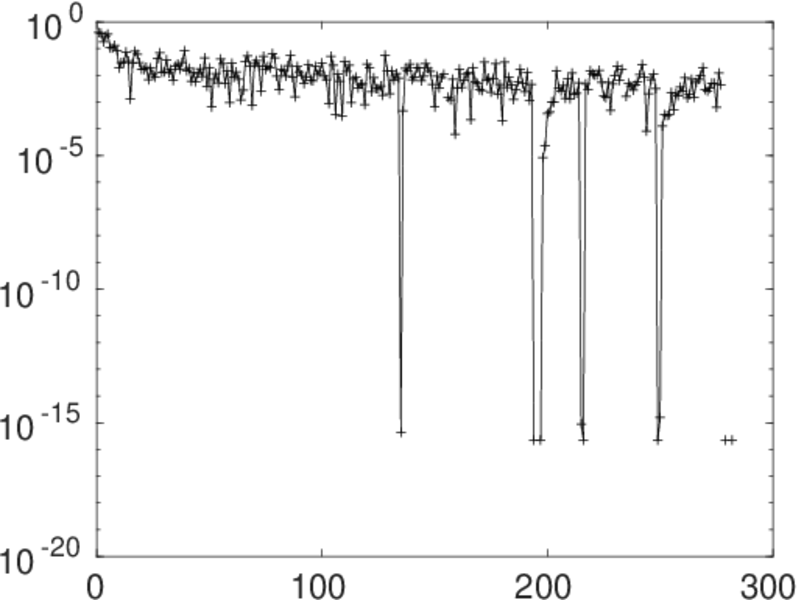
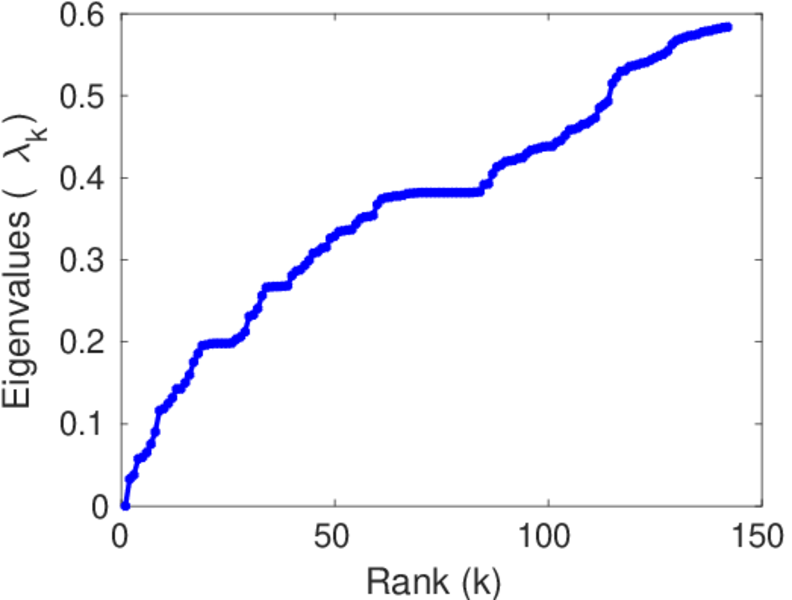
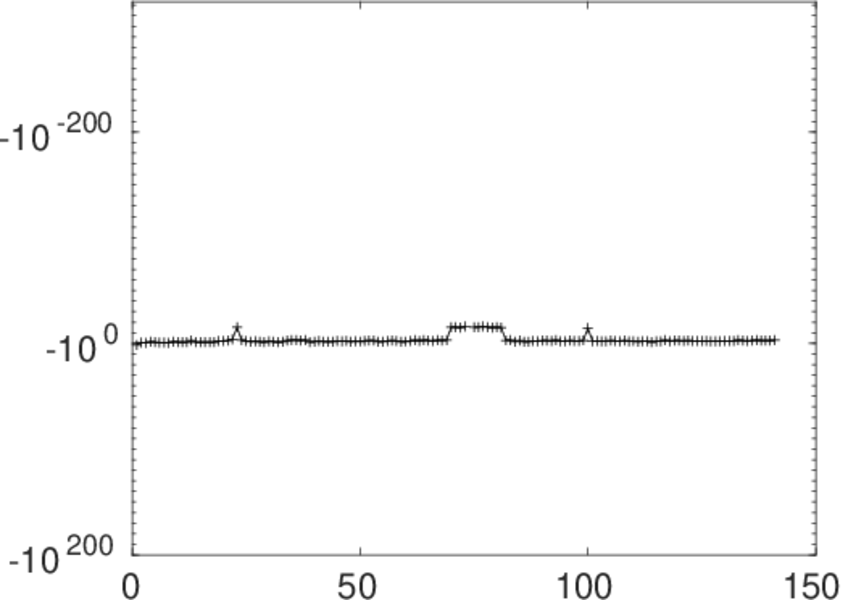
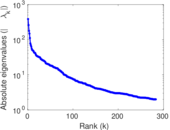
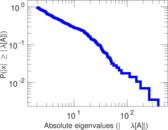
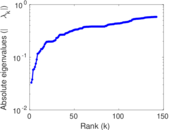
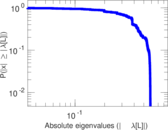
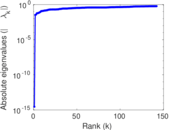
Matrix decompositions plots


Downloads
References
|
[1]
|
Jérôme Kunegis.
KONECT – The Koblenz Network Collection.
In Proc. Int. Conf. on World Wide Web Companion, pages
1343–1350, 2013.
[ http ]
|
|
[2]
|
Wikimedia Foundation.
Wikimedia downloads.
http://dumps.wikimedia.org/, January 2010.
|
 KONECT ‣ Networks ‣
Buy Me a Coffee
KONECT ‣ Networks ‣
Buy Me a Coffee