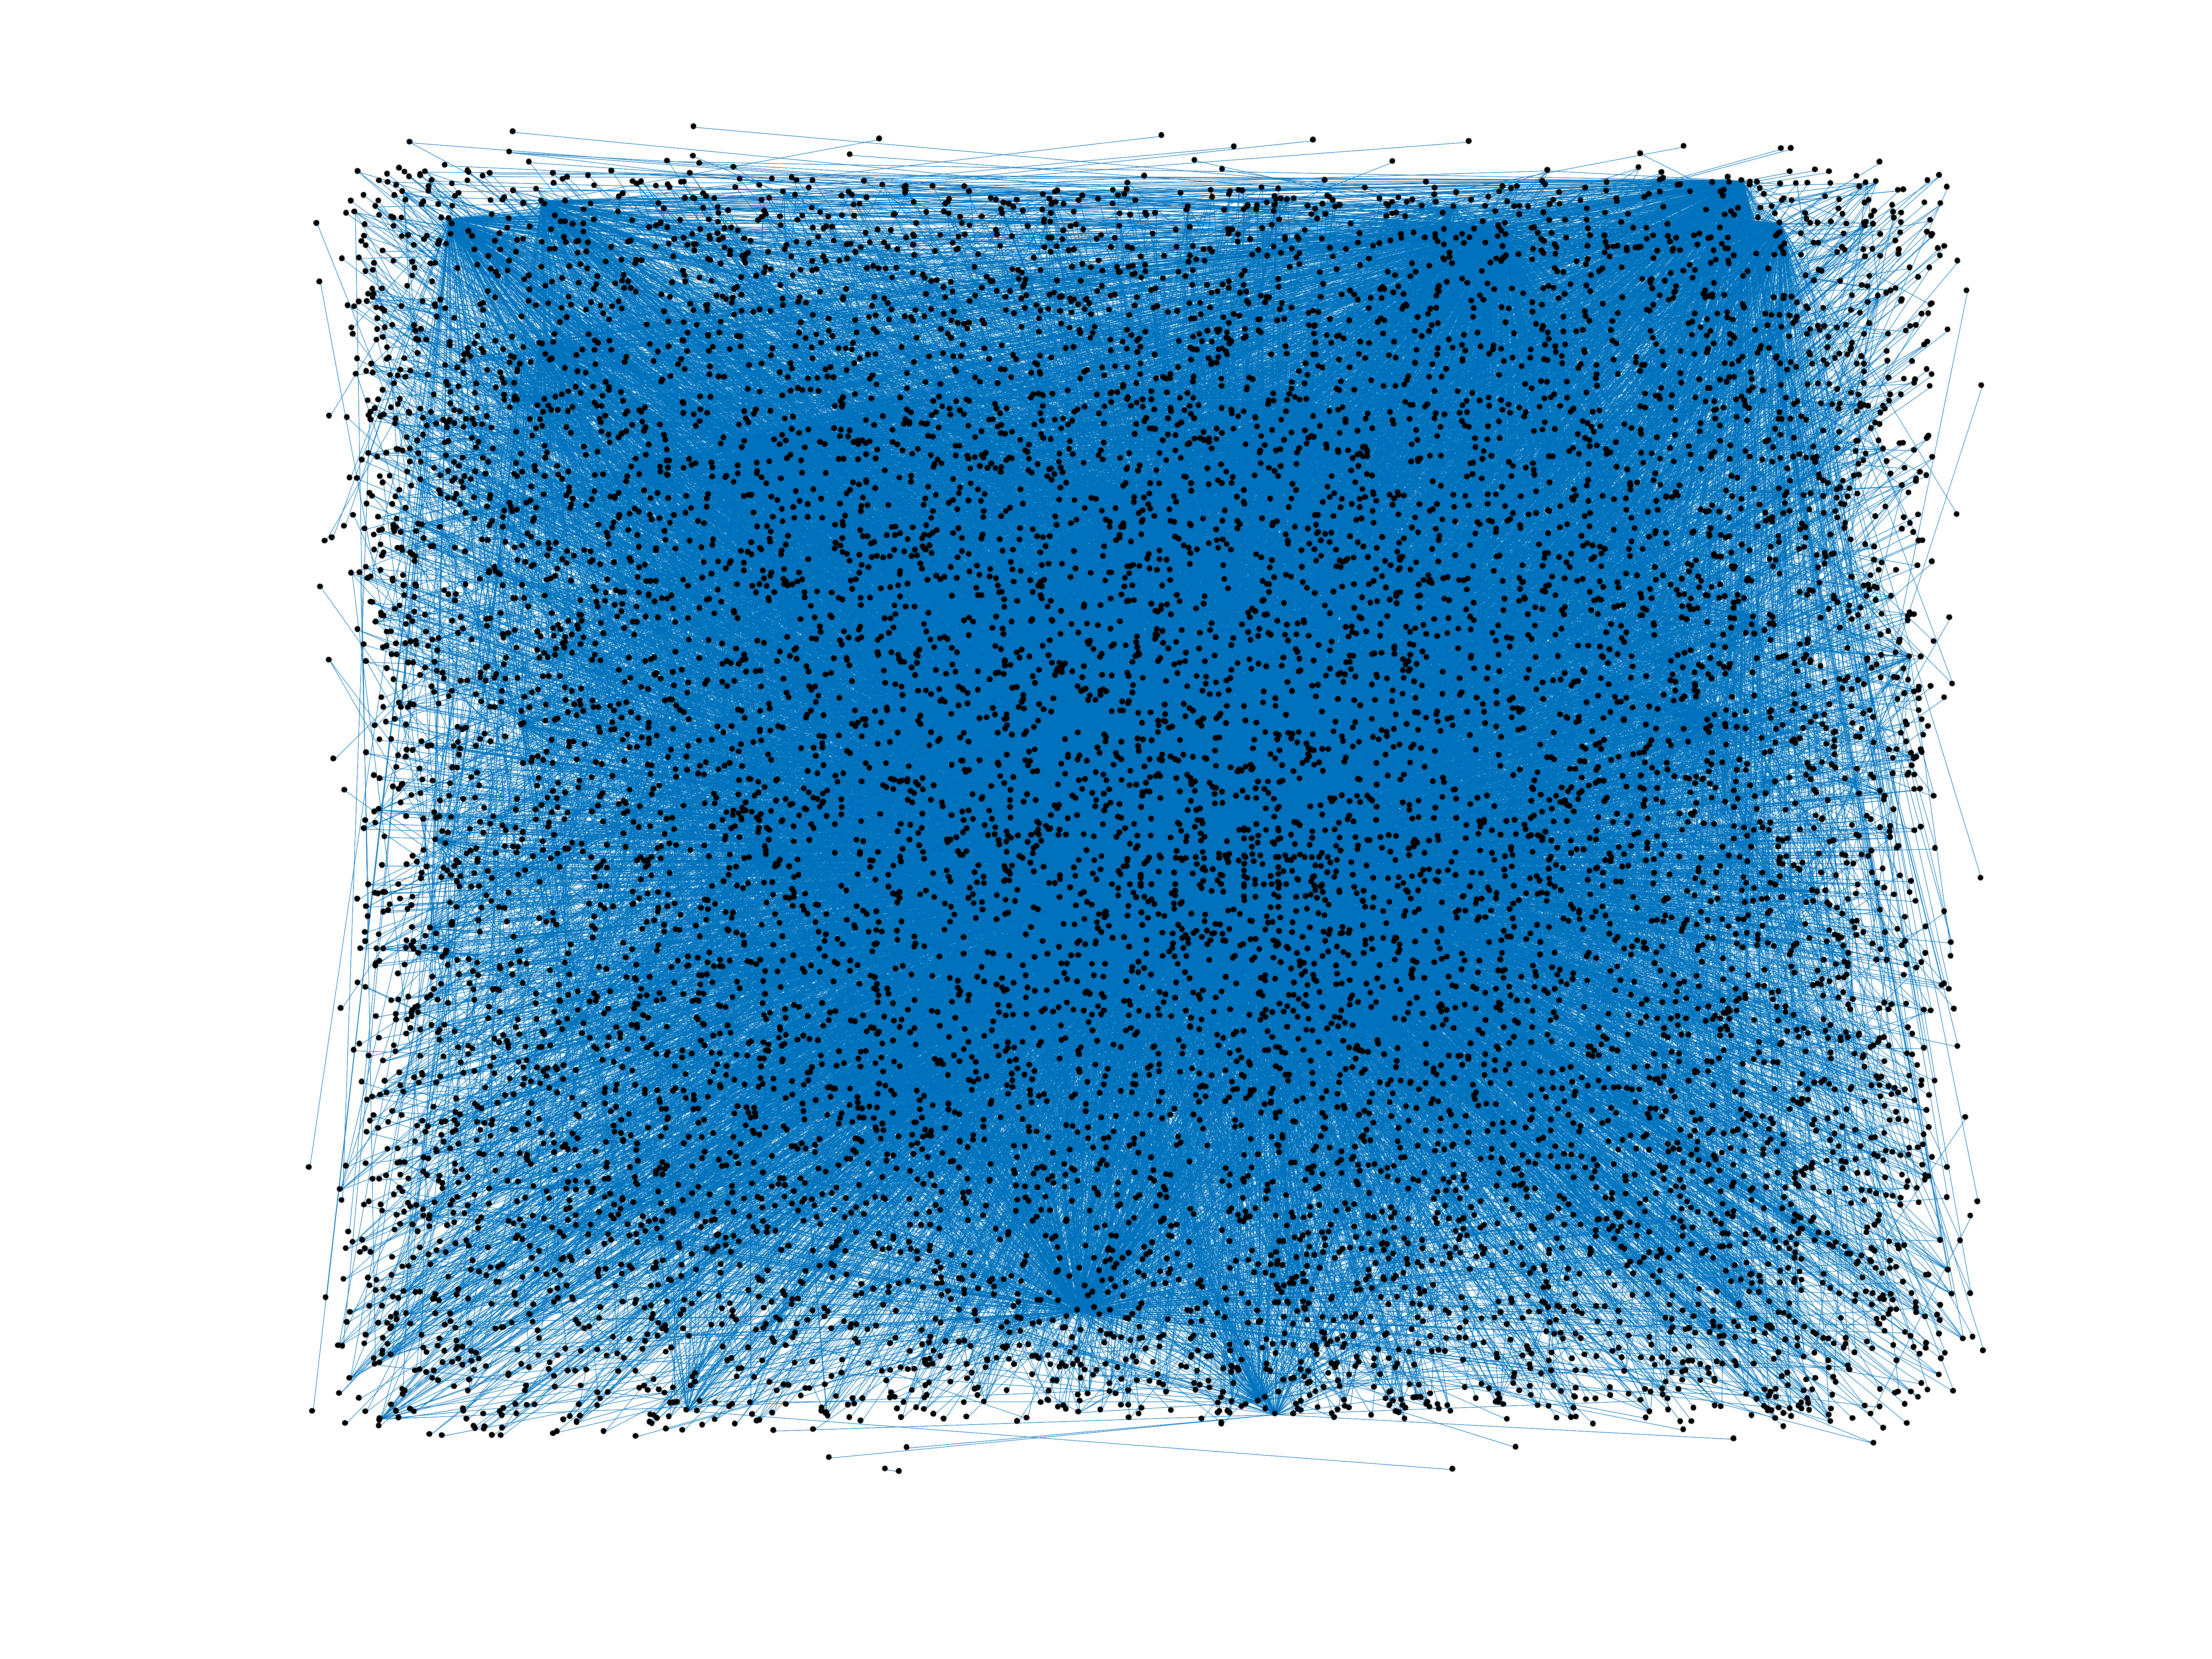
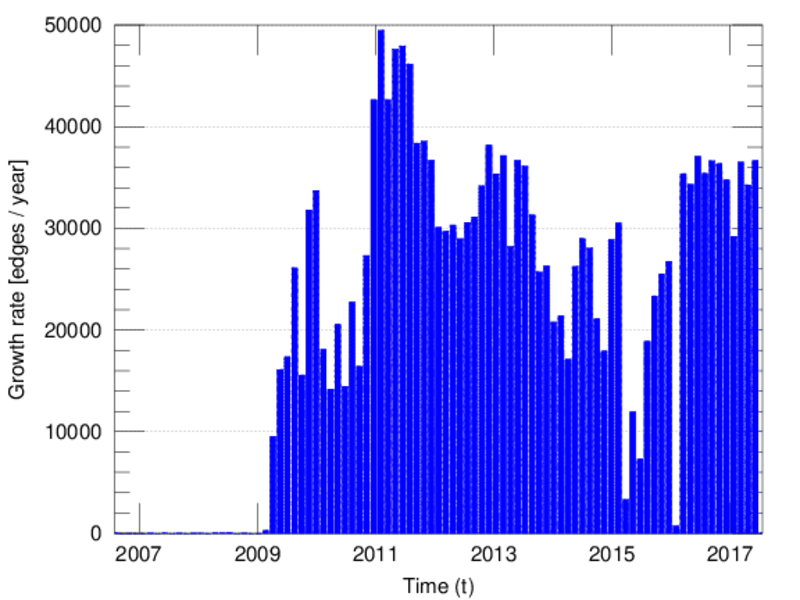
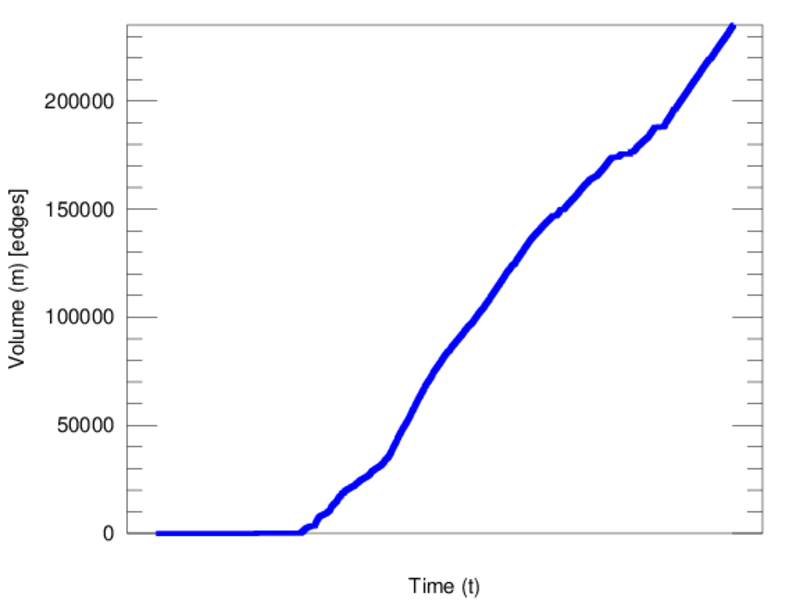
Wikinews edits (tr)
This is the bipartite edit network of the Turkish Wikinews. It contains users
and pages from the Turkish Wikinews, connected by edit events. Each edge
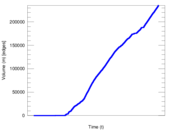
represents an edit. The dataset includes the timestamp of each edit.
Metadata
Statistics
| Size | n = | 10,072
|
| Left size | n1 = | 495
|
| Right size | n2 = | 9,577
|
| Volume | m = | 235,204
|
| Unique edge count | m̿ = | 17,249
|
| Wedge count | s = | 14,193,429
|
| Claw count | z = | 15,661,649,293
|
| Cross count | x = | 14,972,196,566,317
|
| Square count | q = | 1,383,464
|
| 4-Tour count | T4 = | 67,880,182
|
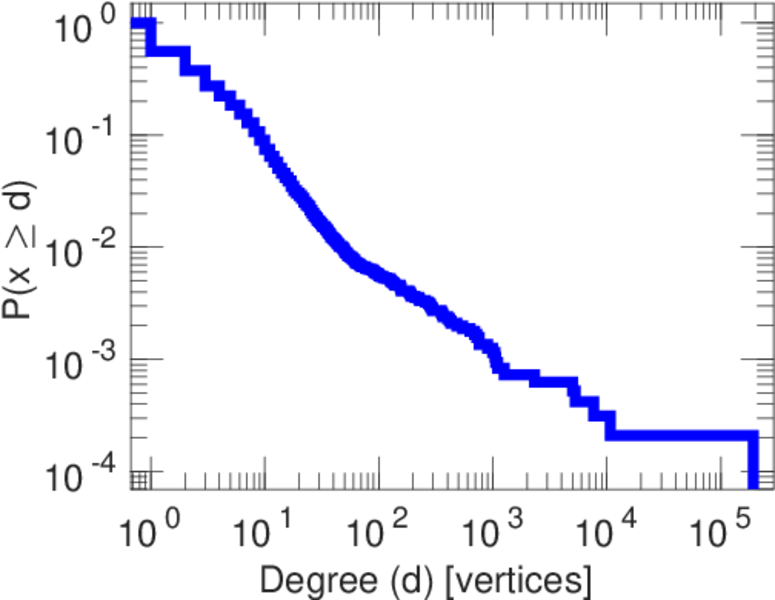
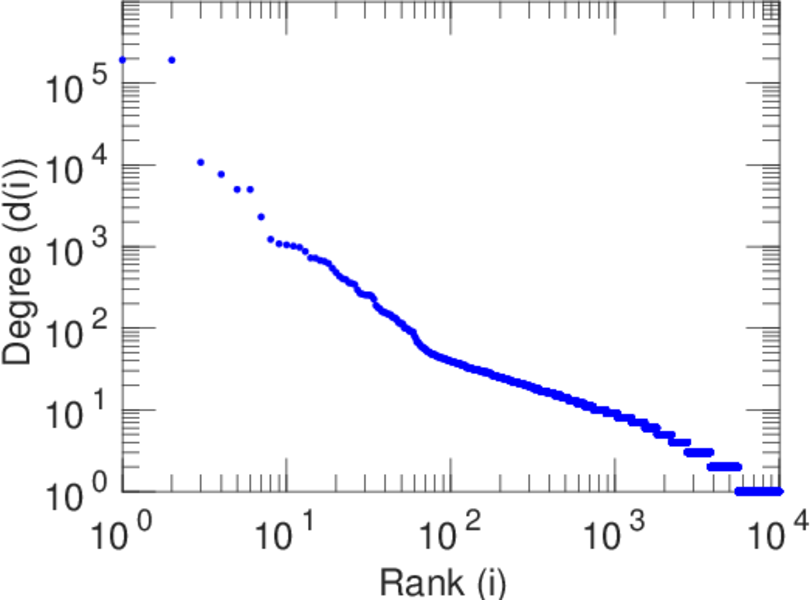
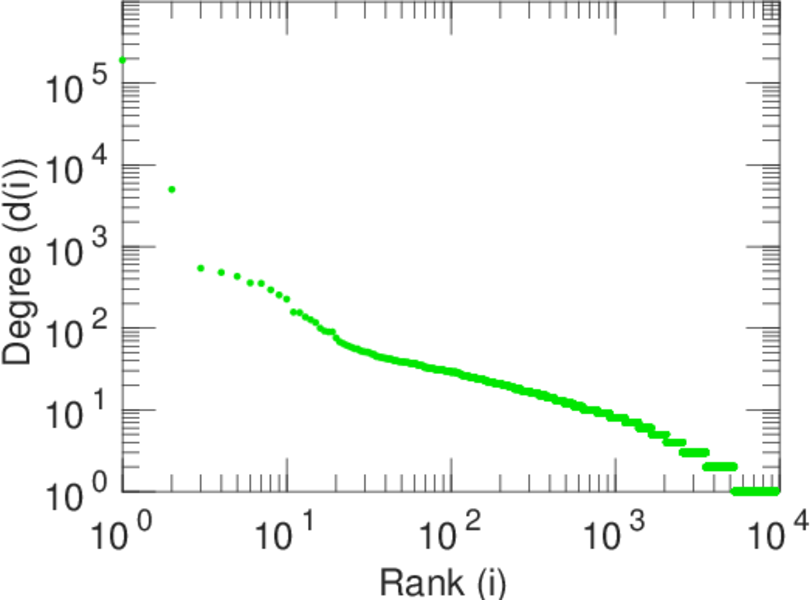
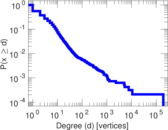
| Maximum degree | dmax = | 192,758
|
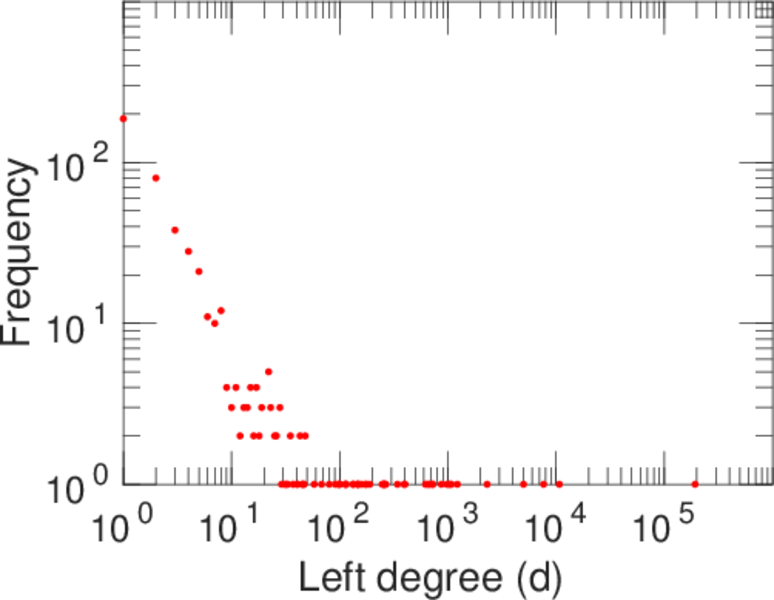
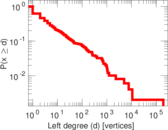
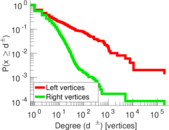
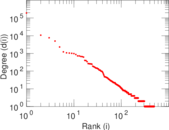
| Maximum left degree | d1max = | 192,758
|
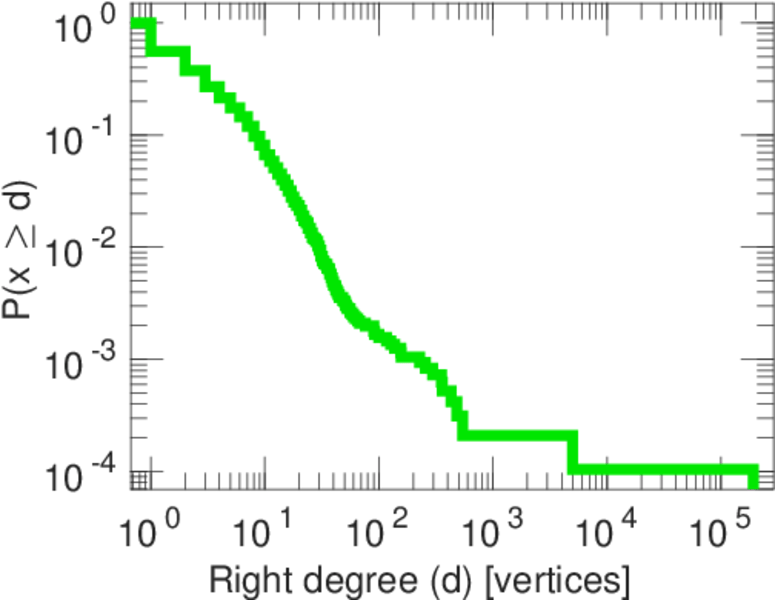
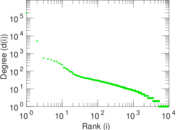
| Maximum right degree | d2max = | 191,789
|
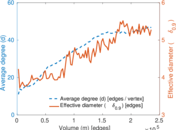
| Average degree | d = | 46.704 5
|
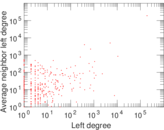
| Average left degree | d1 = | 475.160
|
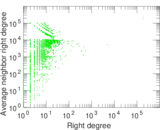
| Average right degree | d2 = | 24.559 3
|
| Fill | p = | 0.003 638 56
|
| Average edge multiplicity | m̃ = | 13.635 8
|
| Size of LCC | N = | 9,777
|
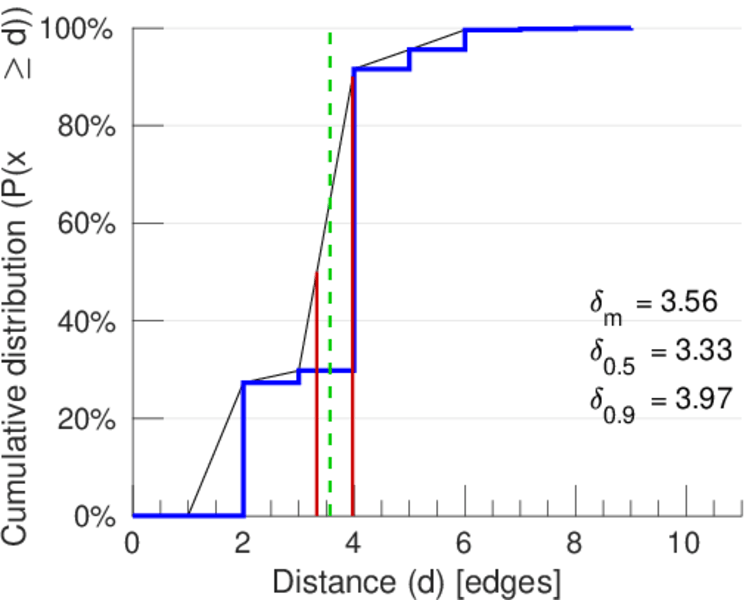
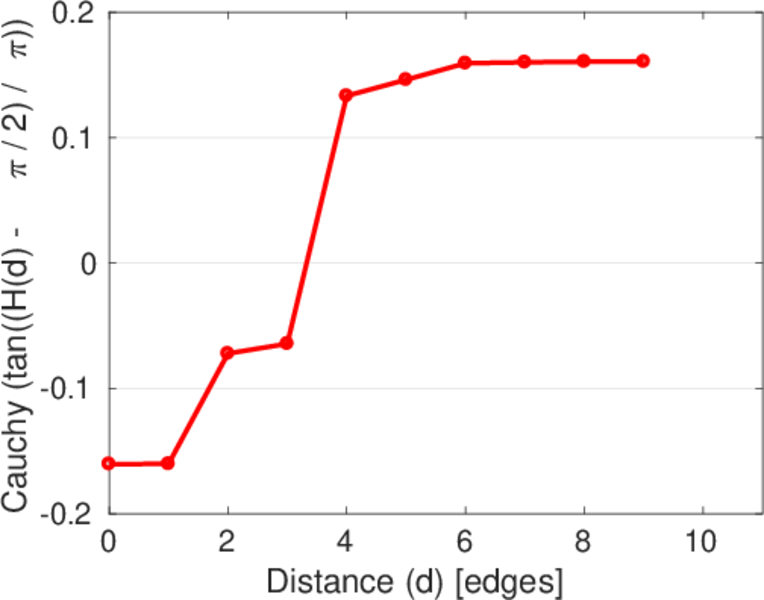
| Diameter | δ = | 10
|
| 50-Percentile effective diameter | δ0.5 = | 3.327 16
|
| 90-Percentile effective diameter | δ0.9 = | 3.973 98
|
| Median distance | δM = | 4
|
| Mean distance | δm = | 3.562 79
|
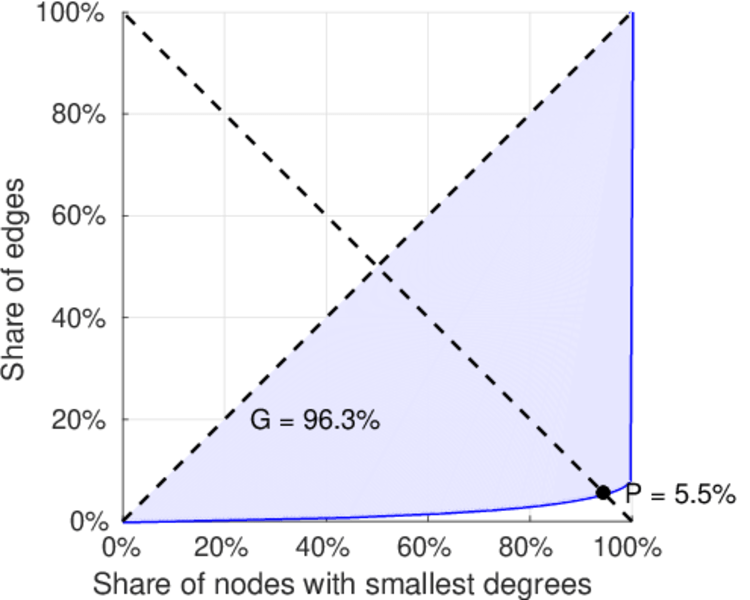
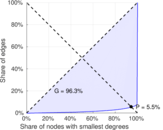
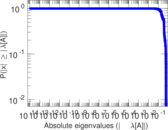
| Gini coefficient | G = | 0.965 081
|
| Balanced inequality ratio | P = | 0.052 256 8
|
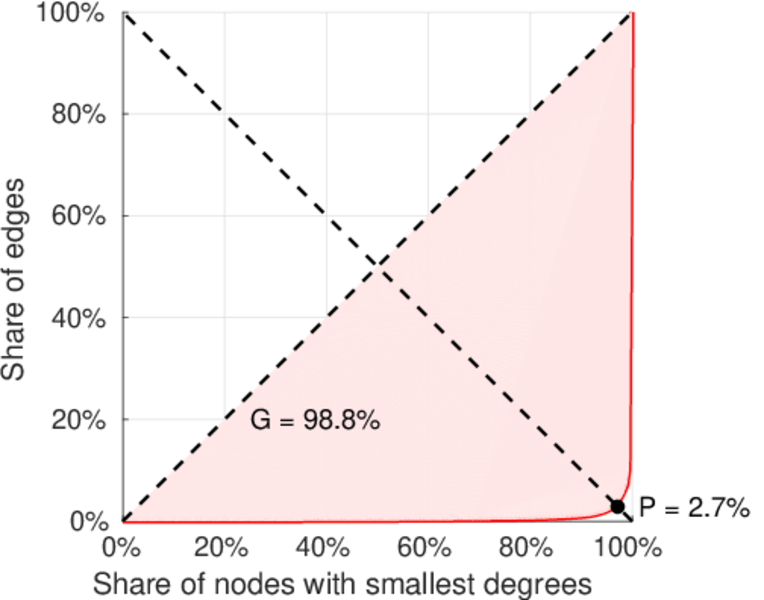
| Left balanced inequality ratio | P1 = | 0.027 002 1
|
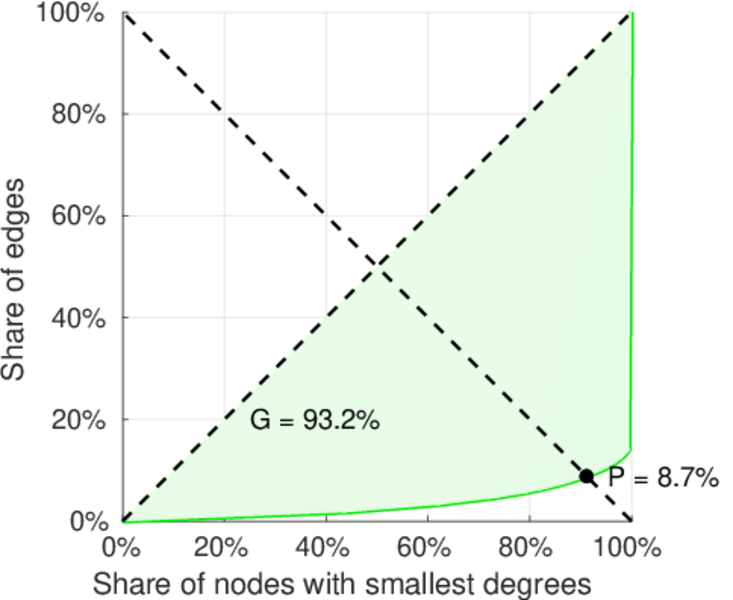
| Right balanced inequality ratio | P2 = | 0.086 899 0
|
| Relative edge distribution entropy | Her = | 0.740 023
|
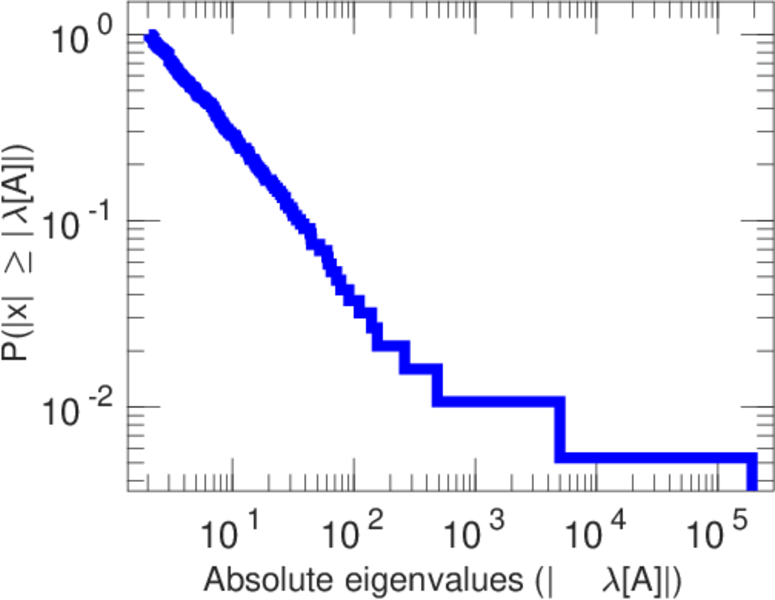
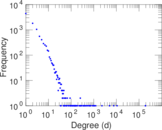
| Power law exponent | γ = | 3.461 74
|
| Tail power law exponent | γt = | 2.491 00
|
| Tail power law exponent with p | γ3 = | 2.491 00
|
| p-value | p = | 0.000 00
|
| Left tail power law exponent with p | γ3,1 = | 1.641 00
|
| Left p-value | p1 = | 0.605 000
|
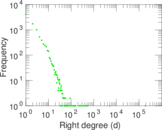
| Right tail power law exponent with p | γ3,2 = | 3.991 00
|
| Right p-value | p2 = | 0.004 000 00
|
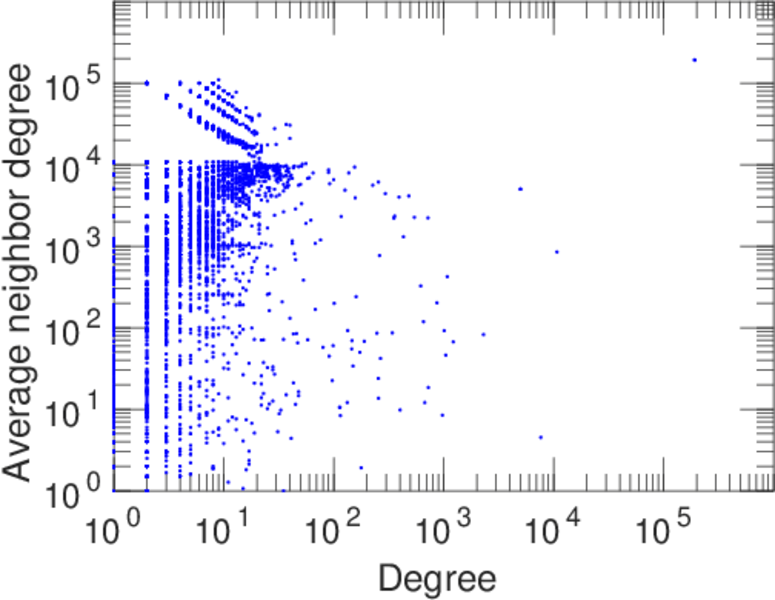
| Degree assortativity | ρ = | −0.270 005
|
| Degree assortativity p-value | pρ = | 7.200 66 × 10−286
|
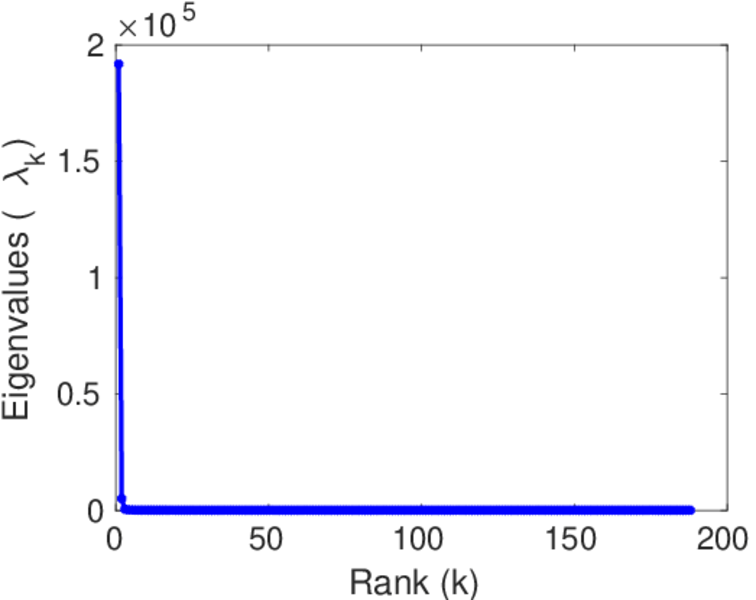
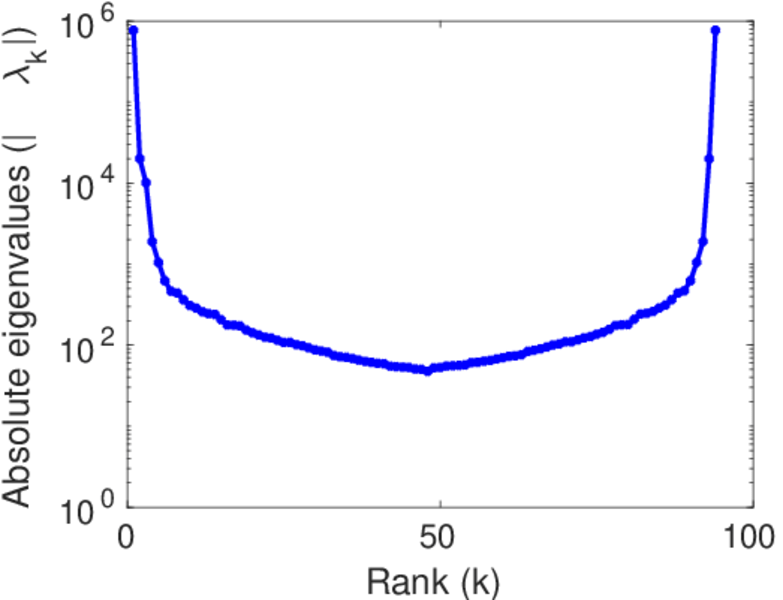
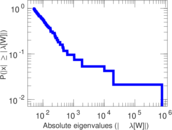
| Spectral norm | α = | 191,724
|
| Algebraic connectivity | a = | 0.050 047 2
|
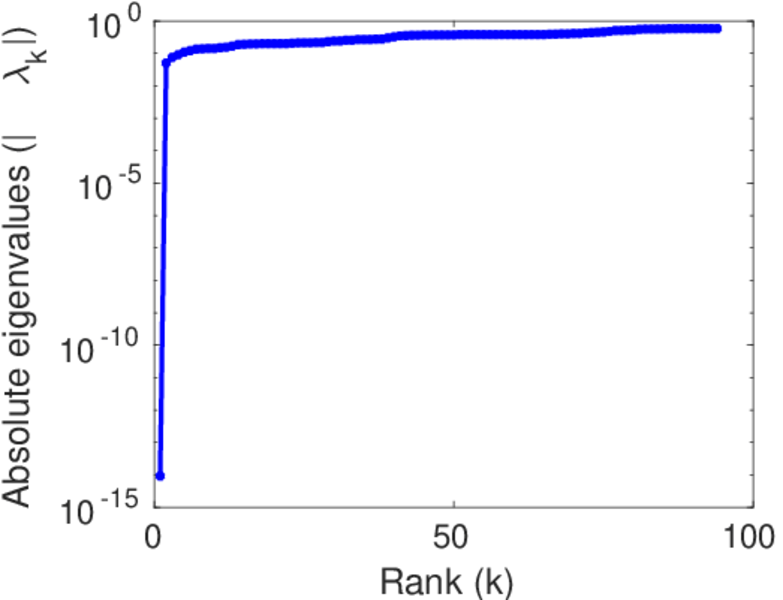
| Spectral separation | |λ1[A] / λ2[A]| = | 38.398 5
|
| Controllability | C = | 9,168
|
| Relative controllability | Cr = | 0.913 329
|
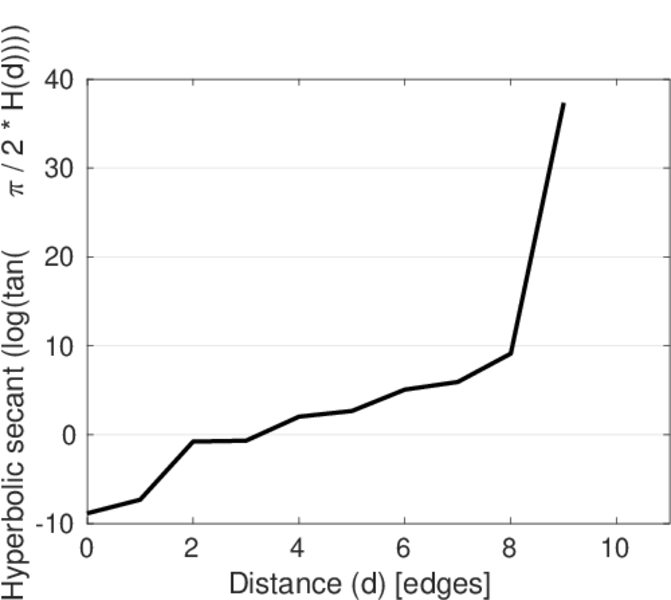
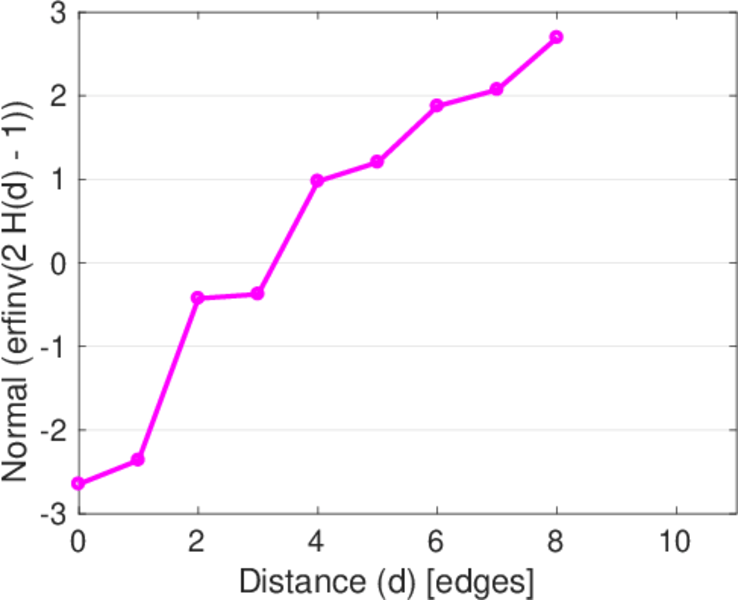
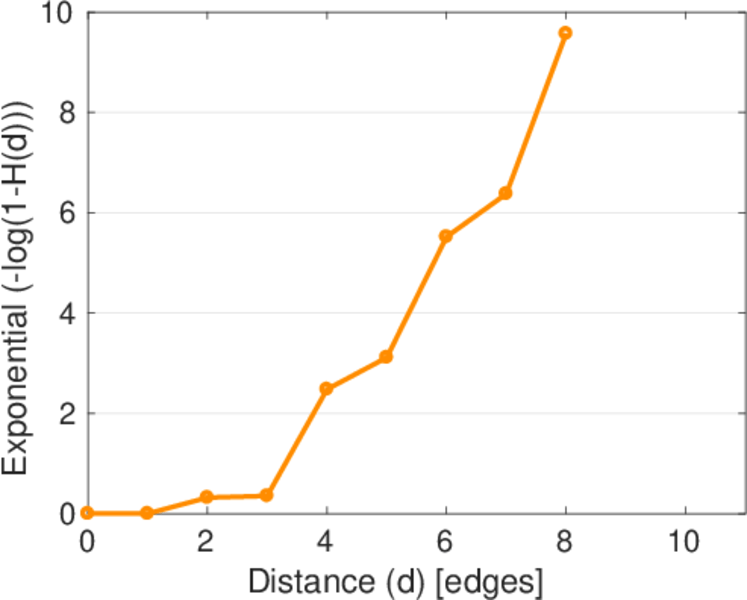
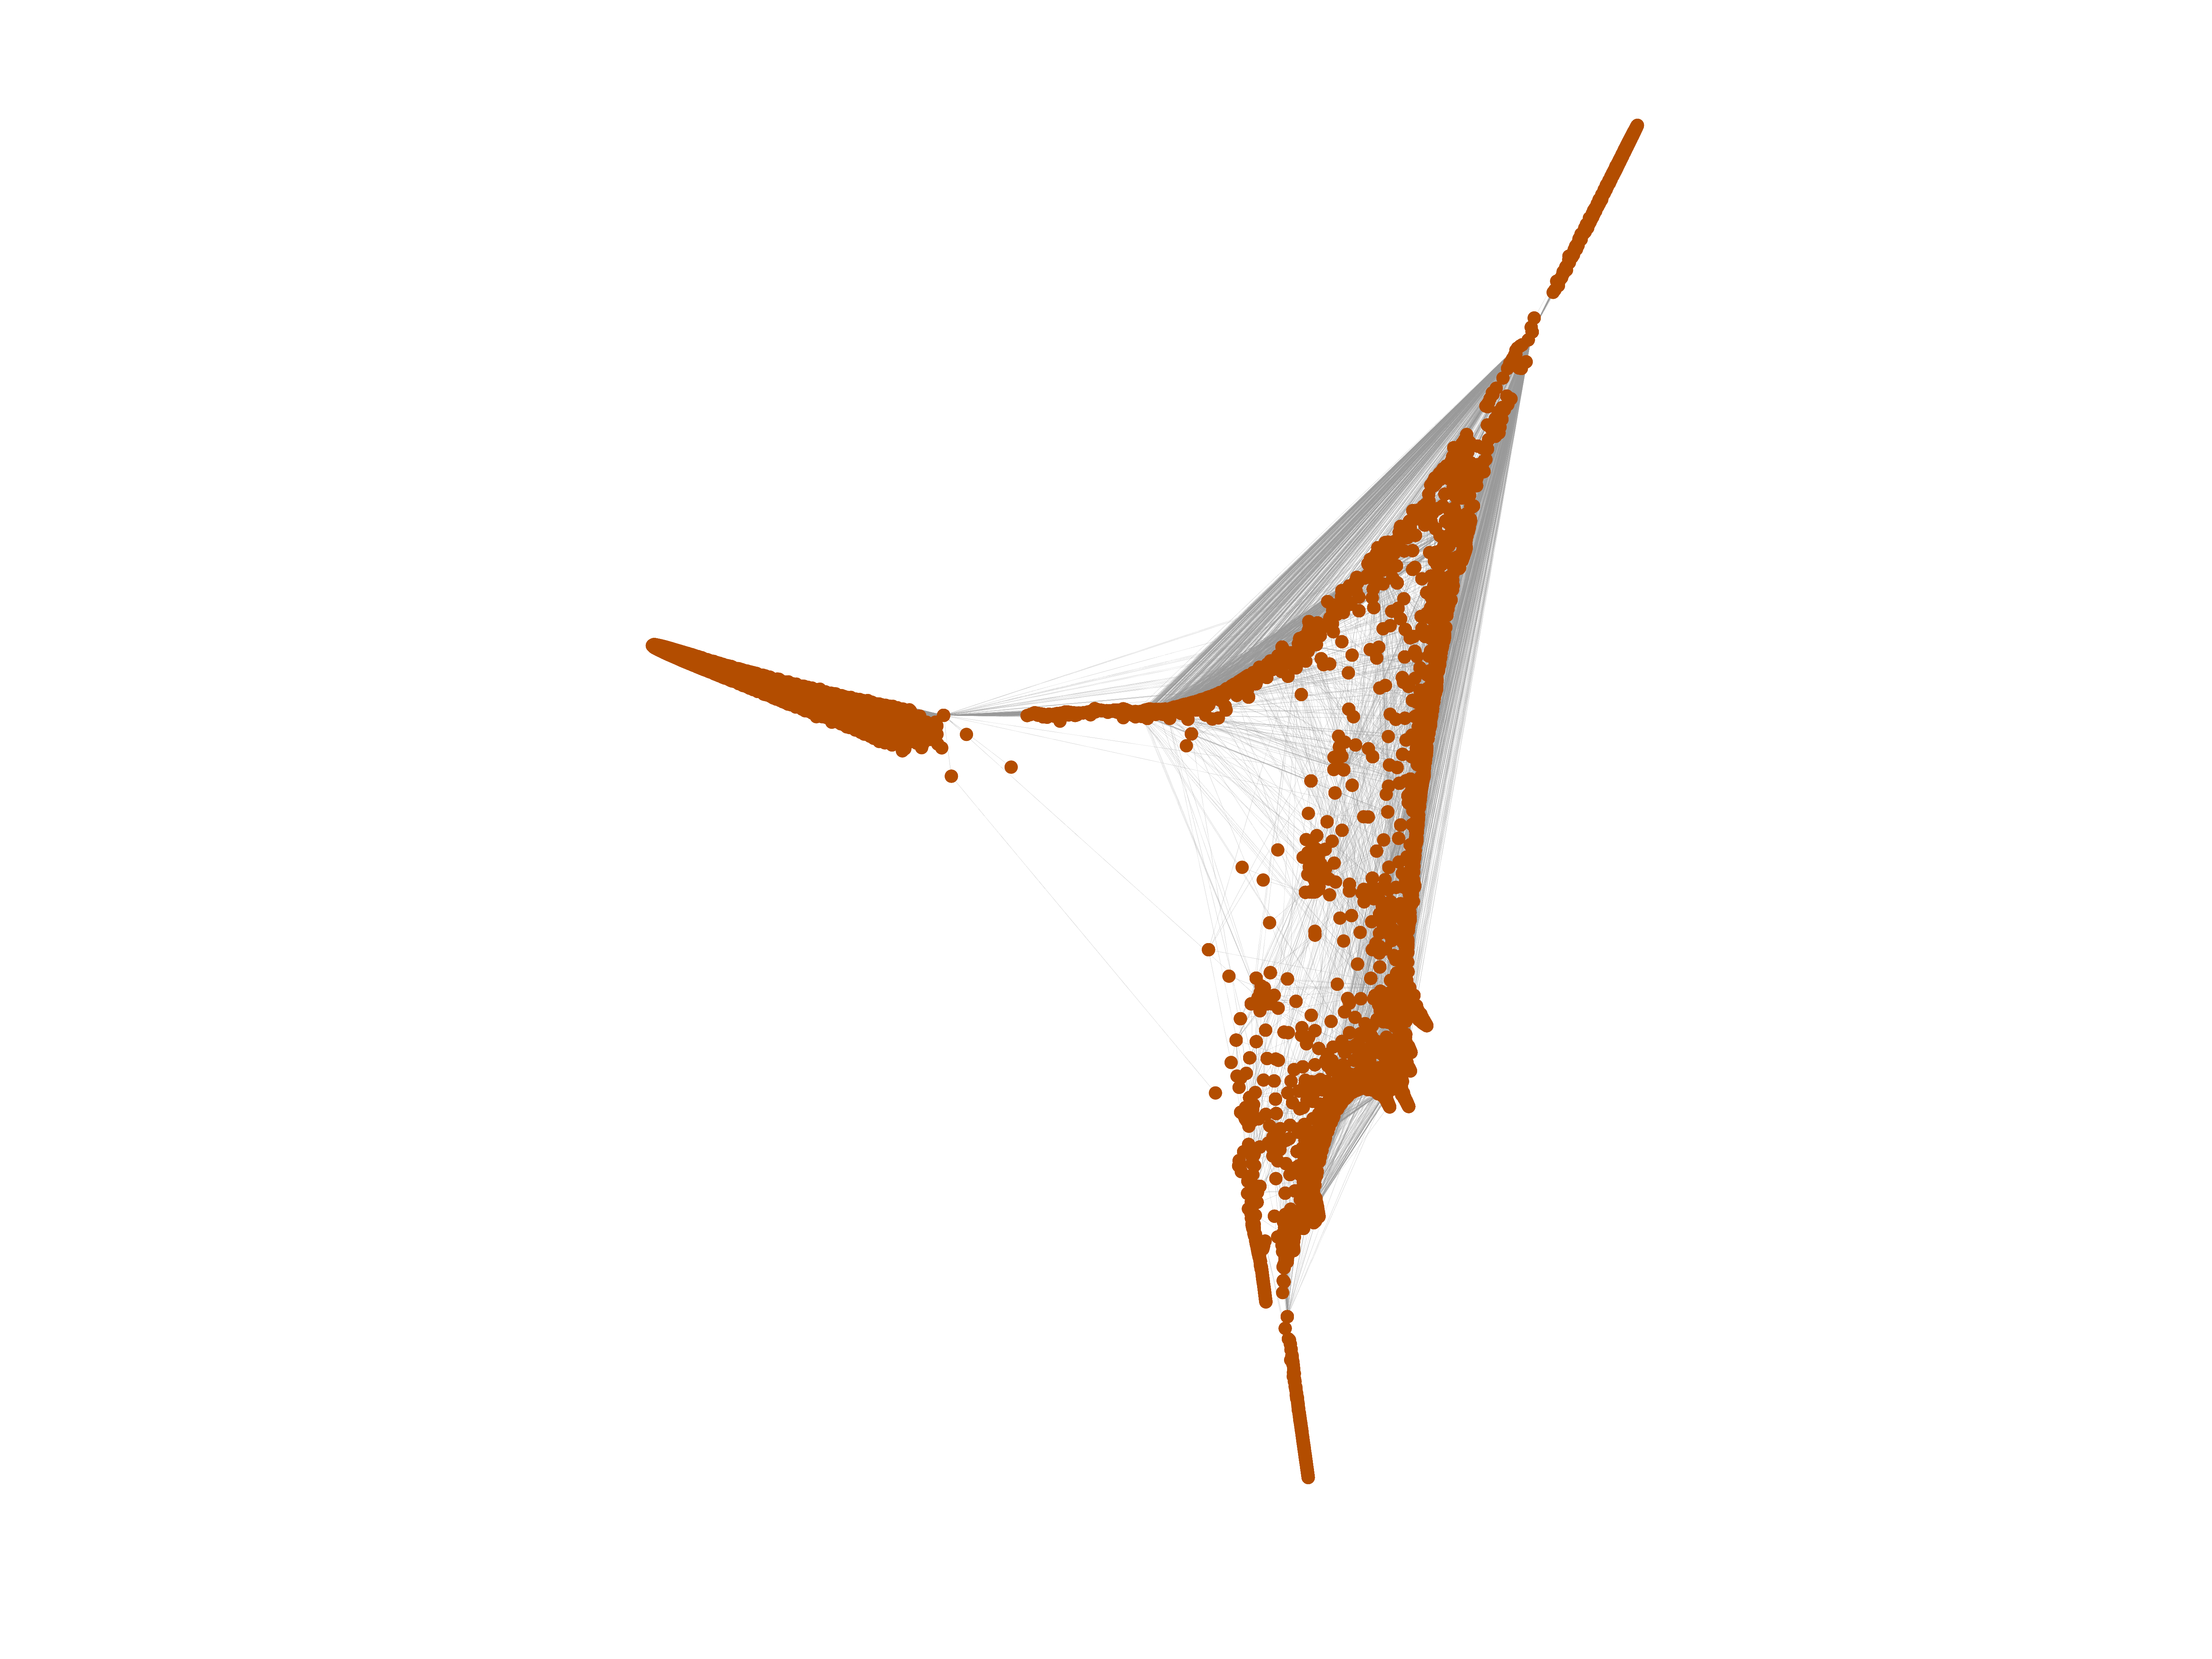
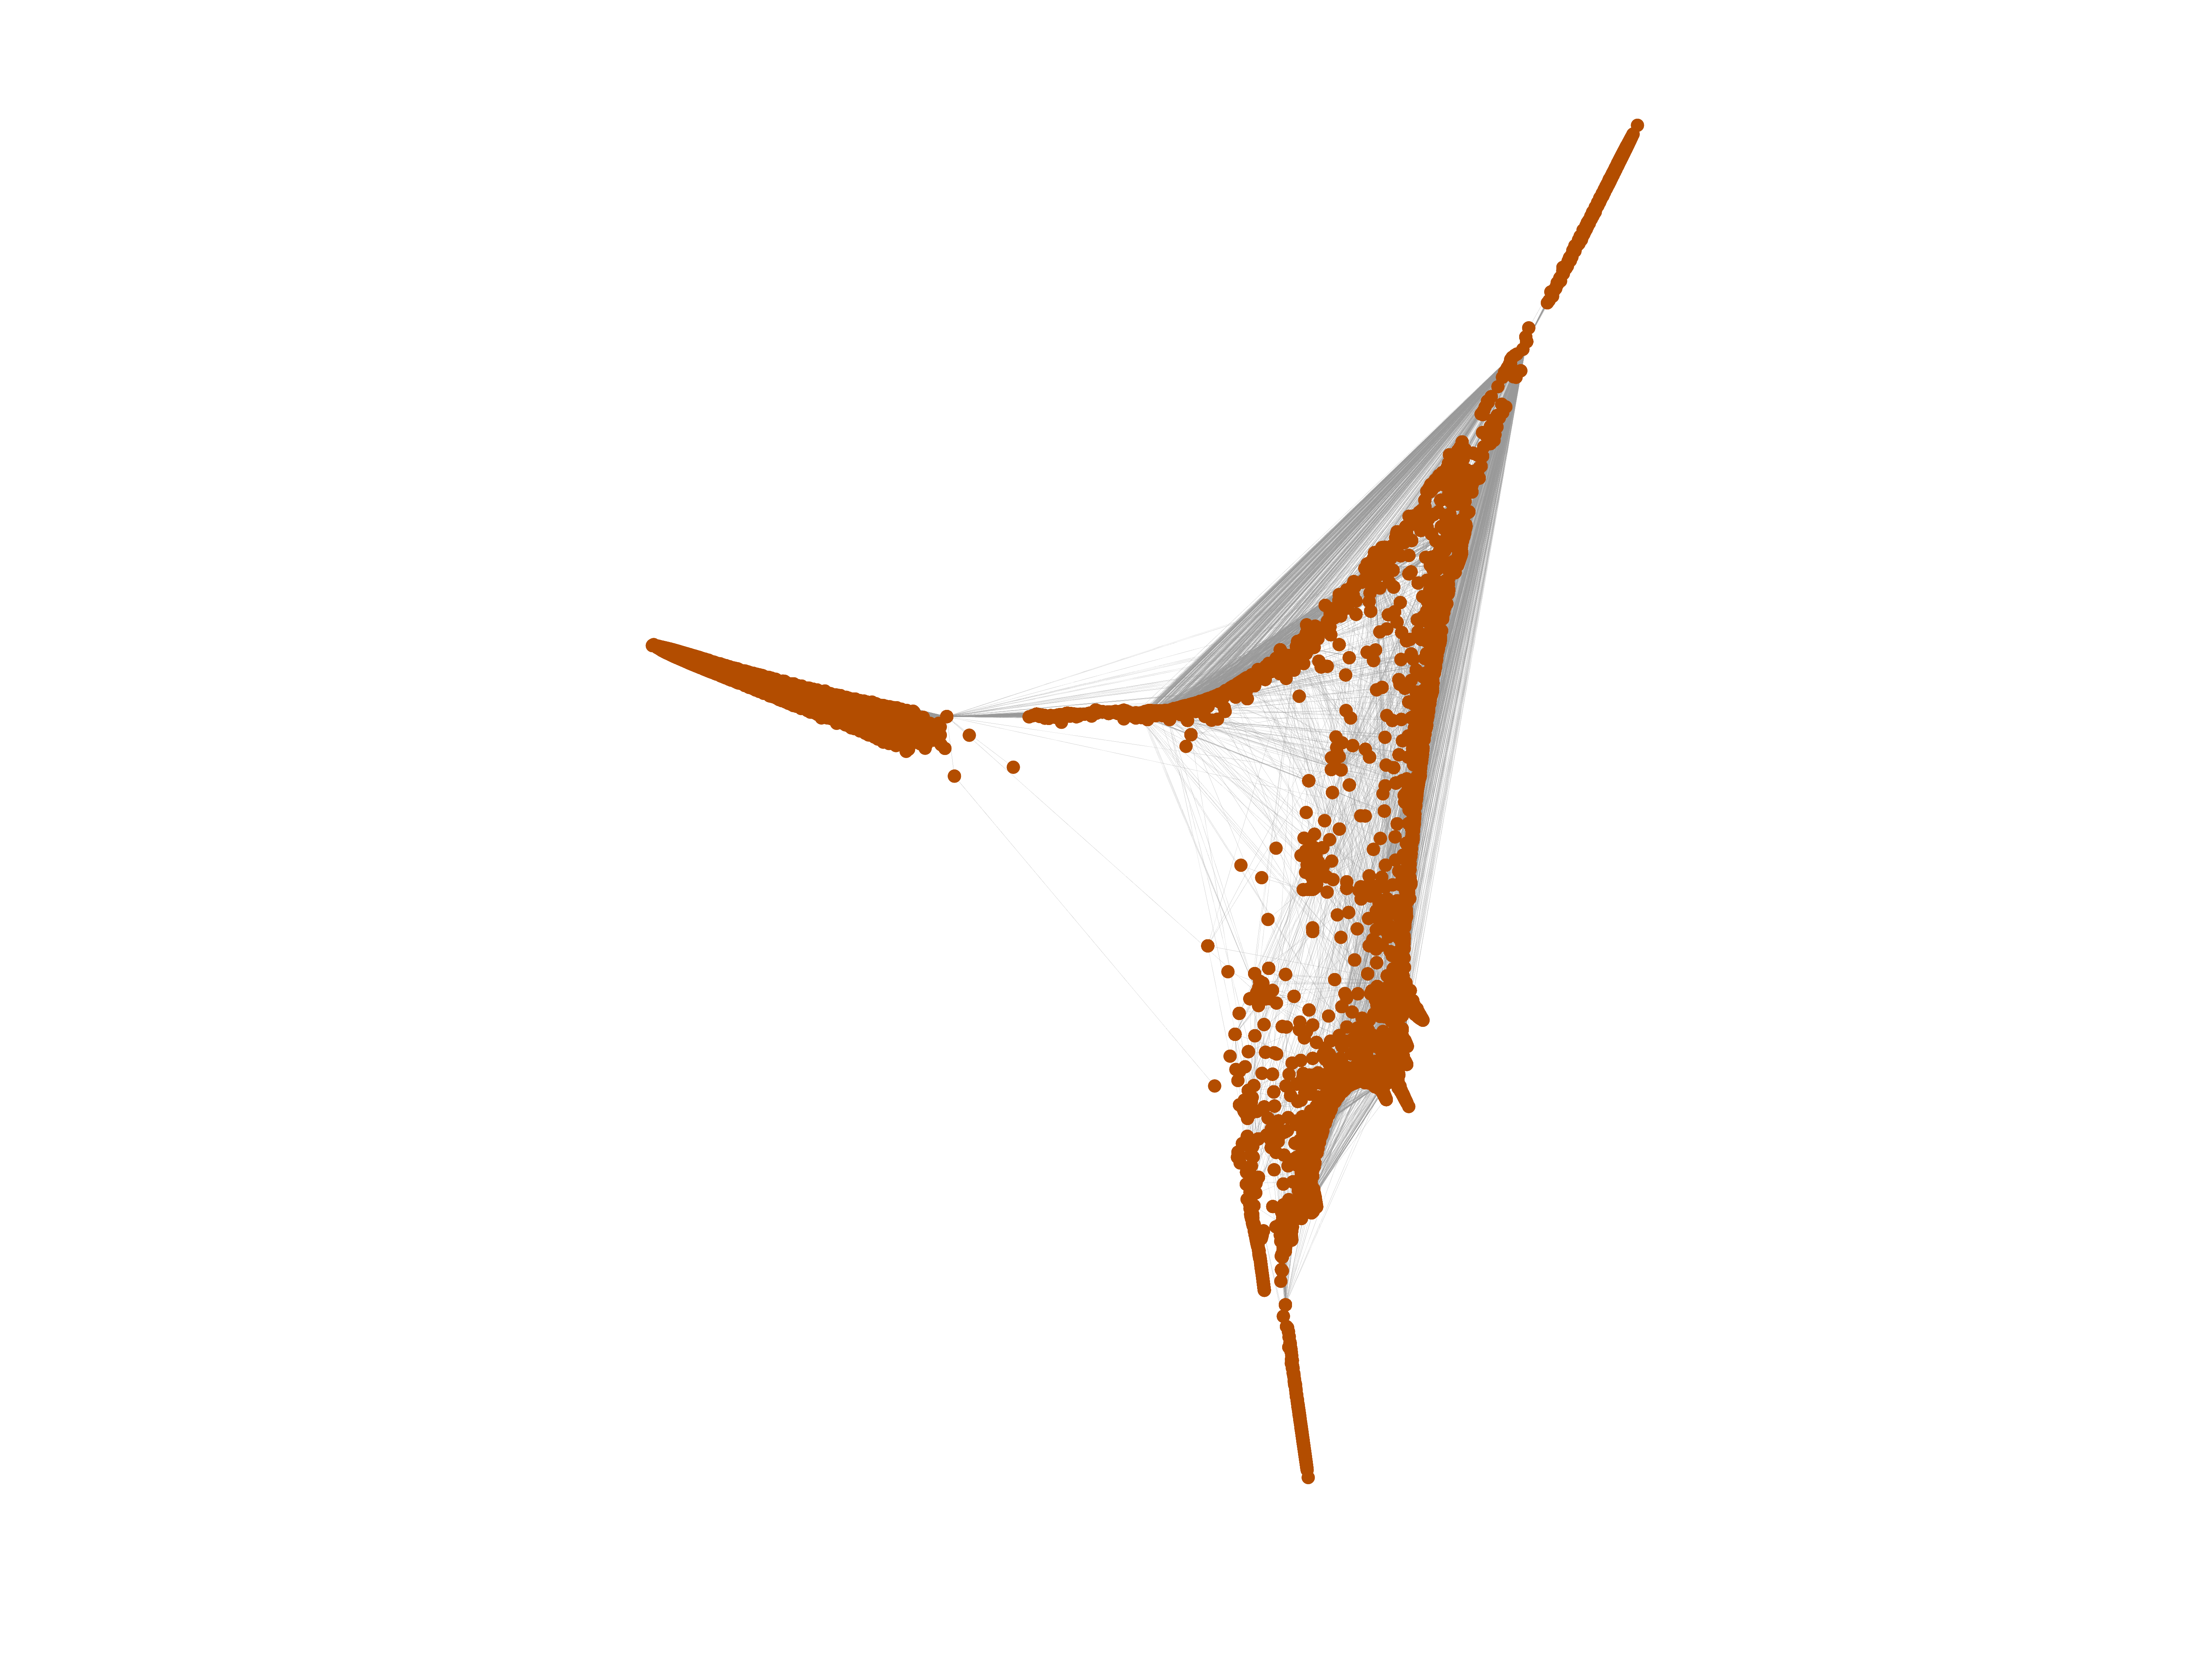
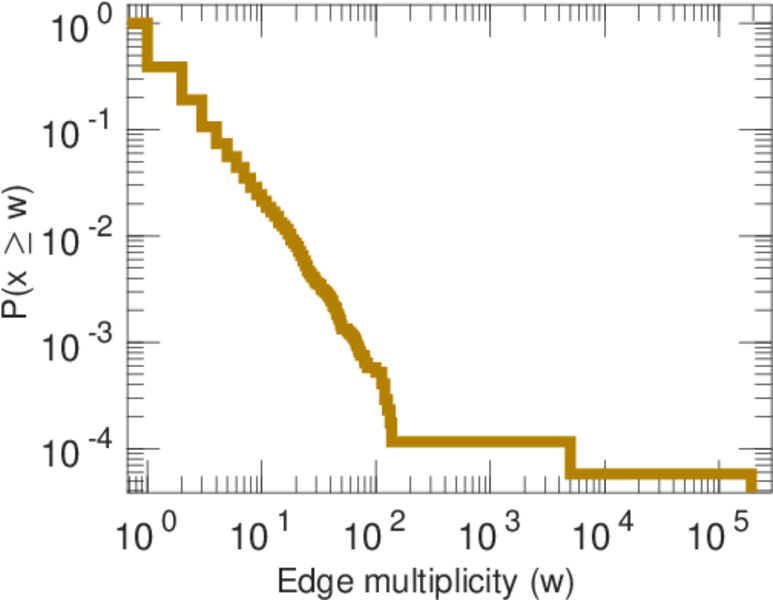
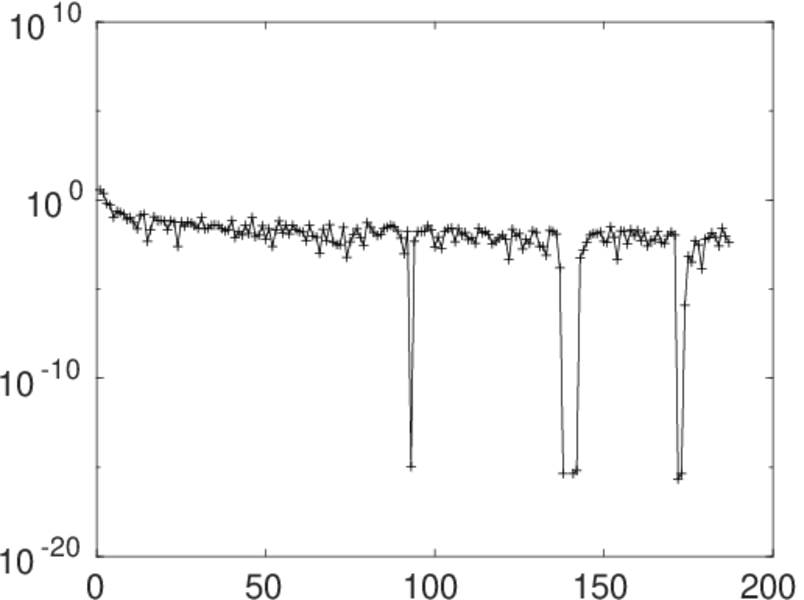
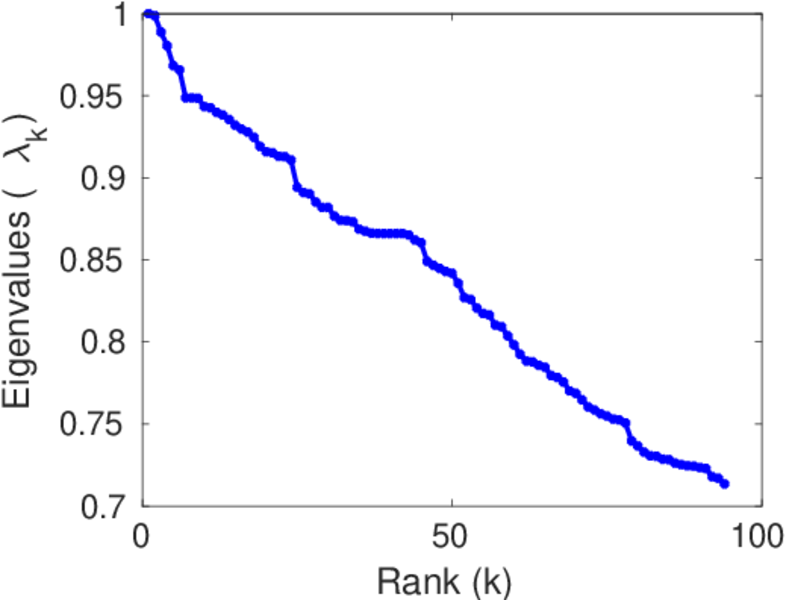
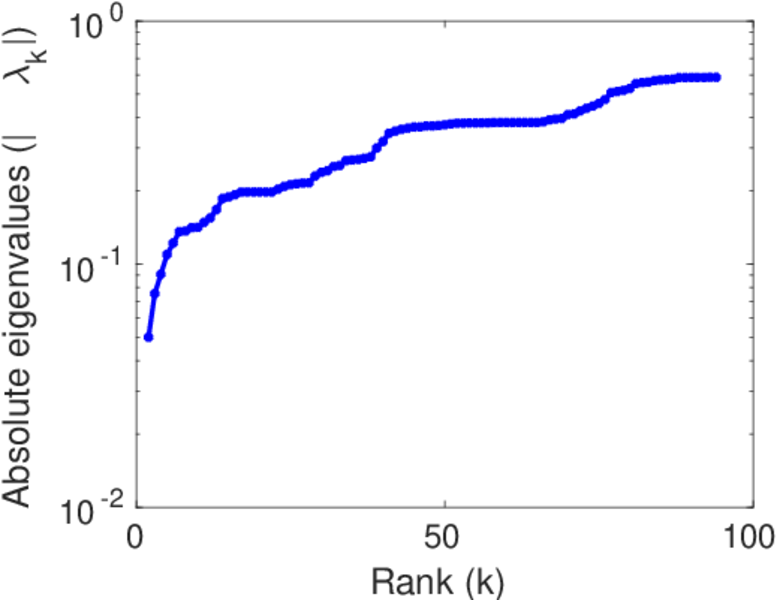
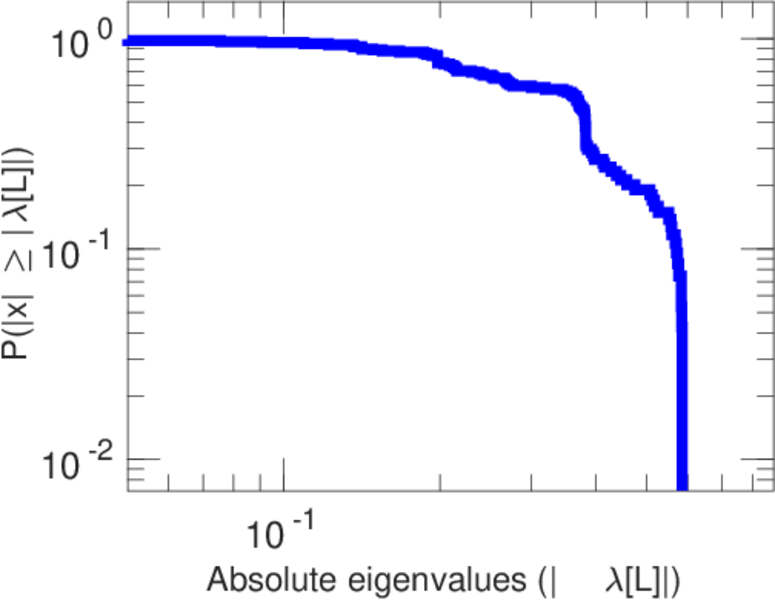
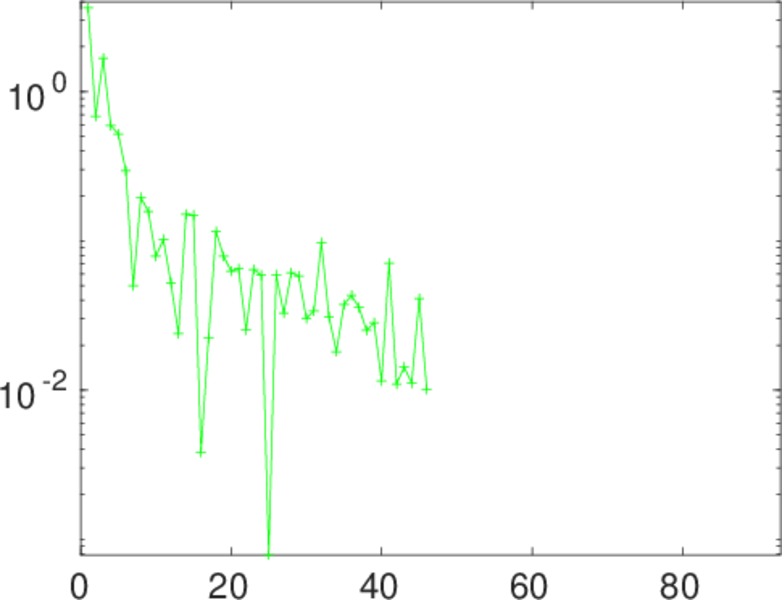
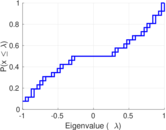
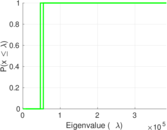
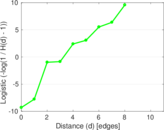
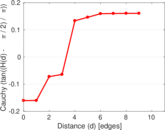
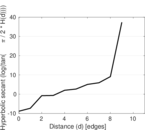
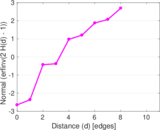
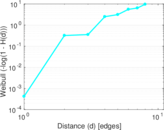
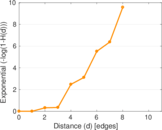
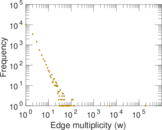
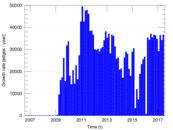
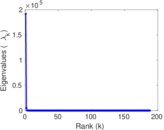
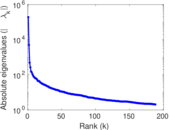
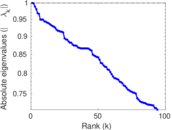
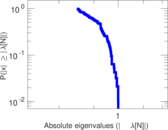
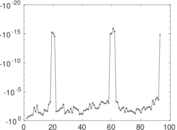
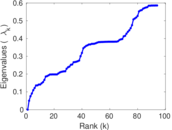
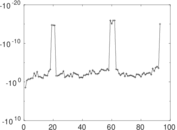
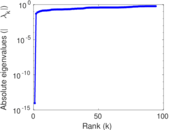
Plots


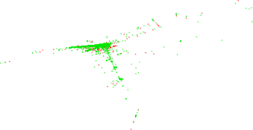


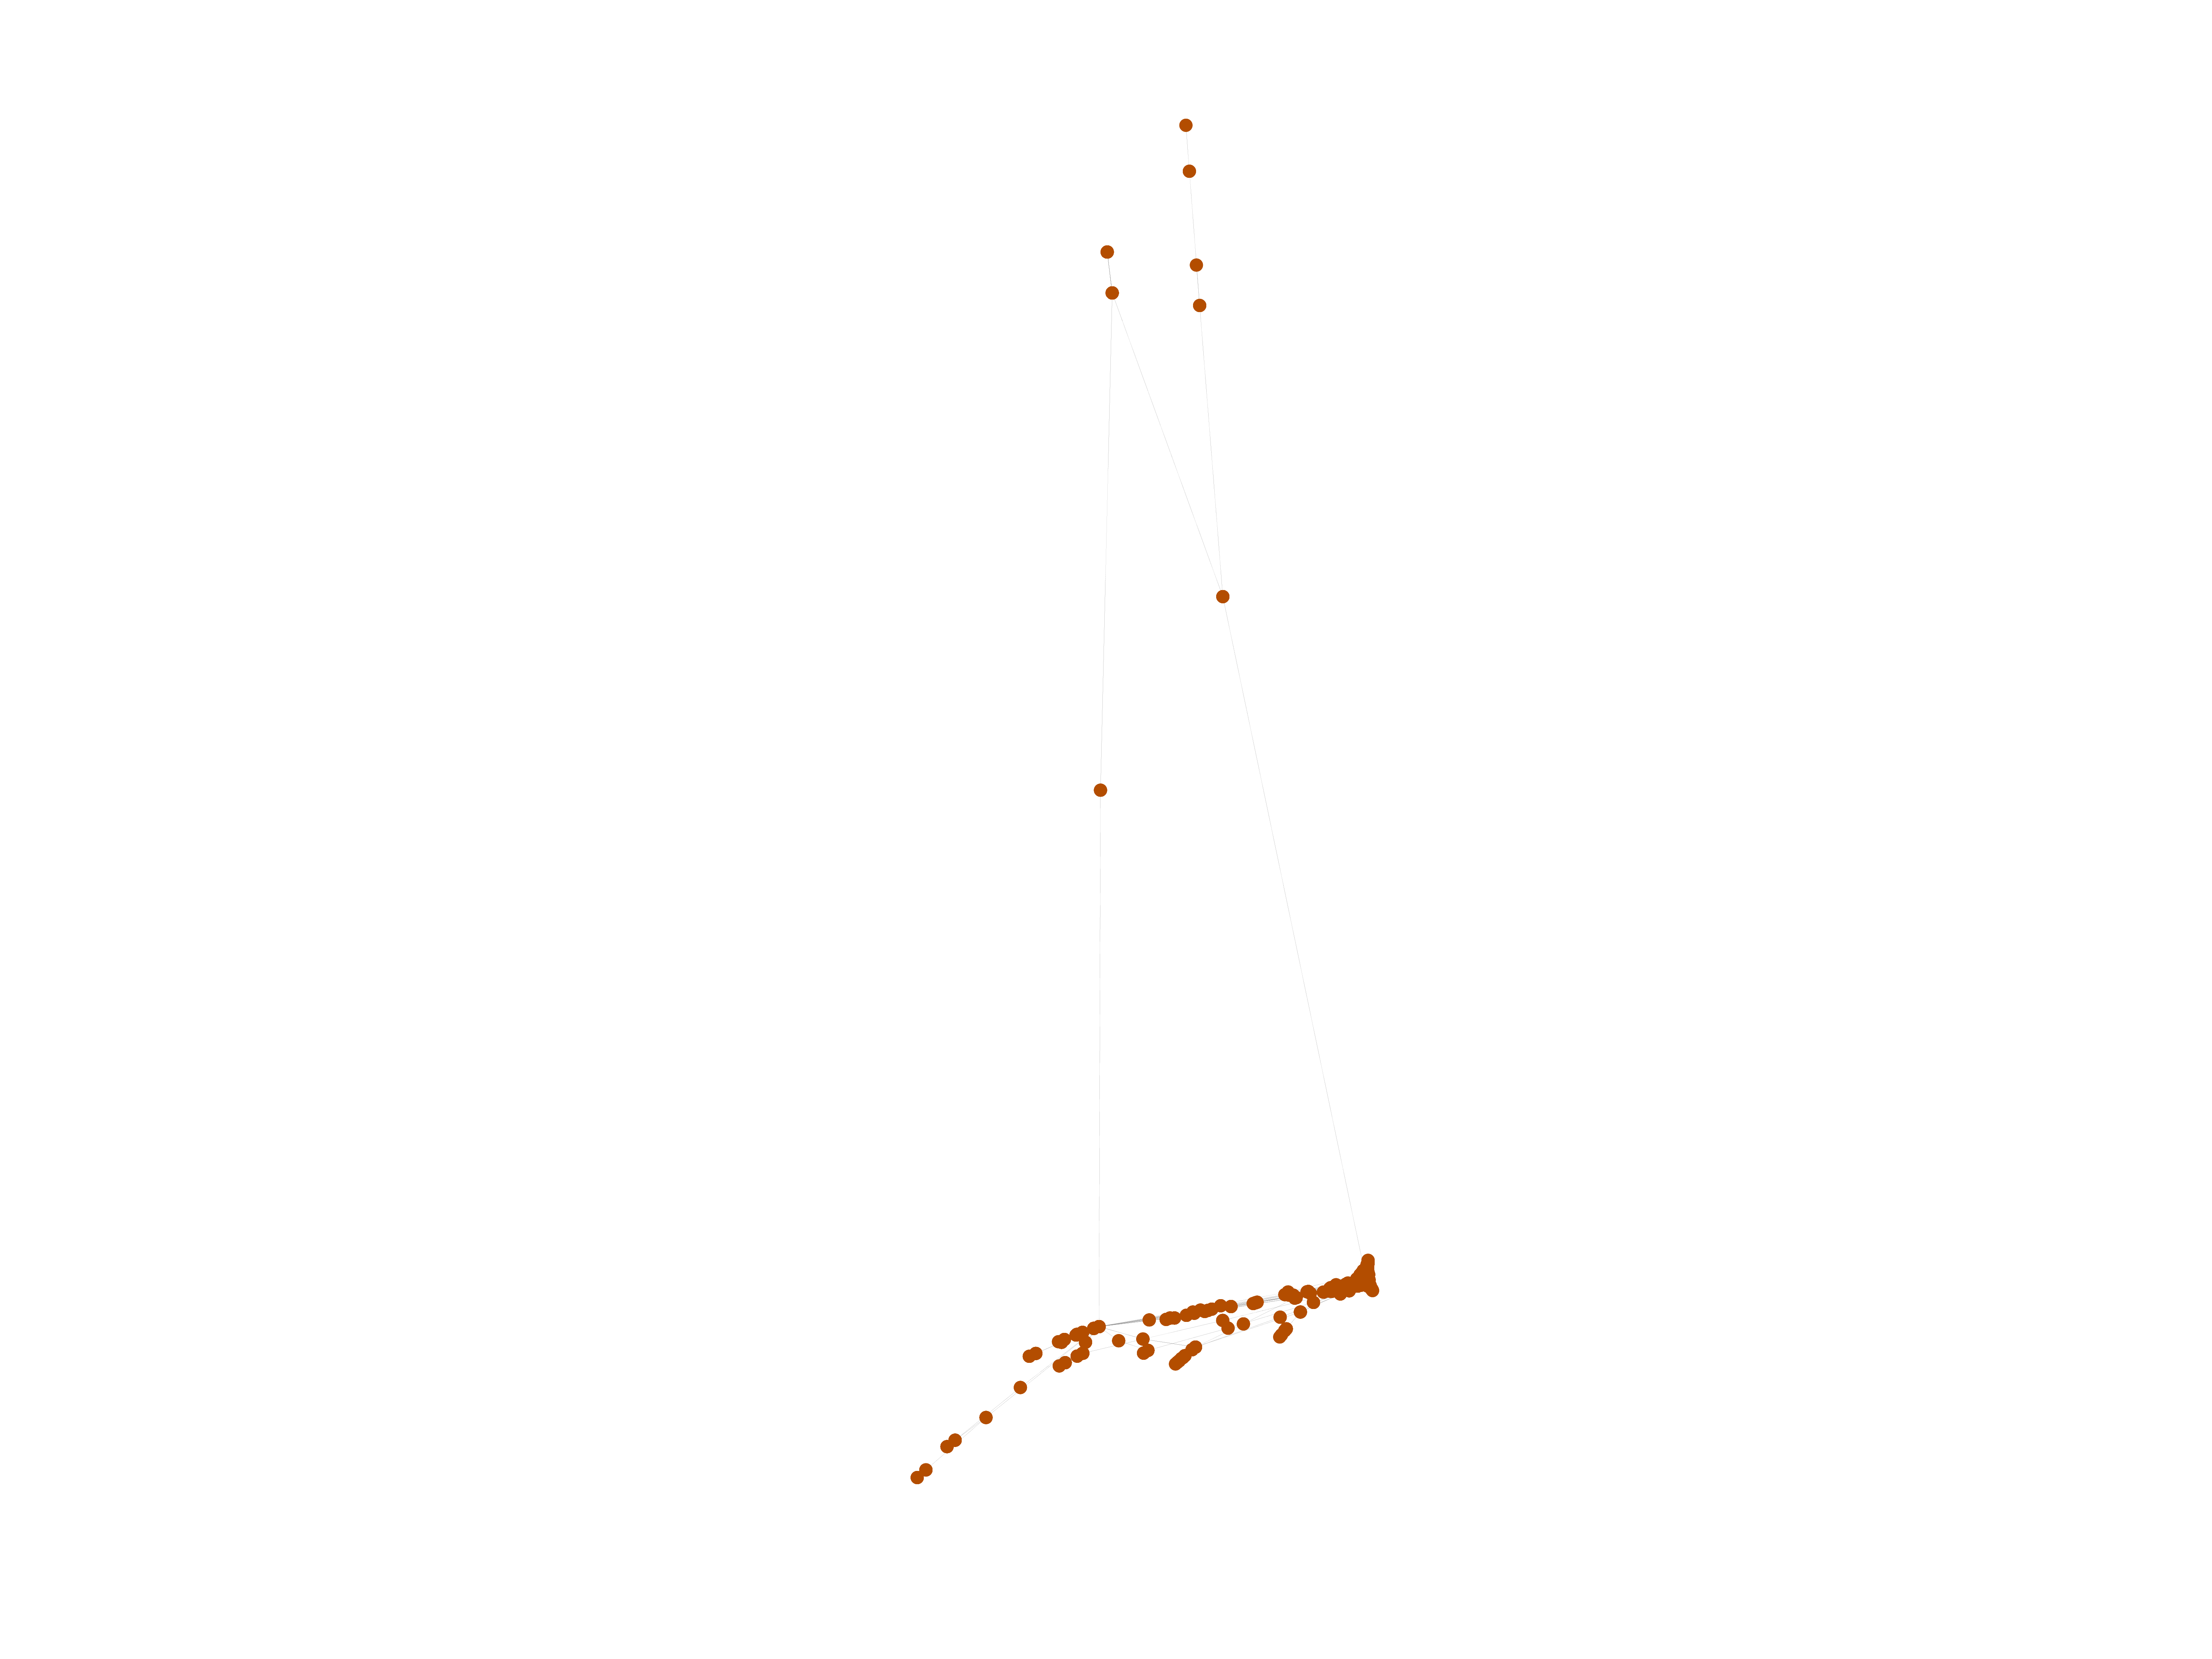
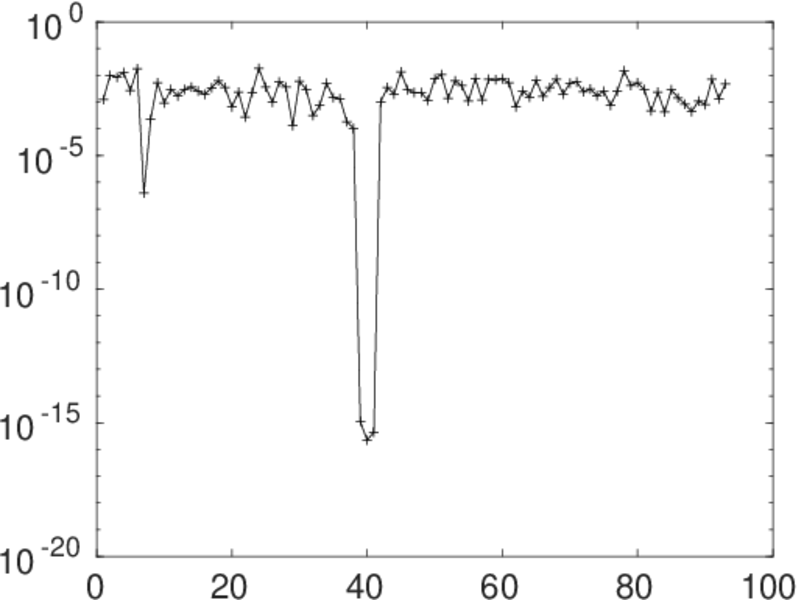
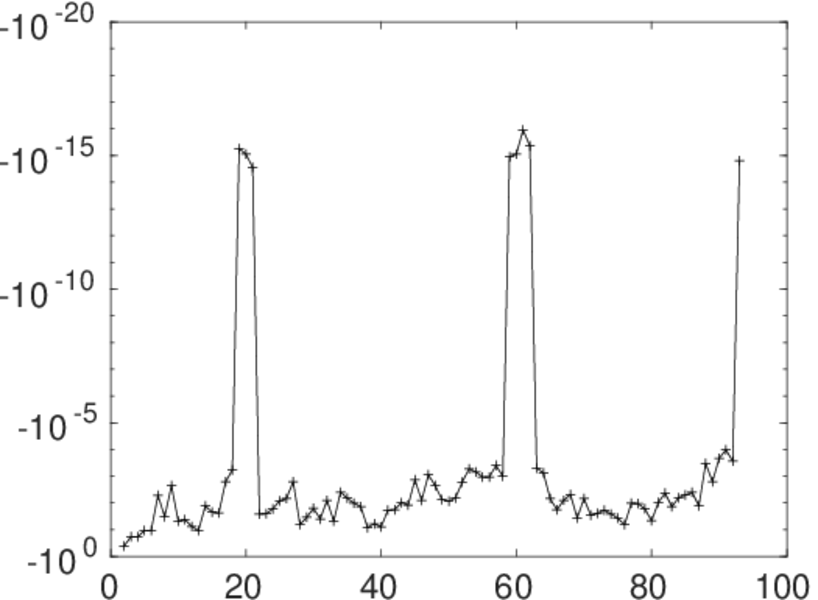
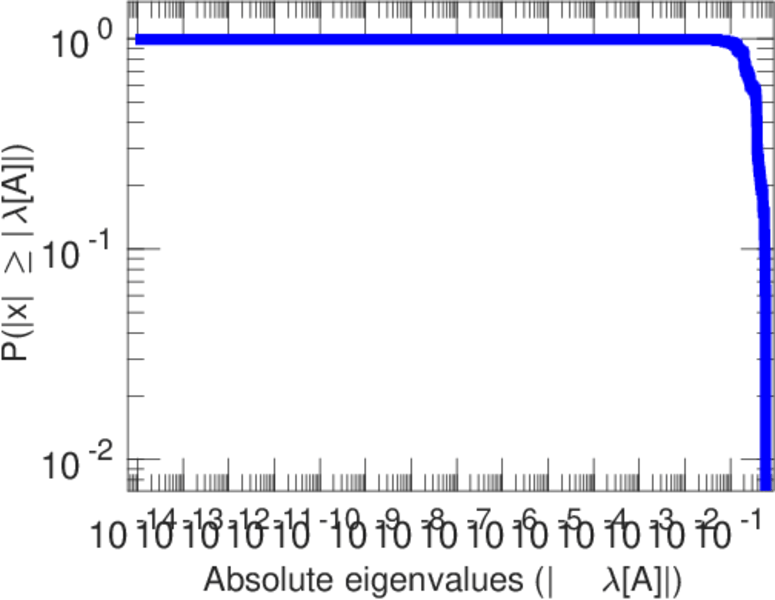
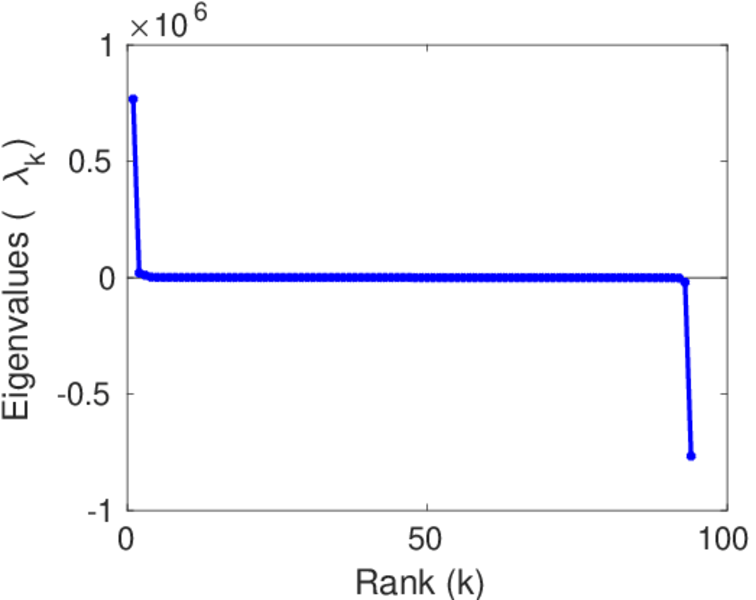
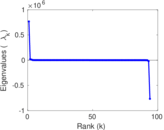
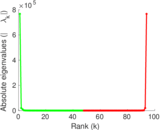
Matrix decompositions plots


Downloads
References
|
[1]
|
Jérôme Kunegis.
KONECT – The Koblenz Network Collection.
In Proc. Int. Conf. on World Wide Web Companion, pages
1343–1350, 2013.
[ http ]
|
|
[2]
|
Wikimedia Foundation.
Wikimedia downloads.
http://dumps.wikimedia.org/, January 2010.
|
 KONECT ‣ Networks ‣
Buy Me a Coffee
KONECT ‣ Networks ‣
Buy Me a Coffee