Wiktionary edits (tr)
This is the bipartite edit network of the Turkish Wiktionary. It contains users
and pages from the Turkish Wiktionary, connected by edit events. Each edge
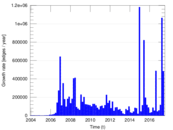
represents an edit. The dataset includes the timestamp of each edit.
Metadata
Statistics
| Size | n = | 381,017
|
| Left size | n1 = | 3,241
|
| Right size | n2 = | 377,776
|
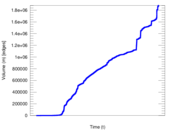
| Volume | m = | 1,882,538
|
| Unique edge count | m̿ = | 1,282,932
|
| Wedge count | s = | 57,016,392,463
|
| Square count | q = | 29,565,933,948
|
| 4-Tour count | T4 = | 464,595,837,812
|
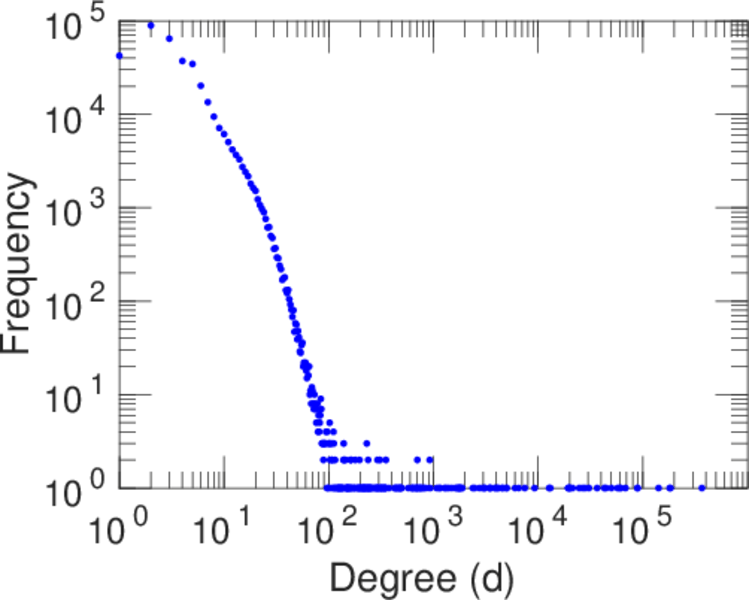
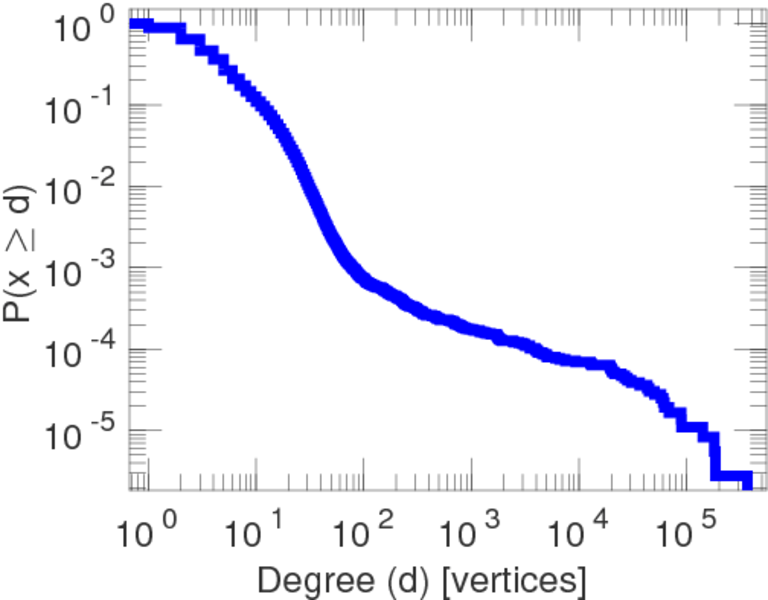
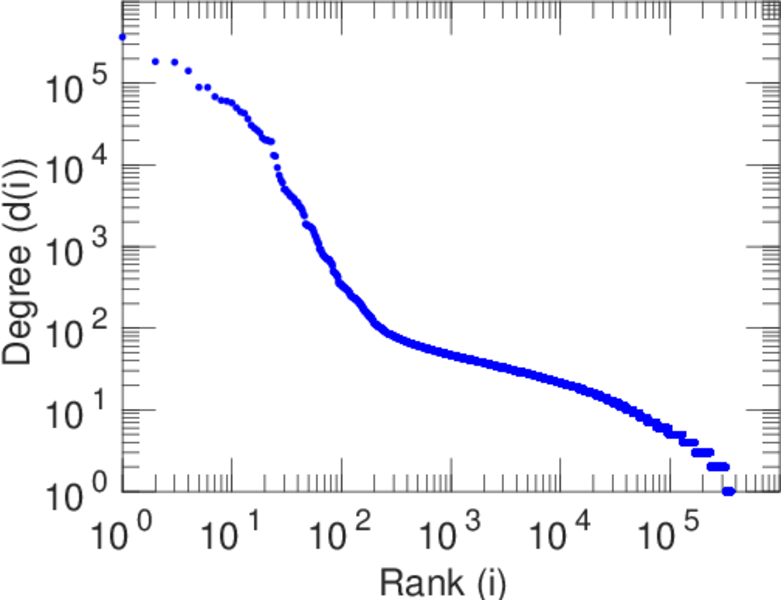
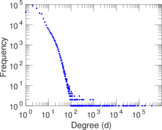
| Maximum degree | dmax = | 366,711
|
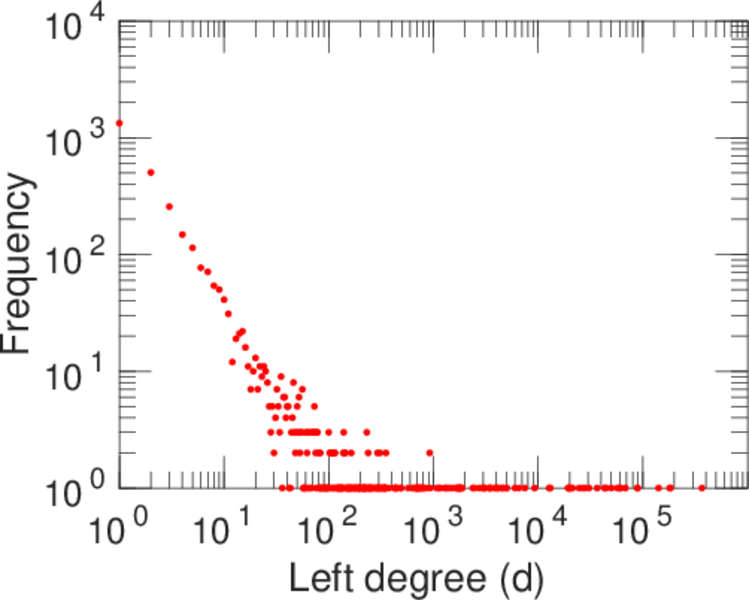
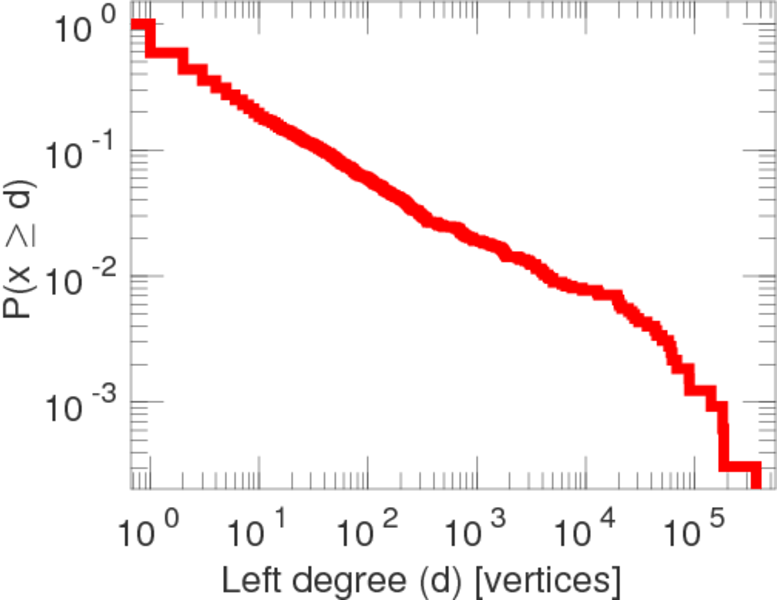
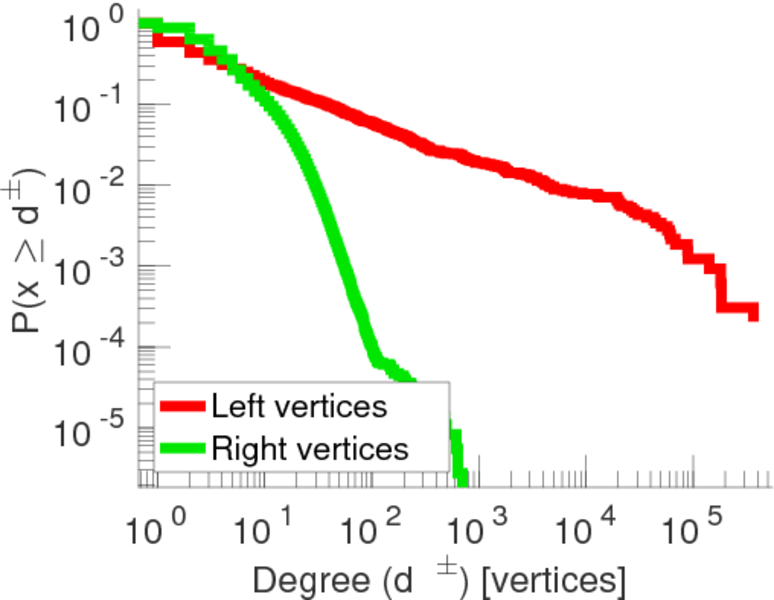
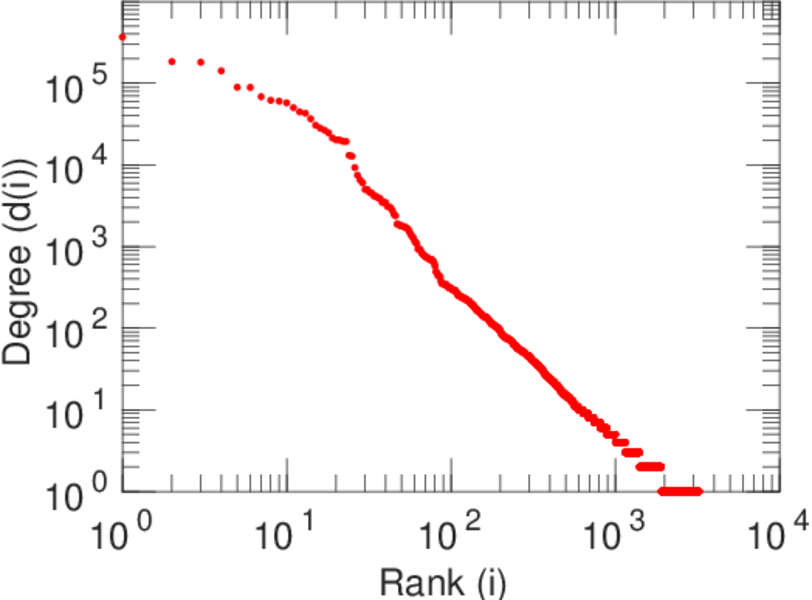
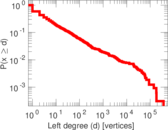
| Maximum left degree | d1max = | 366,711
|
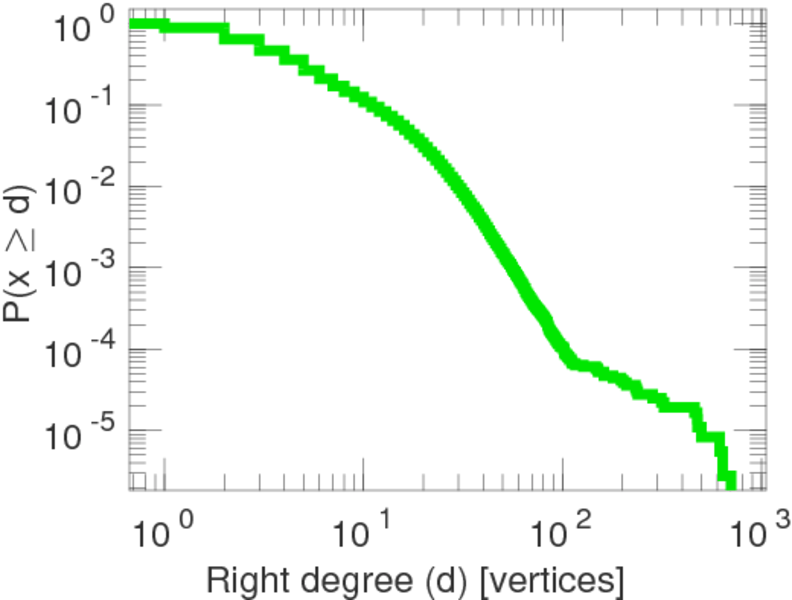
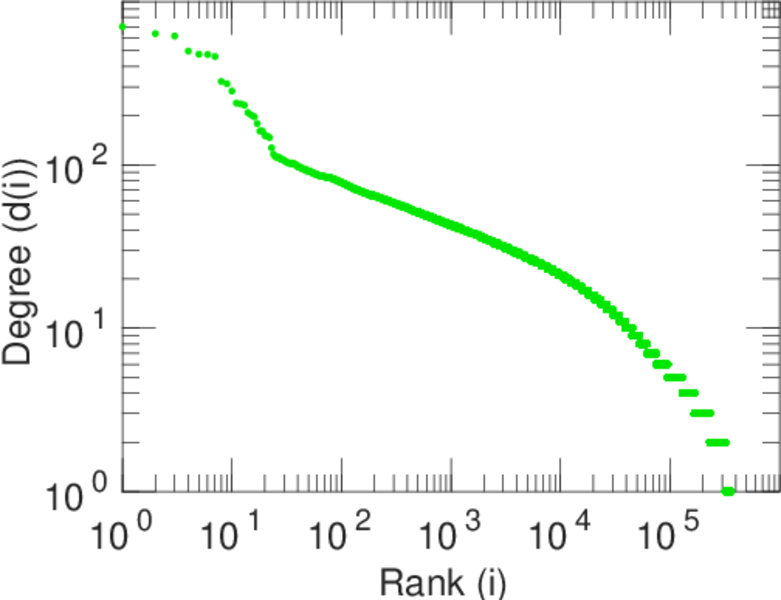
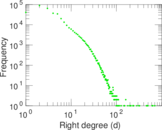
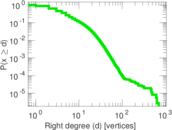
| Maximum right degree | d2max = | 702
|
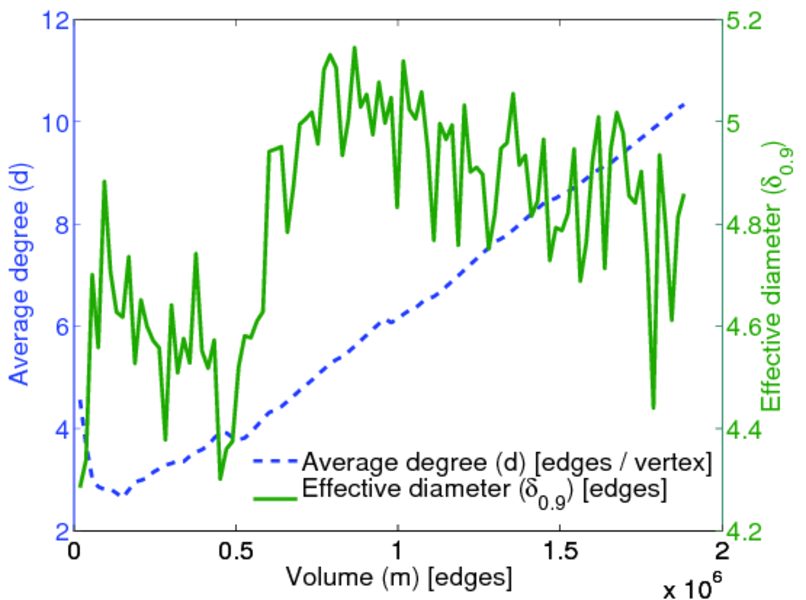
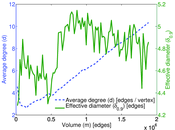
| Average degree | d = | 9.881 65
|
| Average left degree | d1 = | 580.851
|
| Average right degree | d2 = | 4.983 21
|
| Fill | p = | 0.001 047 83
|
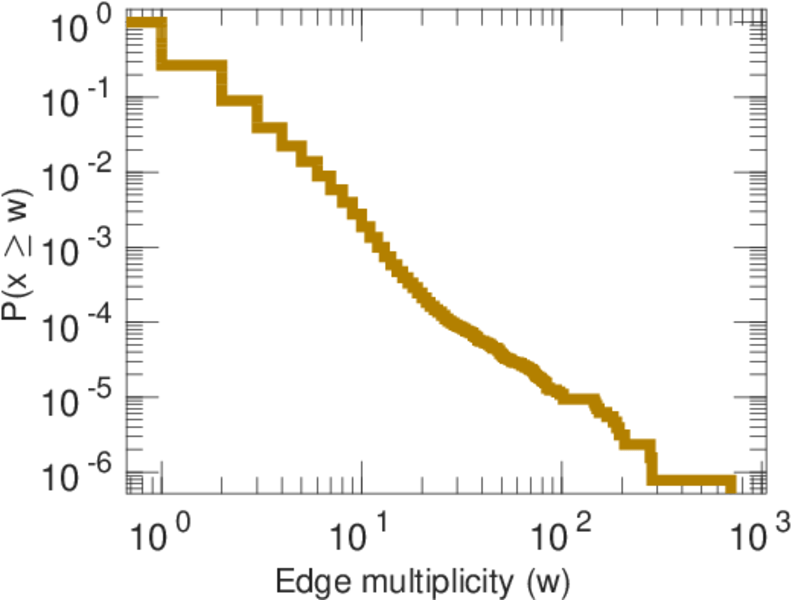
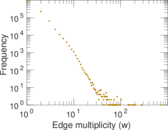
| Average edge multiplicity | m̃ = | 1.467 37
|
| Size of LCC | N = | 363,160
|
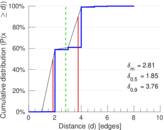
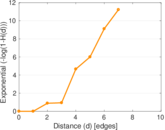
| Diameter | δ = | 11
|
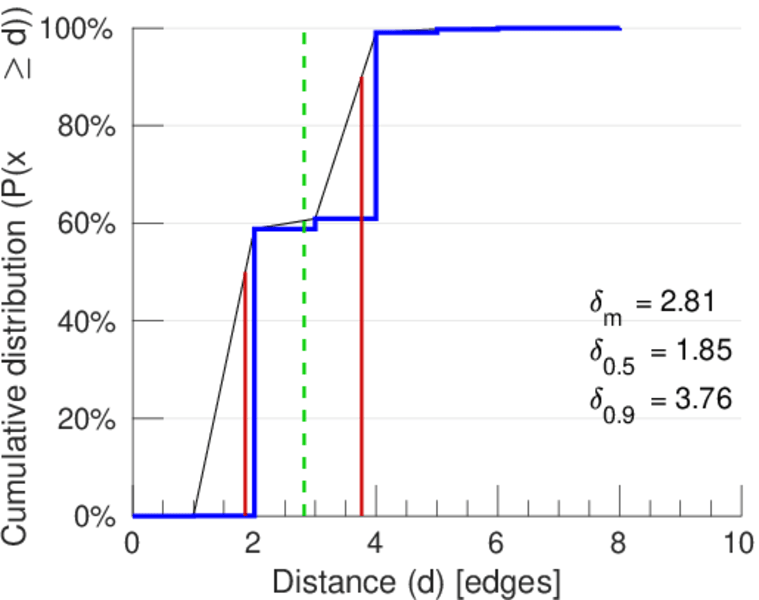
| 50-Percentile effective diameter | δ0.5 = | 1.850 09
|
| 90-Percentile effective diameter | δ0.9 = | 3.762 64
|
| Median distance | δM = | 2
|
| Mean distance | δm = | 2.814 77
|
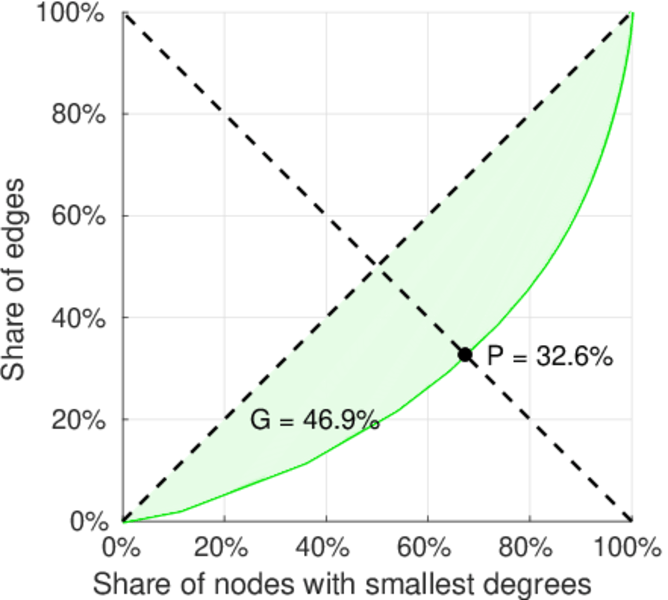
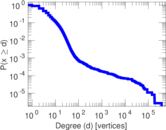
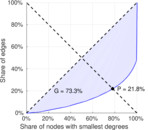
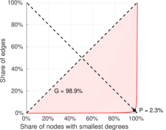
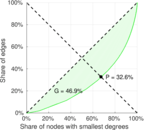
| Gini coefficient | G = | 0.733 693
|
| Balanced inequality ratio | P = | 0.217 299
|
| Left balanced inequality ratio | P1 = | 0.022 607 8
|
| Right balanced inequality ratio | P2 = | 0.325 735
|
| Relative edge distribution entropy | Her = | 0.675 755
|
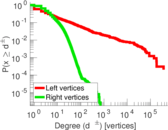
| Power law exponent | γ = | 1.974 99
|
| Tail power law exponent | γt = | 1.531 00
|
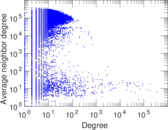
| Degree assortativity | ρ = | −0.285 379
|
| Degree assortativity p-value | pρ = | 0.000 00
|
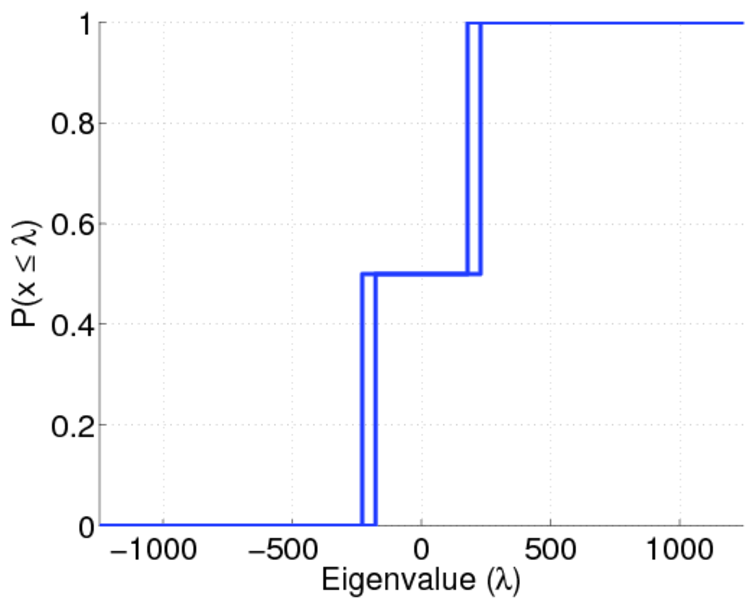
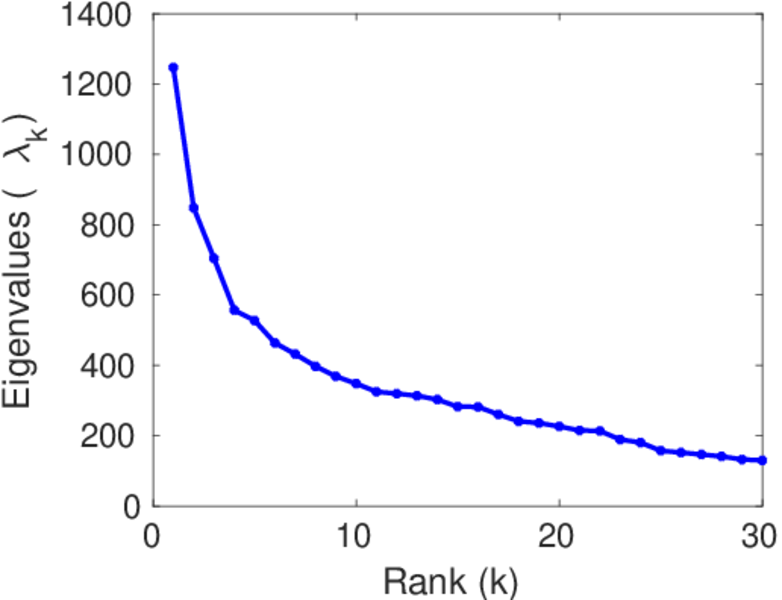
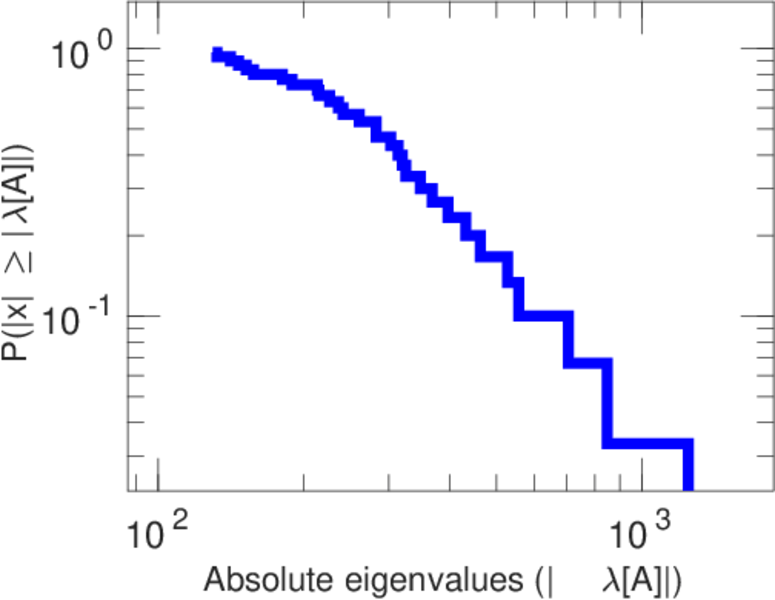
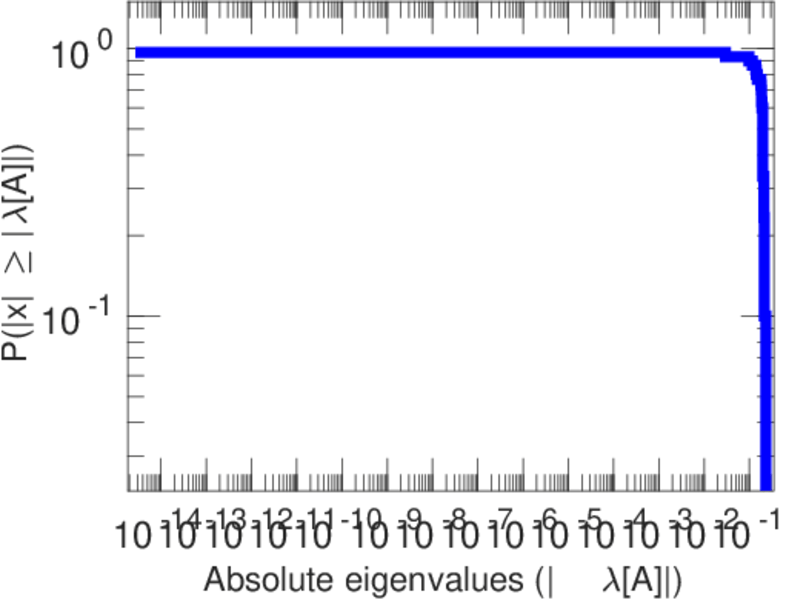
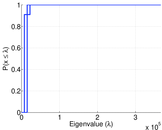
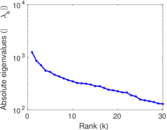
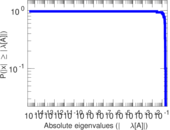
| Spectral norm | α = | 1,246.93
|
| Algebraic connectivity | a = | 0.029 574 5
|
| Spectral separation | |λ1[A] / λ2[A]| = | 1.470 40
|
| Controllability | C = | 358,061
|
| Relative controllability | Cr = | 0.983 117
|
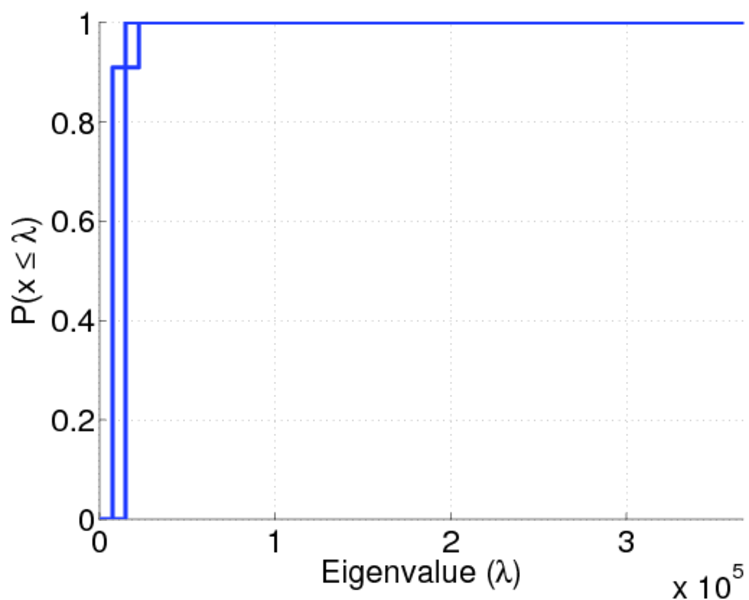
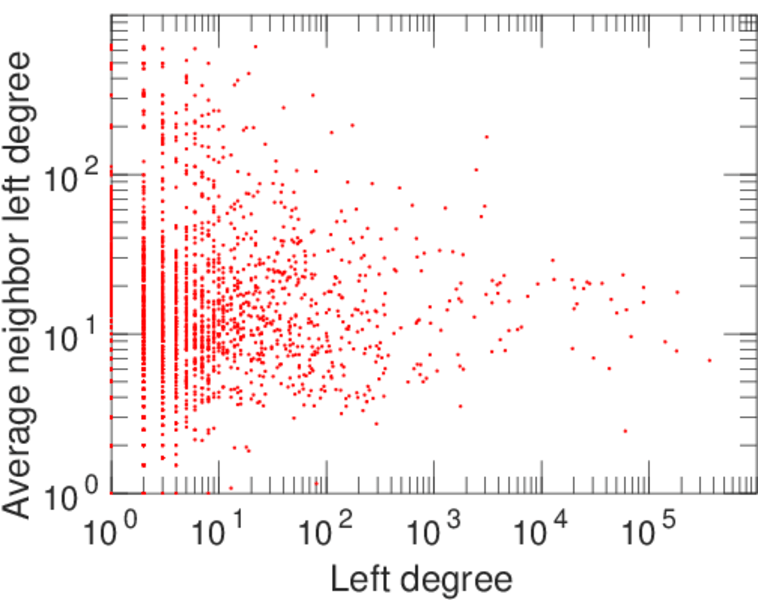
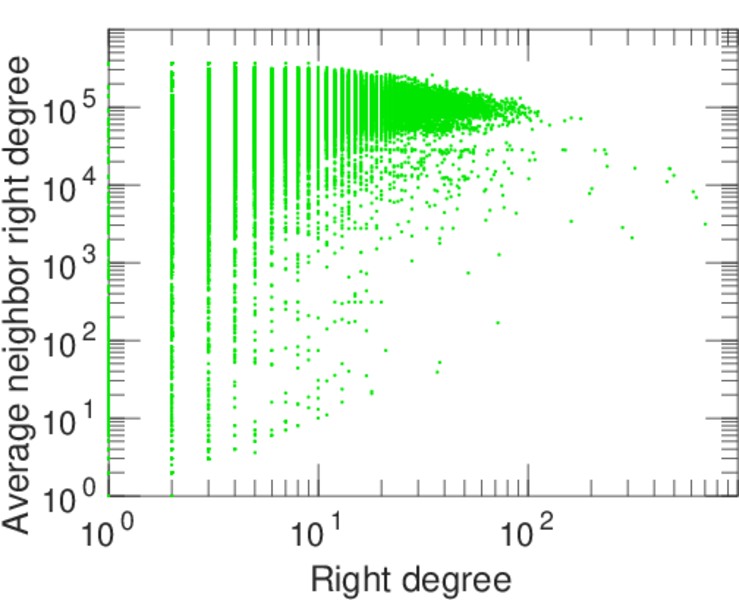
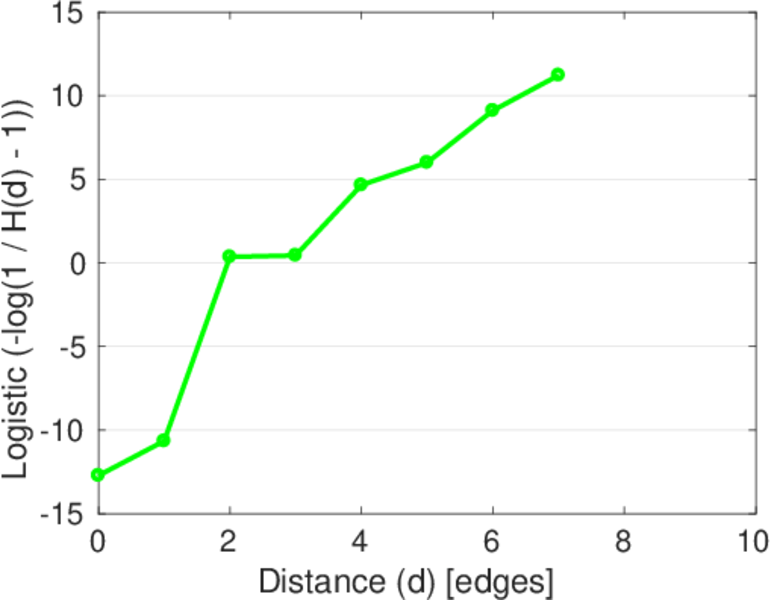
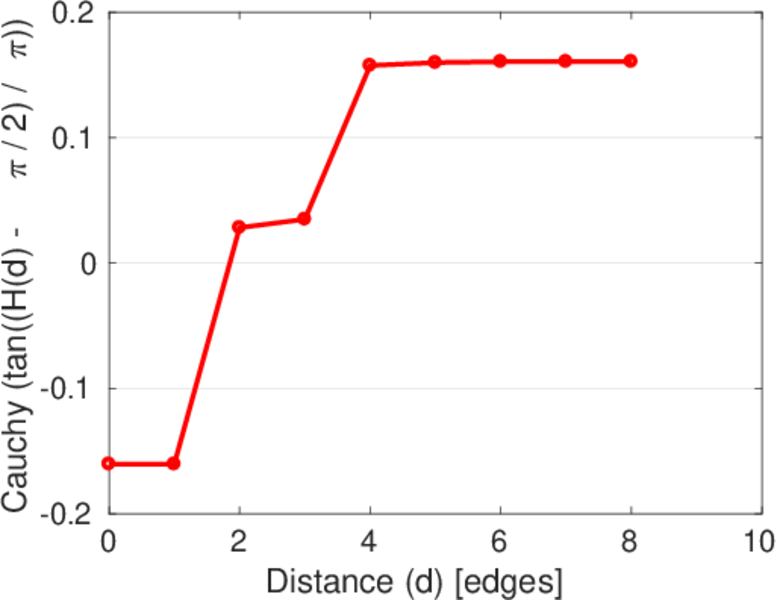
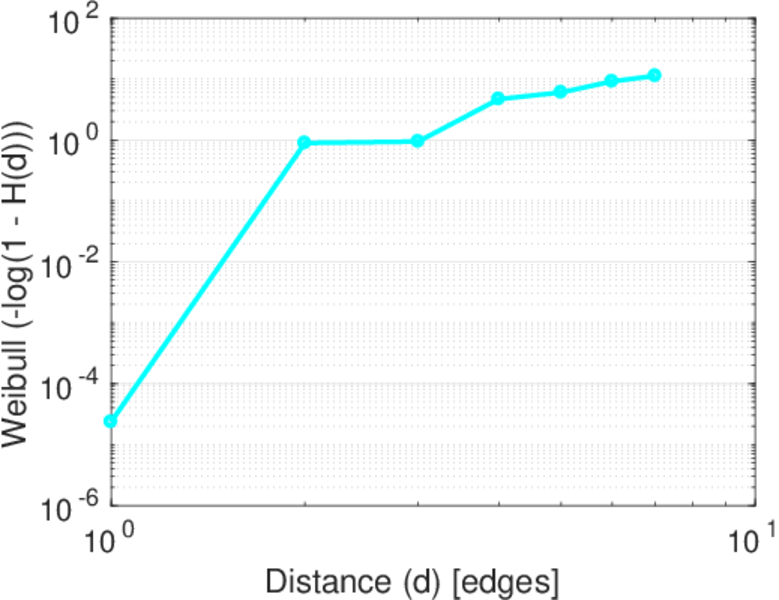
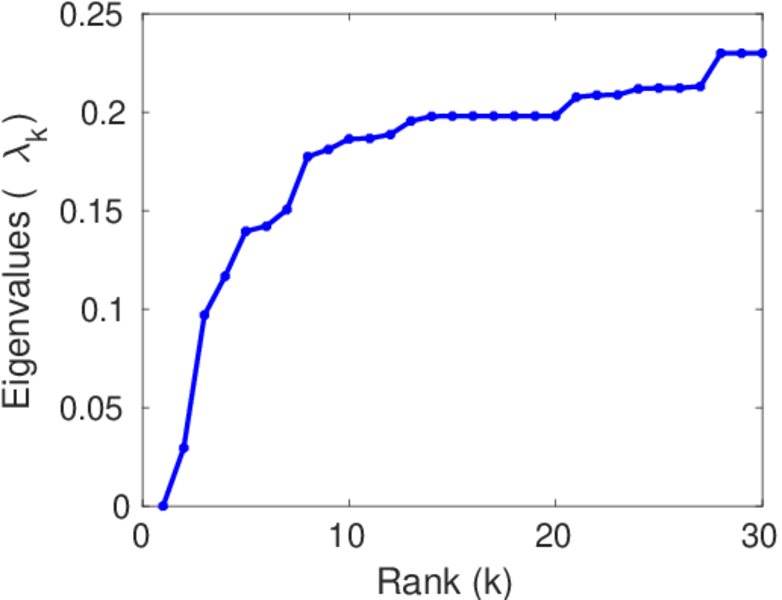
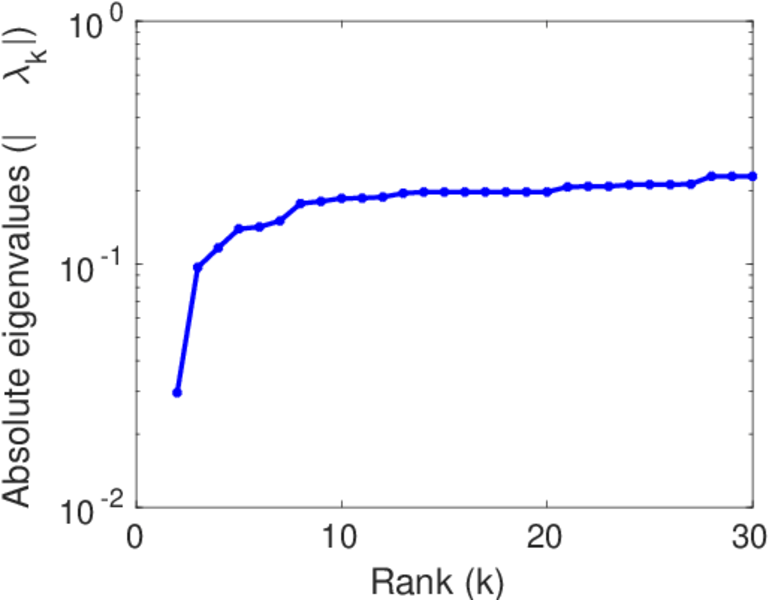
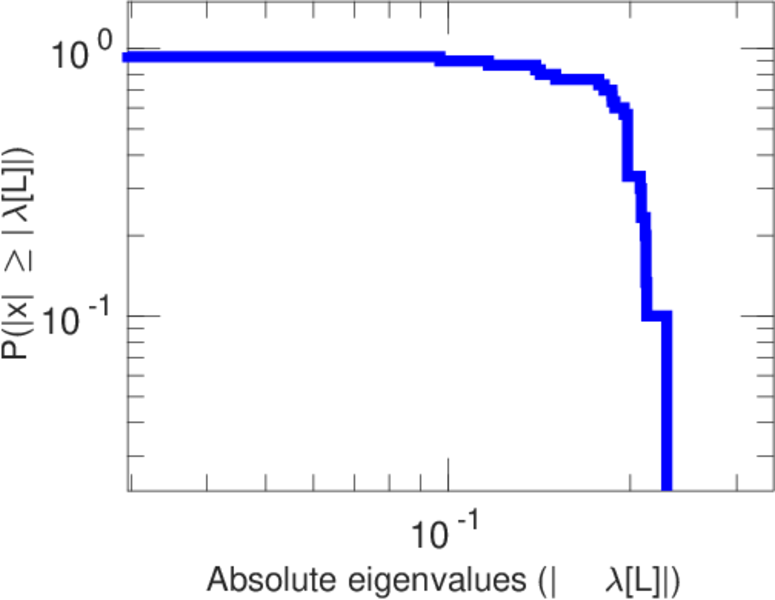
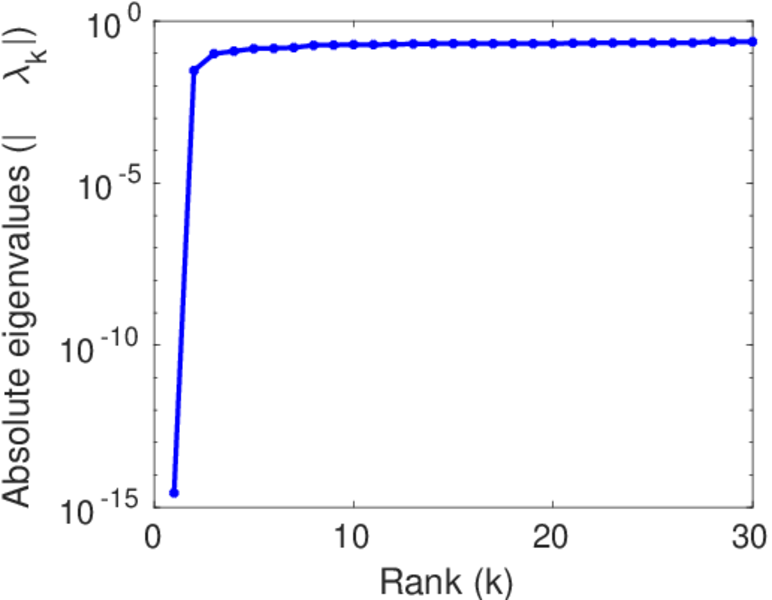
Plots


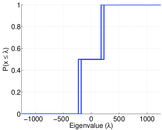
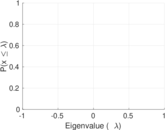
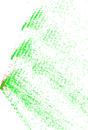

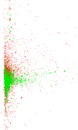


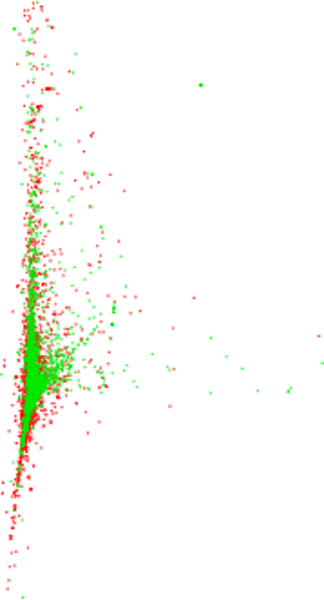
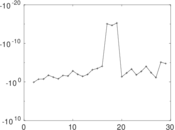
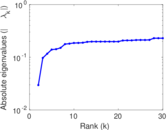
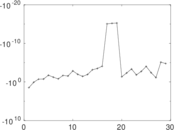
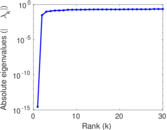
Matrix decompositions plots


Downloads
References
|
[1]
|
Jérôme Kunegis.
KONECT – The Koblenz Network Collection.
In Proc. Int. Conf. on World Wide Web Companion, pages
1343–1350, 2013.
[ http ]
|
|
[2]
|
Wikimedia Foundation.
Wikimedia downloads.
http://dumps.wikimedia.org/, January 2010.
|
 KONECT ‣ Networks ‣
Buy Me a Coffee
KONECT ‣ Networks ‣
Buy Me a Coffee