Wikipedia edits (ts)
This is the bipartite edit network of the Tsonga Wikipedia. It contains users
and pages from the Tsonga Wikipedia, connected by edit events. Each edge
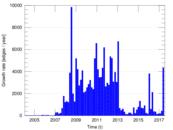
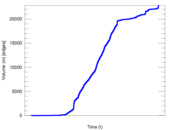
represents an edit. The dataset includes the timestamp of each edit.
Metadata
Statistics
| Size | n = | 2,915
|
| Left size | n1 = | 569
|
| Right size | n2 = | 2,346
|
| Volume | m = | 22,812
|
| Unique edge count | m̿ = | 8,912
|
| Wedge count | s = | 904,666
|
| Claw count | z = | 117,156,455
|
| Cross count | x = | 17,856,347,033
|
| Square count | q = | 2,315,175
|
| 4-Tour count | T4 = | 22,163,280
|
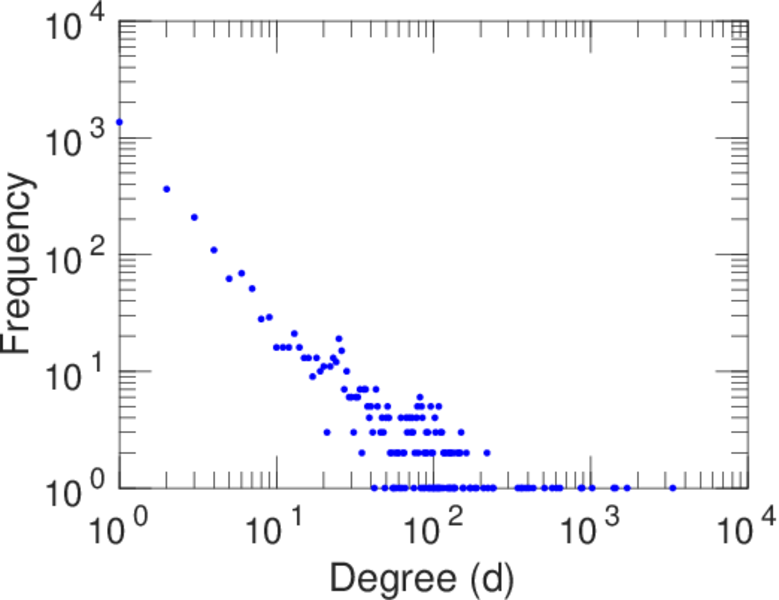
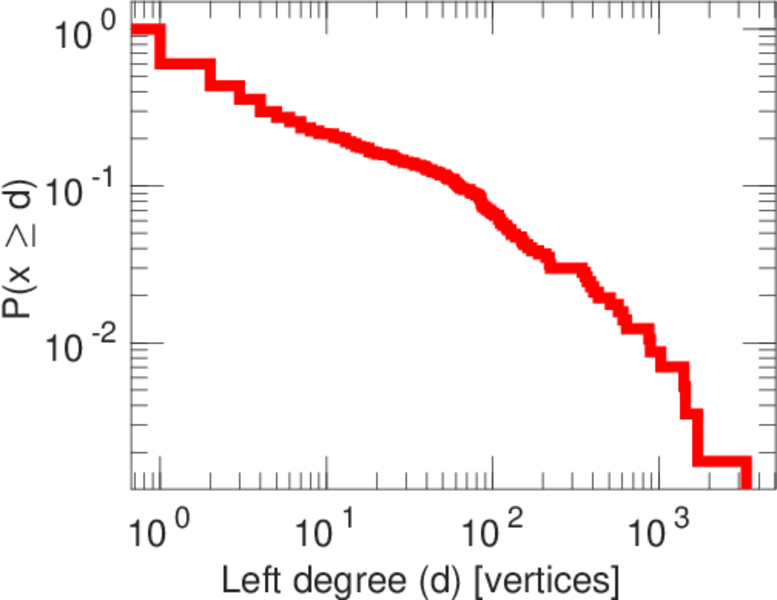
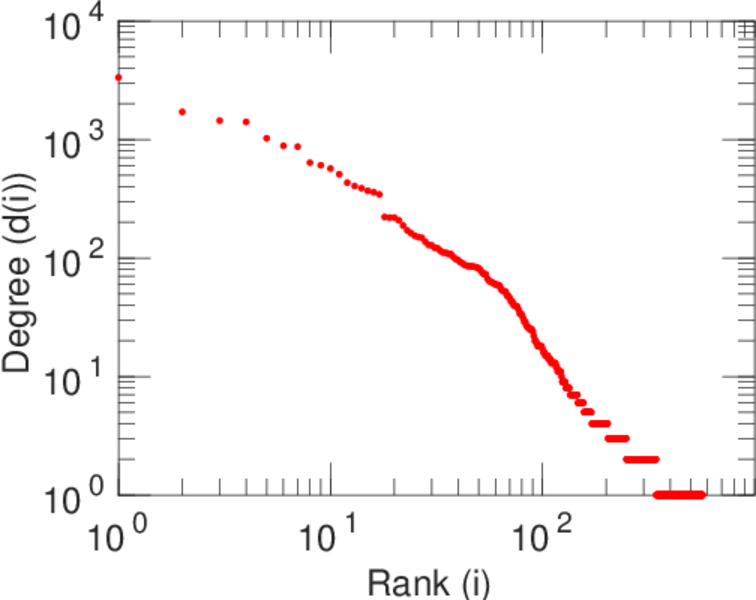
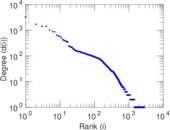
| Maximum degree | dmax = | 3,338
|
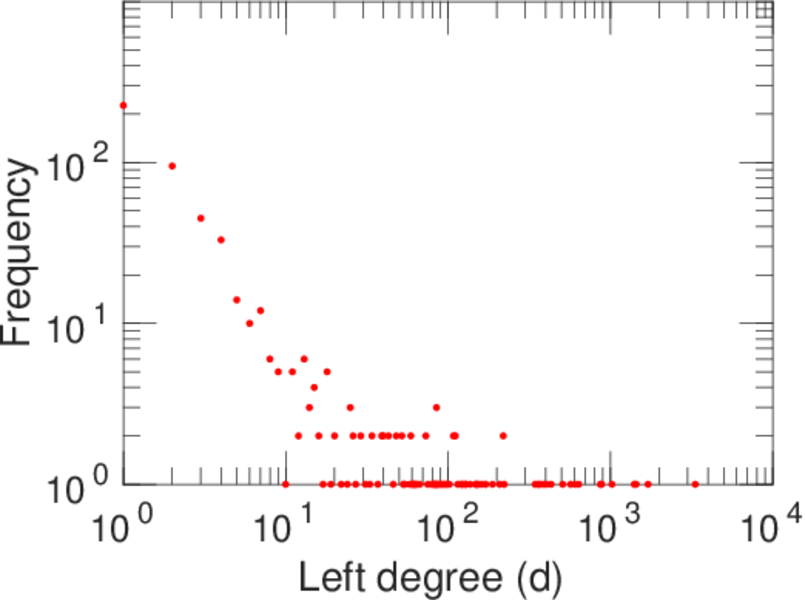
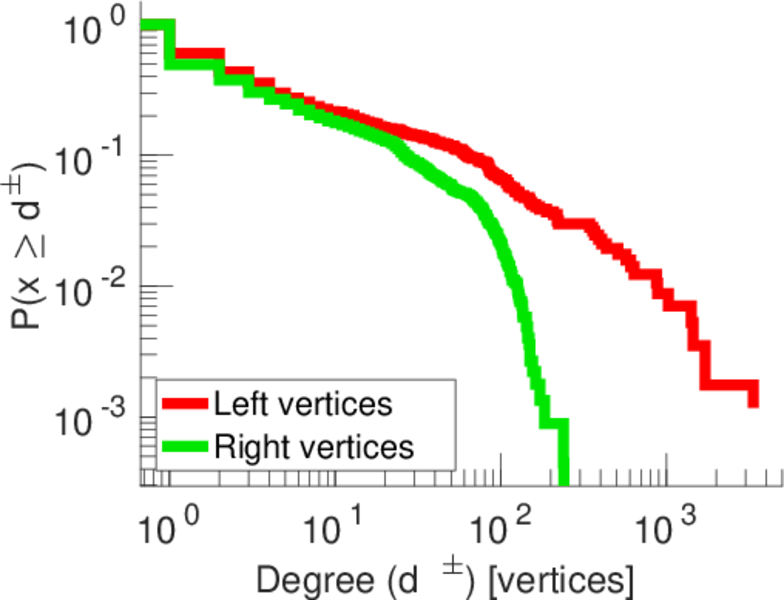
| Maximum left degree | d1max = | 3,338
|
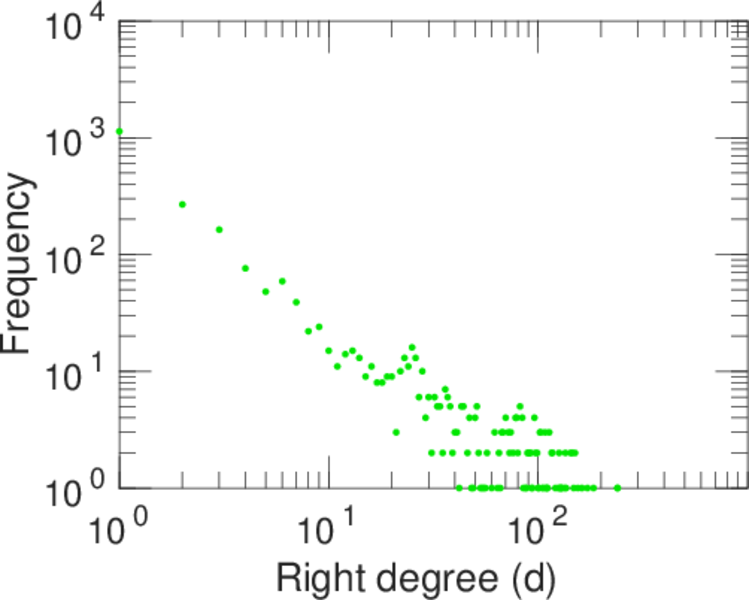
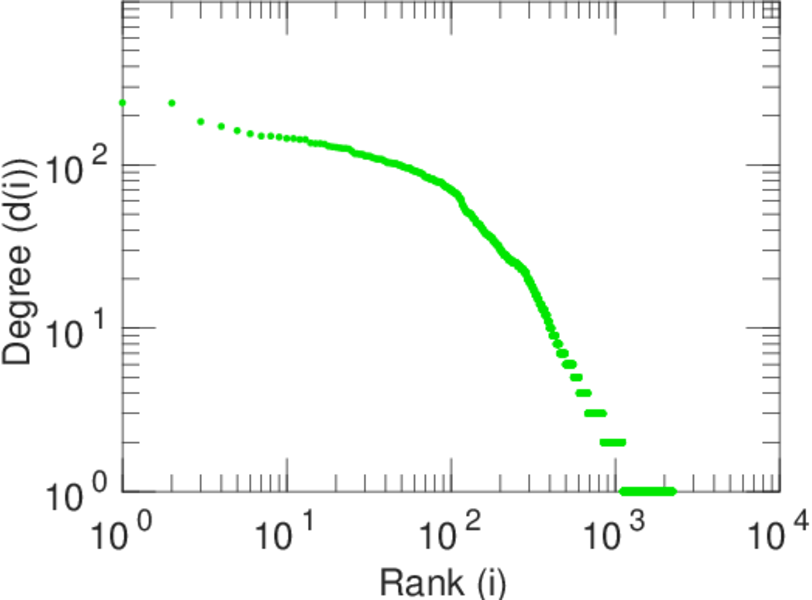
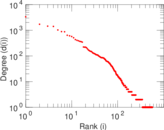
| Maximum right degree | d2max = | 240
|
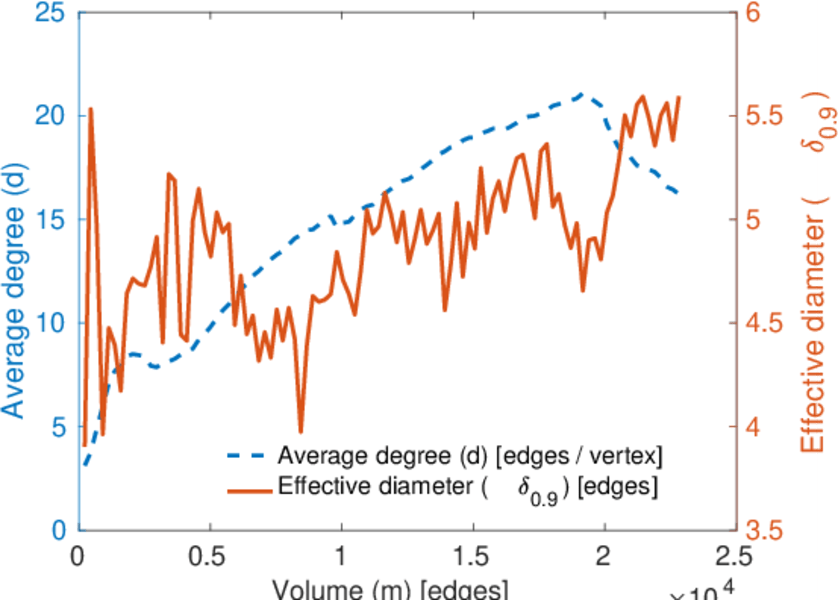
| Average degree | d = | 15.651 5
|
| Average left degree | d1 = | 40.091 4
|
| Average right degree | d2 = | 9.723 79
|
| Fill | p = | 0.006 676 29
|
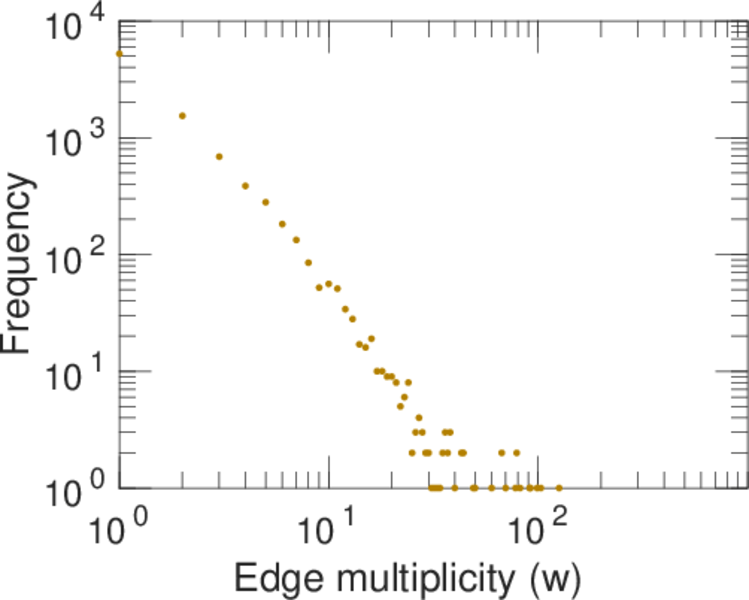
| Average edge multiplicity | m̃ = | 2.559 69
|
| Size of LCC | N = | 2,279
|
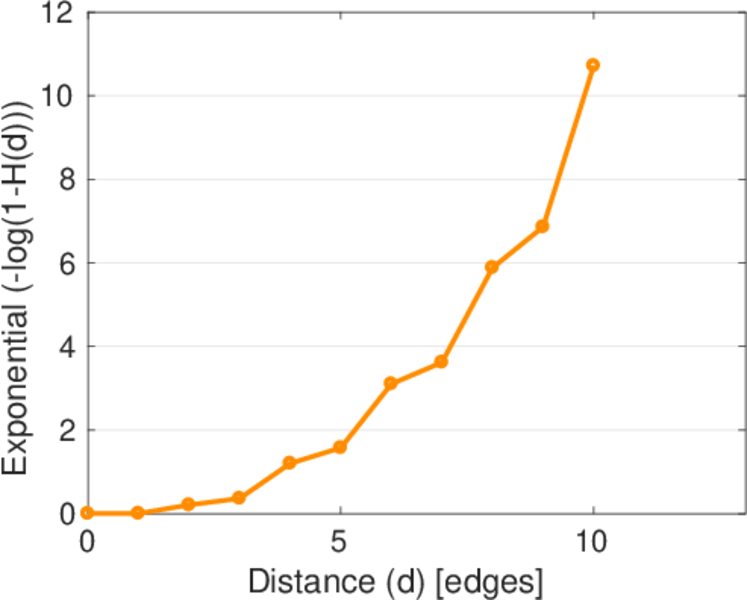
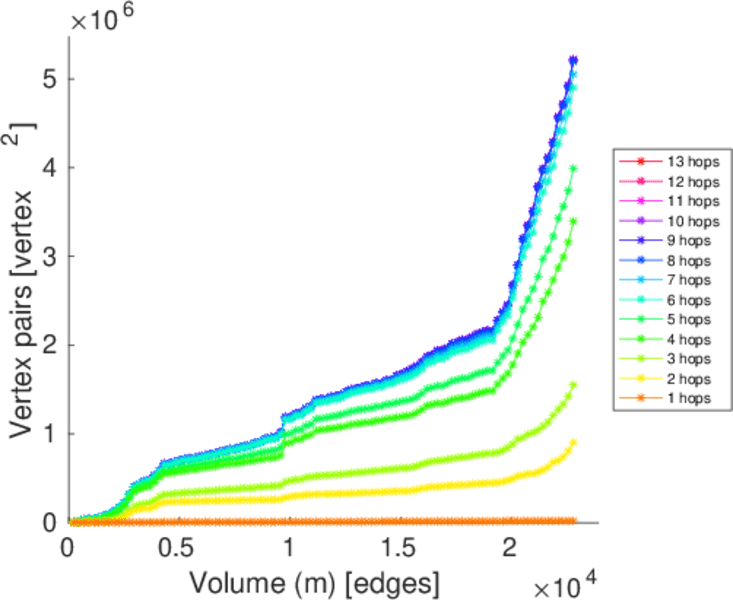
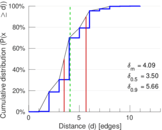
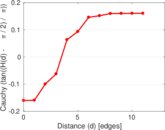
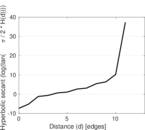
| Diameter | δ = | 12
|
| 50-Percentile effective diameter | δ0.5 = | 3.495 84
|
| 90-Percentile effective diameter | δ0.9 = | 5.660 53
|
| Median distance | δM = | 4
|
| Mean distance | δm = | 4.087 89
|
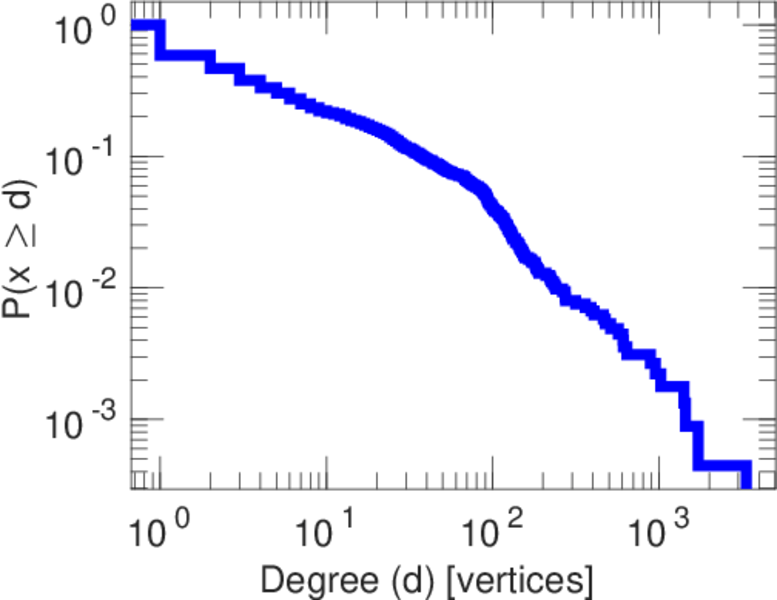
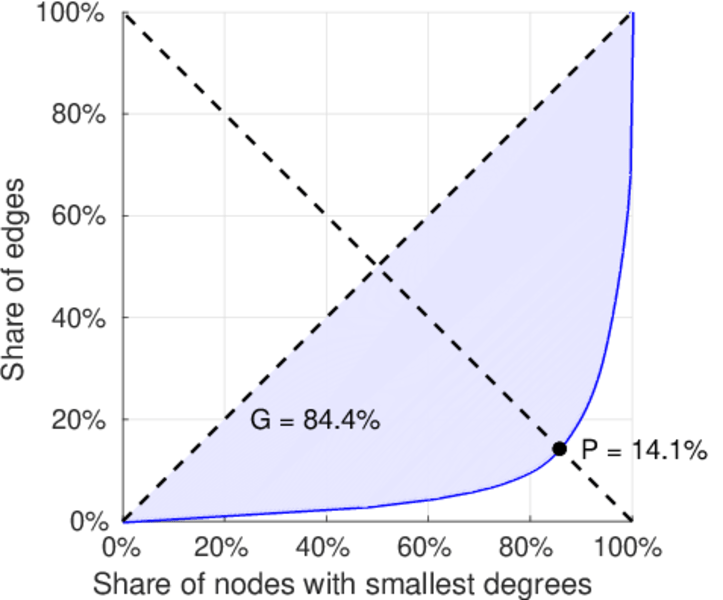
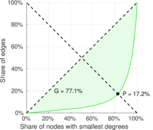
| Gini coefficient | G = | 0.844 261
|
| Balanced inequality ratio | P = | 0.143 740
|
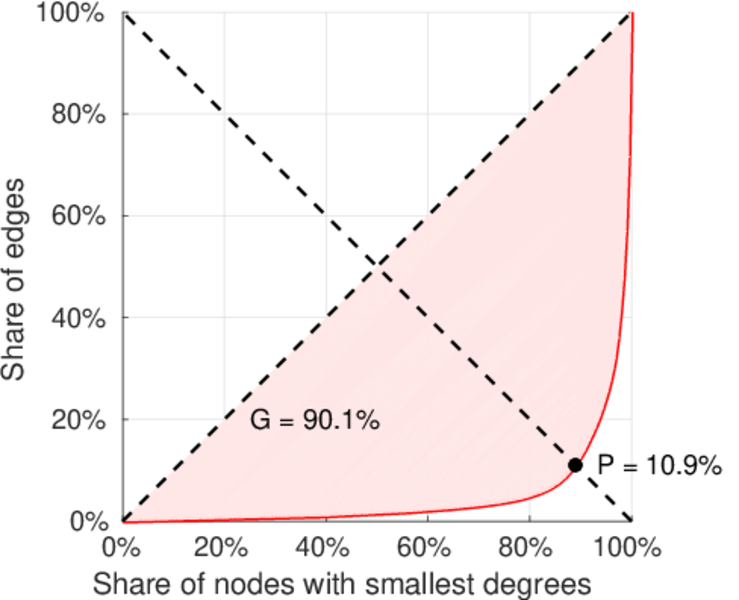
| Left balanced inequality ratio | P1 = | 0.108 759
|
| Right balanced inequality ratio | P2 = | 0.171 620
|
| Relative edge distribution entropy | Her = | 0.802 355
|
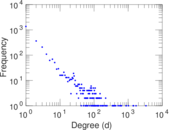
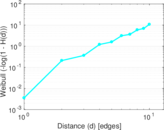
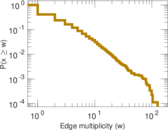
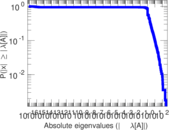
| Power law exponent | γ = | 2.510 65
|
| Tail power law exponent | γt = | 1.911 00
|
| Tail power law exponent with p | γ3 = | 1.911 00
|
| p-value | p = | 0.000 00
|
| Left tail power law exponent with p | γ3,1 = | 1.651 00
|
| Left p-value | p1 = | 0.001 000 00
|
| Right tail power law exponent with p | γ3,2 = | 2.011 00
|
| Right p-value | p2 = | 0.000 00
|
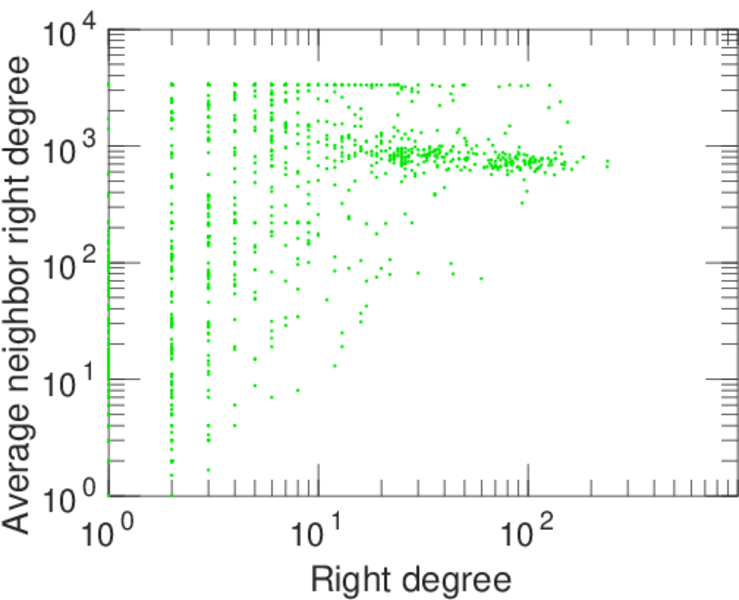
| Degree assortativity | ρ = | −0.268 430
|
| Degree assortativity p-value | pρ = | 6.451 89 × 10−147
|
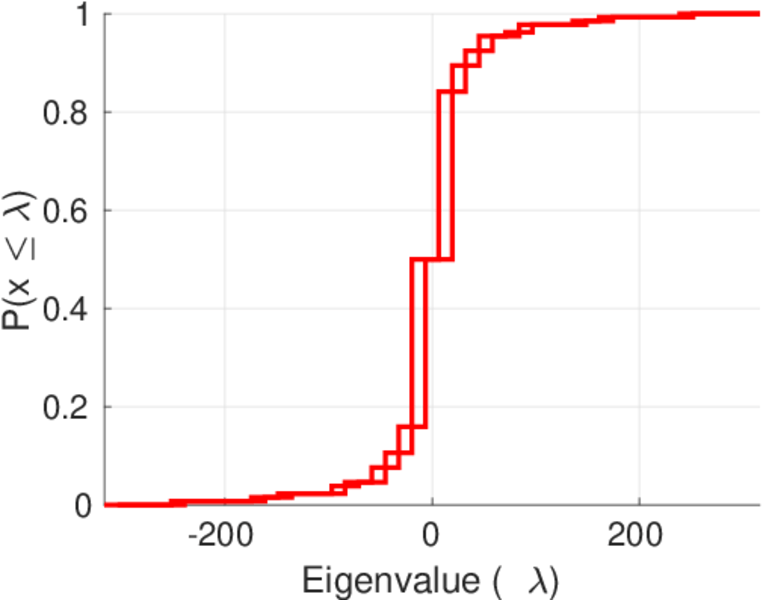
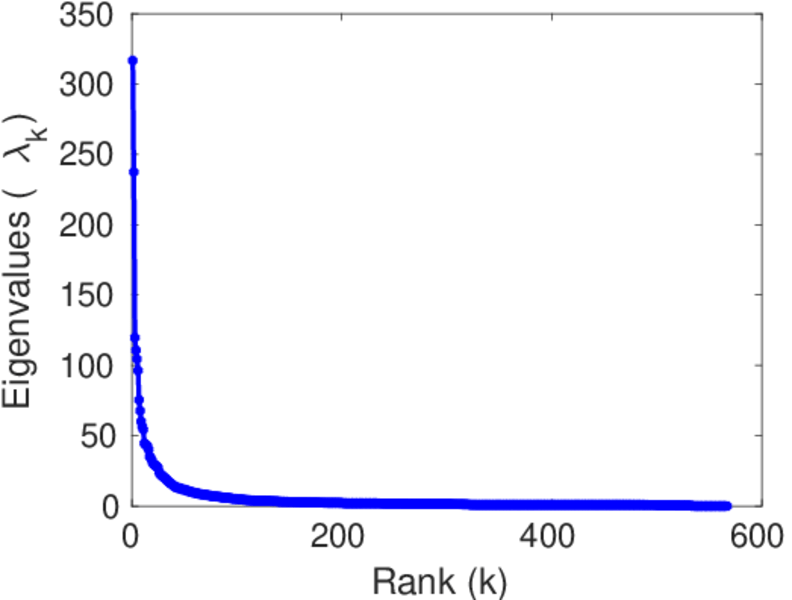
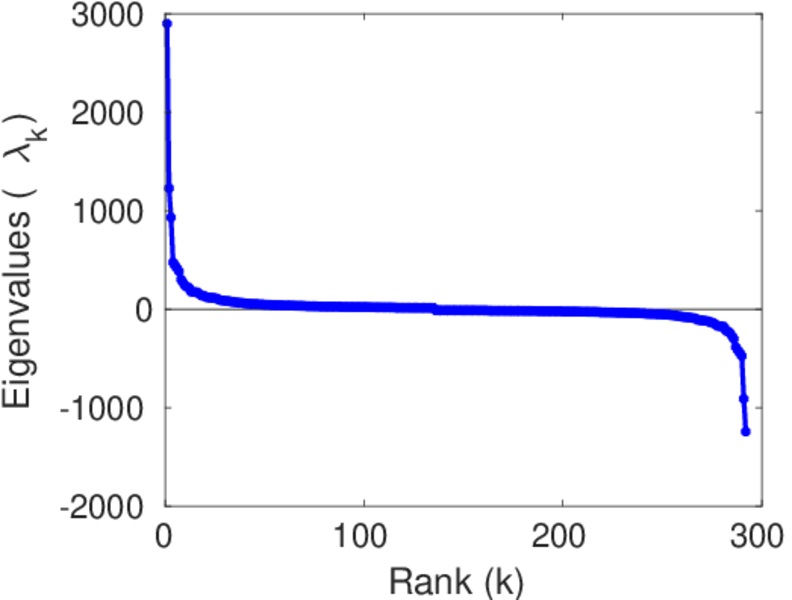
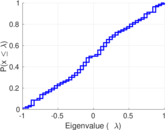
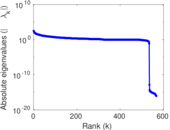
| Spectral norm | α = | 316.656
|
| Algebraic connectivity | a = | 0.020 292 5
|
| Spectral separation | |λ1[A] / λ2[A]| = | 1.333 66
|
| Controllability | C = | 1,745
|
| Relative controllability | Cr = | 0.620 334
|
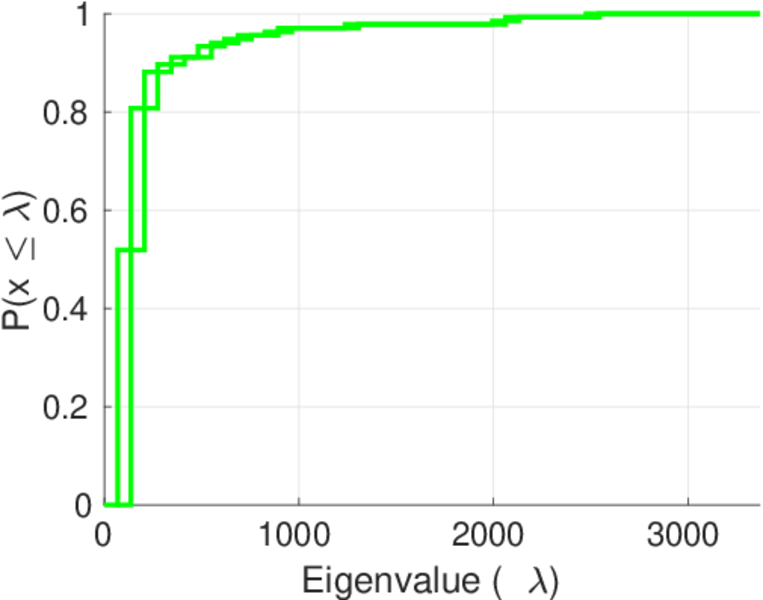
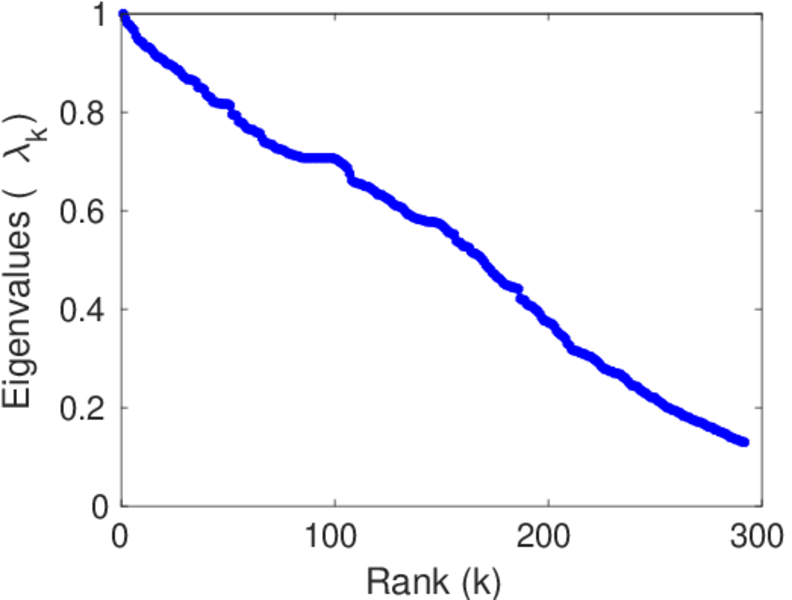
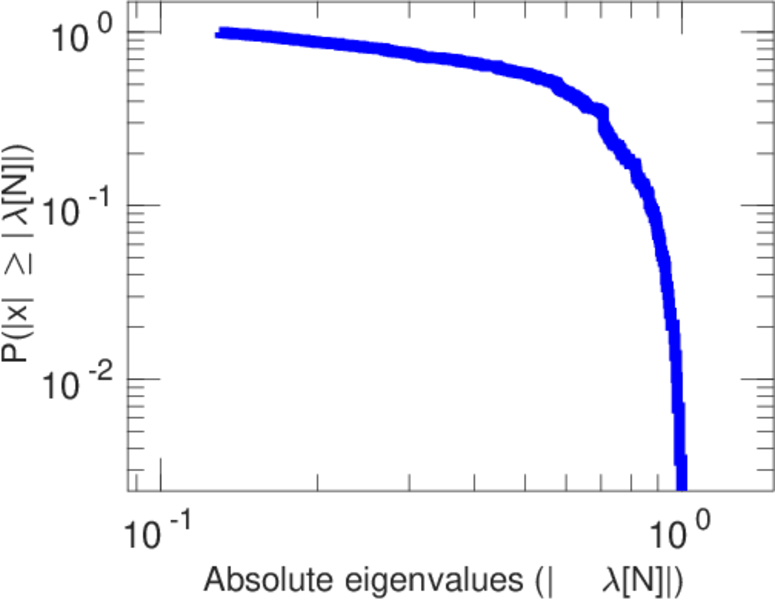
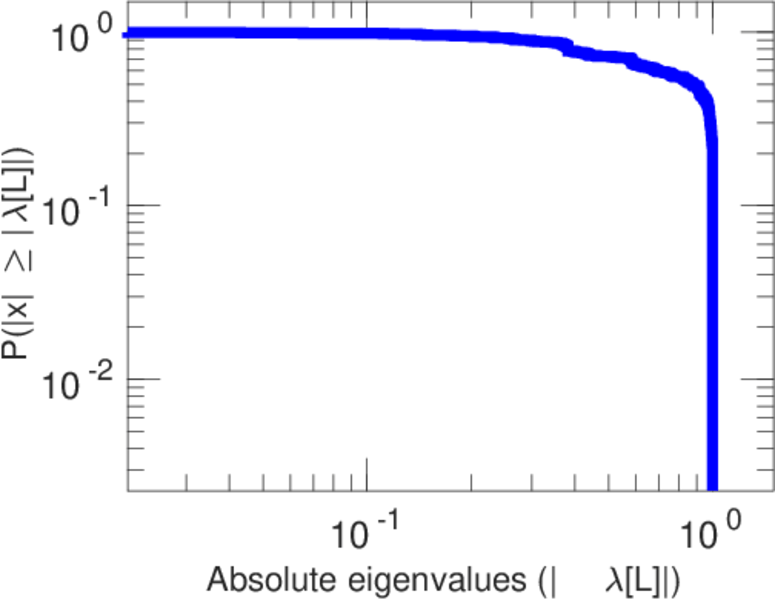
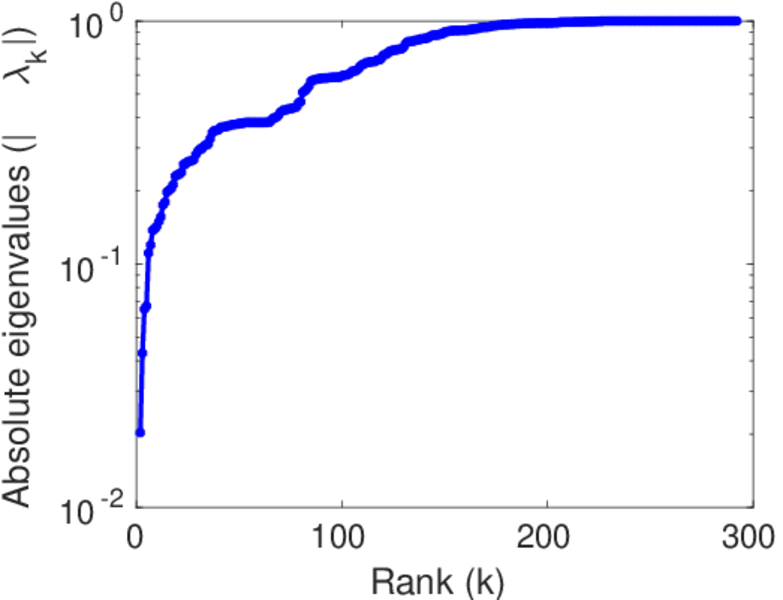
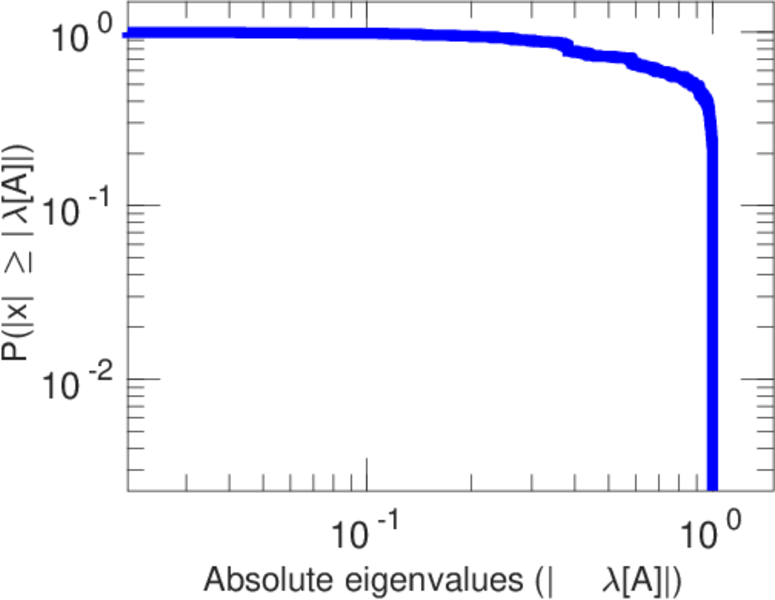
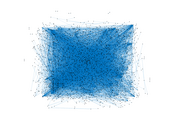
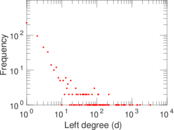
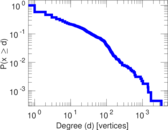
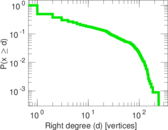
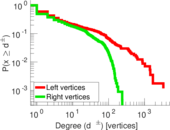
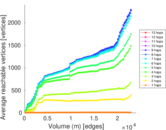
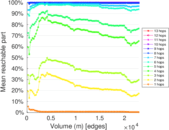
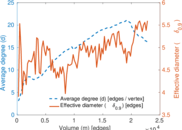
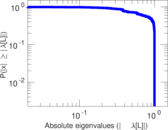
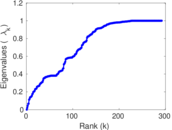
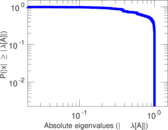
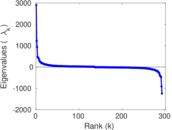
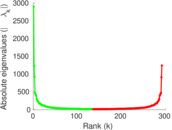
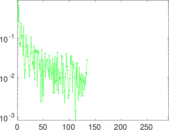
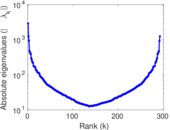
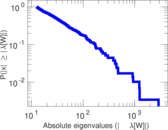
Plots


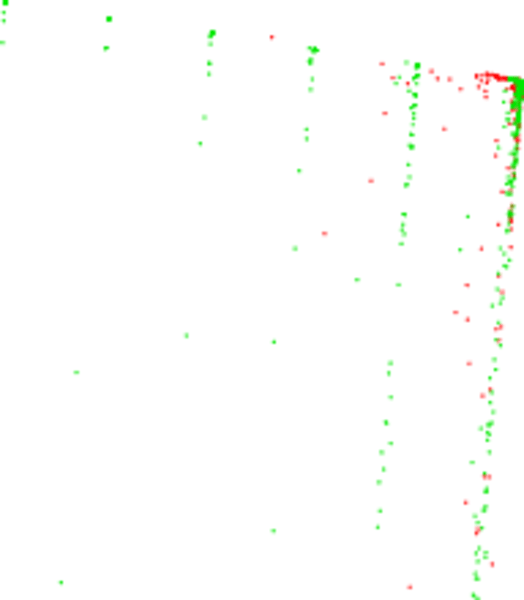
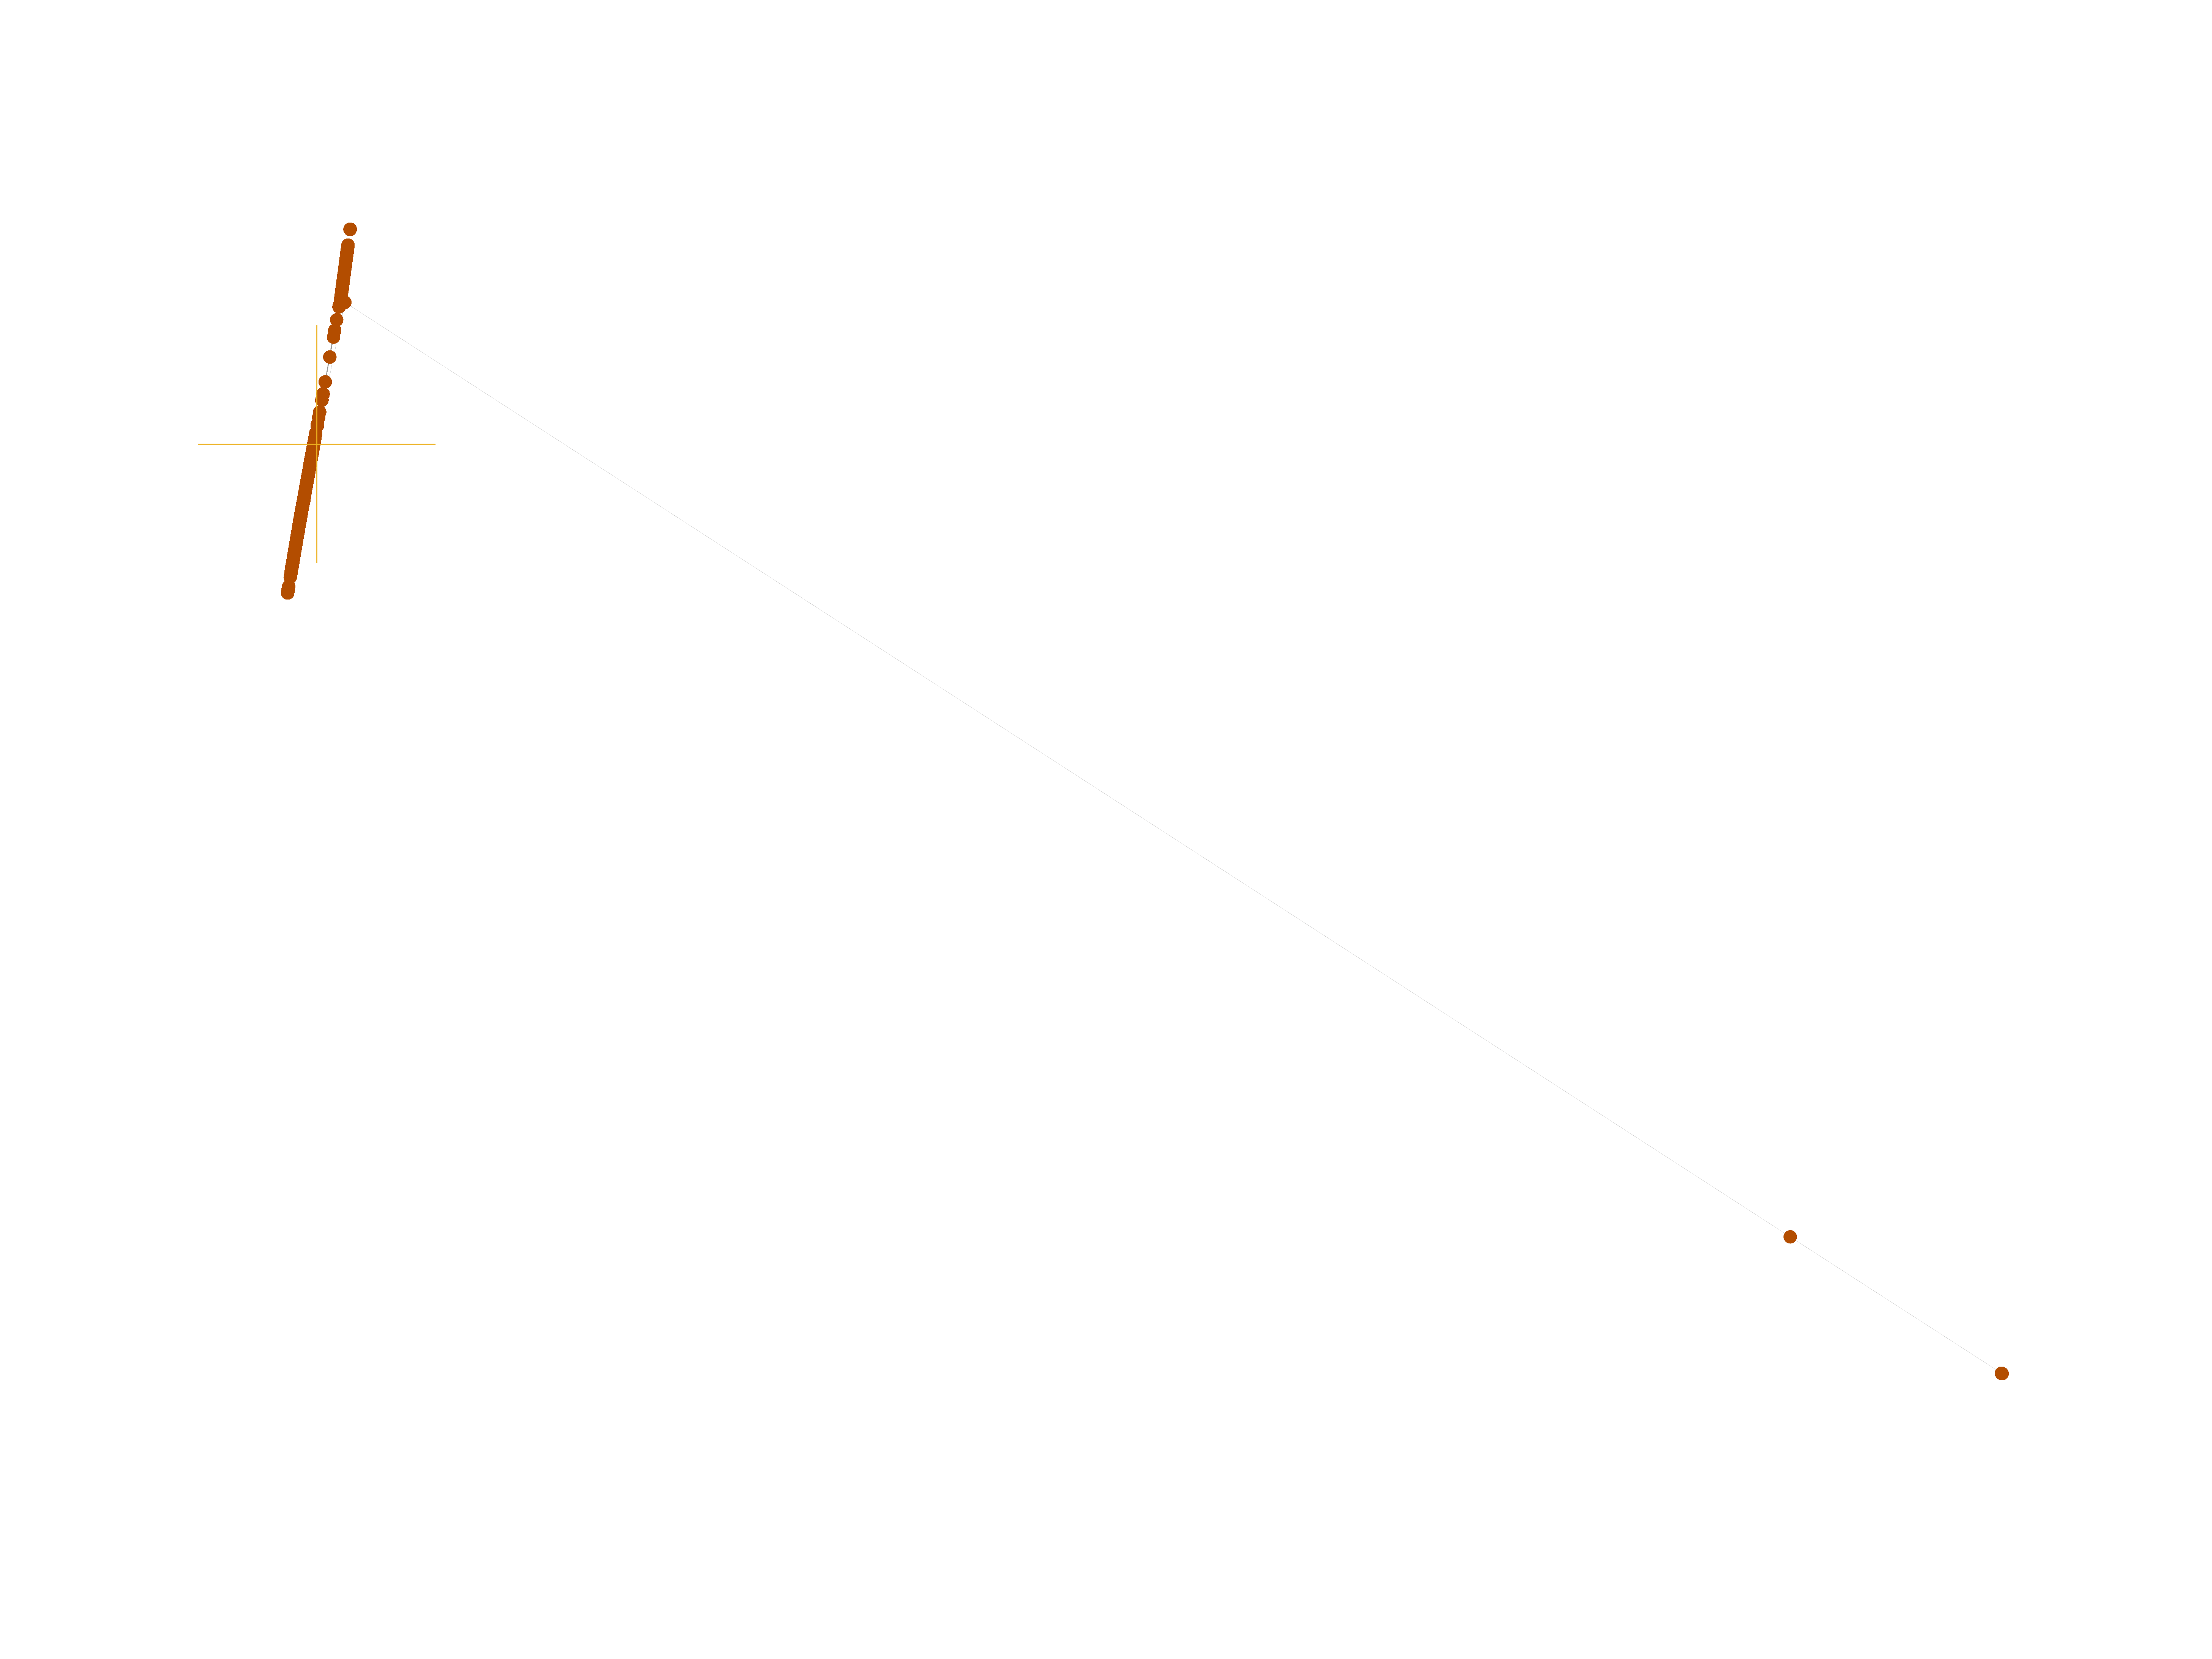
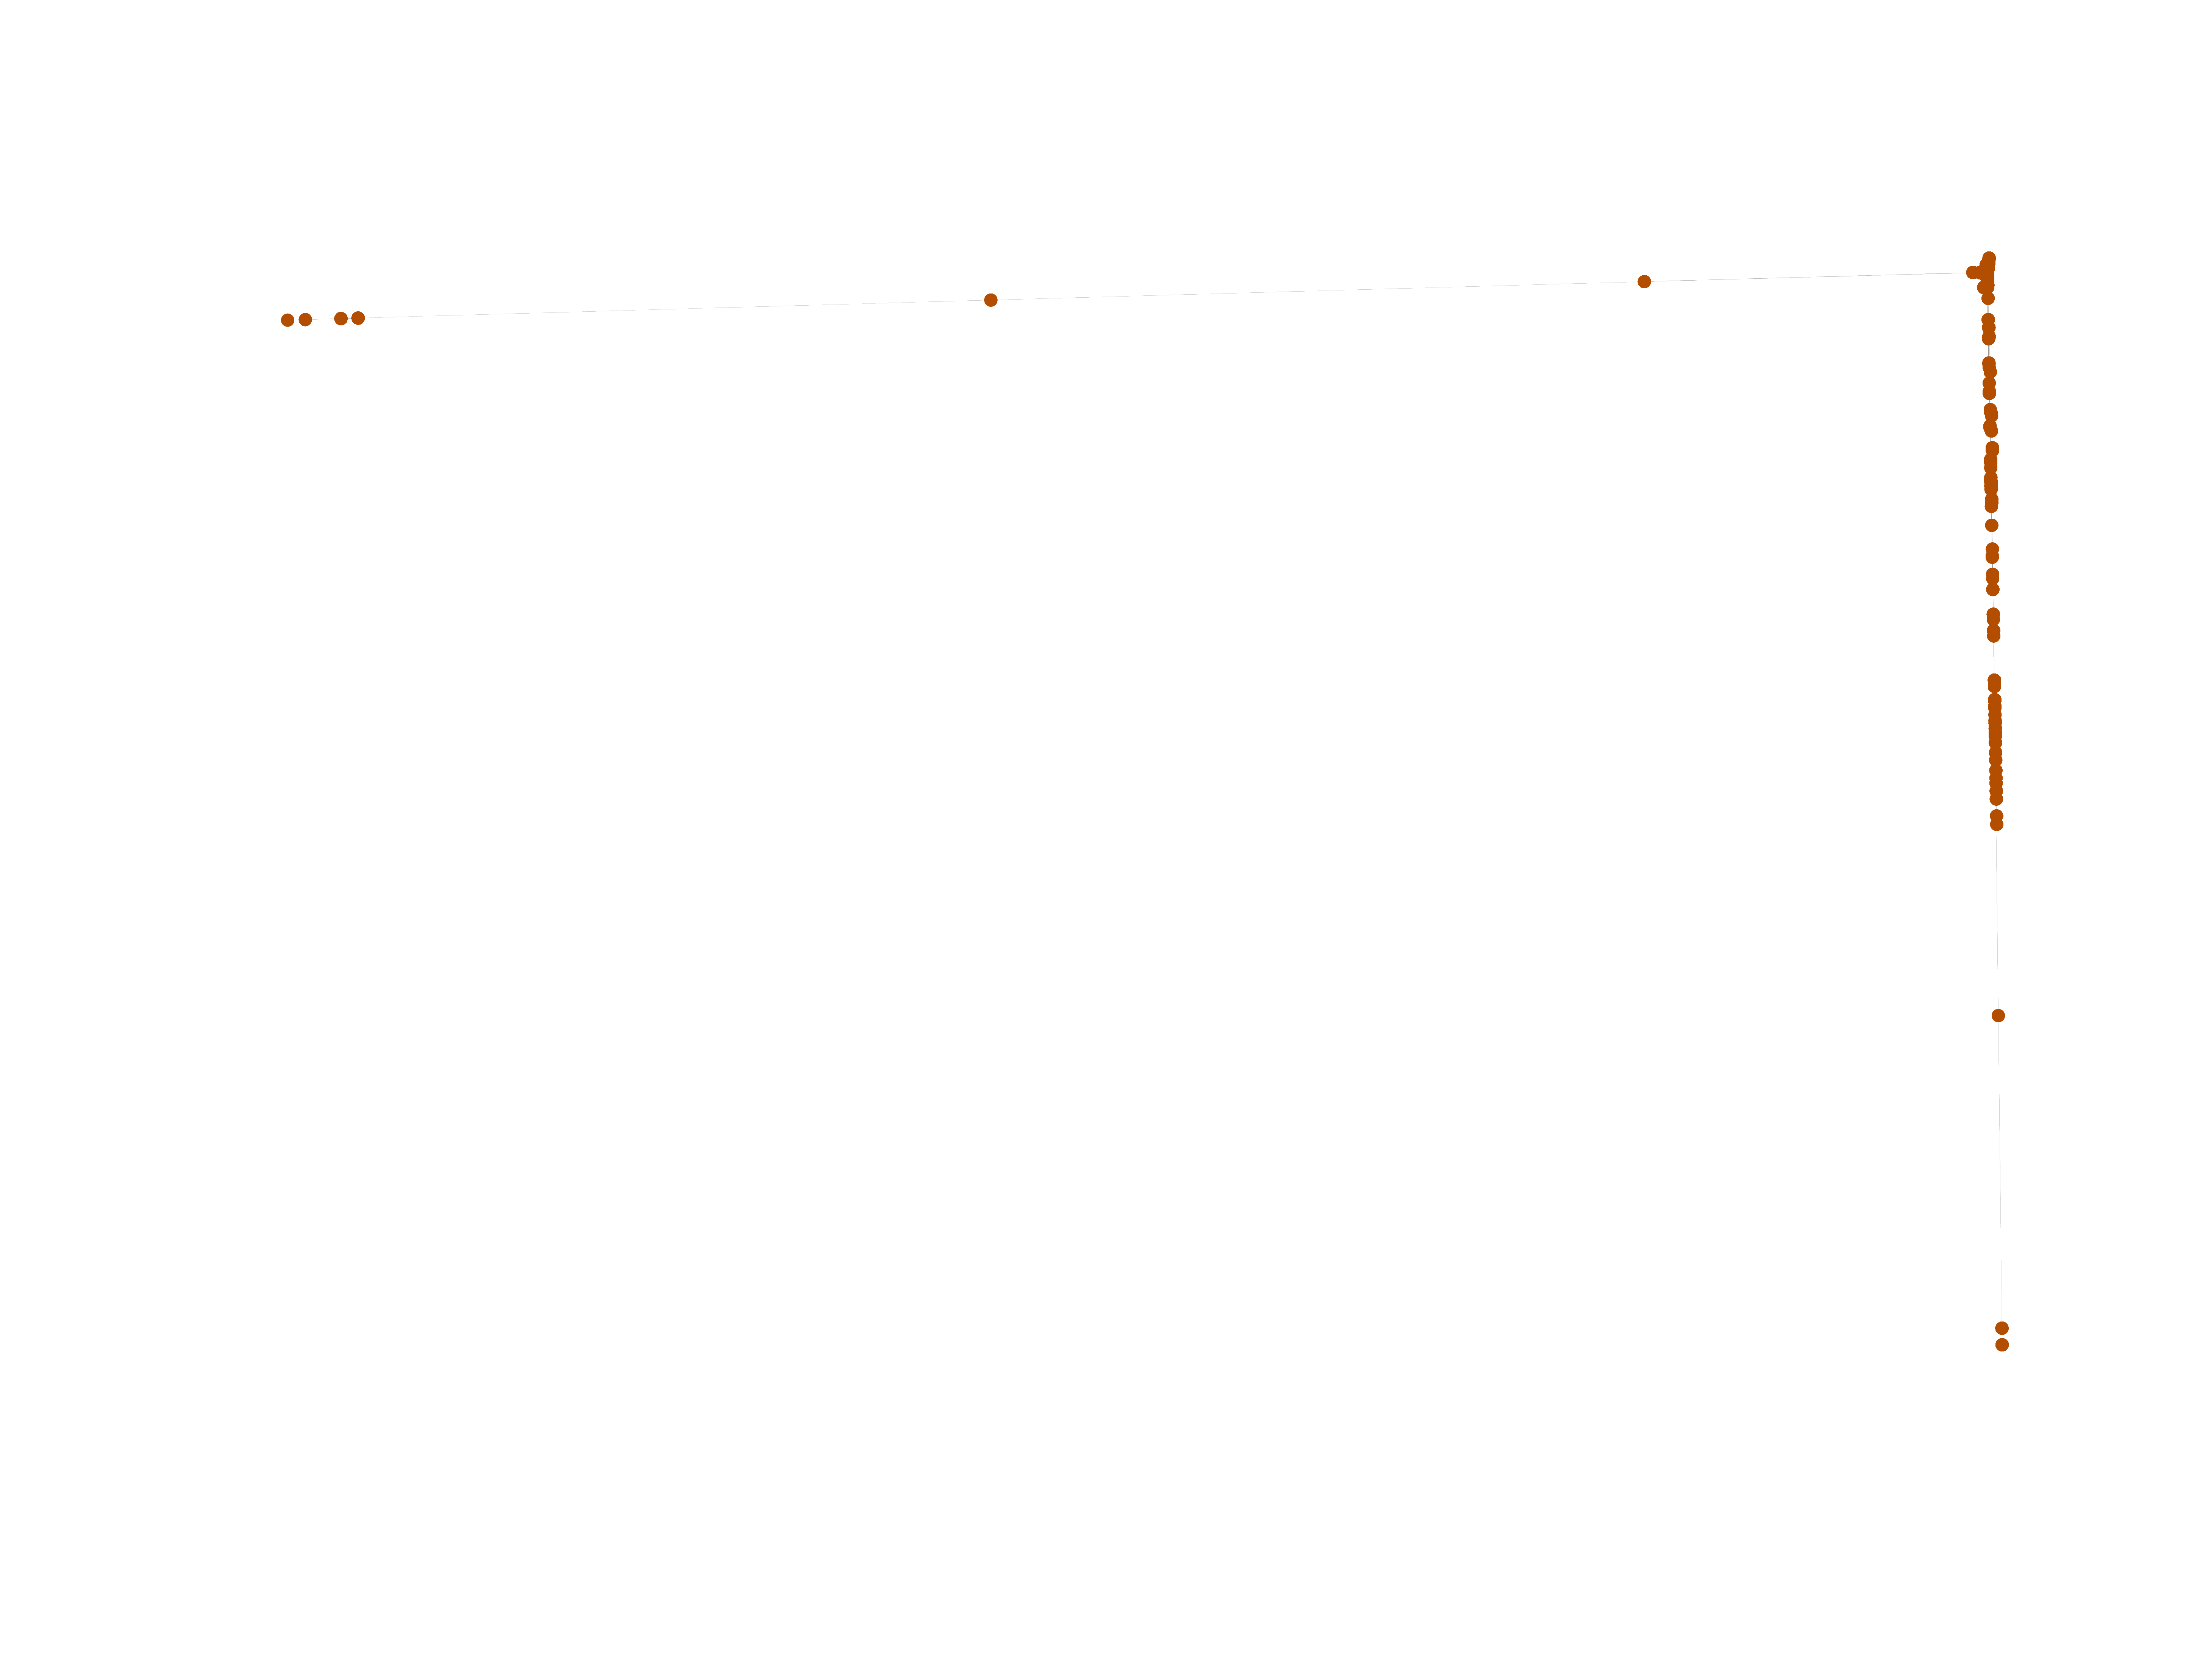
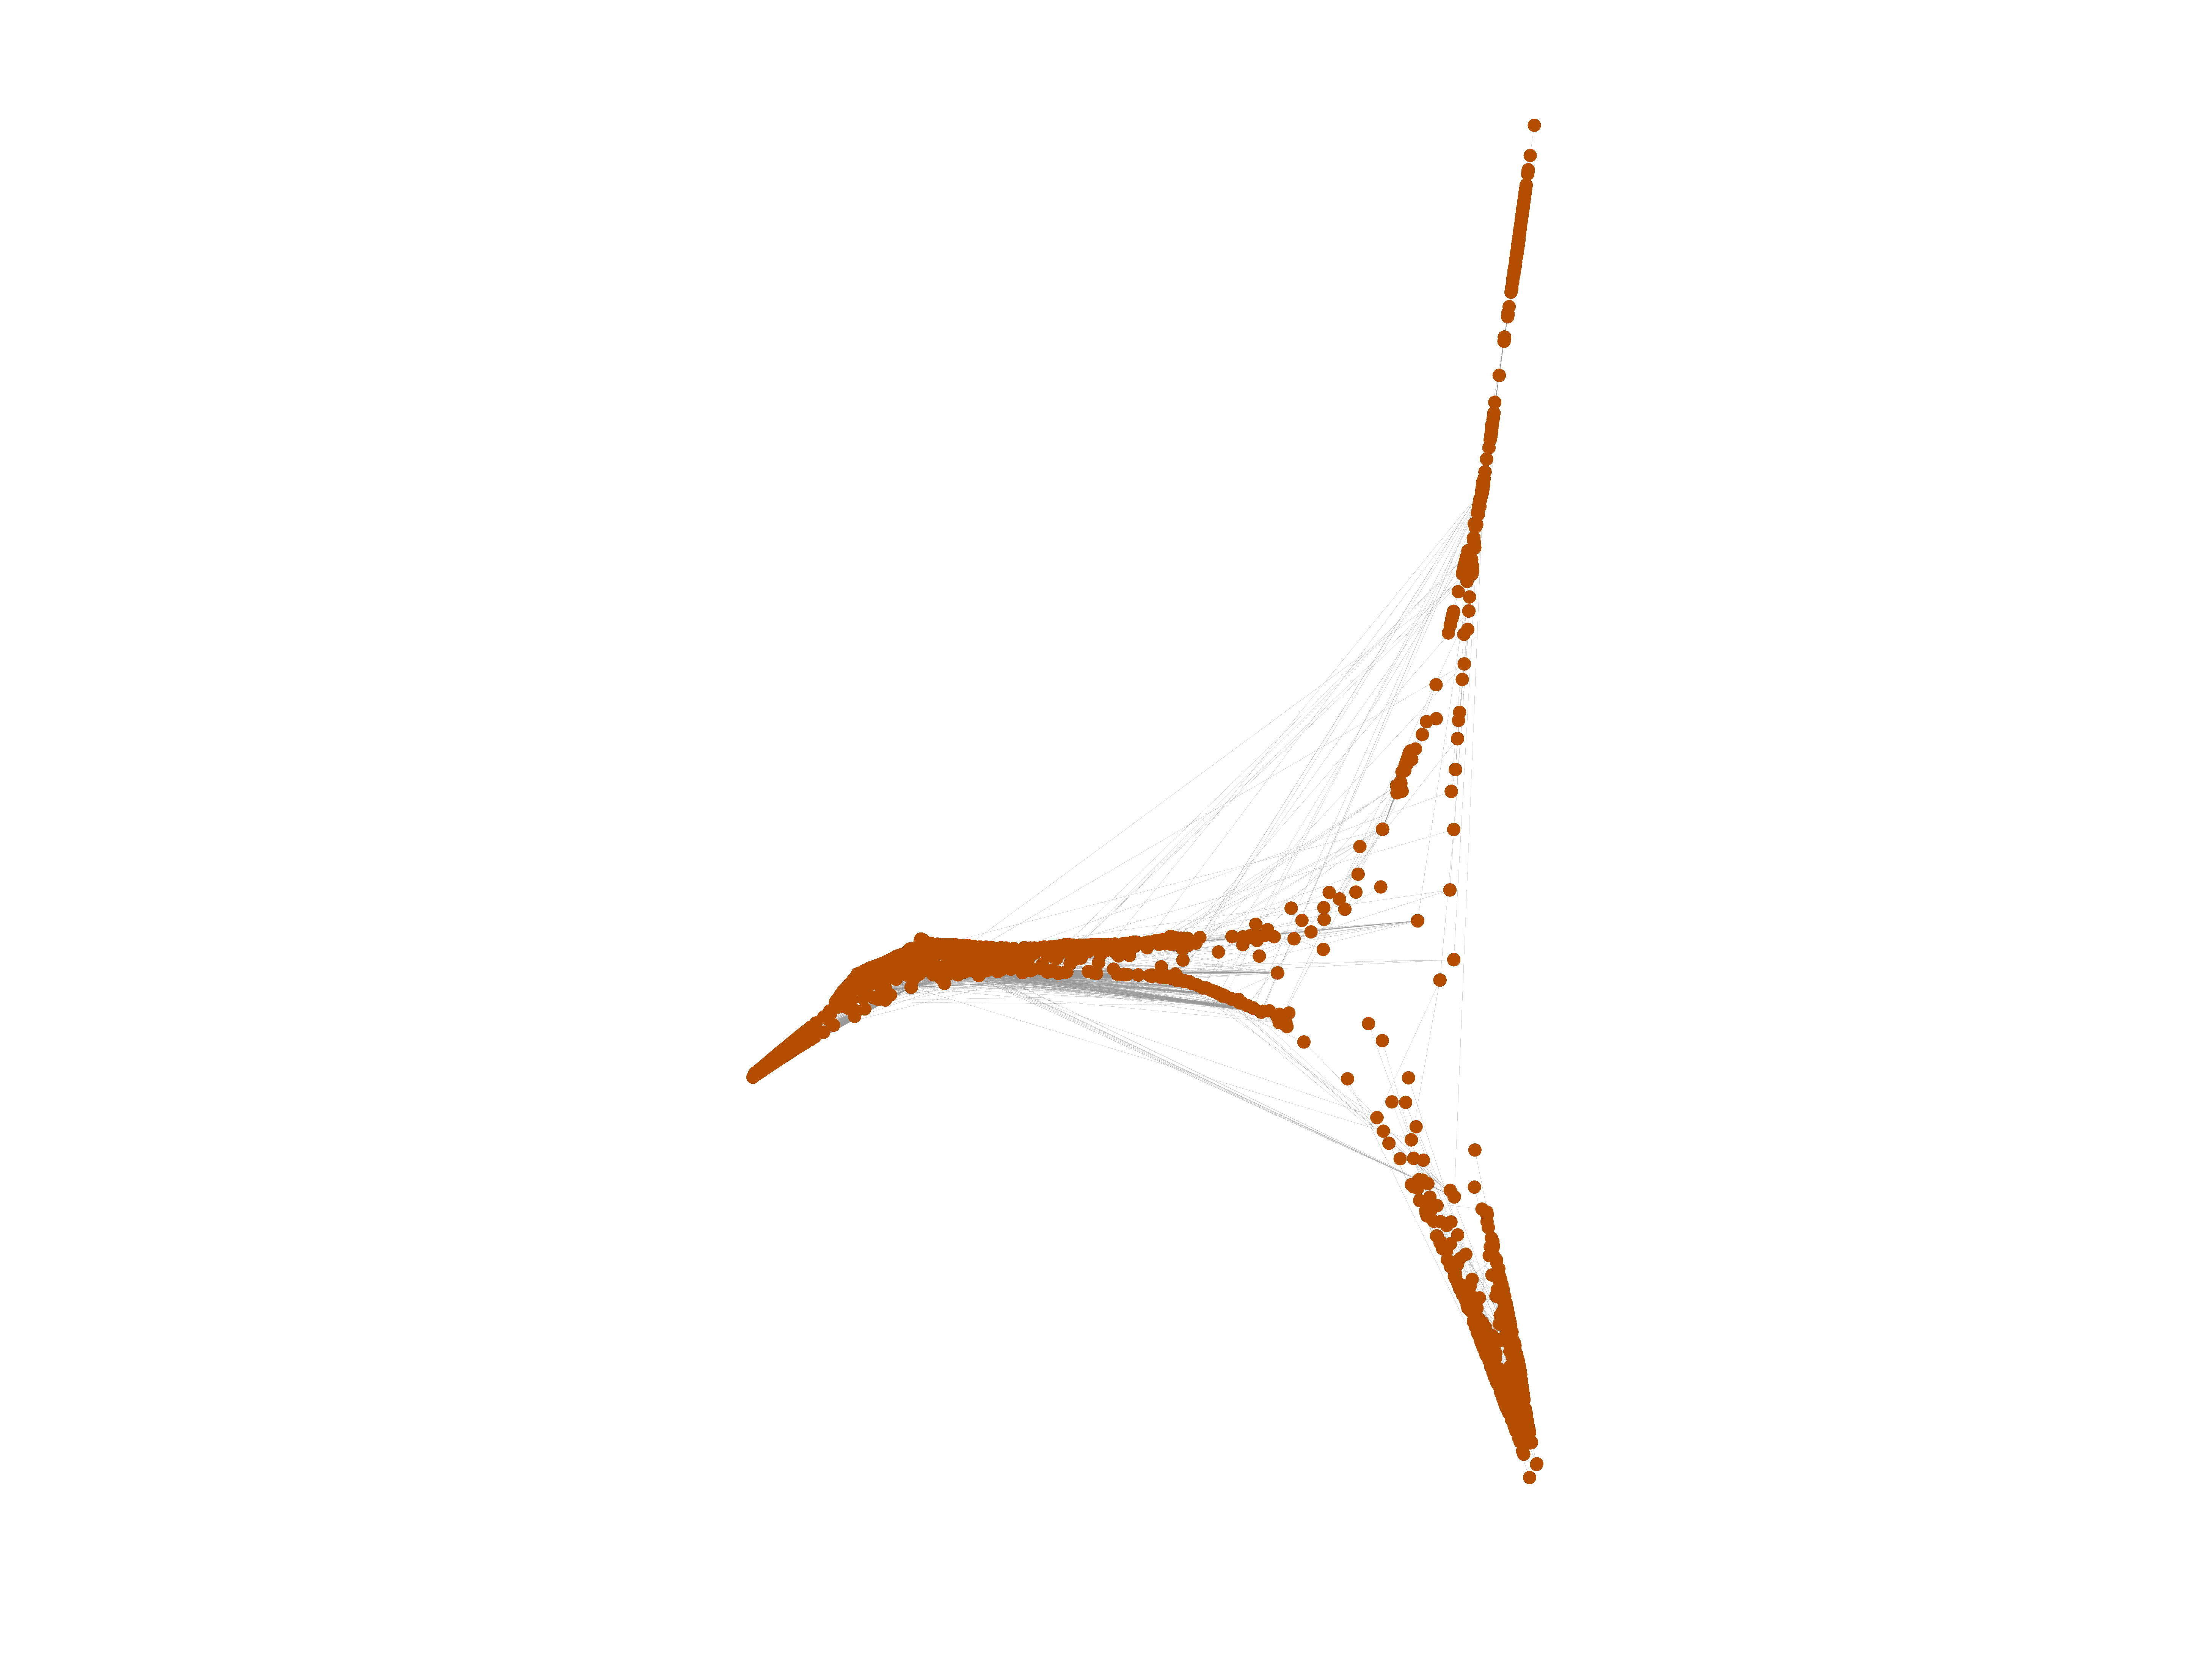
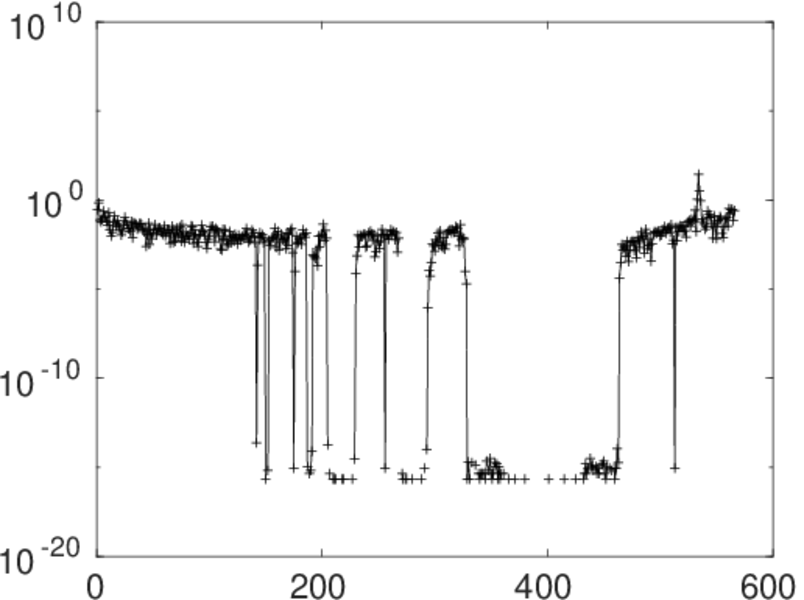
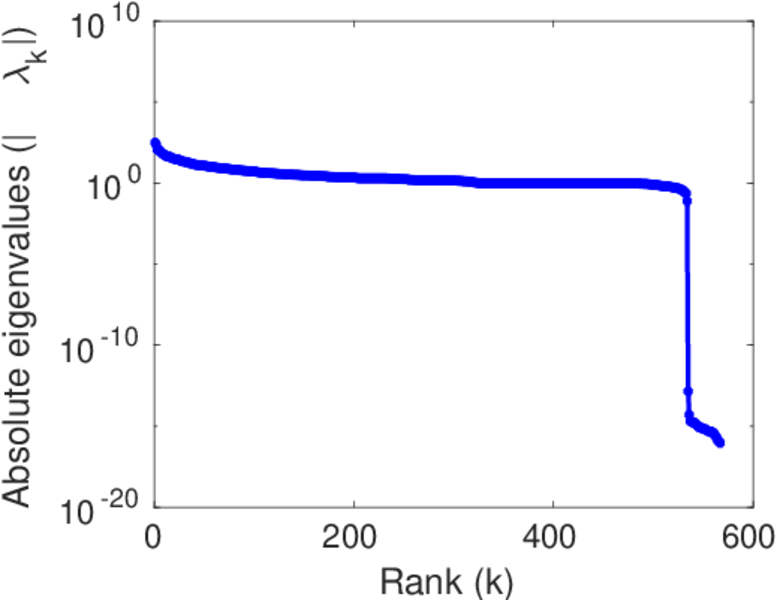
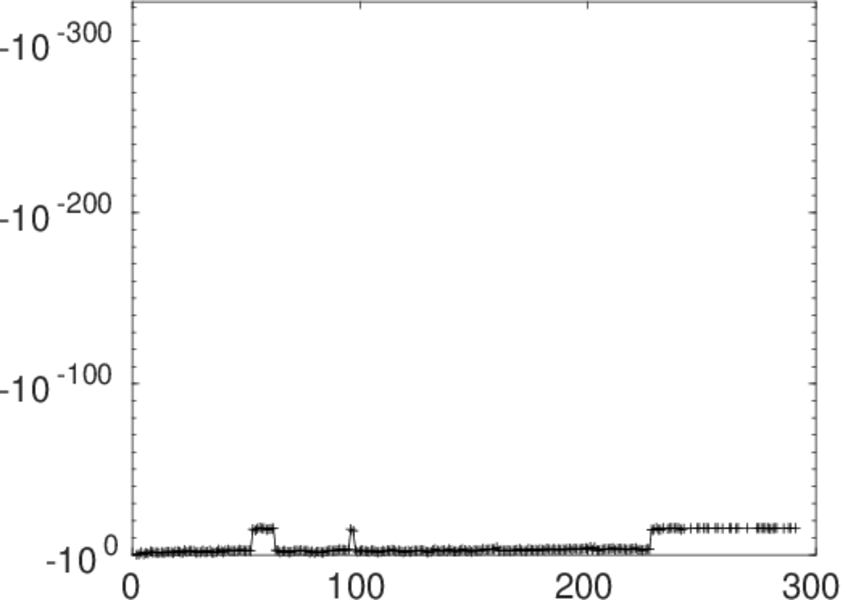
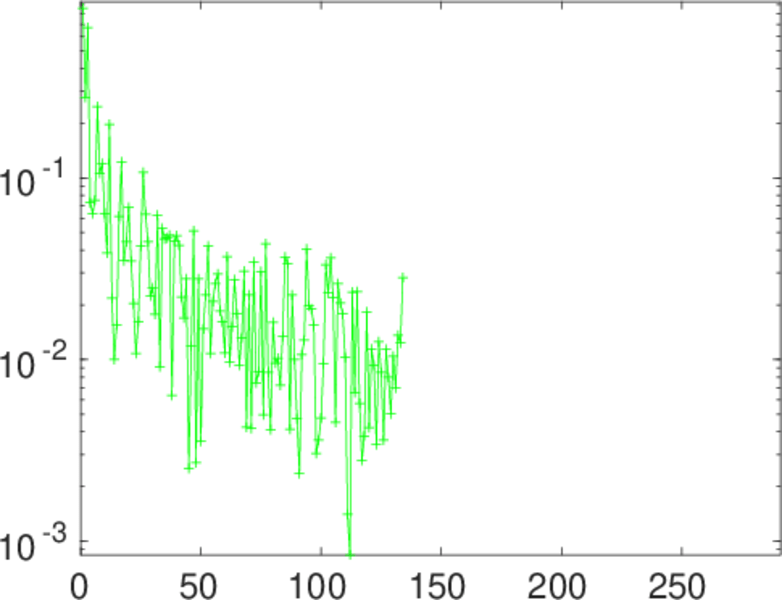
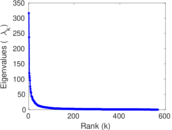
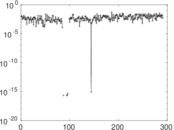
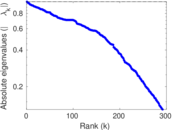
Matrix decompositions plots


Downloads
References
|
[1]
|
Jérôme Kunegis.
KONECT – The Koblenz Network Collection.
In Proc. Int. Conf. on World Wide Web Companion, pages
1343–1350, 2013.
[ http ]
|
|
[2]
|
Wikimedia Foundation.
Wikimedia downloads.
http://dumps.wikimedia.org/, January 2010.
|
 KONECT ‣ Networks ‣
Buy Me a Coffee
KONECT ‣ Networks ‣
Buy Me a Coffee