Wiktionary edits (ts)
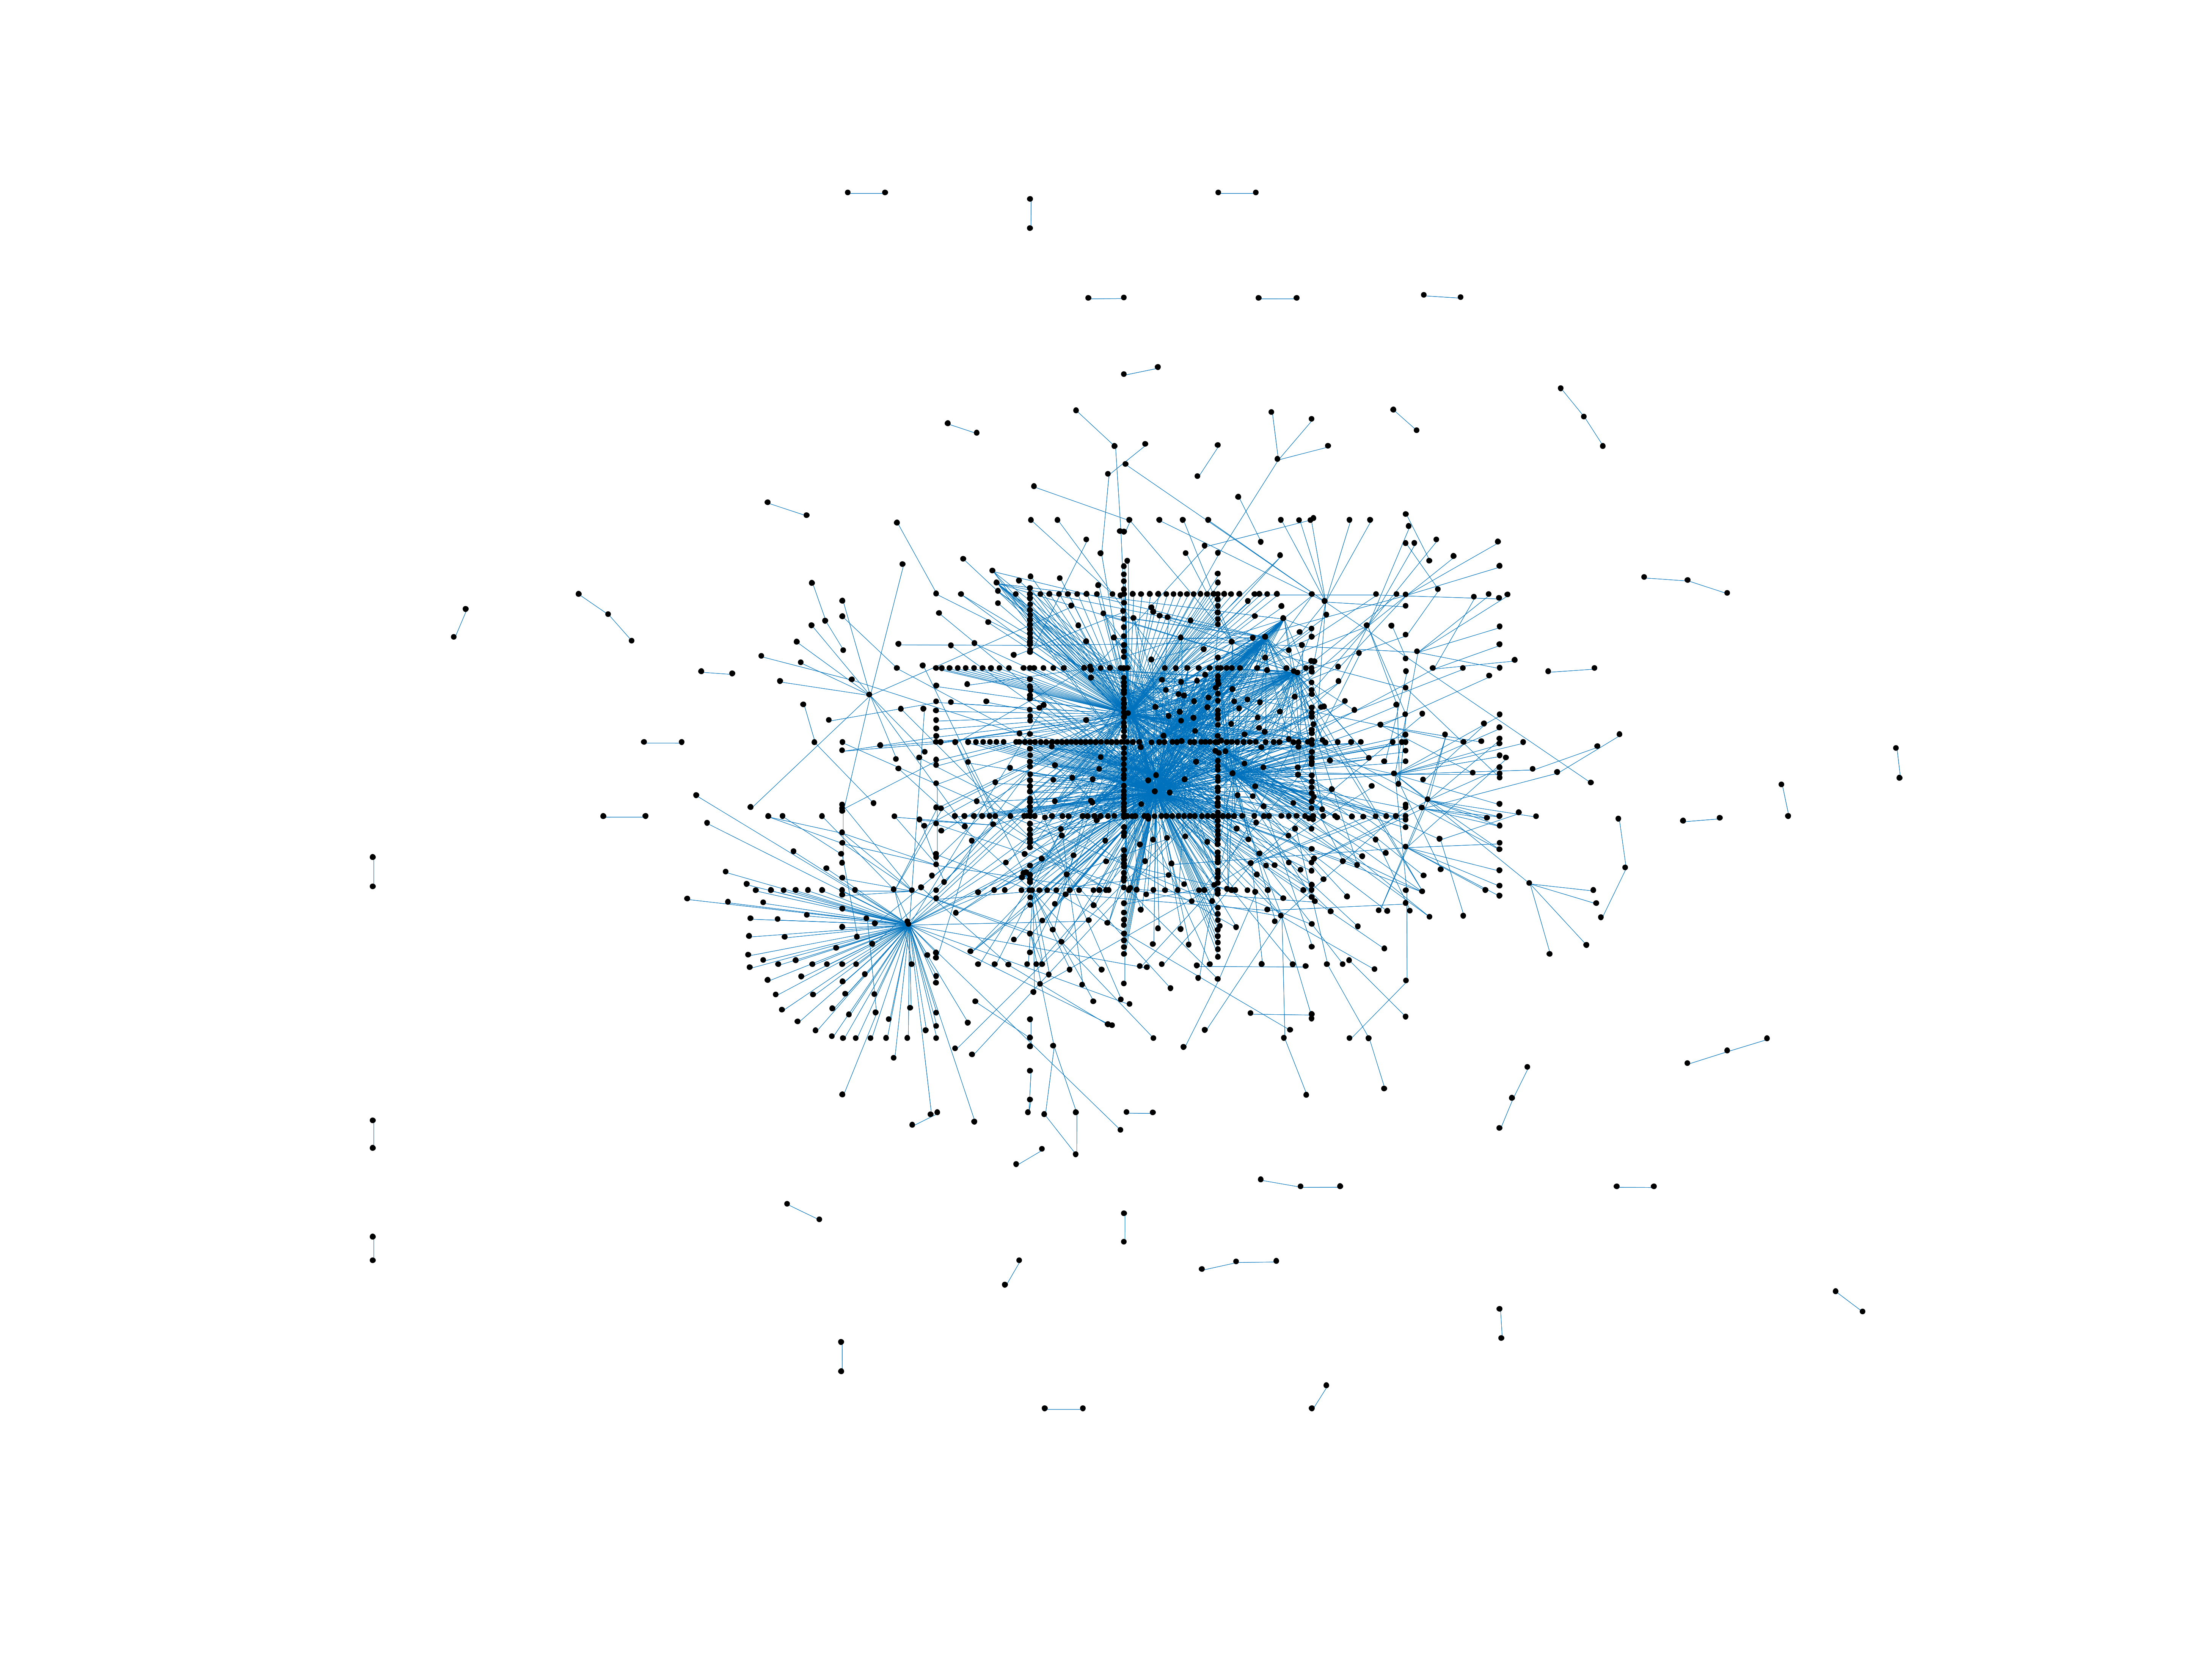
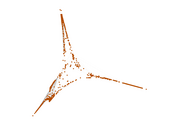
This is the bipartite edit network of the Tsonga Wiktionary. It contains users
and pages from the Tsonga Wiktionary, connected by edit events. Each edge
represents an edit. The dataset includes the timestamp of each edit.
Metadata
Statistics
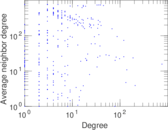
| Size | n = | 1,079
|
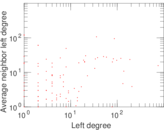
| Left size | n1 = | 171
|
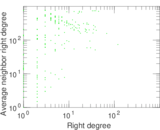
| Right size | n2 = | 908
|
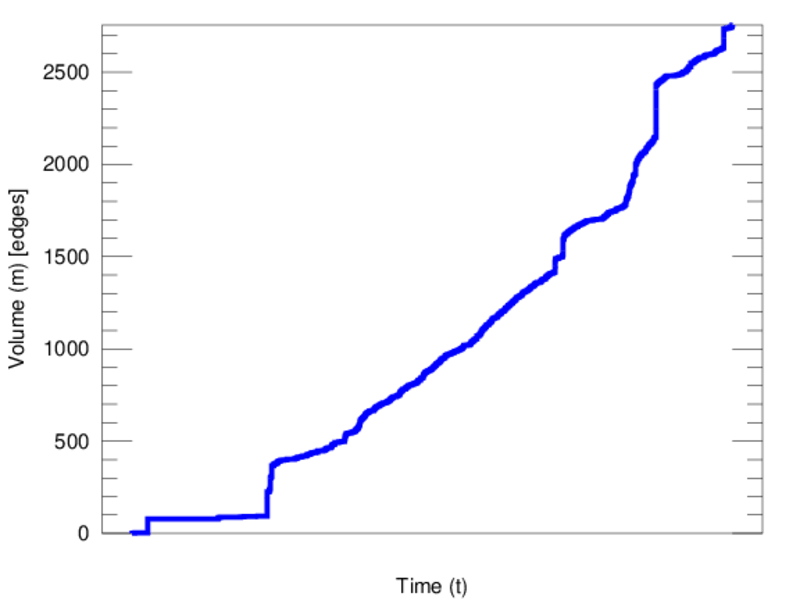
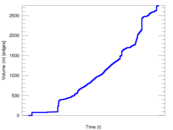
| Volume | m = | 2,756
|
| Unique edge count | m̿ = | 1,582
|
| Wedge count | s = | 94,523
|
| Claw count | z = | 7,322,023
|
| Cross count | x = | 516,151,597
|
| Square count | q = | 22,952
|
| 4-Tour count | T4 = | 565,180
|
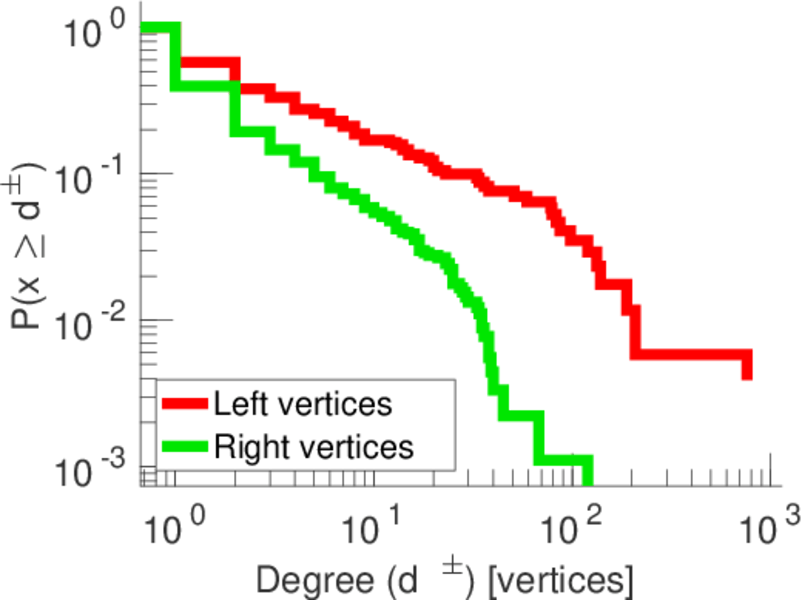
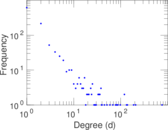
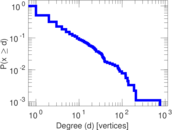
| Maximum degree | dmax = | 760
|
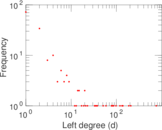
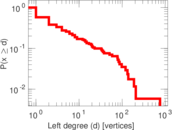
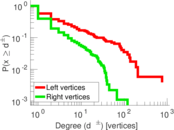
| Maximum left degree | d1max = | 760
|
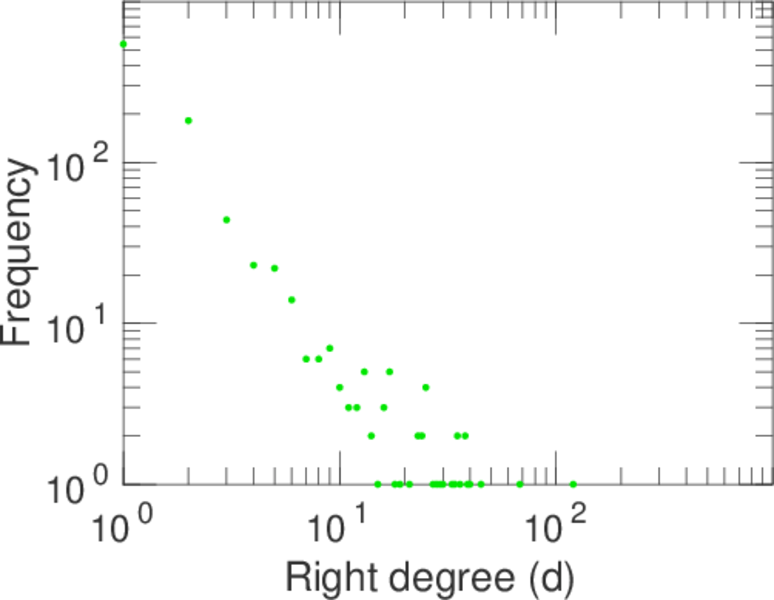
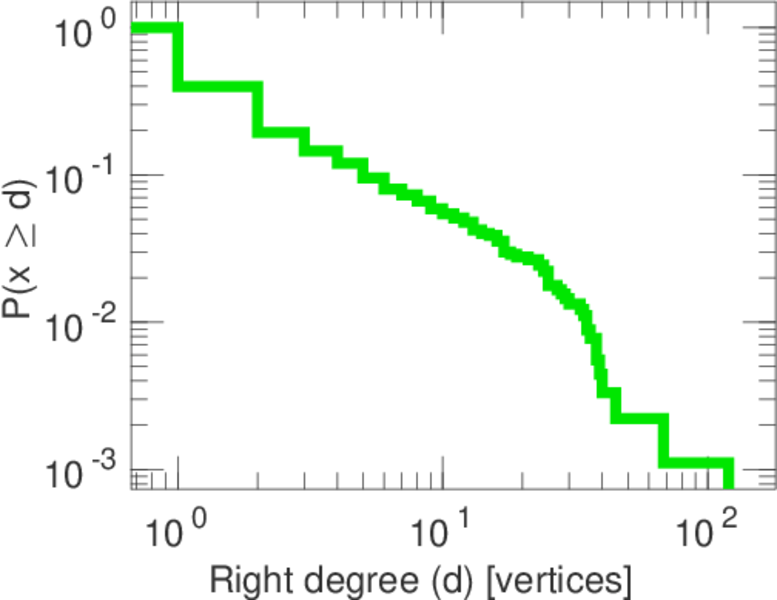
| Maximum right degree | d2max = | 120
|
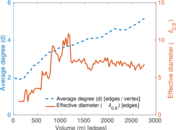
| Average degree | d = | 5.108 43
|
| Average left degree | d1 = | 16.117 0
|
| Average right degree | d2 = | 3.035 24
|
| Fill | p = | 0.010 188 8
|
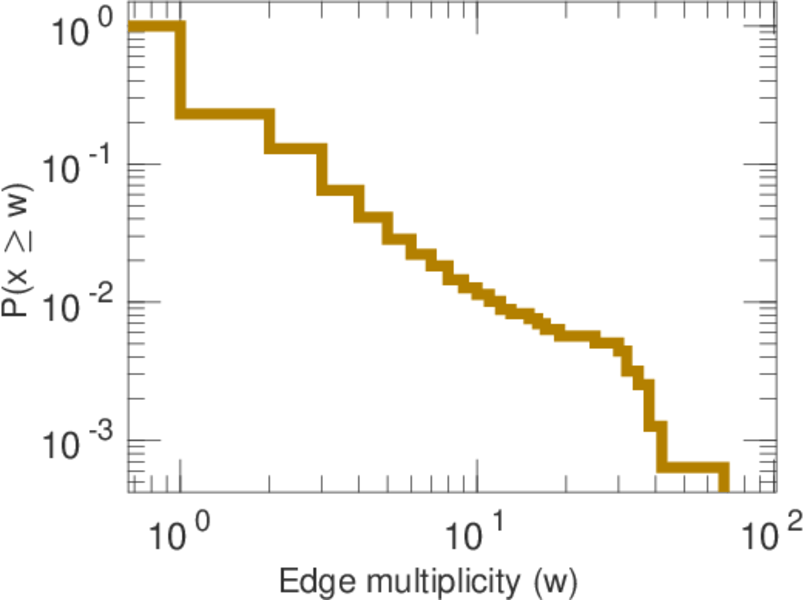
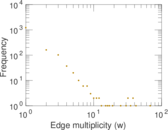
| Average edge multiplicity | m̃ = | 1.742 10
|
| Size of LCC | N = | 796
|
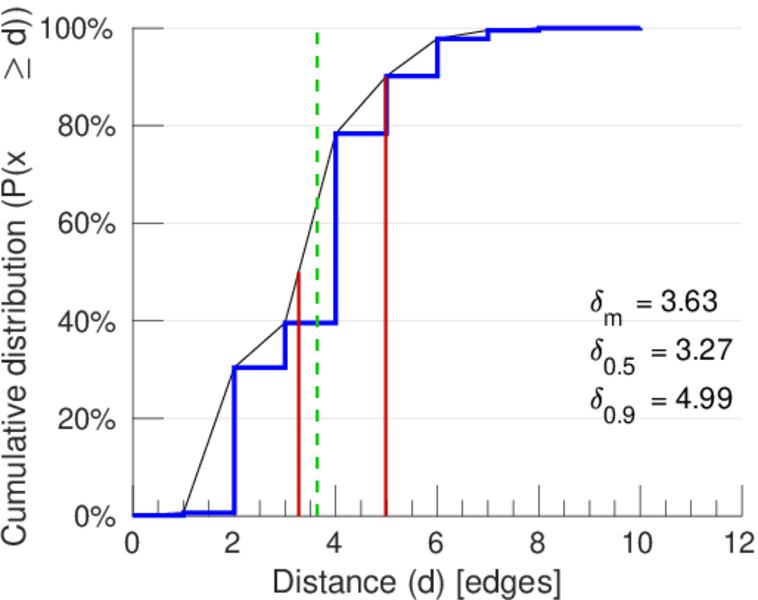
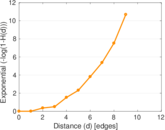
| Diameter | δ = | 12
|
| 50-Percentile effective diameter | δ0.5 = | 3.269 11
|
| 90-Percentile effective diameter | δ0.9 = | 4.988 21
|
| Median distance | δM = | 4
|
| Mean distance | δm = | 3.634 90
|
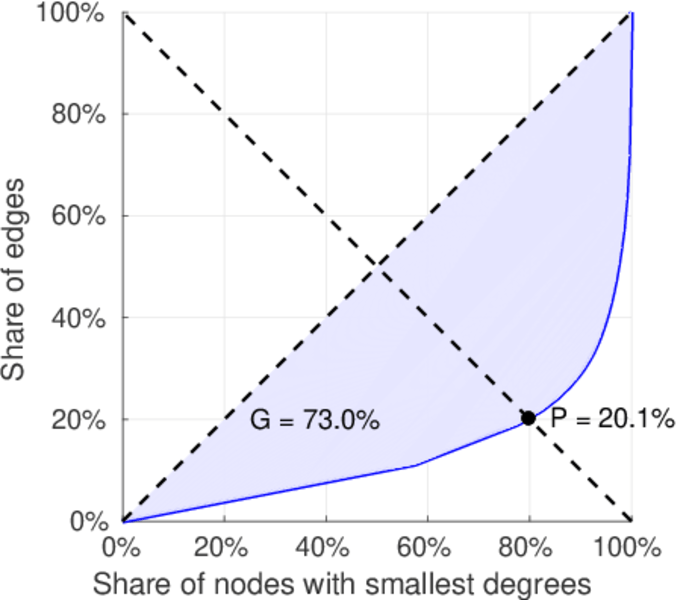
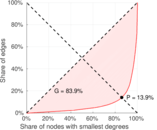
| Gini coefficient | G = | 0.736 451
|
| Balanced inequality ratio | P = | 0.201 379
|
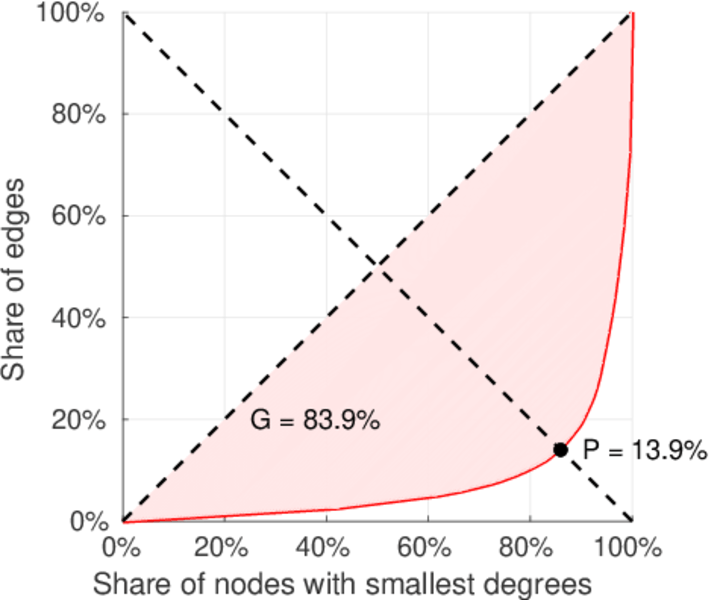
| Left balanced inequality ratio | P1 = | 0.138 607
|
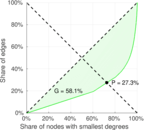
| Right balanced inequality ratio | P2 = | 0.272 859
|
| Relative edge distribution entropy | Her = | 0.817 069
|
| Power law exponent | γ = | 3.332 07
|
| Tail power law exponent | γt = | 2.191 00
|
| Tail power law exponent with p | γ3 = | 2.191 00
|
| p-value | p = | 0.000 00
|
| Left tail power law exponent with p | γ3,1 = | 1.731 00
|
| Left p-value | p1 = | 0.505 000
|
| Right tail power law exponent with p | γ3,2 = | 2.961 00
|
| Right p-value | p2 = | 0.000 00
|
| Degree assortativity | ρ = | −0.229 663
|
| Degree assortativity p-value | pρ = | 2.215 70 × 10−20
|
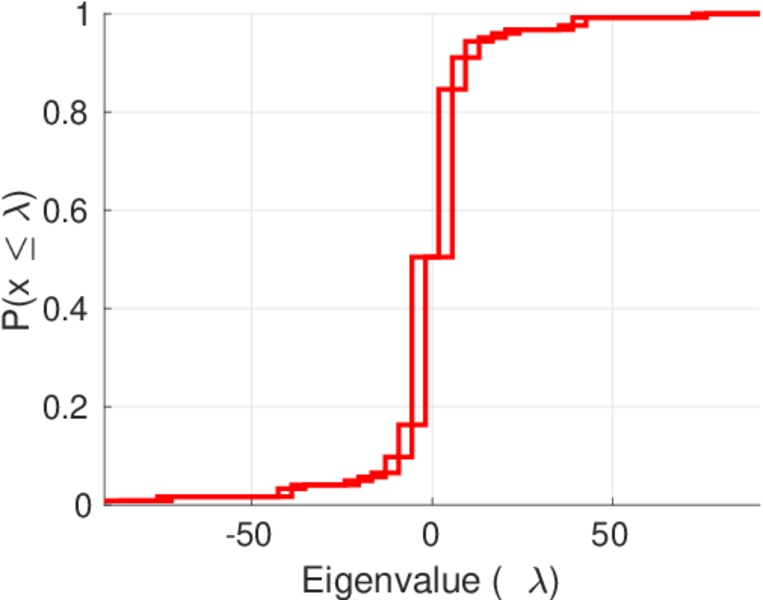
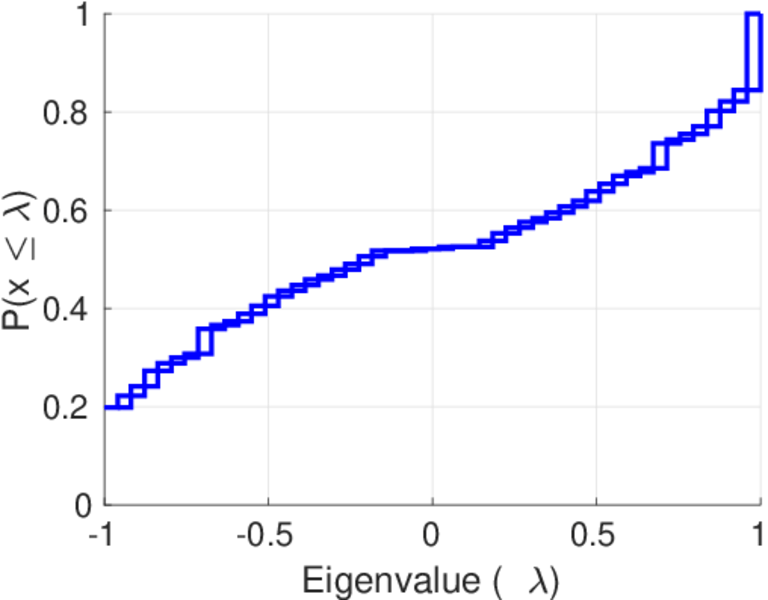
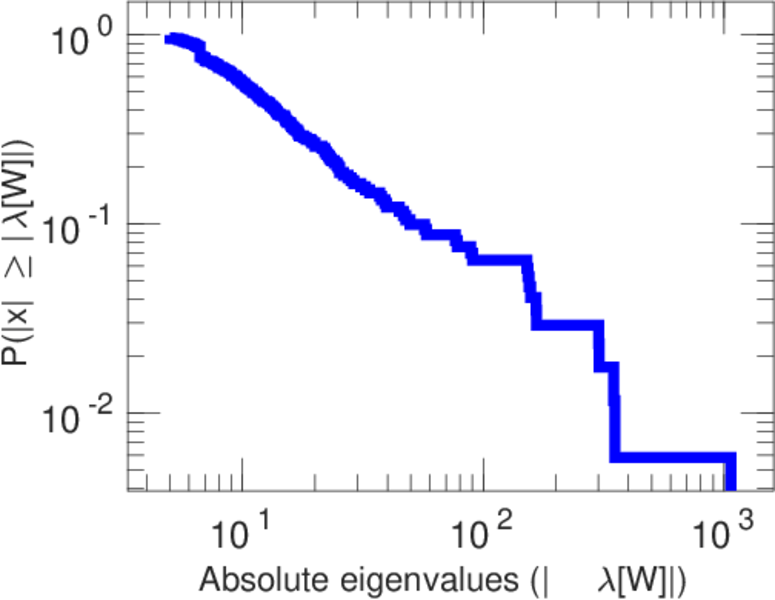
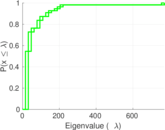
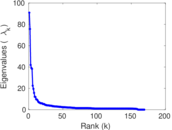
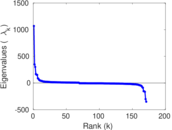
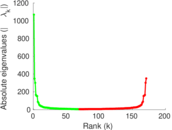
| Spectral norm | α = | 90.903 1
|
| Algebraic connectivity | a = | 0.020 153 3
|
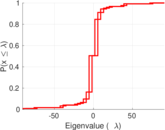
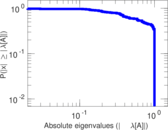
| Spectral separation | |λ1[A] / λ2[A]| = | 1.202 69
|
| Controllability | C = | 752
|
| Relative controllability | Cr = | 0.701 493
|
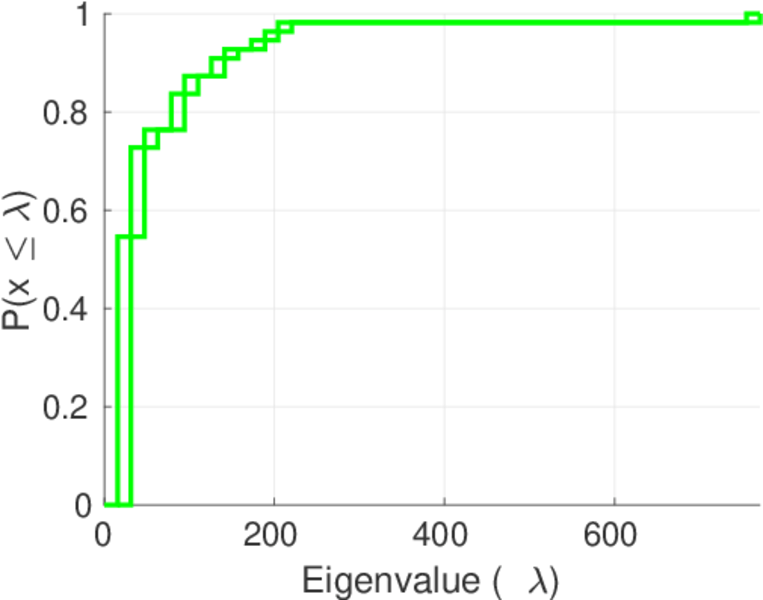
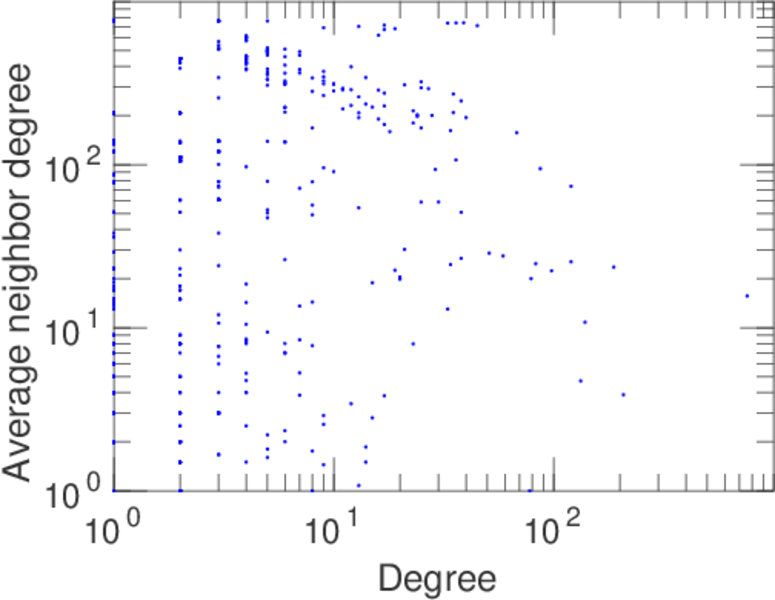
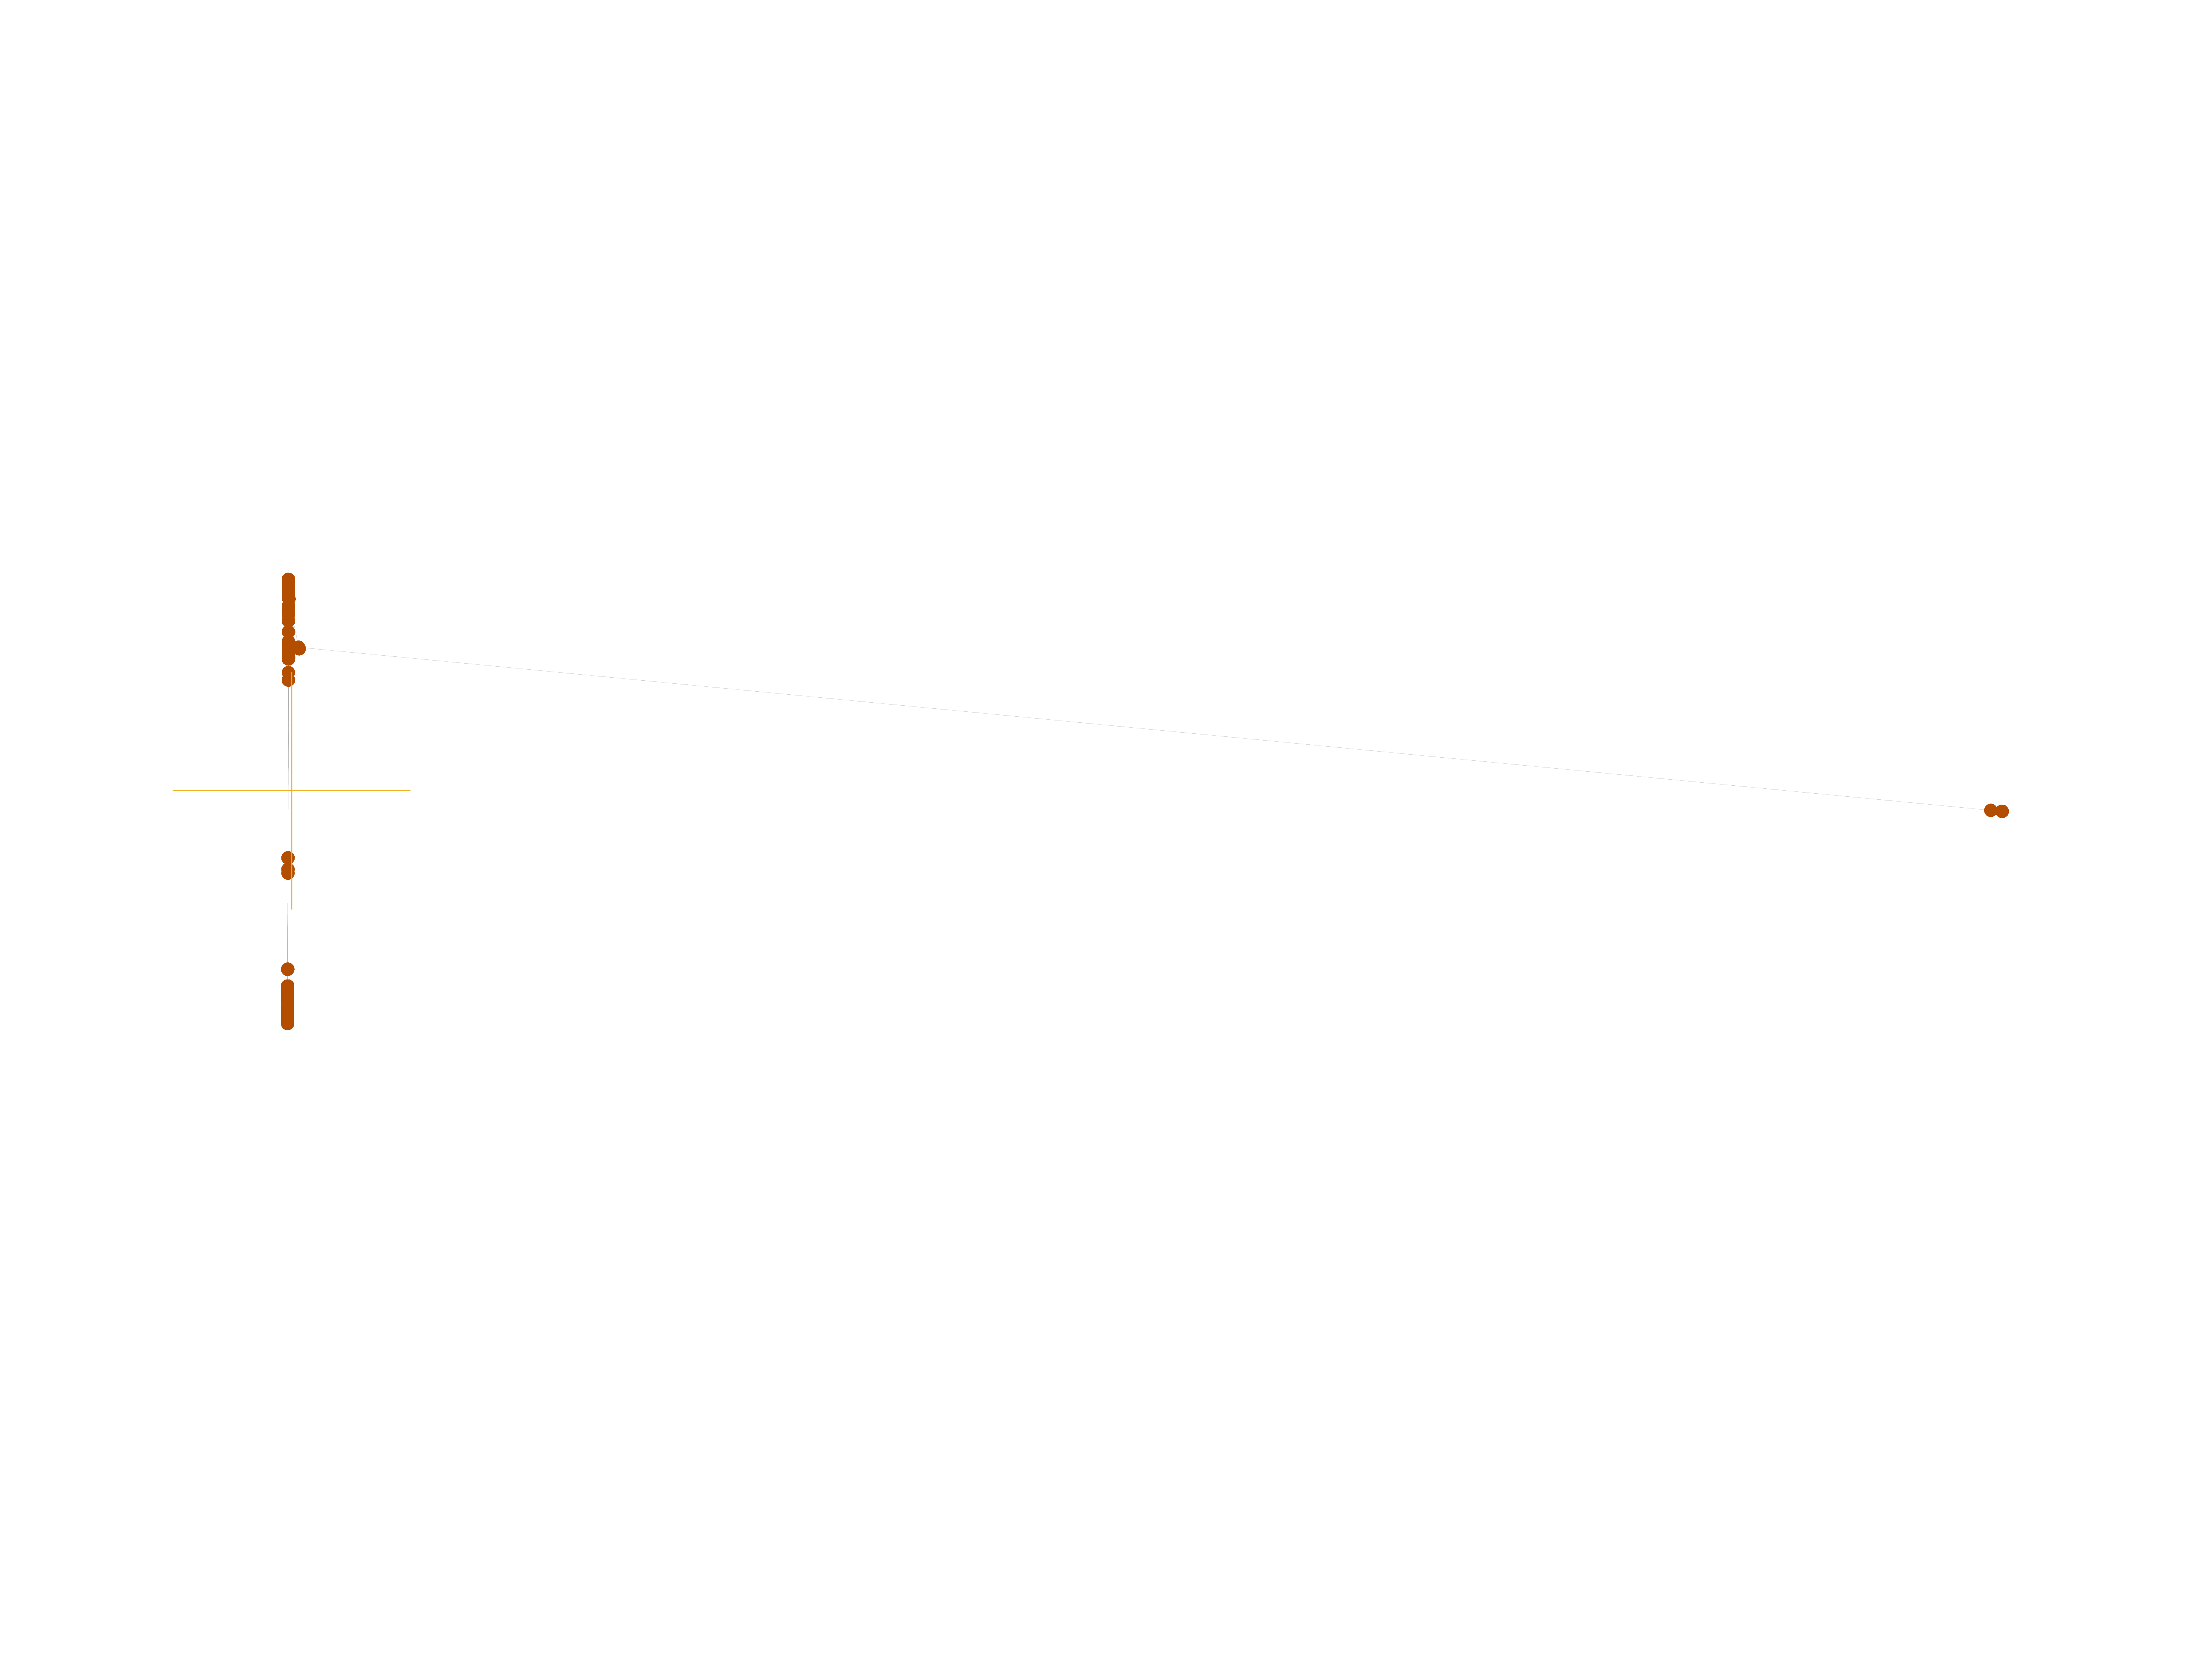
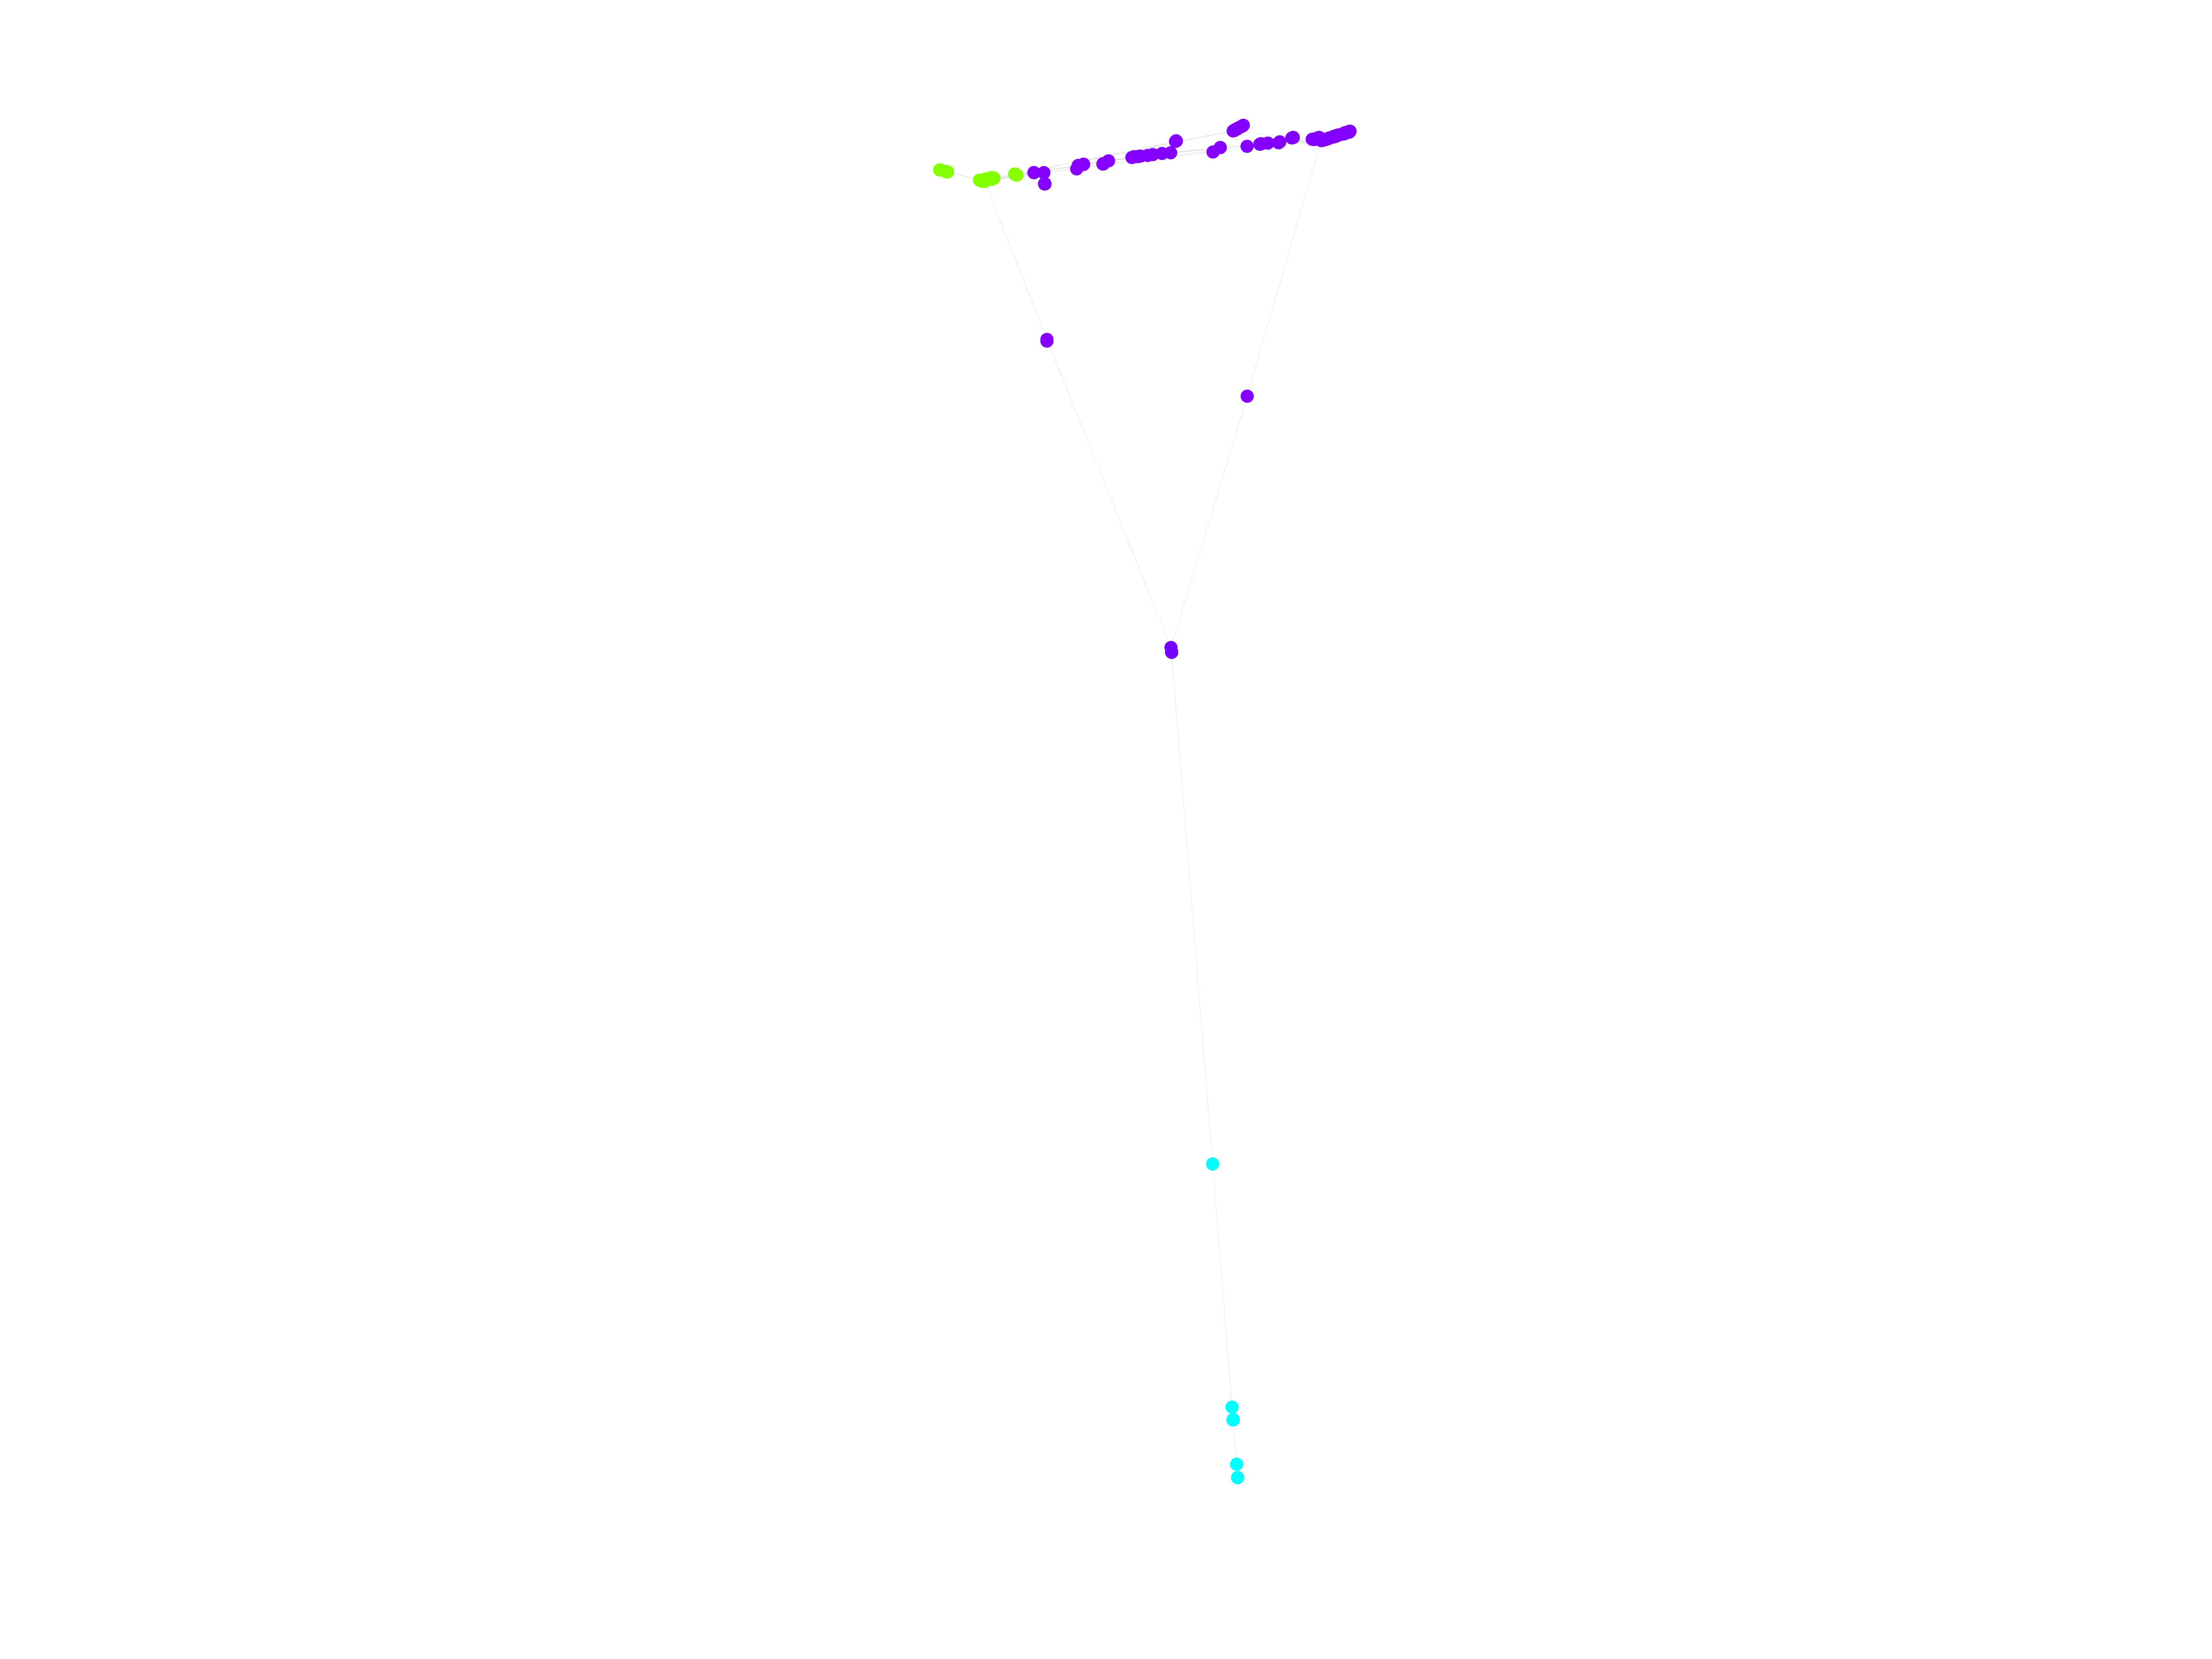
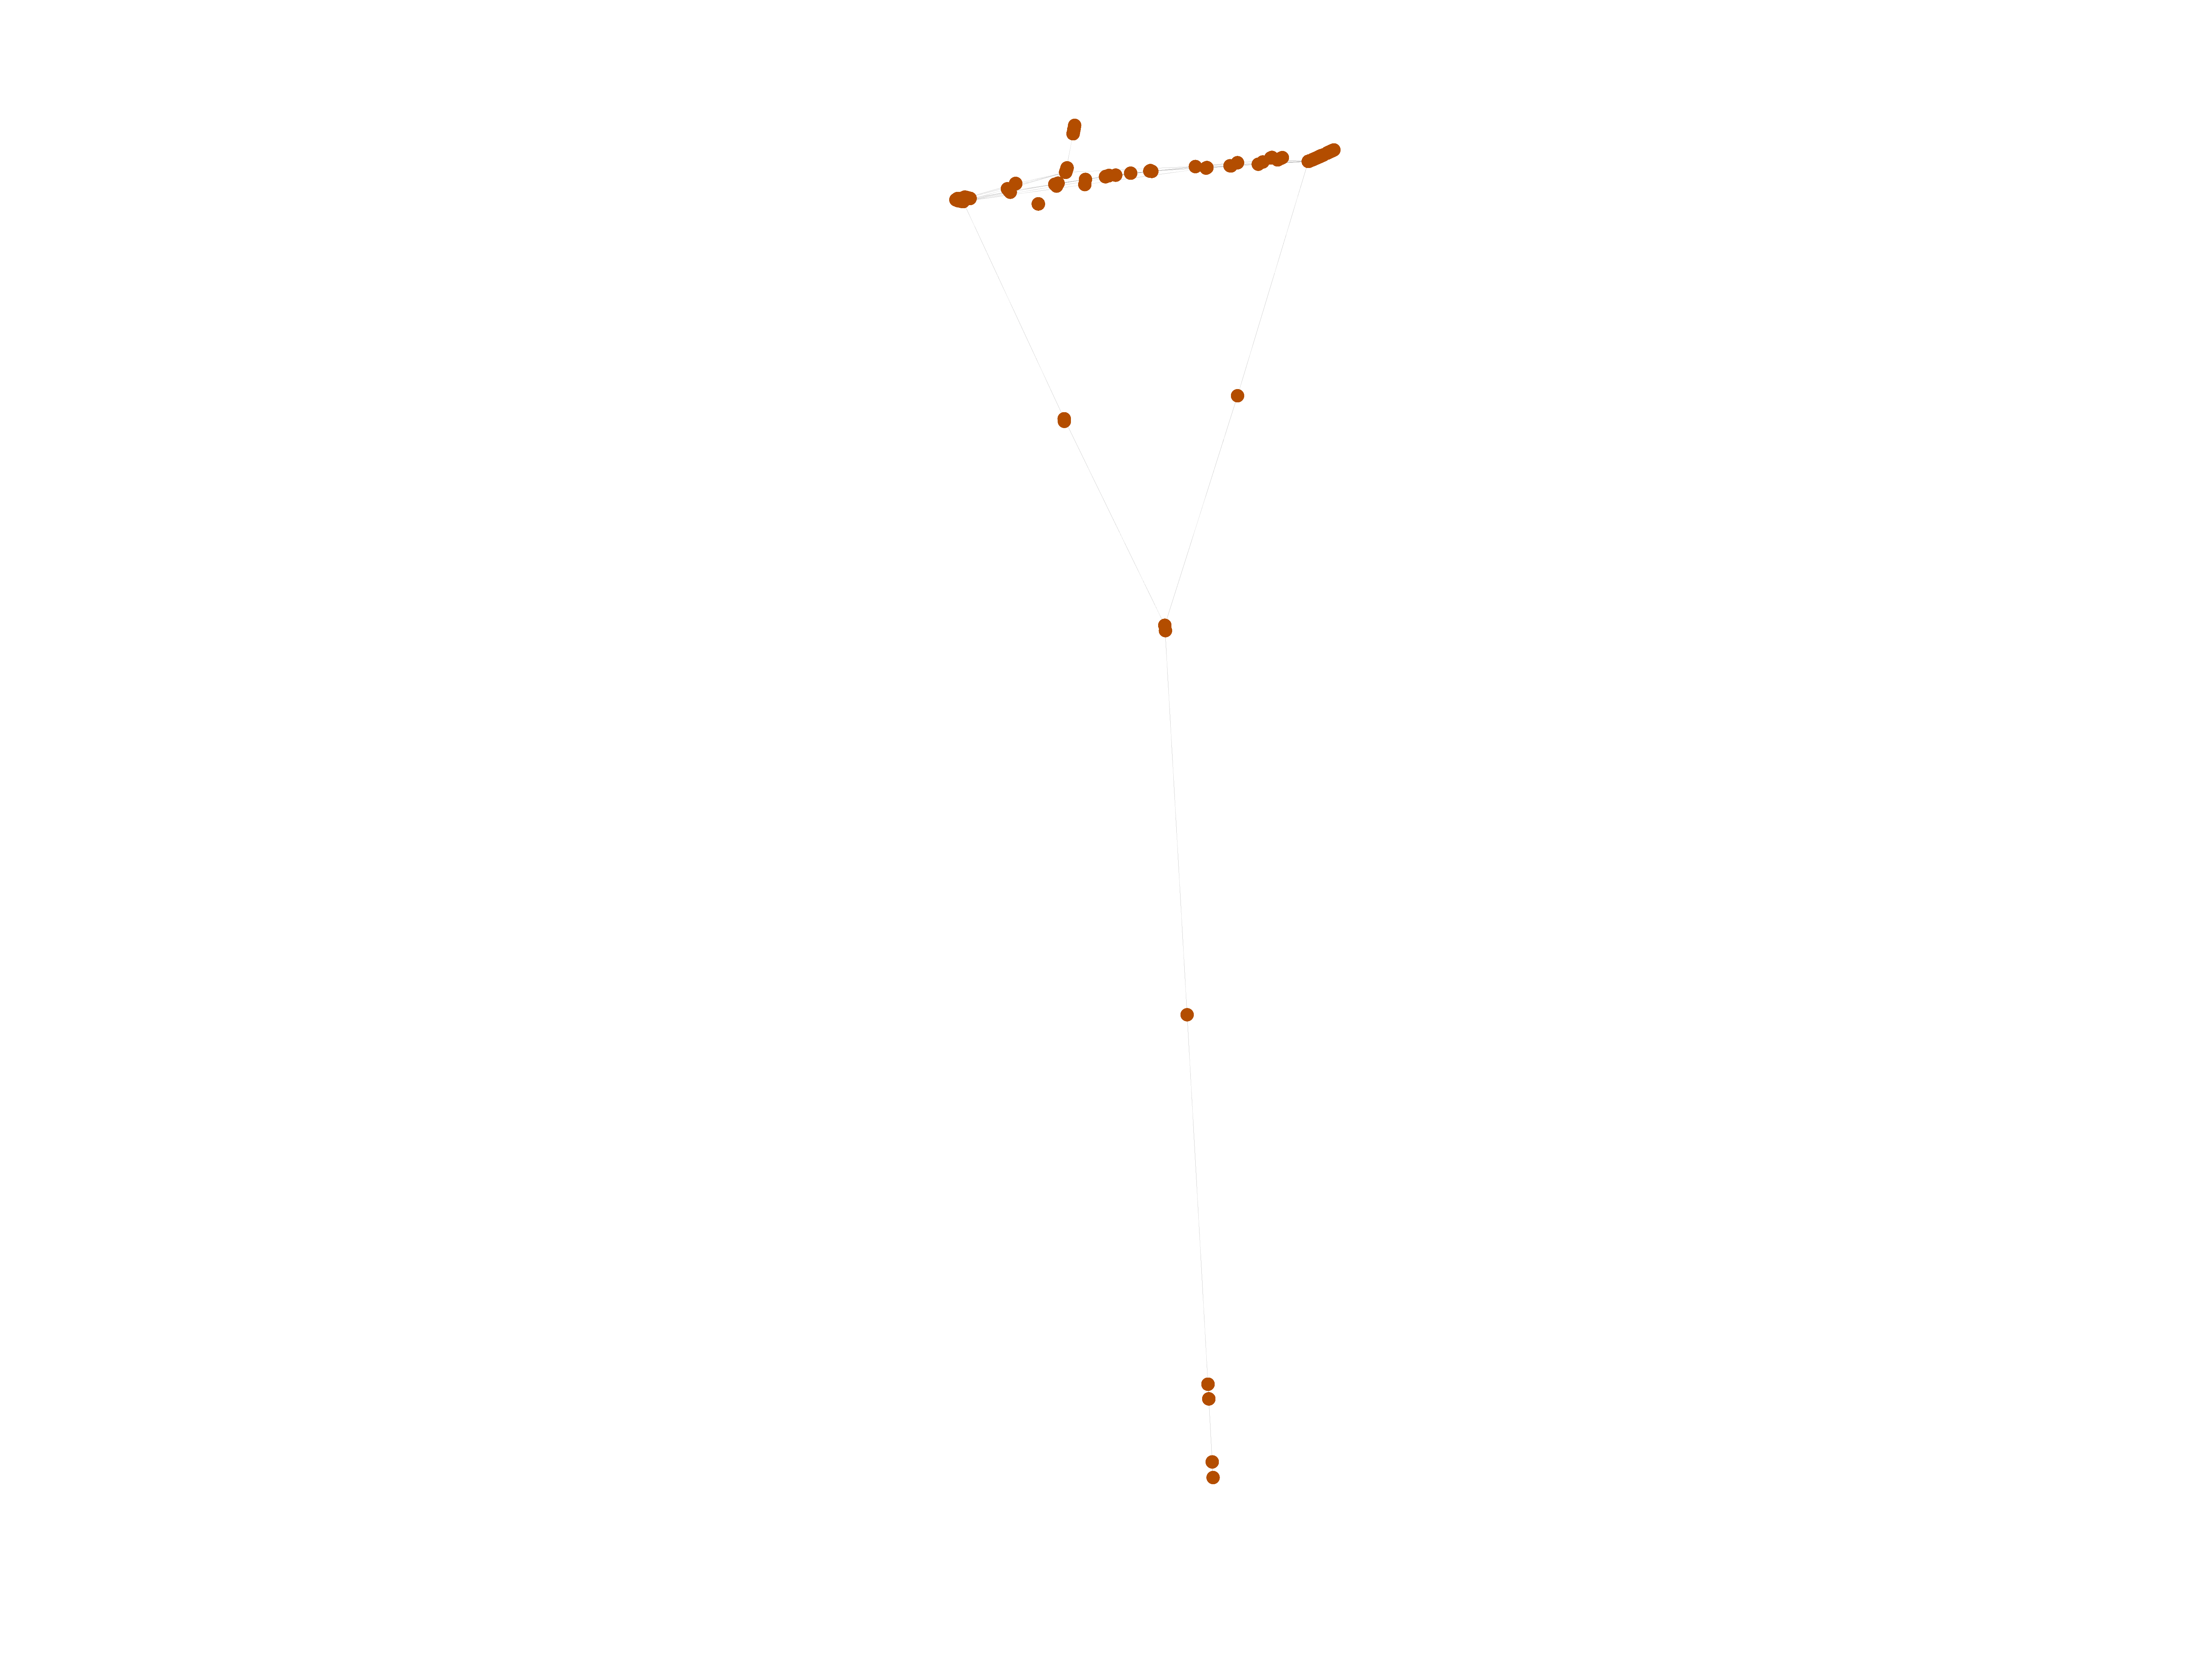
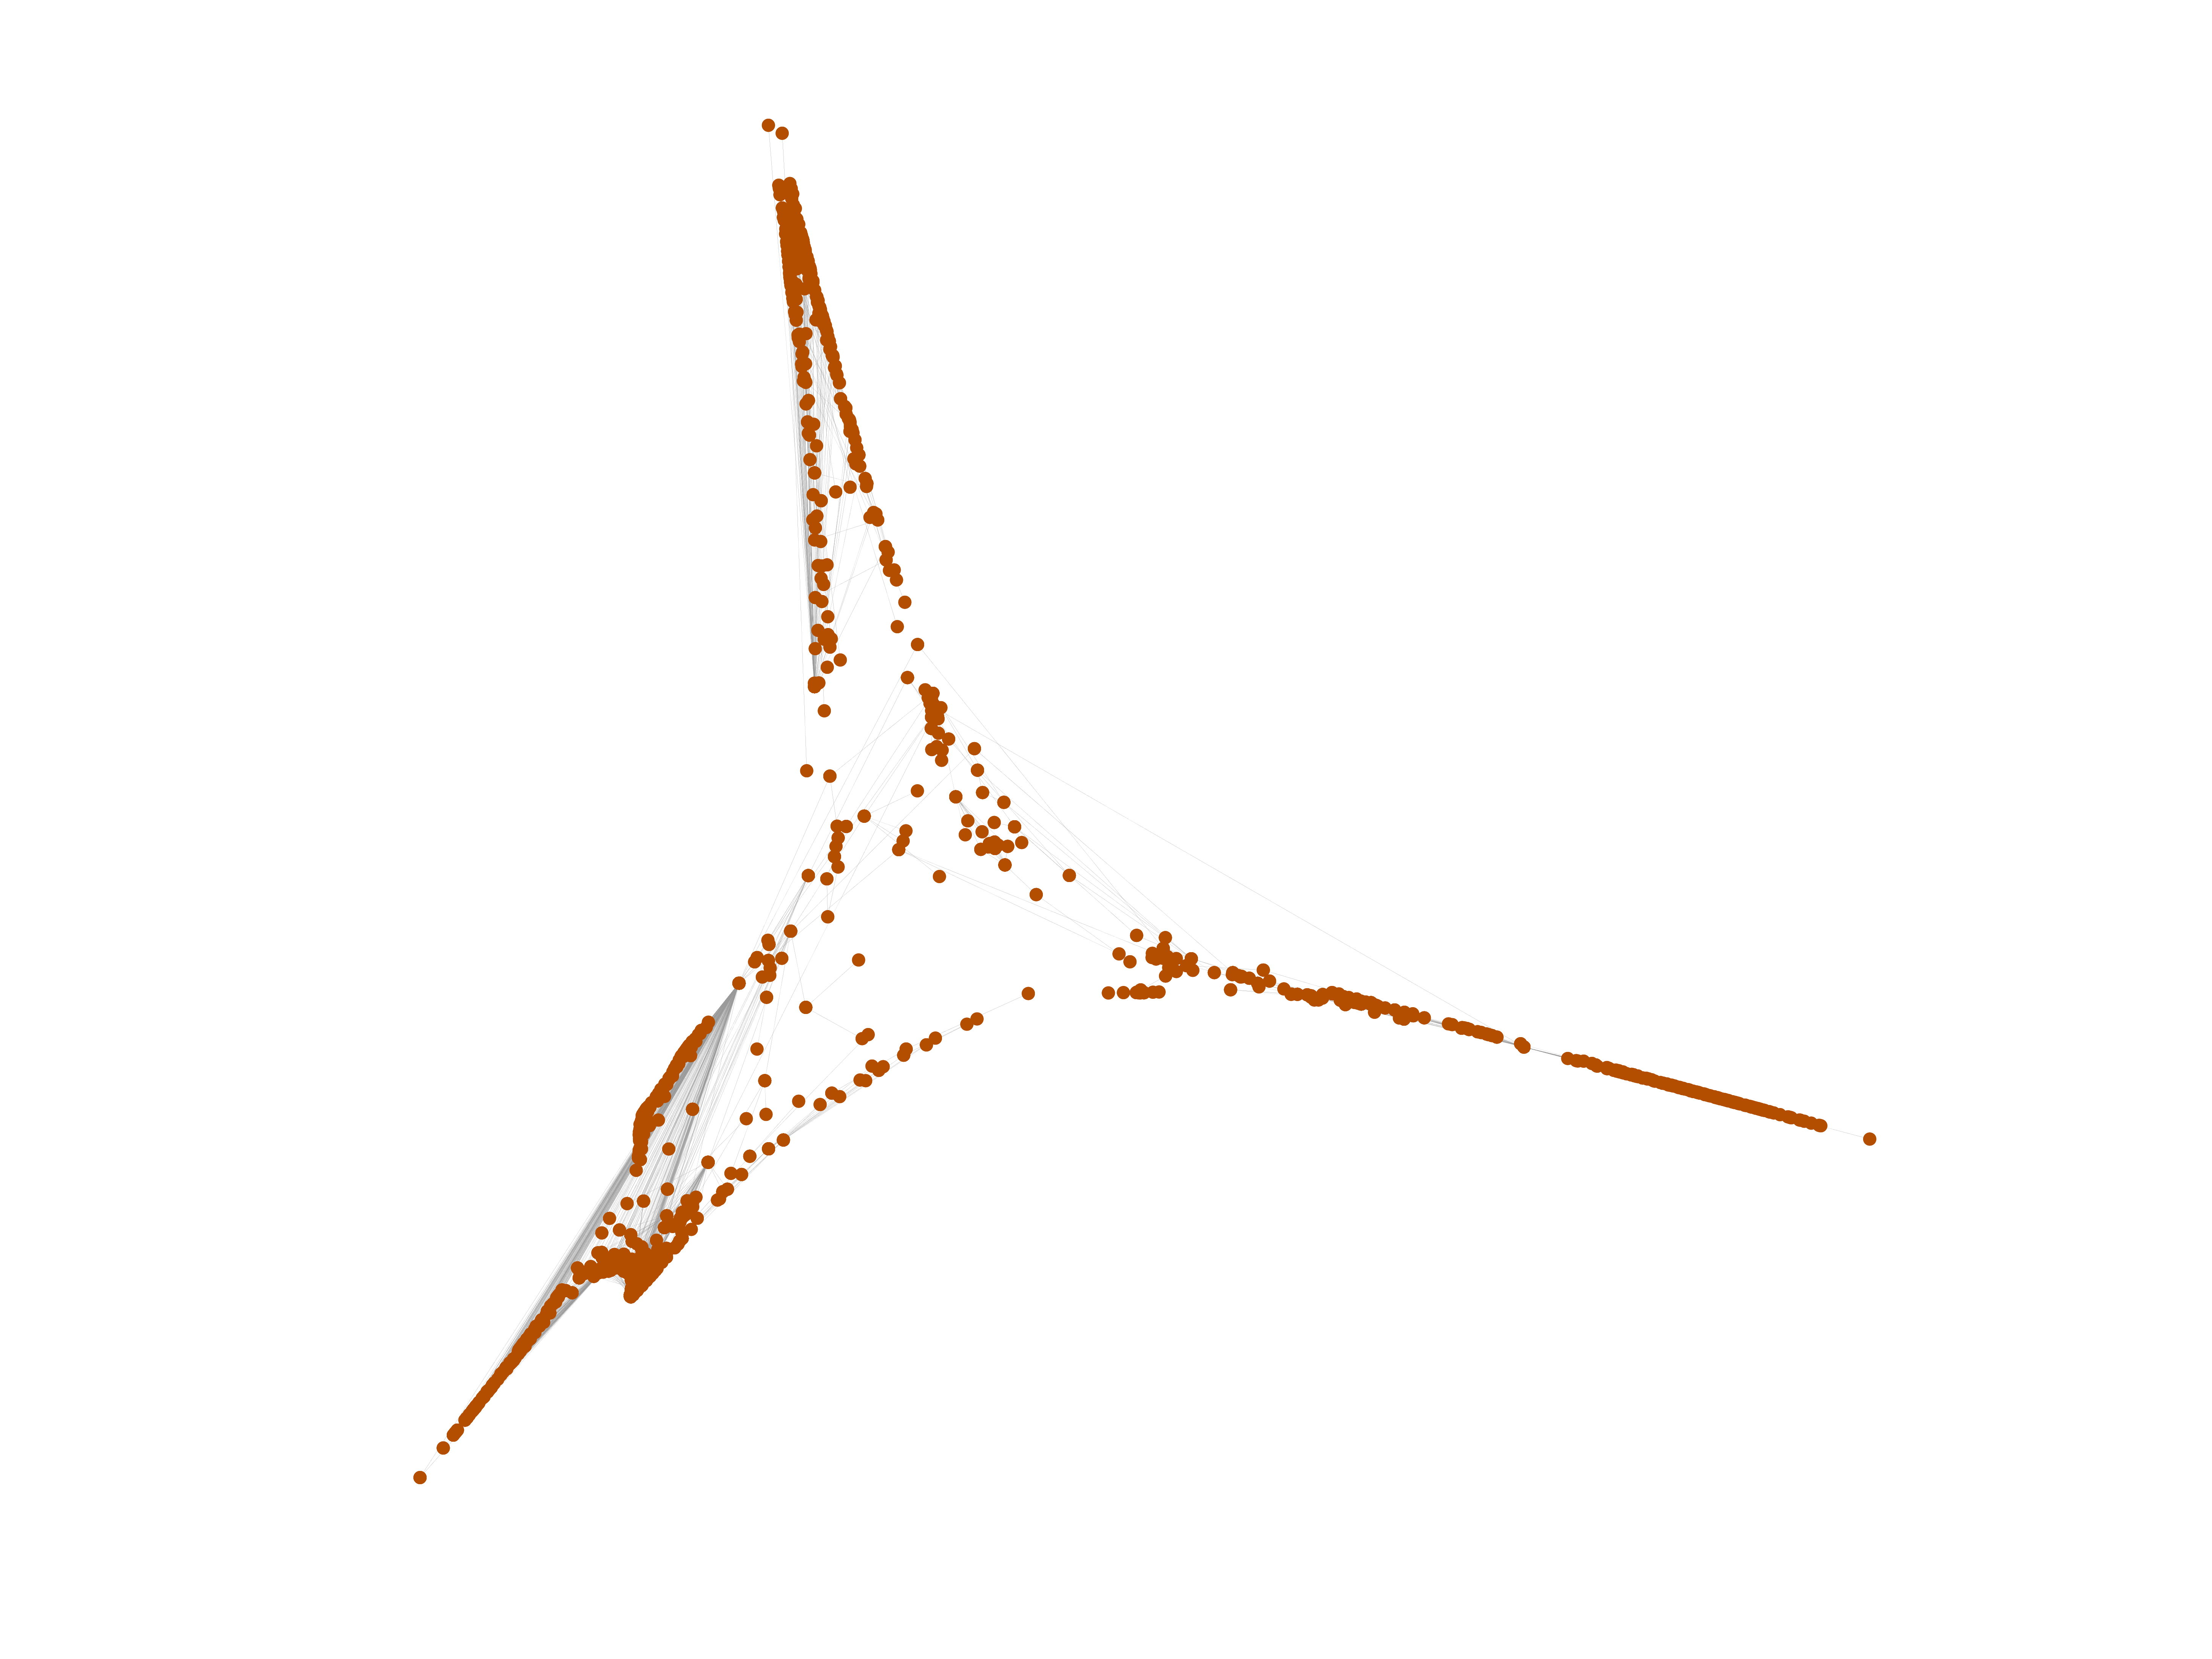
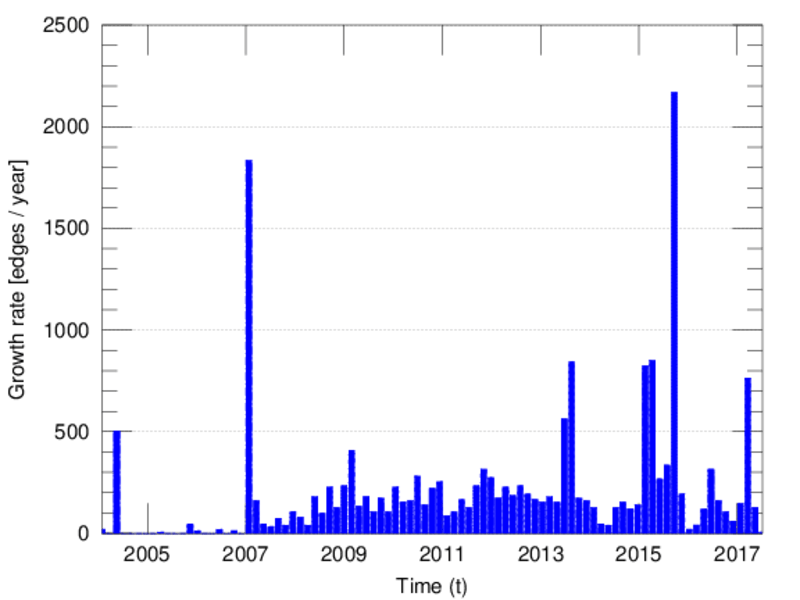
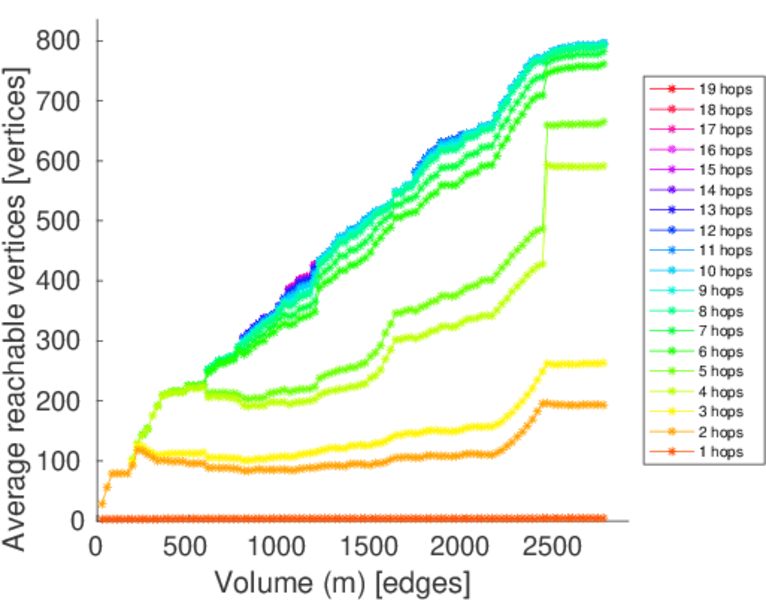
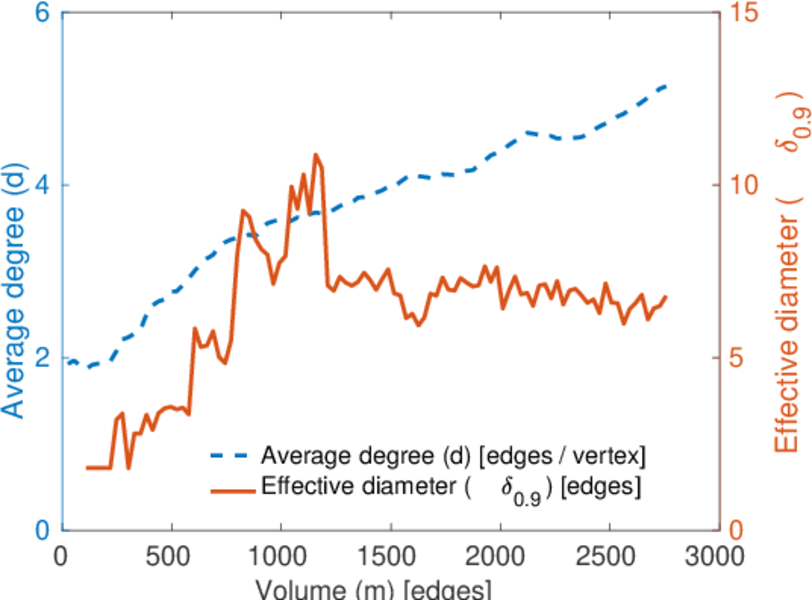
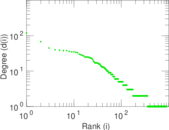
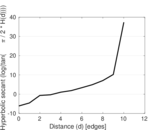
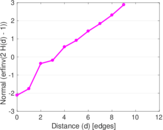
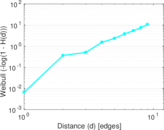
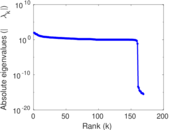
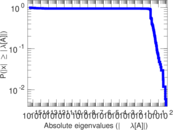
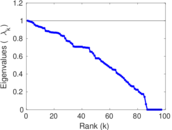
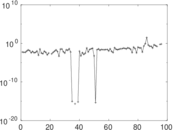
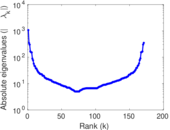
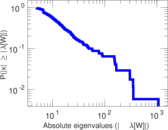
Plots


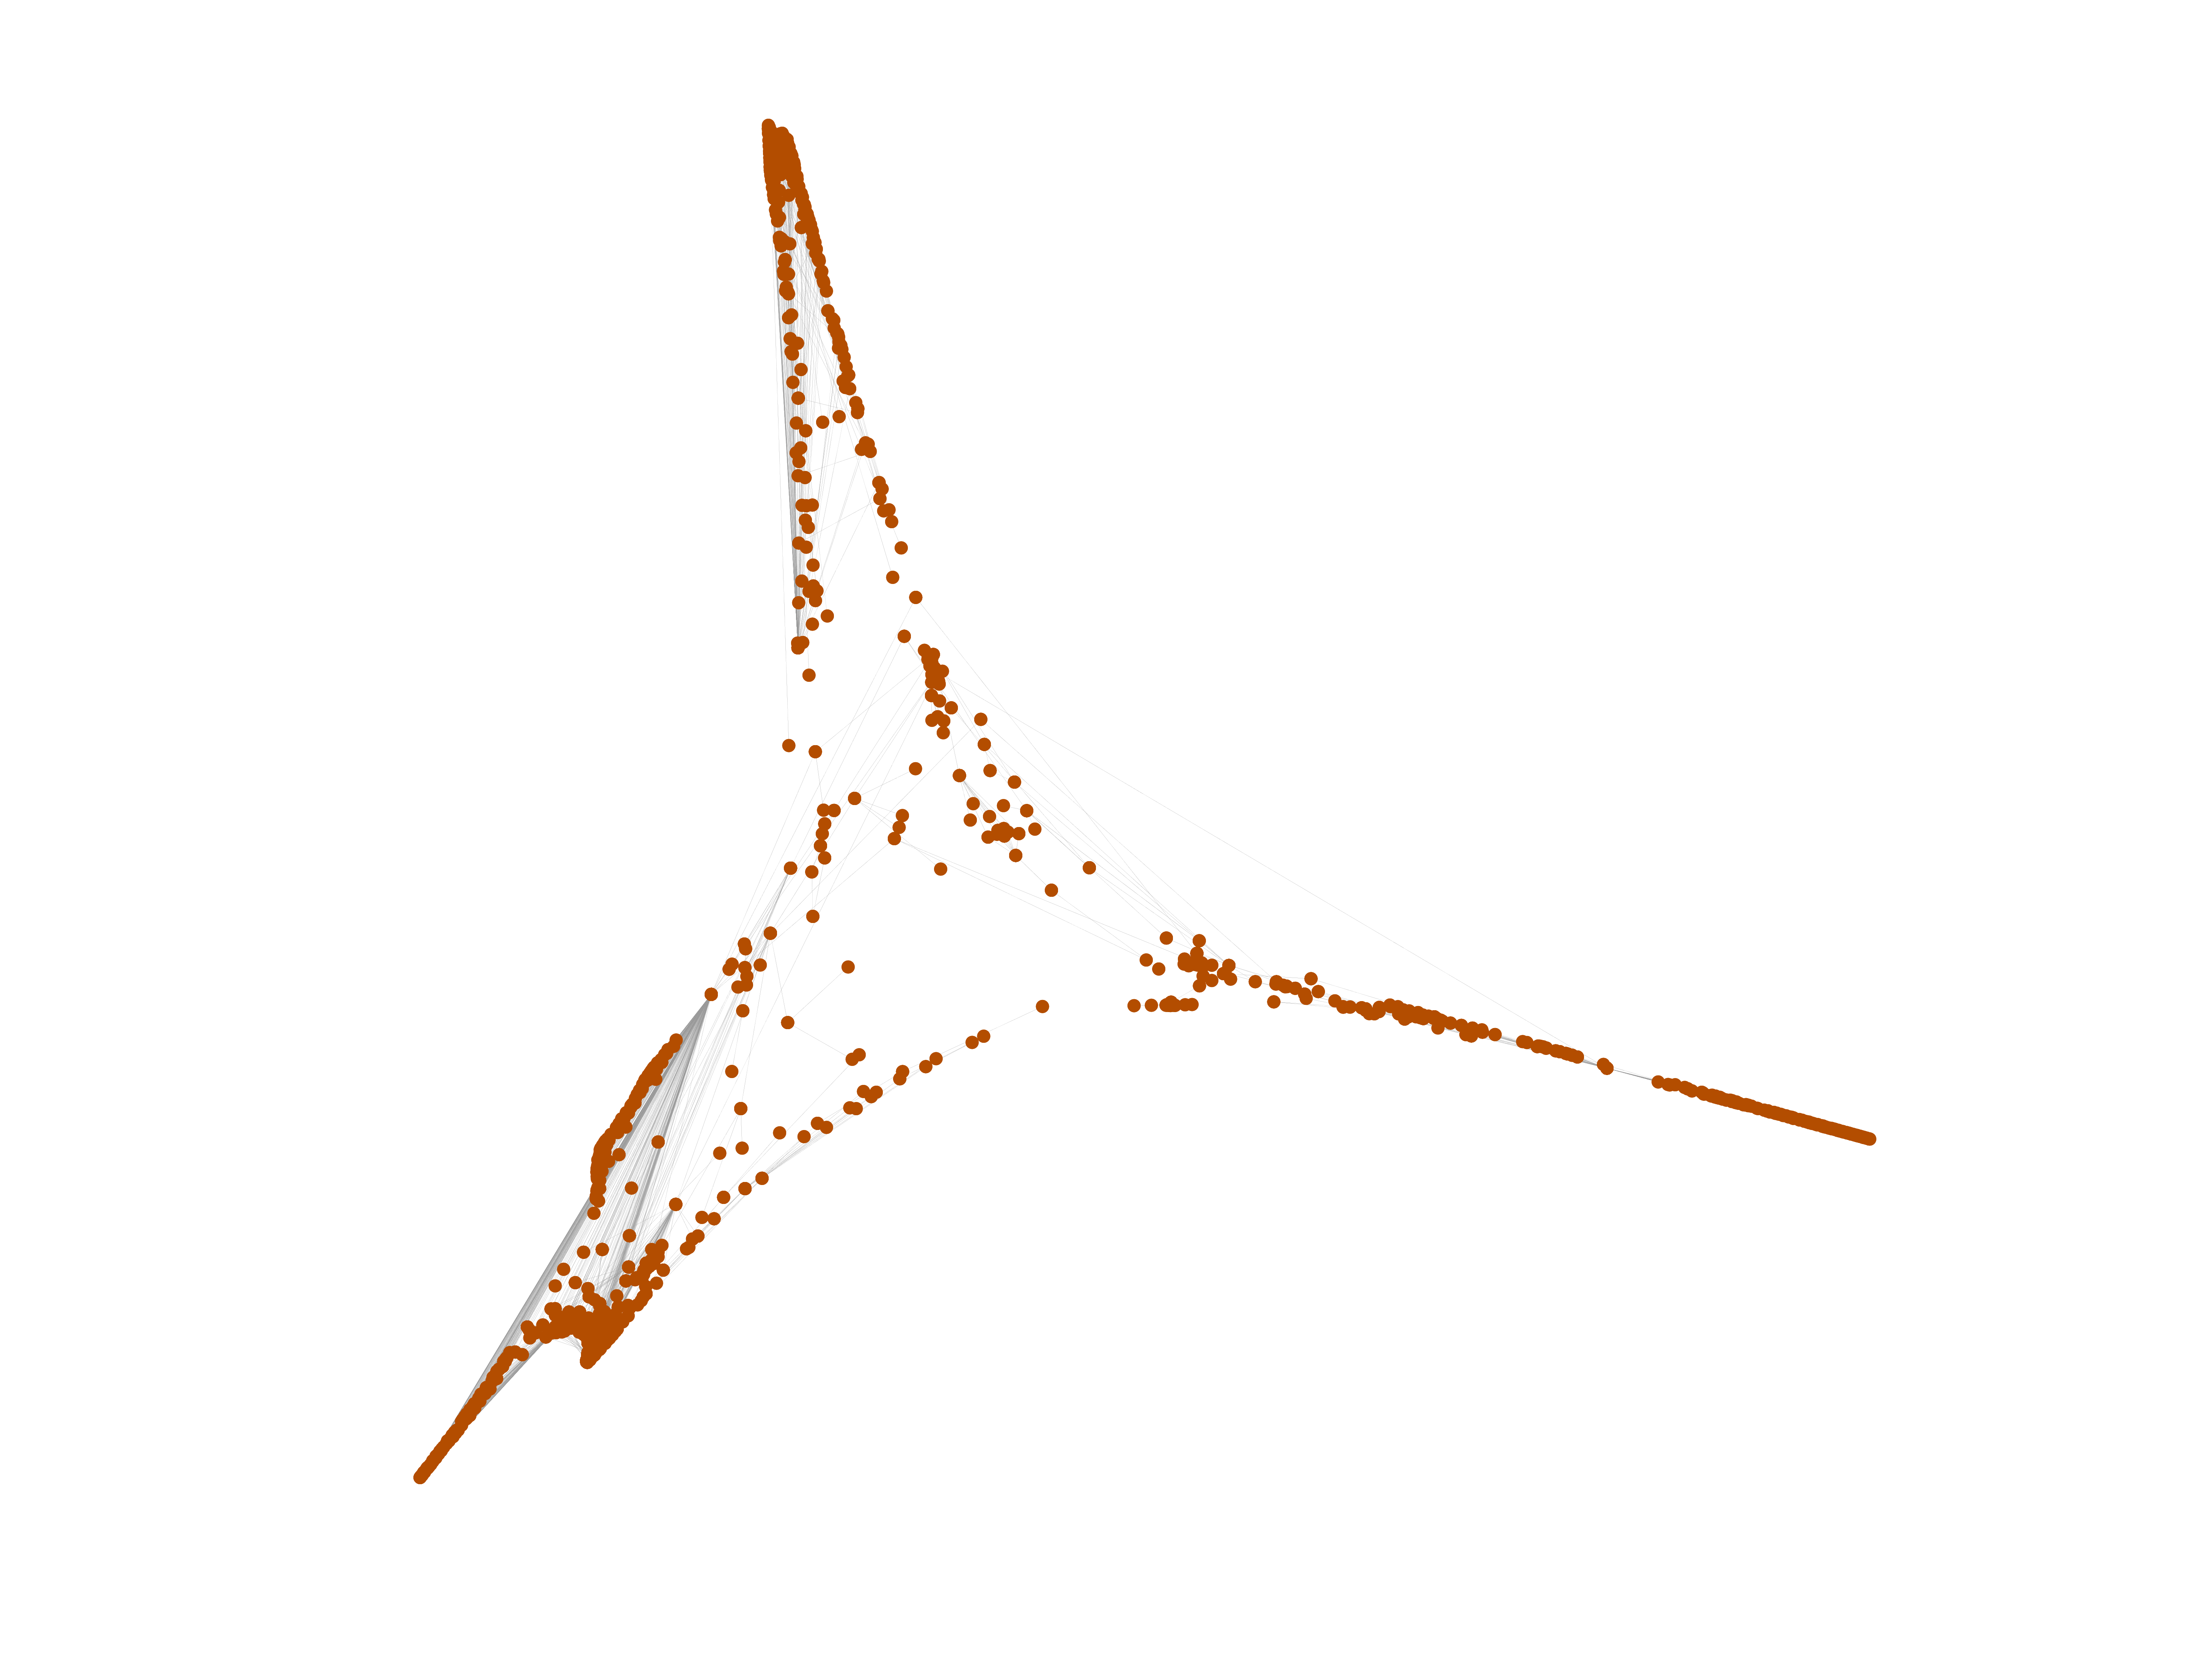
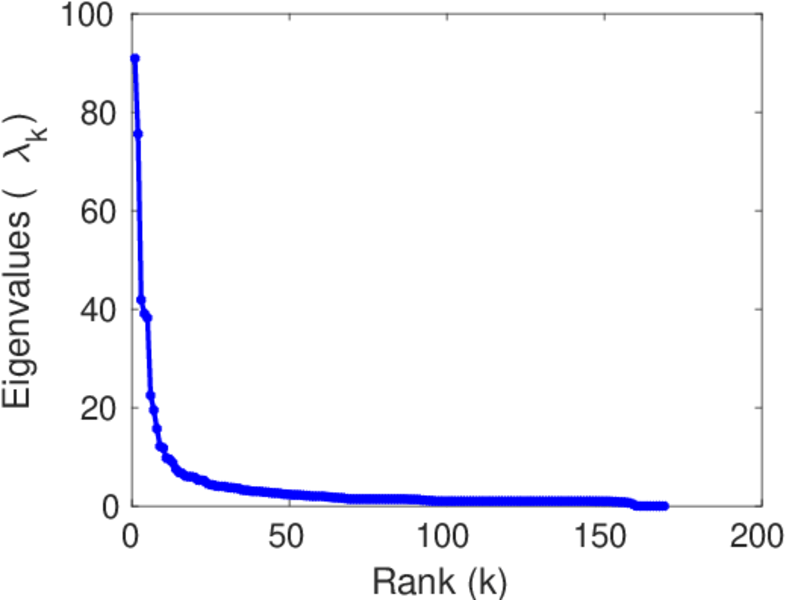
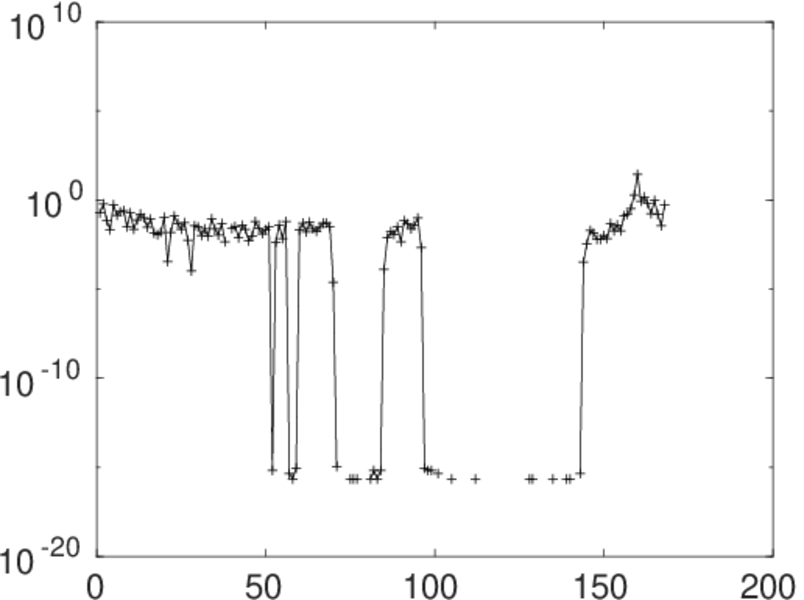
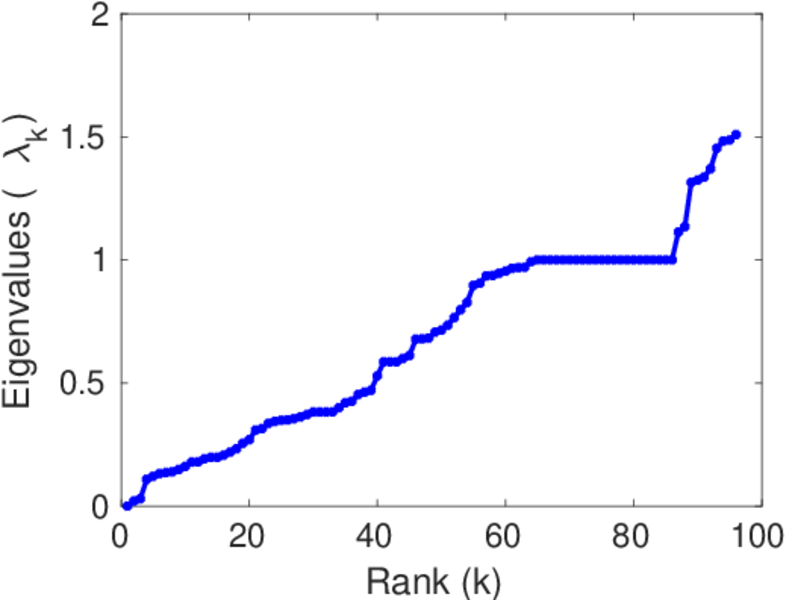
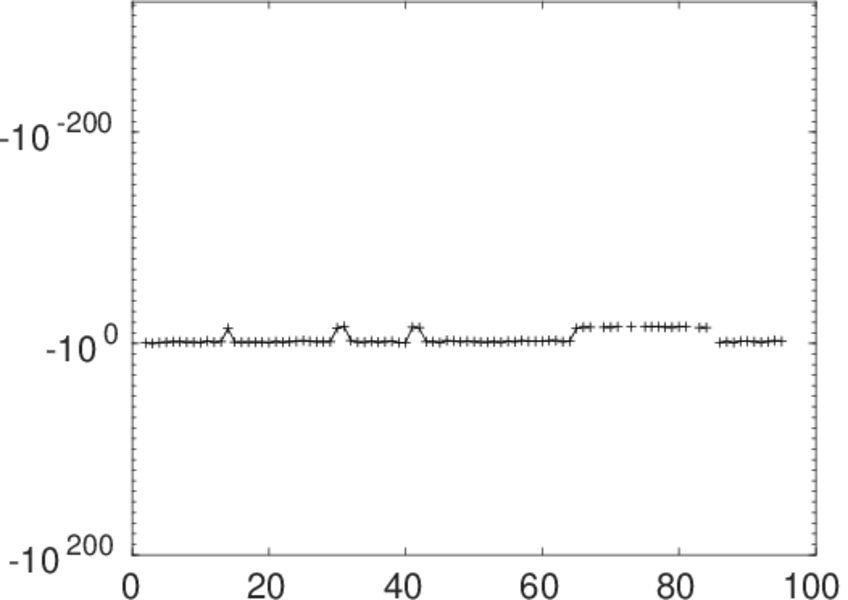
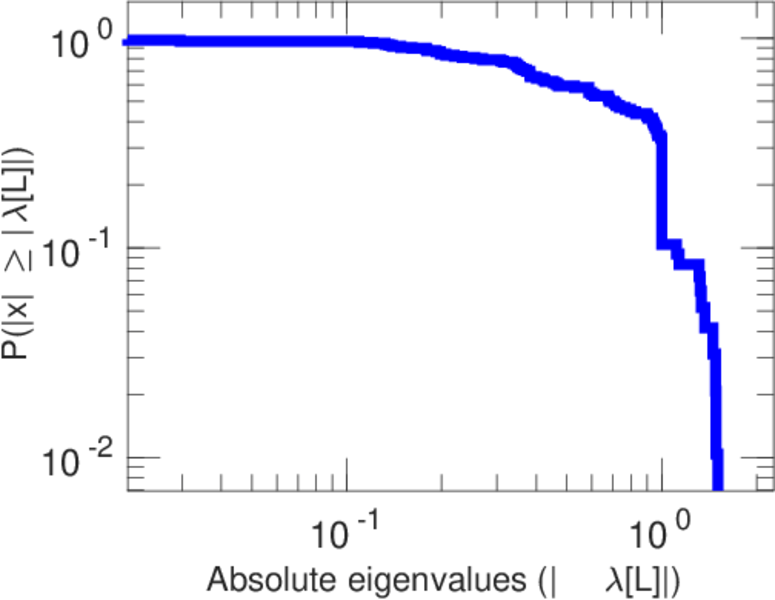
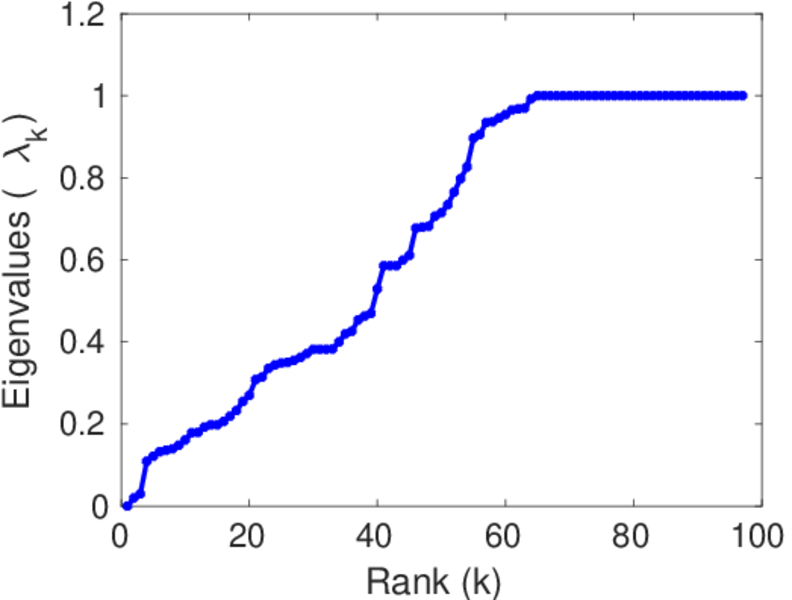
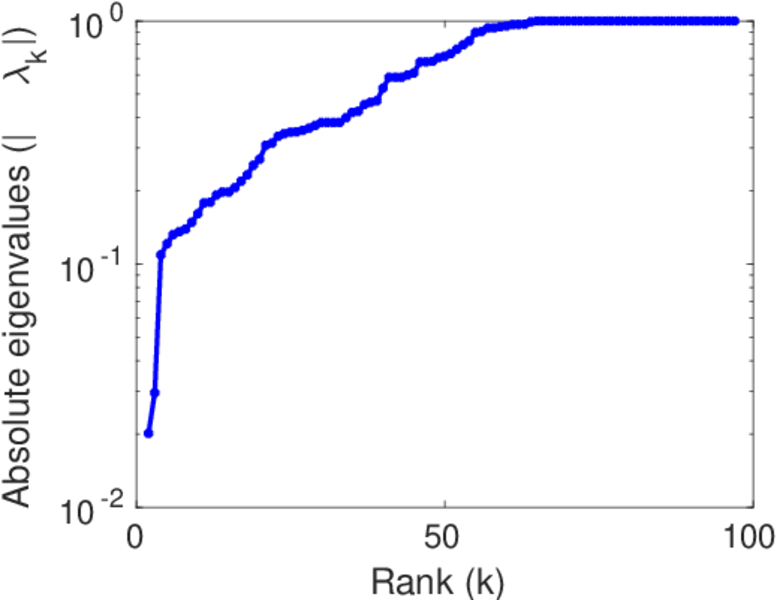
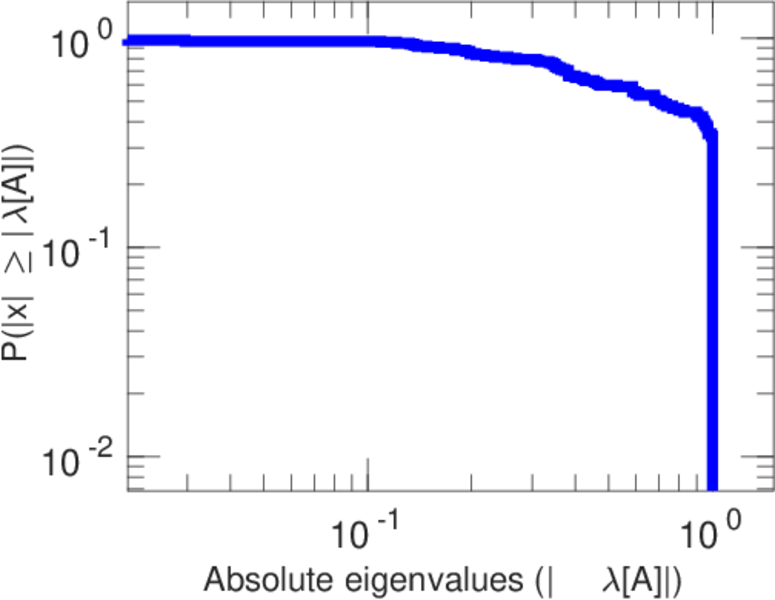
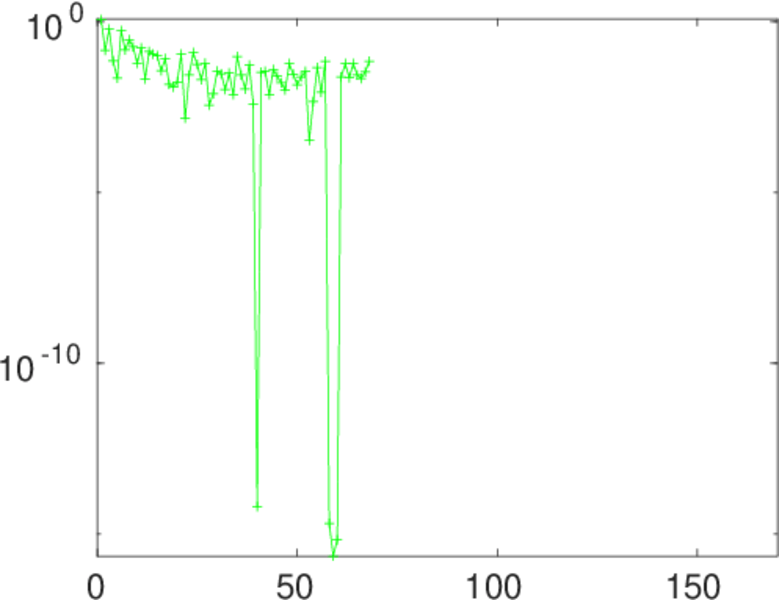
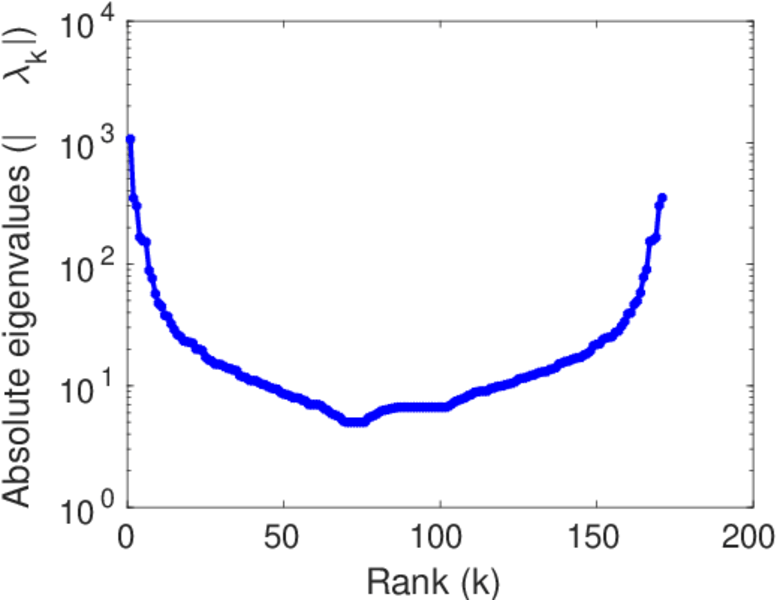
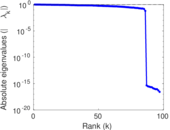
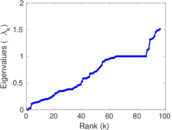
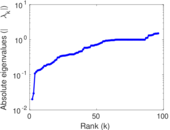
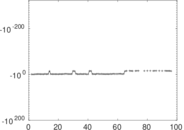
Matrix decompositions plots


Downloads
References
|
[1]
|
Jérôme Kunegis.
KONECT – The Koblenz Network Collection.
In Proc. Int. Conf. on World Wide Web Companion, pages
1343–1350, 2013.
[ http ]
|
|
[2]
|
Wikimedia Foundation.
Wikimedia downloads.
http://dumps.wikimedia.org/, January 2010.
|
 KONECT ‣ Networks ‣
Buy Me a Coffee
KONECT ‣ Networks ‣
Buy Me a Coffee