Wikipedia edits (tt)
This is the bipartite edit network of the Tatar Wikipedia. It contains users
and pages from the Tatar Wikipedia, connected by edit events. Each edge
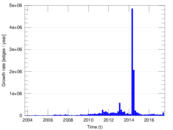
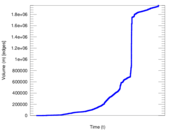
represents an edit. The dataset includes the timestamp of each edit.
Metadata
Statistics
| Size | n = | 175,460
|
| Left size | n1 = | 2,441
|
| Right size | n2 = | 173,019
|
| Volume | m = | 1,960,260
|
| Unique edge count | m̿ = | 557,362
|
| Wedge count | s = | 7,078,938,010
|
| Claw count | z = | 127,622,147,815,123
|
| Cross count | x = | 2,255,551,743,694,339,840
|
| Square count | q = | 3,162,334,761
|
| 4-Tour count | T4 = | 53,616,001,928
|
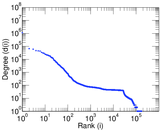
| Maximum degree | dmax = | 1,115,118
|
| Maximum left degree | d1max = | 1,115,118
|
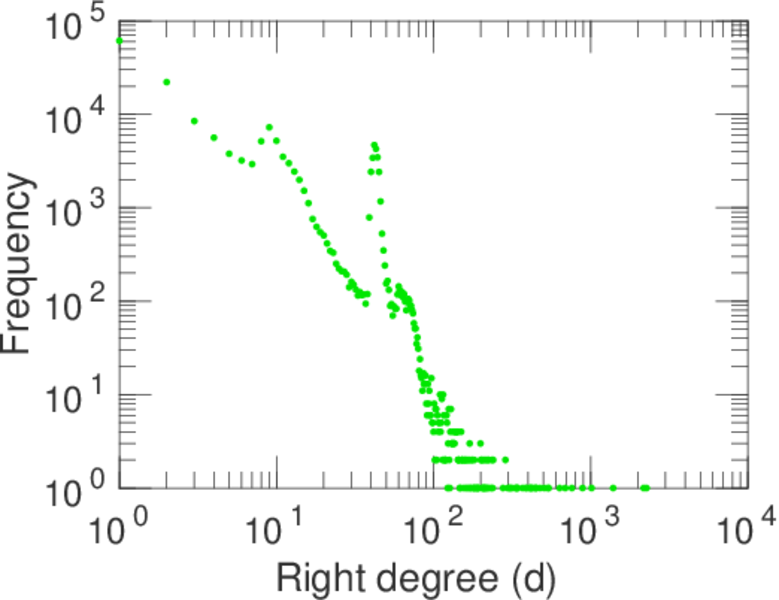
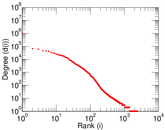
| Maximum right degree | d2max = | 2,271
|
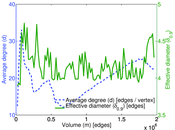
| Average degree | d = | 22.344 2
|
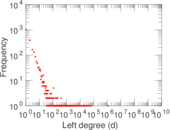
| Average left degree | d1 = | 803.056
|
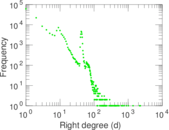
| Average right degree | d2 = | 11.329 7
|
| Fill | p = | 0.001 319 70
|
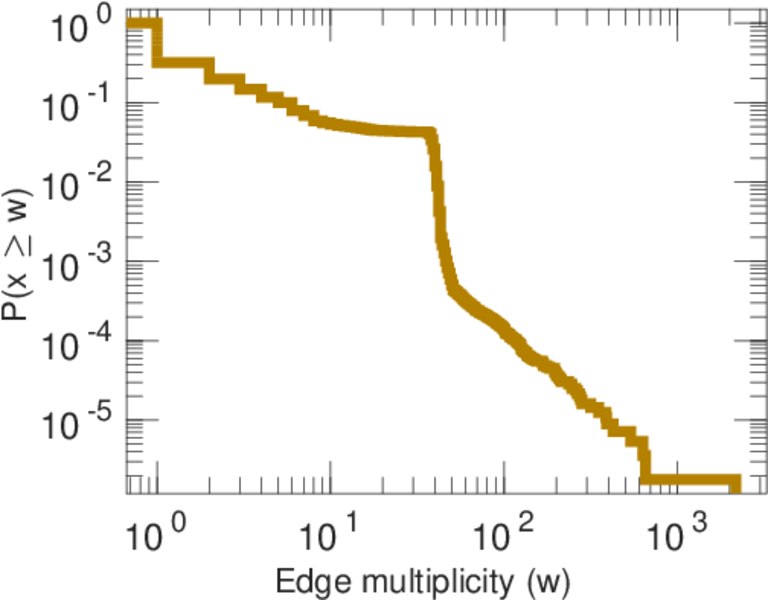
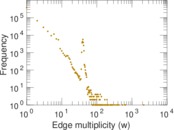
| Average edge multiplicity | m̃ = | 3.517 03
|
| Size of LCC | N = | 173,453
|
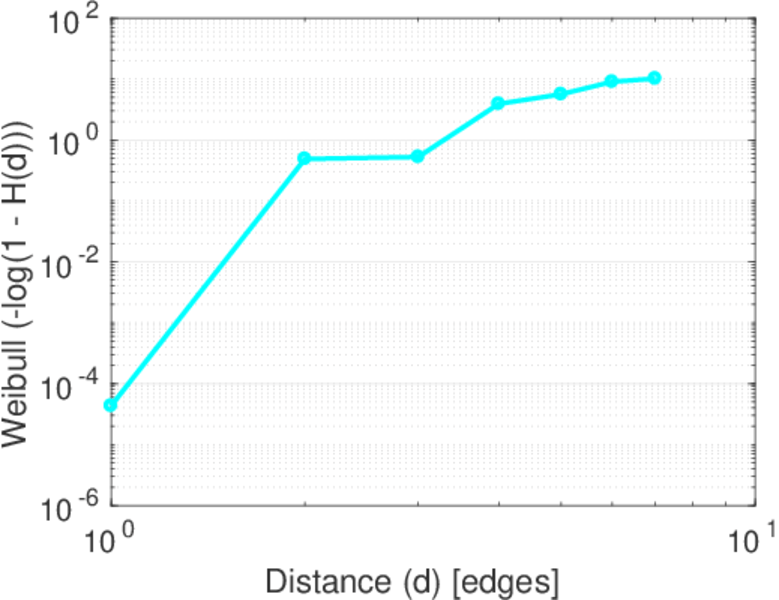
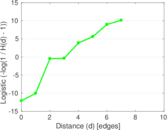
| Diameter | δ = | 11
|
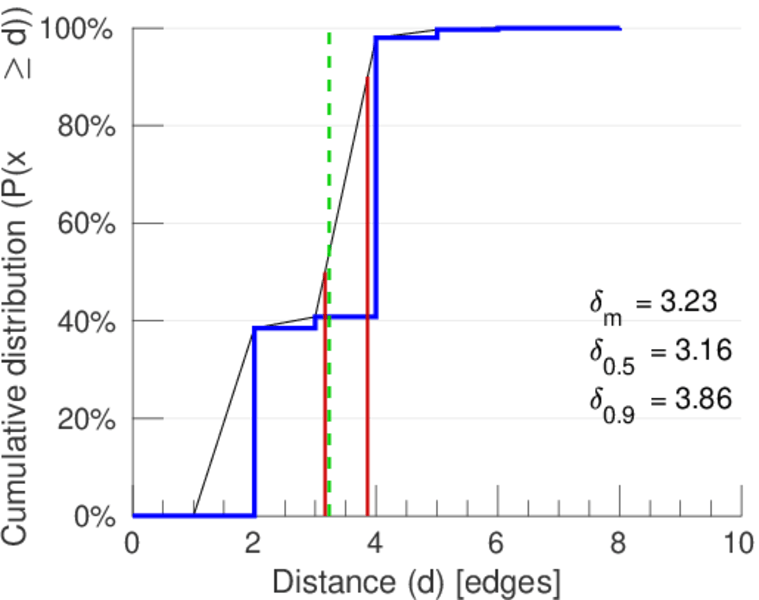
| 50-Percentile effective diameter | δ0.5 = | 3.160 93
|
| 90-Percentile effective diameter | δ0.9 = | 3.860 63
|
| Median distance | δM = | 4
|
| Mean distance | δm = | 3.231 48
|
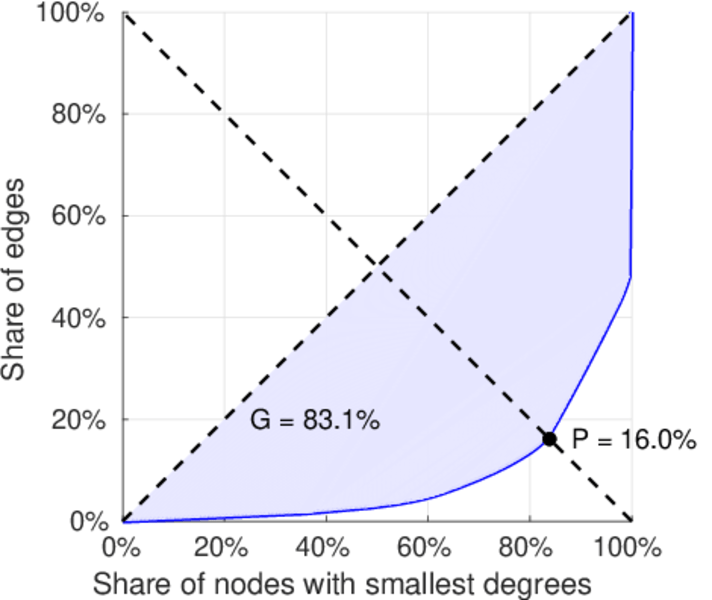
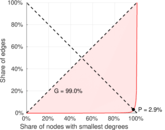
| Gini coefficient | G = | 0.831 708
|
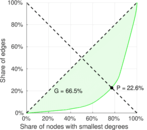
| Balanced inequality ratio | P = | 0.159 993
|
| Left balanced inequality ratio | P1 = | 0.029 328 3
|
| Right balanced inequality ratio | P2 = | 0.225 912
|
| Relative edge distribution entropy | Her = | 0.699 304
|
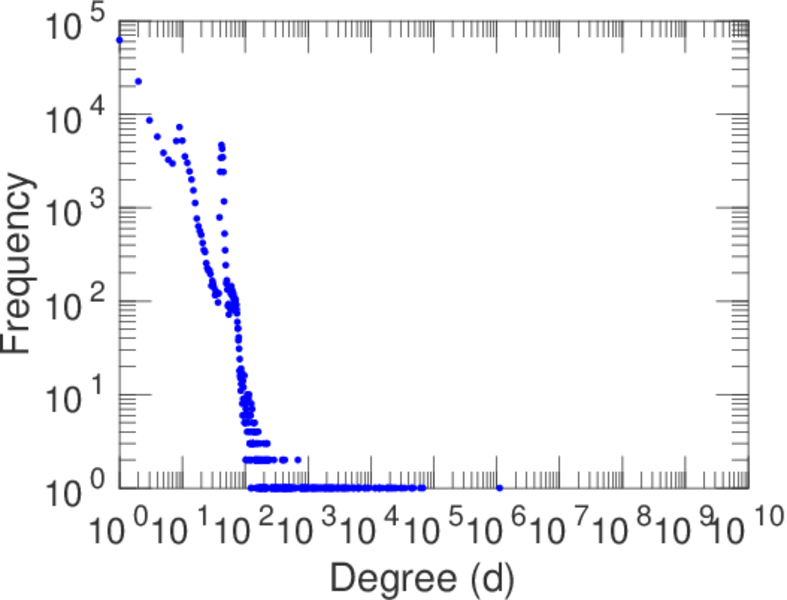
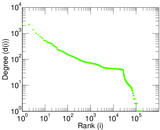
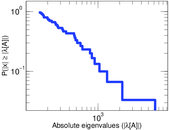
| Power law exponent | γ = | 2.274 46
|
| Tail power law exponent | γt = | 2.641 00
|
| Tail power law exponent with p | γ3 = | 2.641 00
|
| p-value | p = | 0.000 00
|
| Left tail power law exponent with p | γ3,1 = | 1.651 00
|
| Left p-value | p1 = | 0.000 00
|
| Right tail power law exponent with p | γ3,2 = | 2.701 00
|
| Right p-value | p2 = | 0.000 00
|
| Degree assortativity | ρ = | −0.360 705
|
| Degree assortativity p-value | pρ = | 0.000 00
|
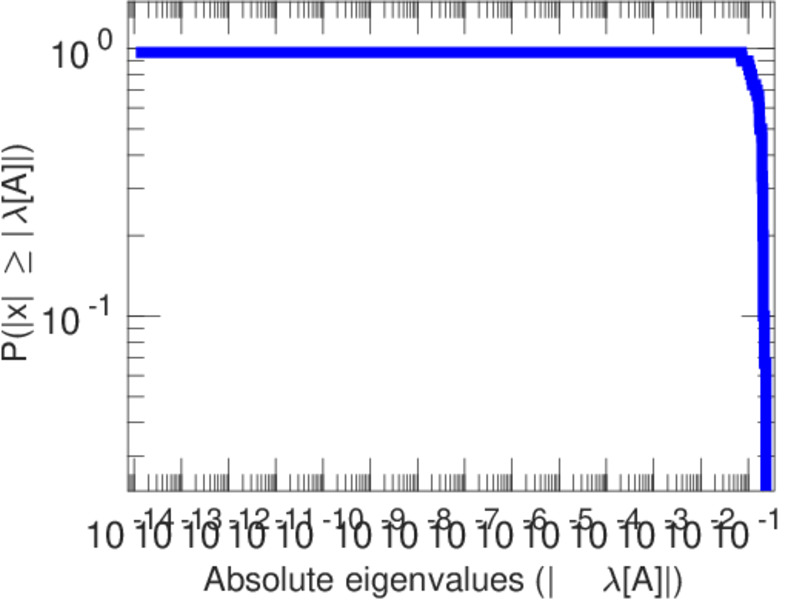
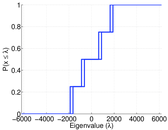
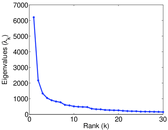
| Spectral norm | α = | 6,200.94
|
| Algebraic connectivity | a = | 0.071 625 1
|
| Controllability | C = | 169,686
|
| Relative controllability | Cr = | 0.974 283
|
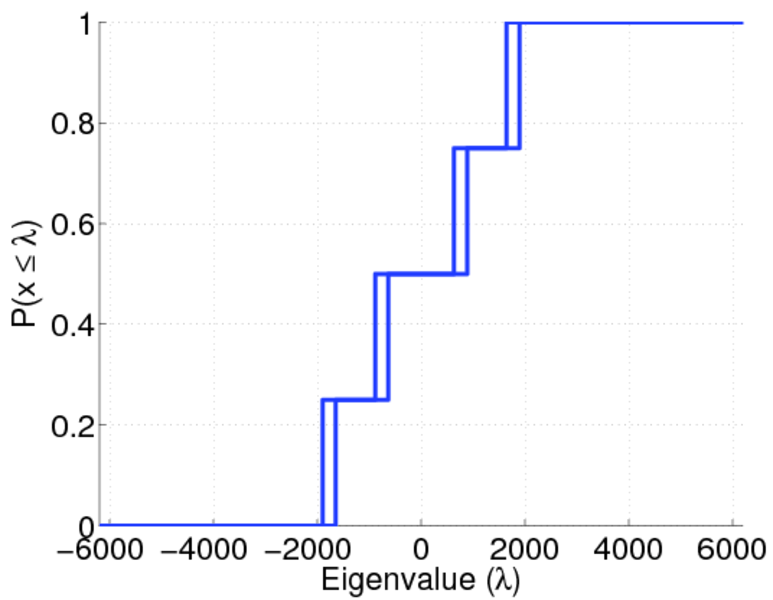
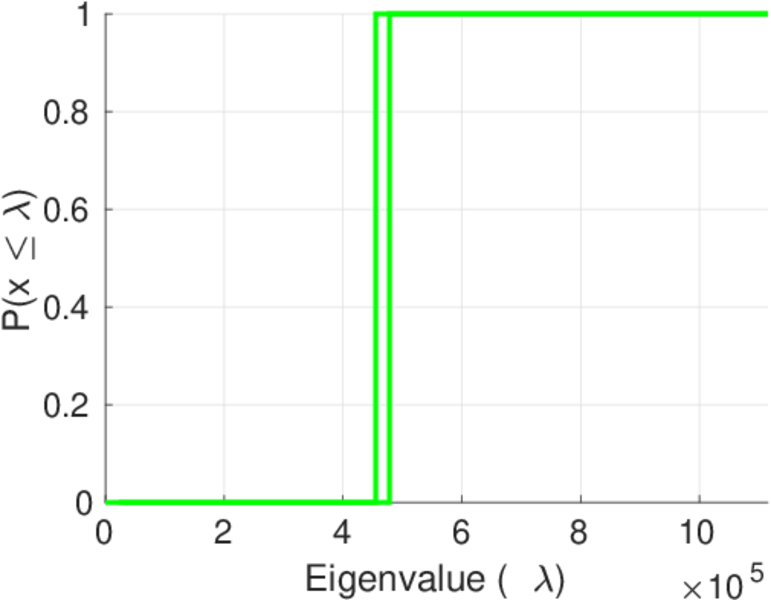
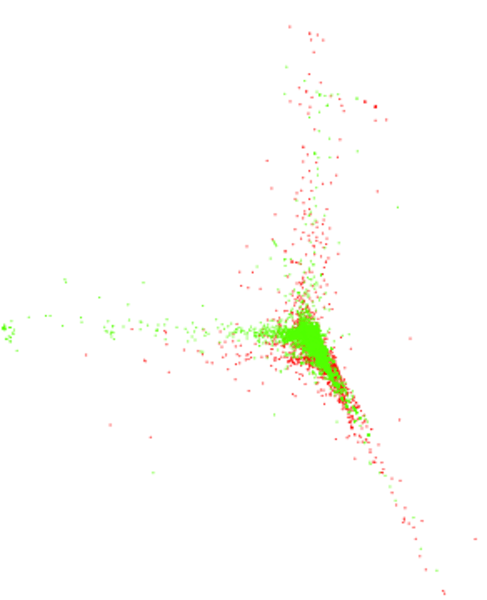
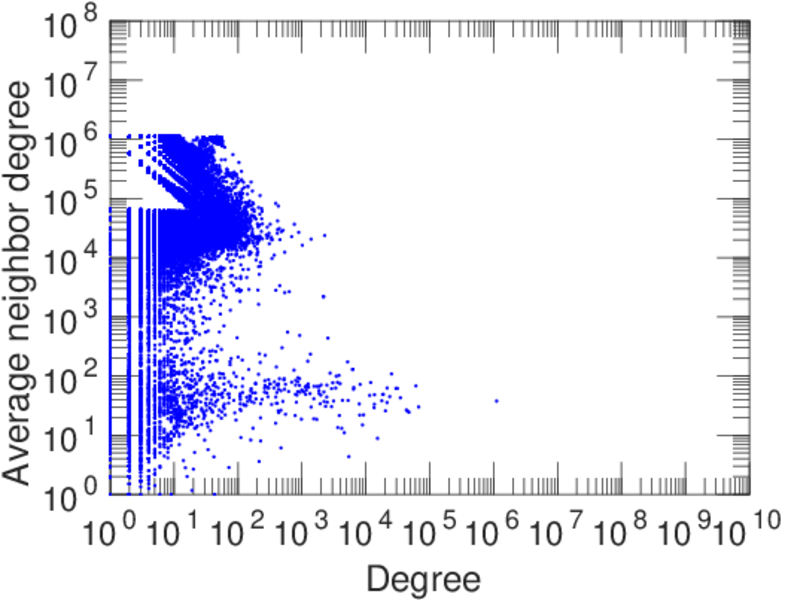
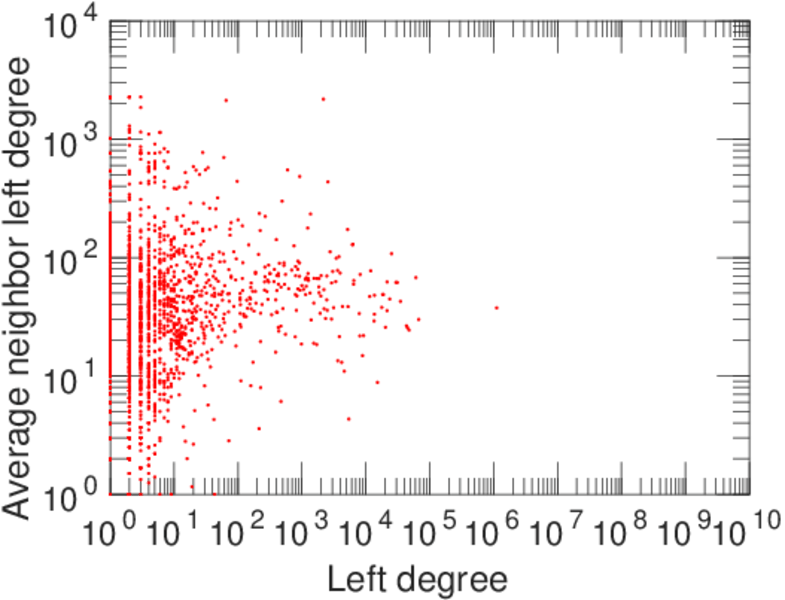
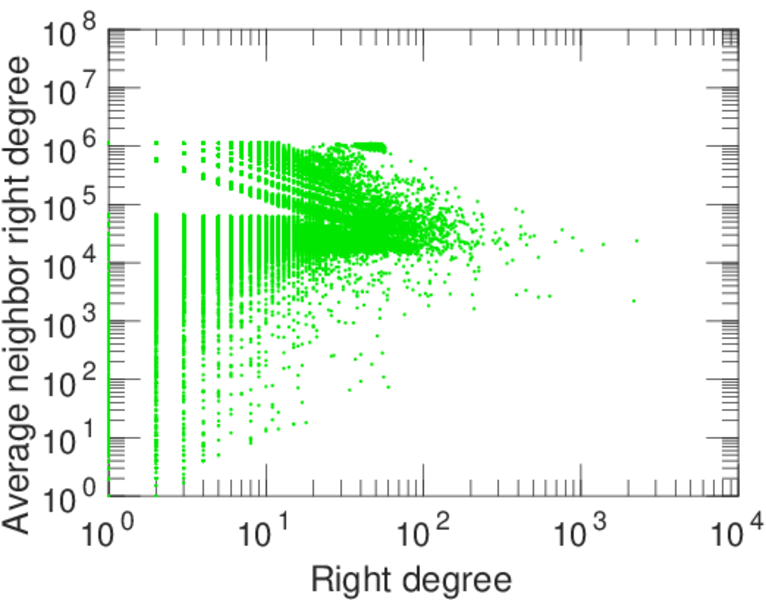
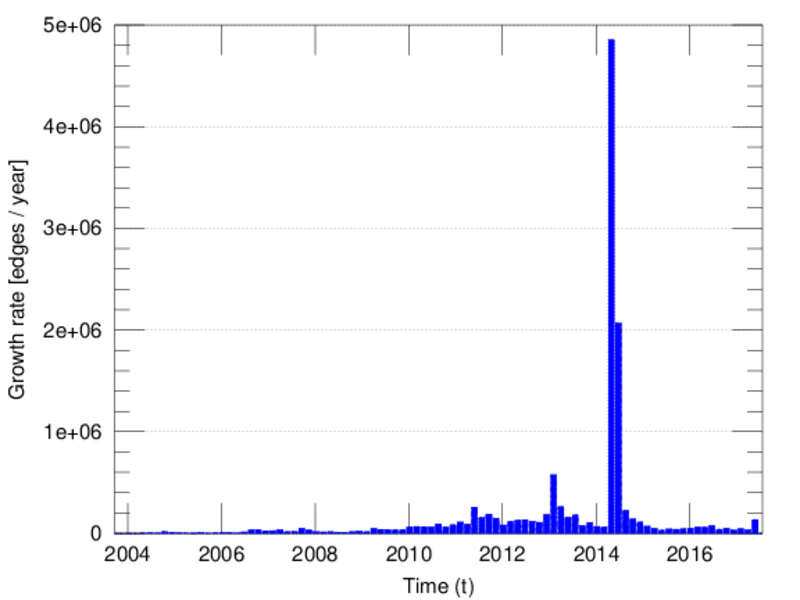
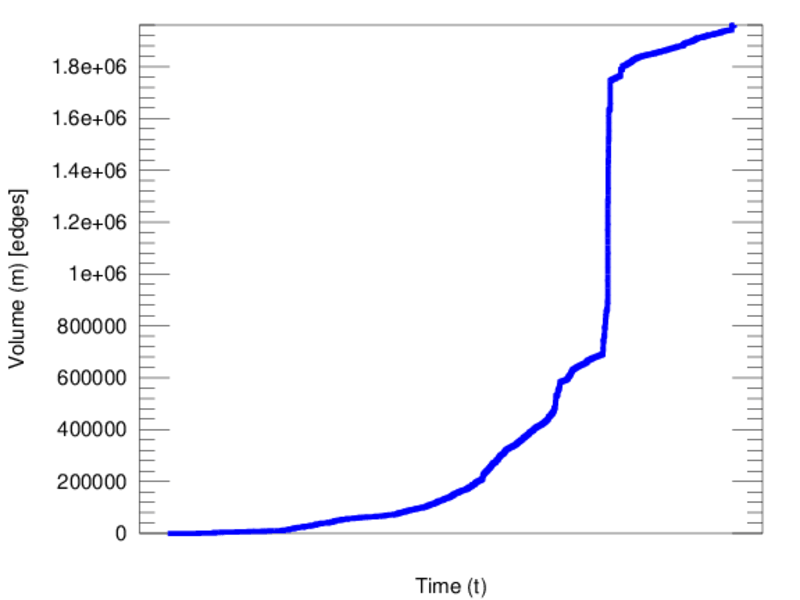
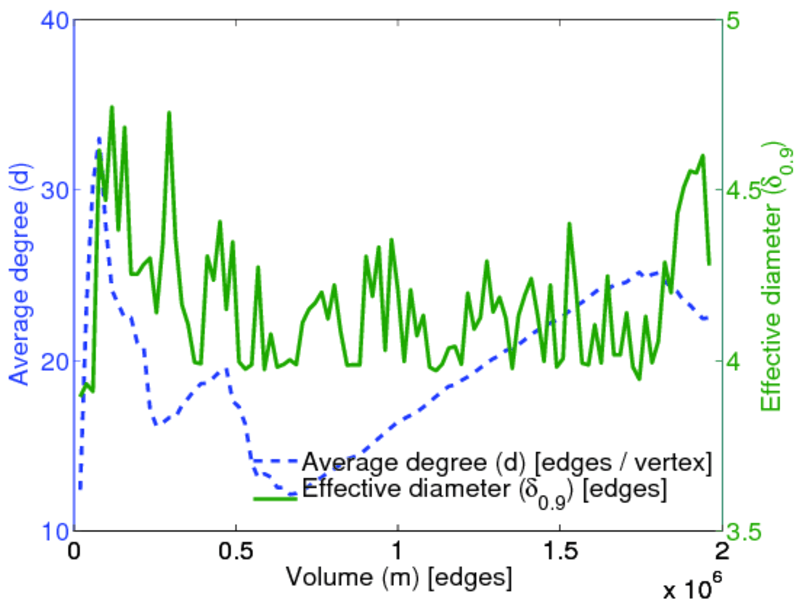
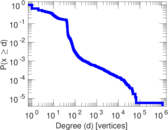
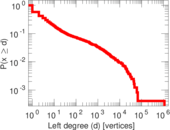
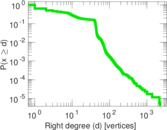
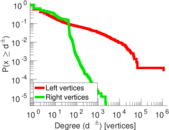
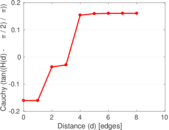
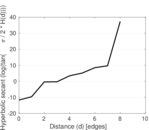
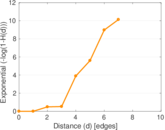
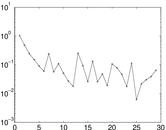
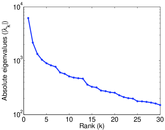
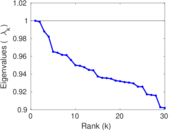
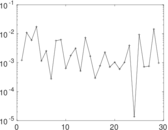
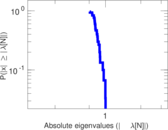
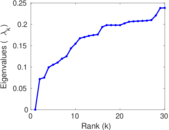
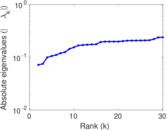
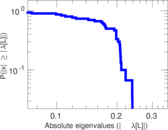
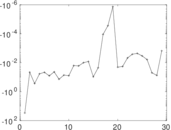
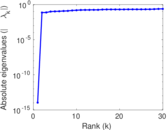
Plots


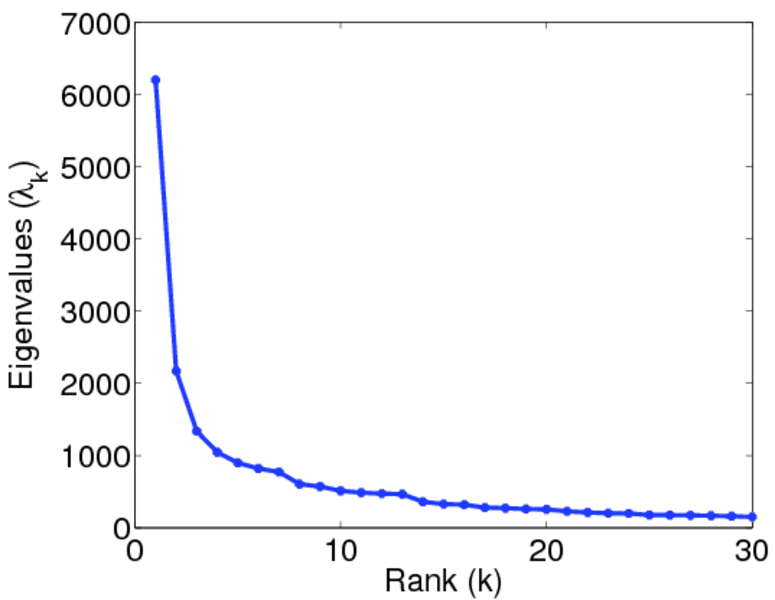
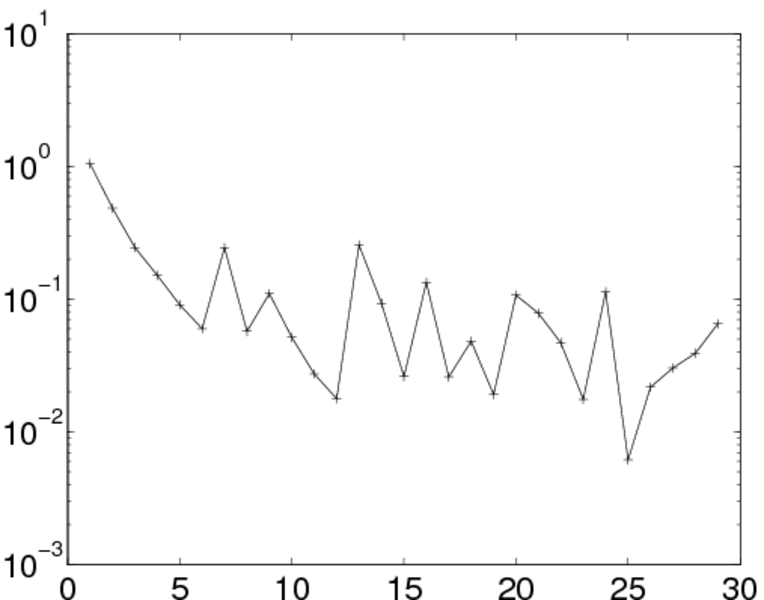
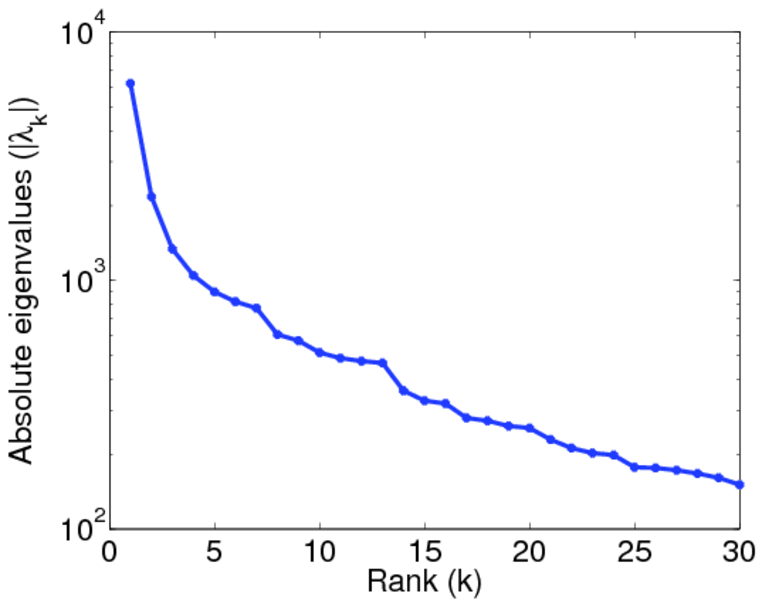
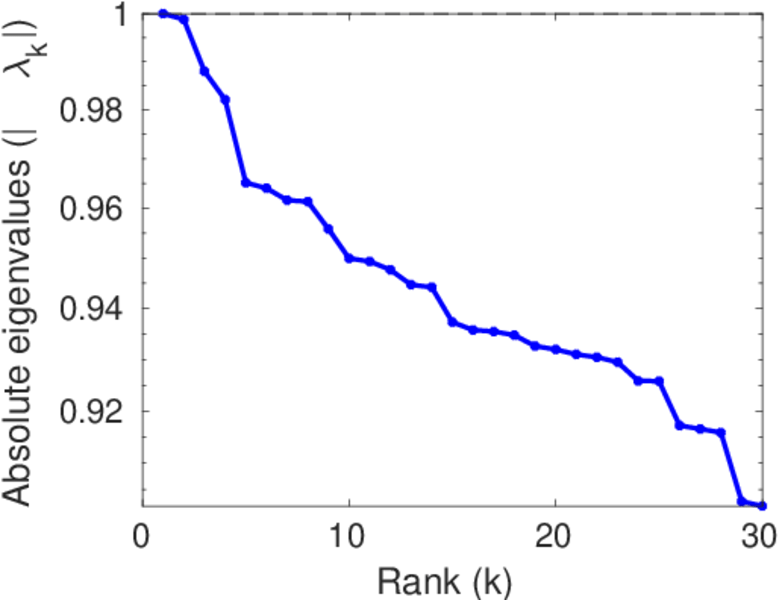
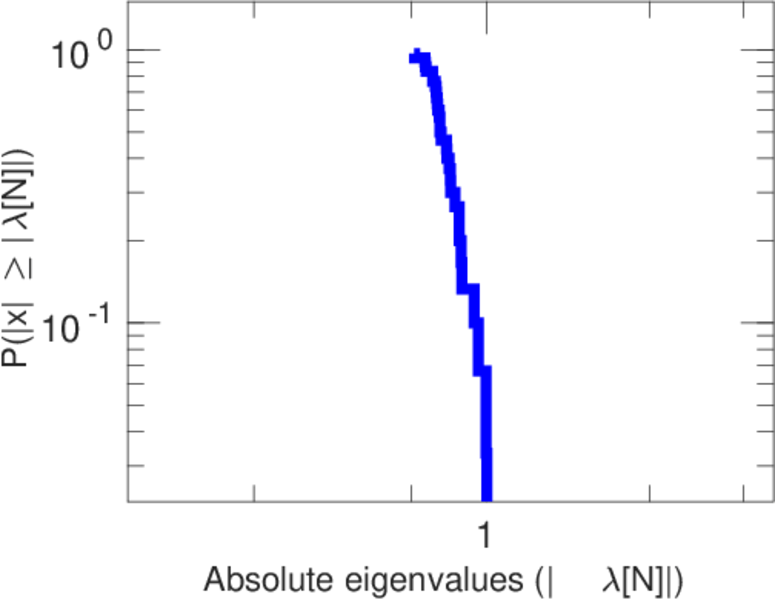
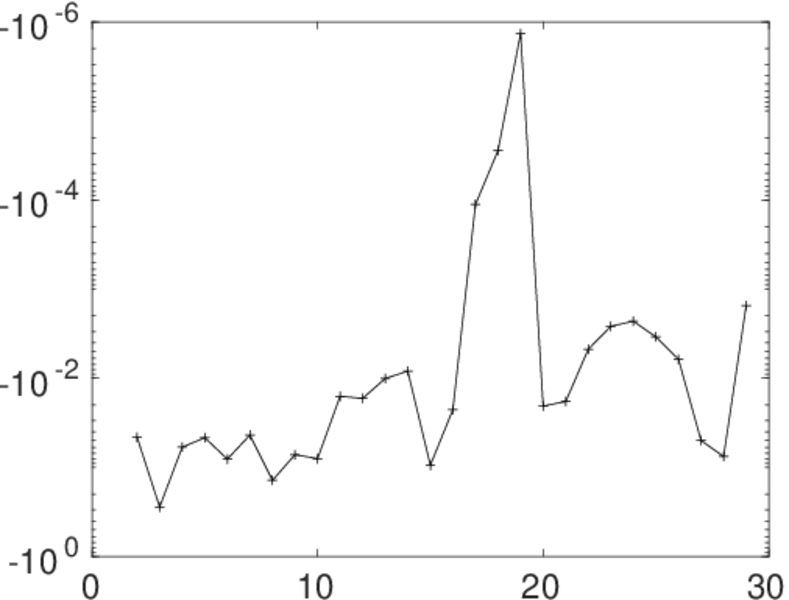
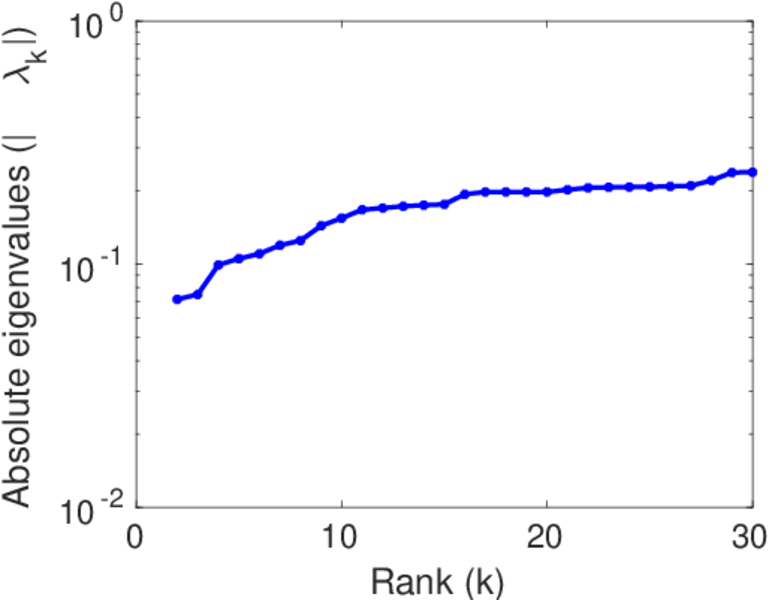
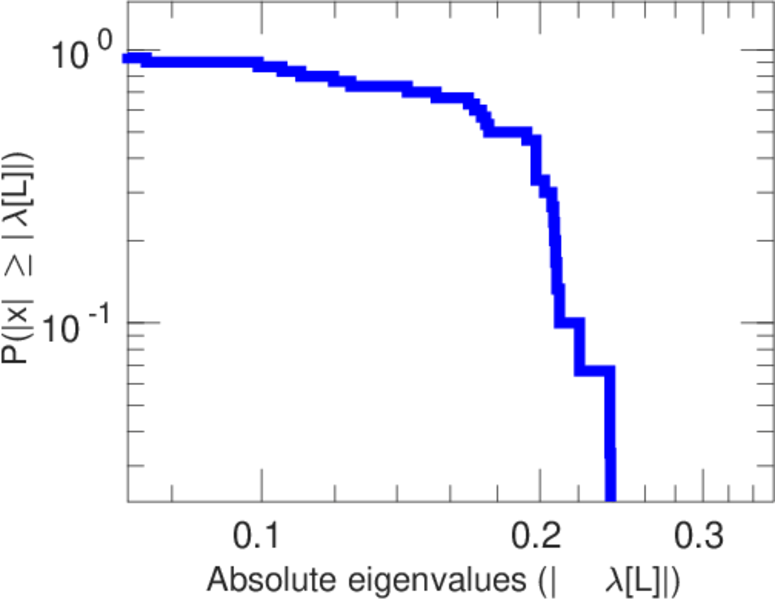
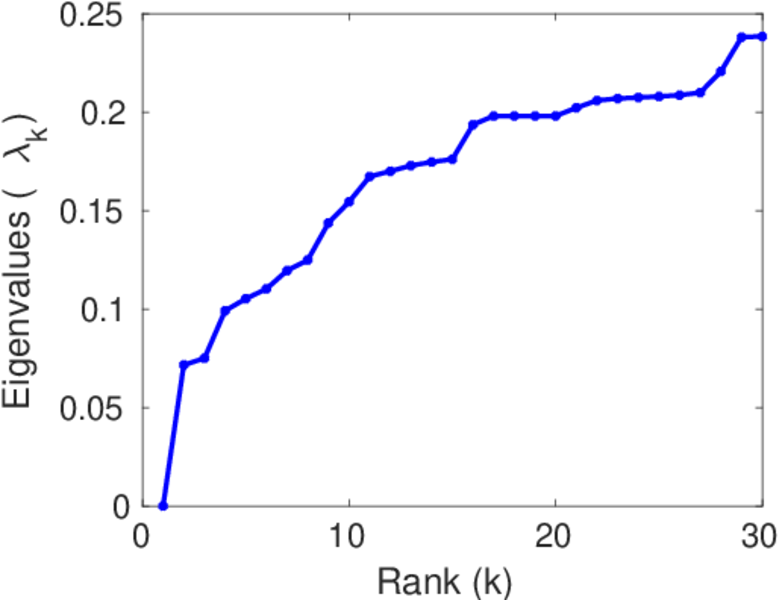
Matrix decompositions plots


Downloads
References
|
[1]
|
Jérôme Kunegis.
KONECT – The Koblenz Network Collection.
In Proc. Int. Conf. on World Wide Web Companion, pages
1343–1350, 2013.
[ http ]
|
|
[2]
|
Wikimedia Foundation.
Wikimedia downloads.
http://dumps.wikimedia.org/, January 2010.
|
 KONECT ‣ Networks ‣
Buy Me a Coffee
KONECT ‣ Networks ‣
Buy Me a Coffee