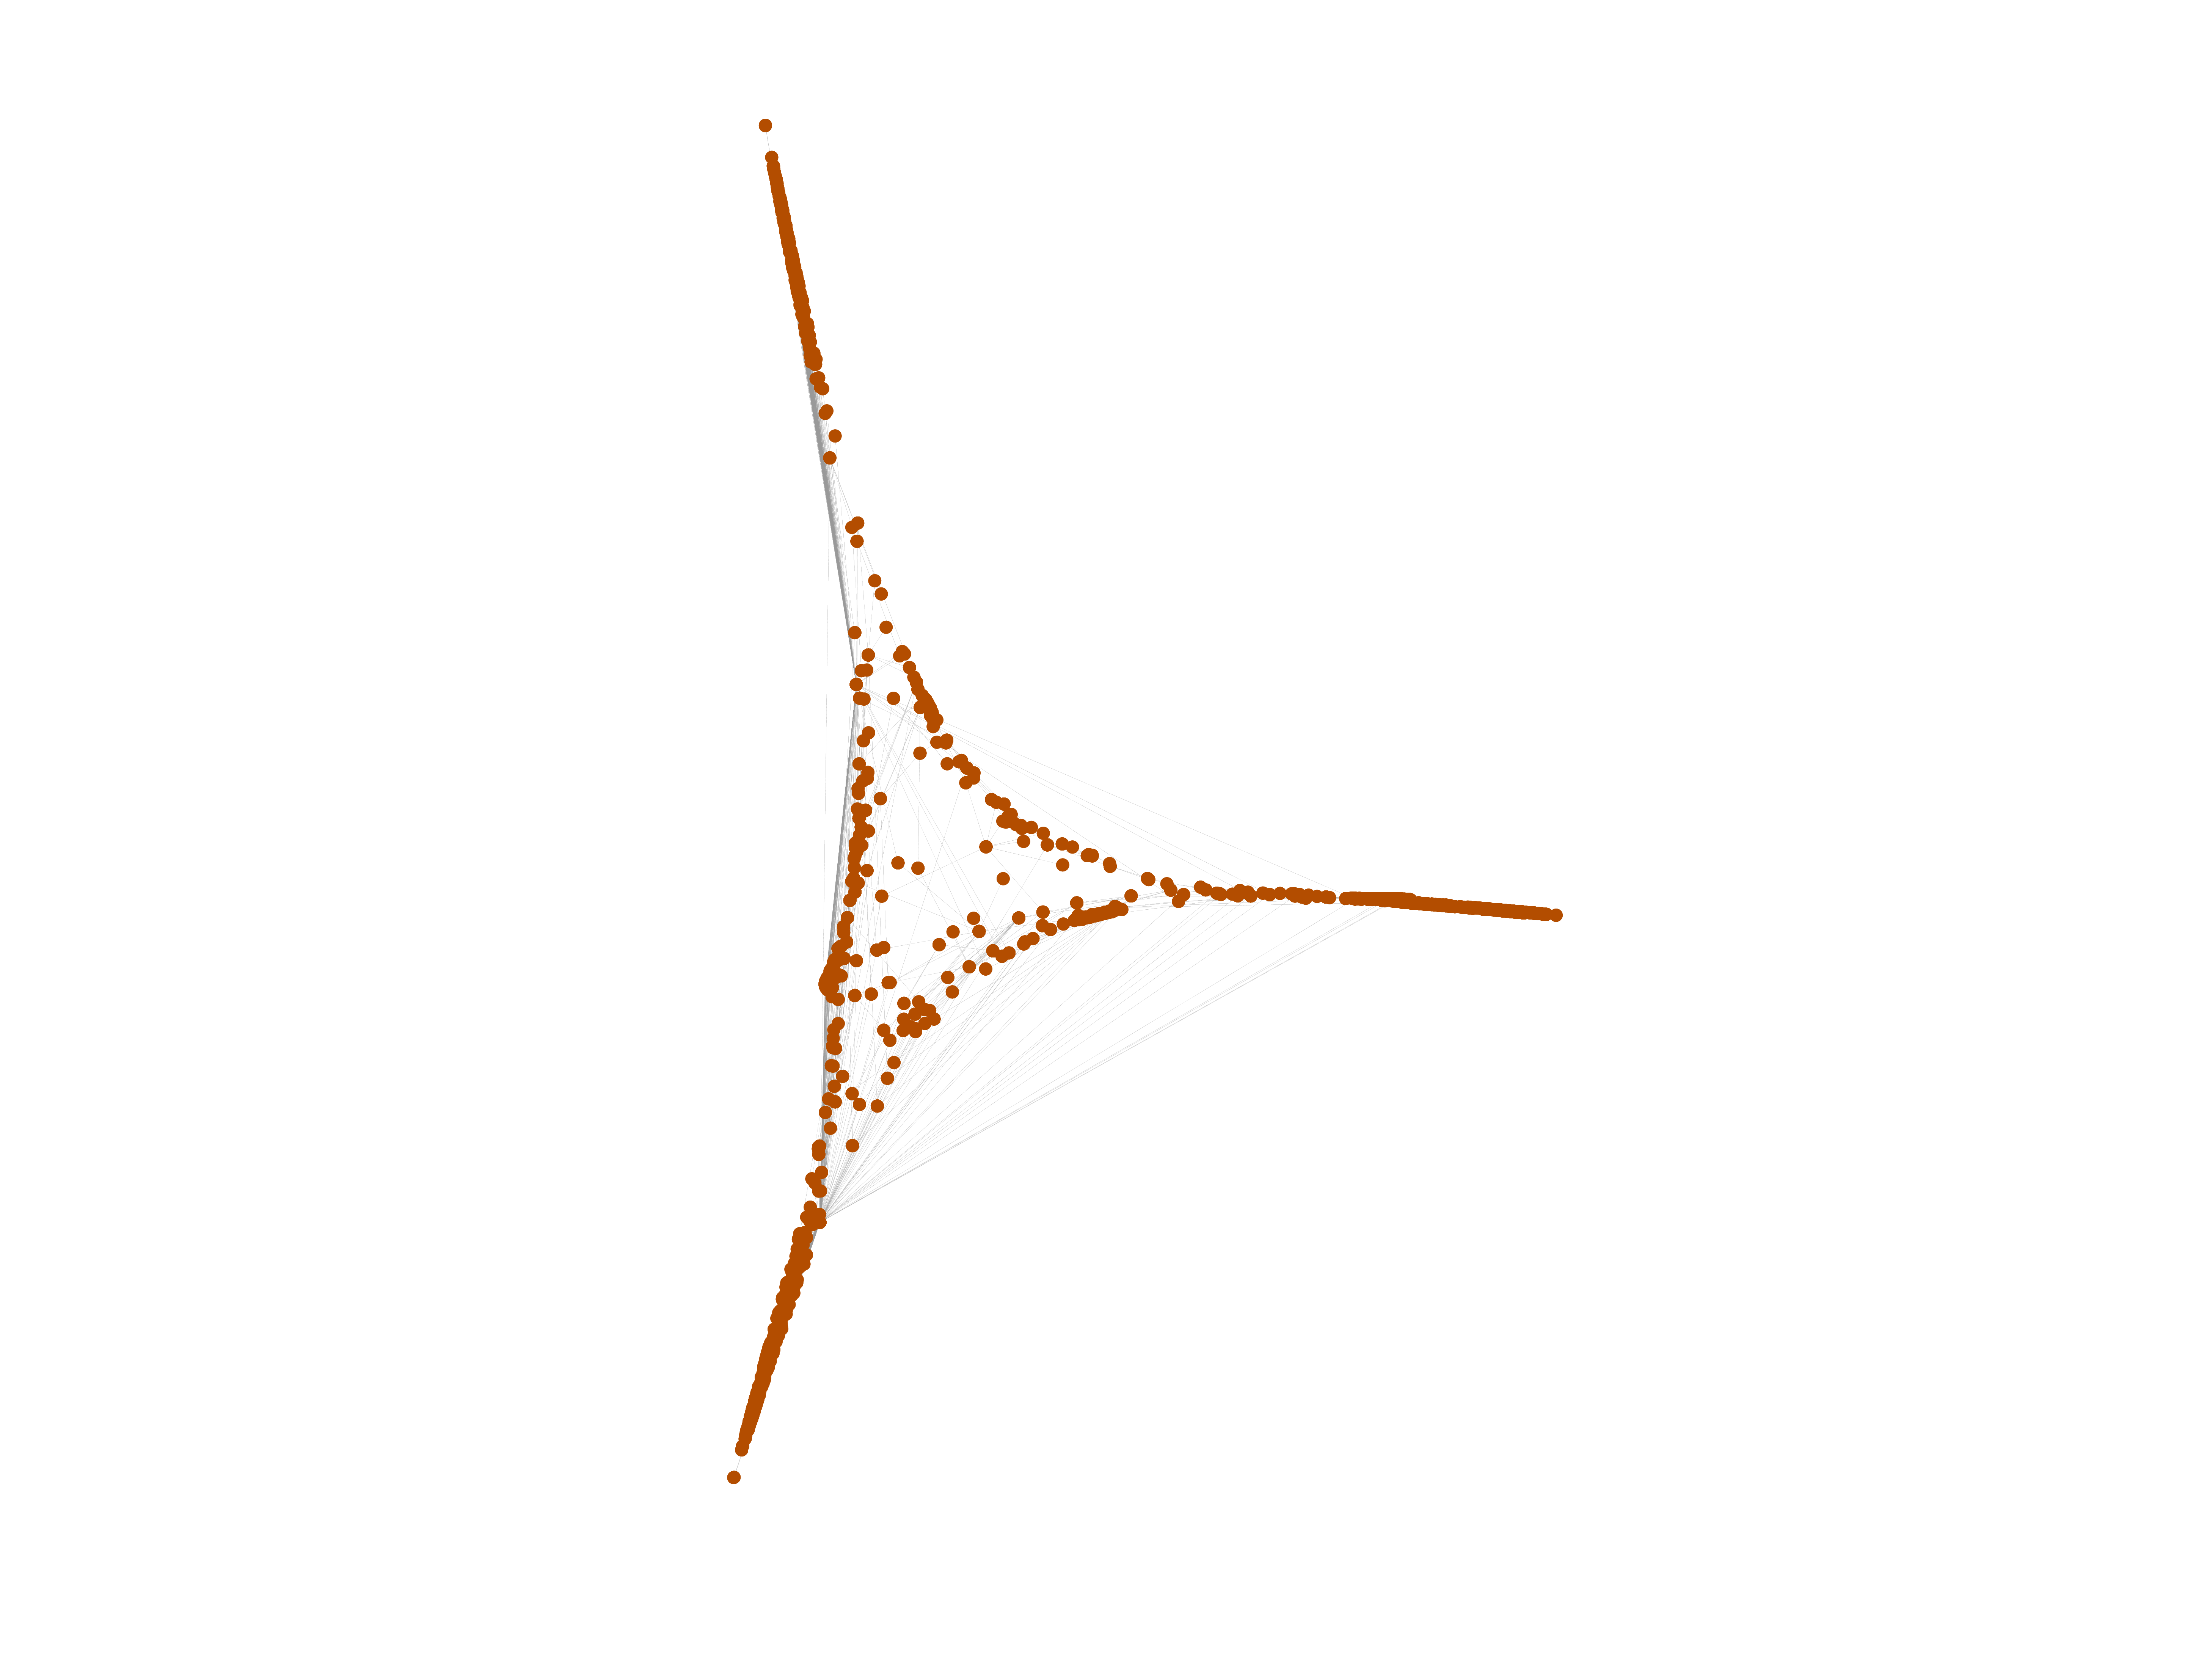
Wikibooks edits (tt)
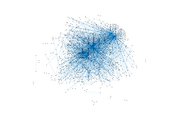
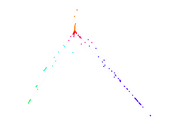
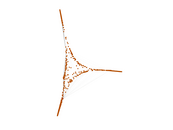
This is the bipartite edit network of the Tatar Wikibooks. It contains users
and pages from the Tatar Wikibooks, connected by edit events. Each edge
represents an edit. The dataset includes the timestamp of each edit.
Metadata
Statistics
| Size | n = | 1,671
|
| Left size | n1 = | 178
|
| Right size | n2 = | 1,493
|
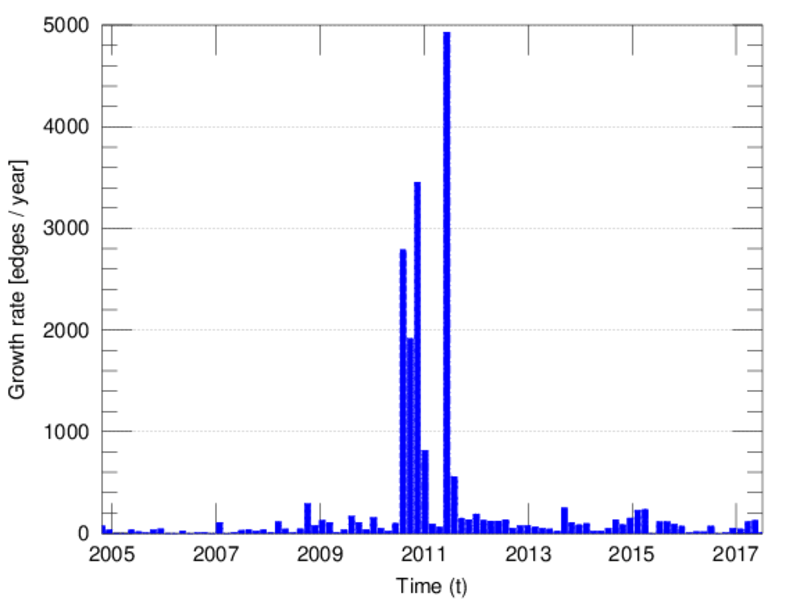
| Volume | m = | 2,861
|
| Unique edge count | m̿ = | 1,921
|
| Wedge count | s = | 203,822
|
| Claw count | z = | 21,808,444
|
| Cross count | x = | 1,944,560,379
|
| Square count | q = | 20,276
|
| 4-Tour count | T4 = | 981,366
|
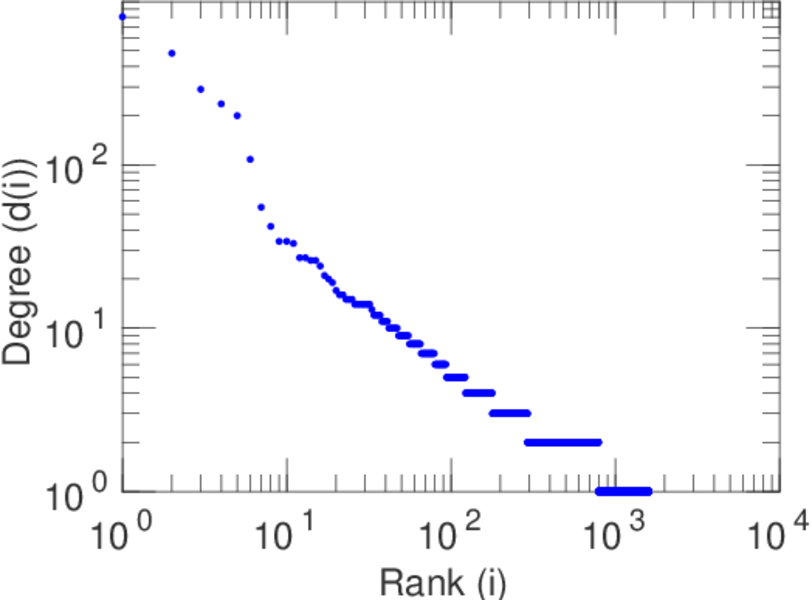
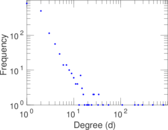
| Maximum degree | dmax = | 807
|
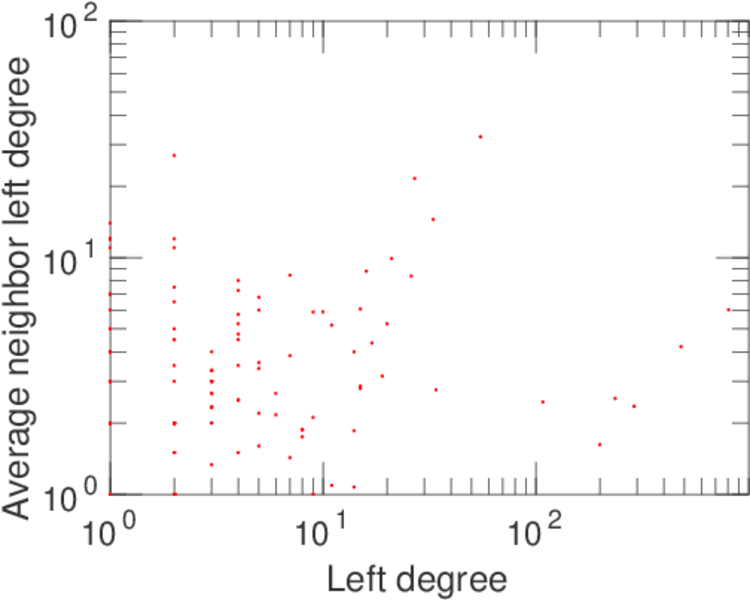
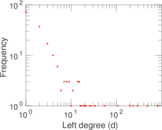
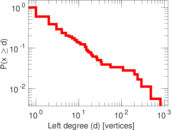
| Maximum left degree | d1max = | 807
|
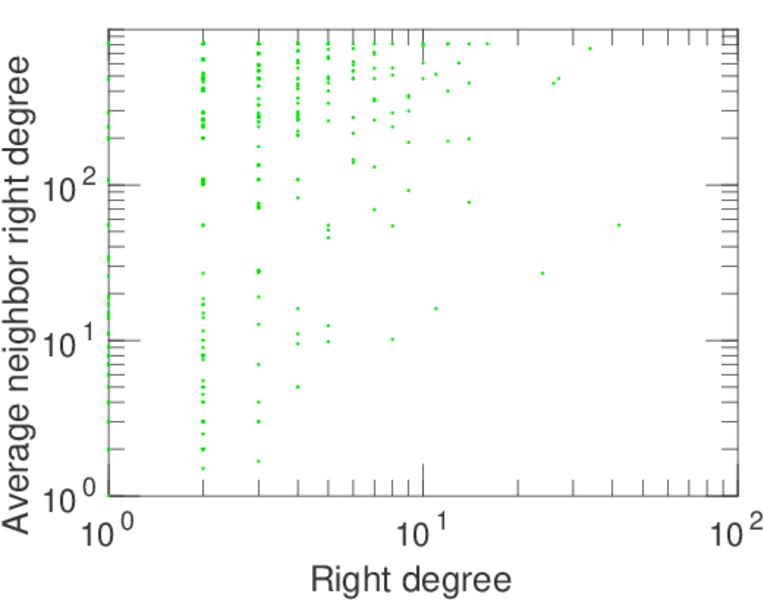
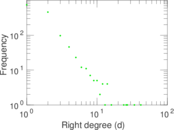
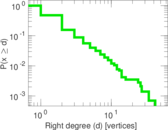
| Maximum right degree | d2max = | 42
|
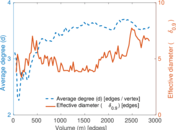
| Average degree | d = | 3.424 30
|
| Average left degree | d1 = | 16.073 0
|
| Average right degree | d2 = | 1.916 28
|
| Fill | p = | 0.007 228 49
|
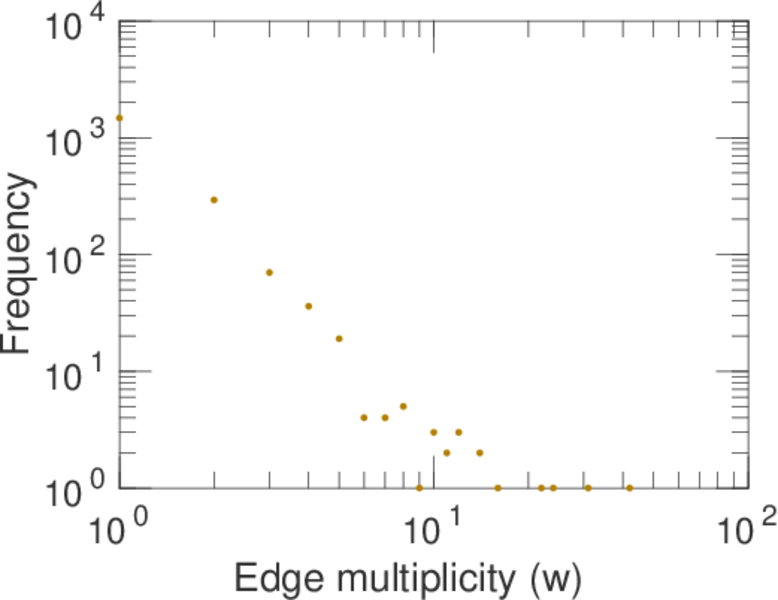
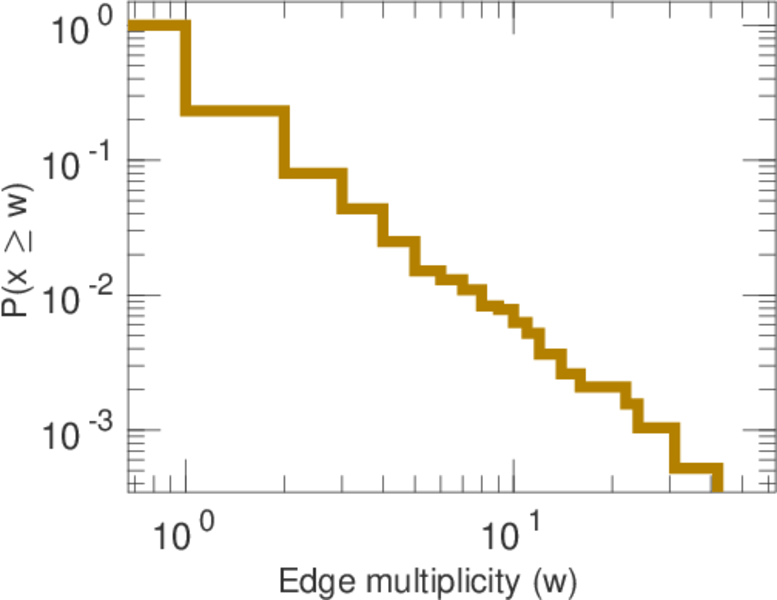
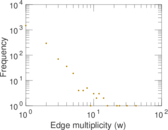
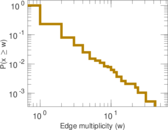
| Average edge multiplicity | m̃ = | 1.489 33
|
| Size of LCC | N = | 1,391
|
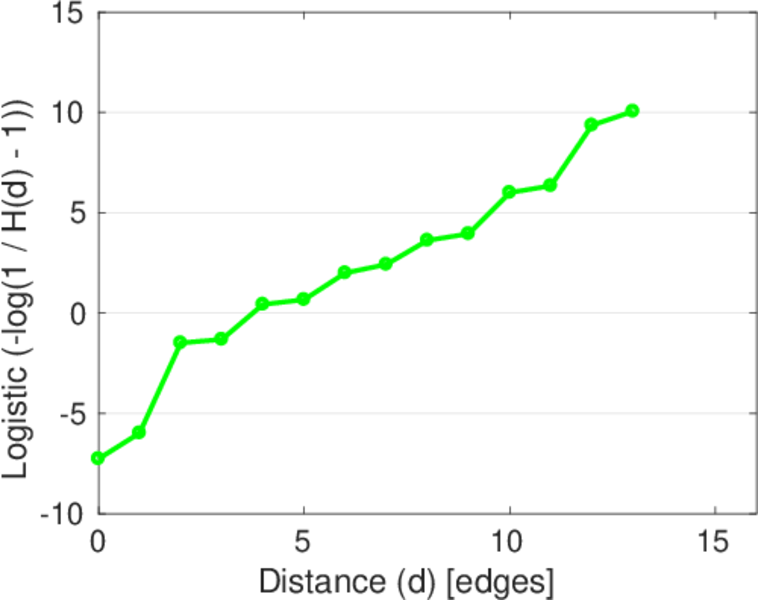
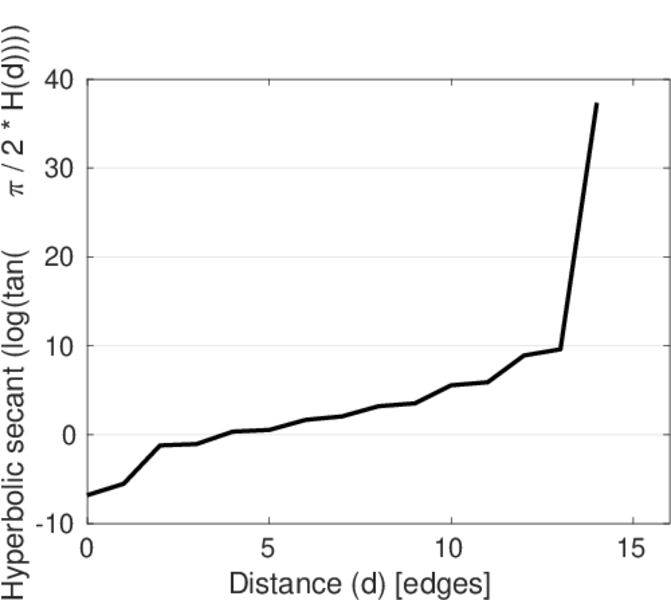
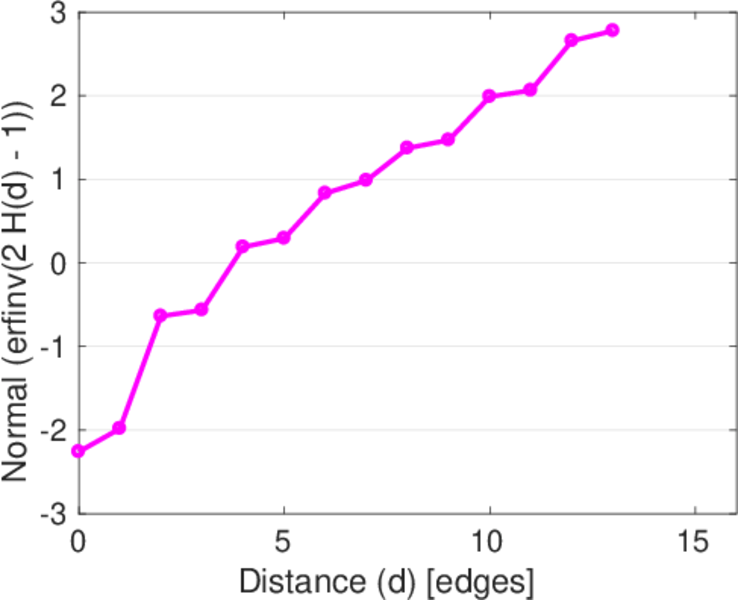
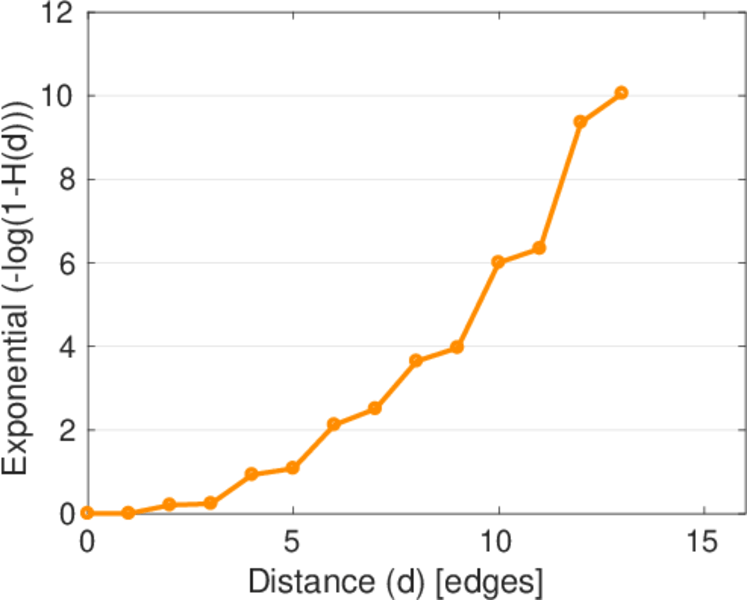
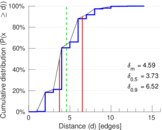
| Diameter | δ = | 14
|
| 50-Percentile effective diameter | δ0.5 = | 3.732 08
|
| 90-Percentile effective diameter | δ0.9 = | 6.516 36
|
| Median distance | δM = | 4
|
| Mean distance | δm = | 4.586 32
|
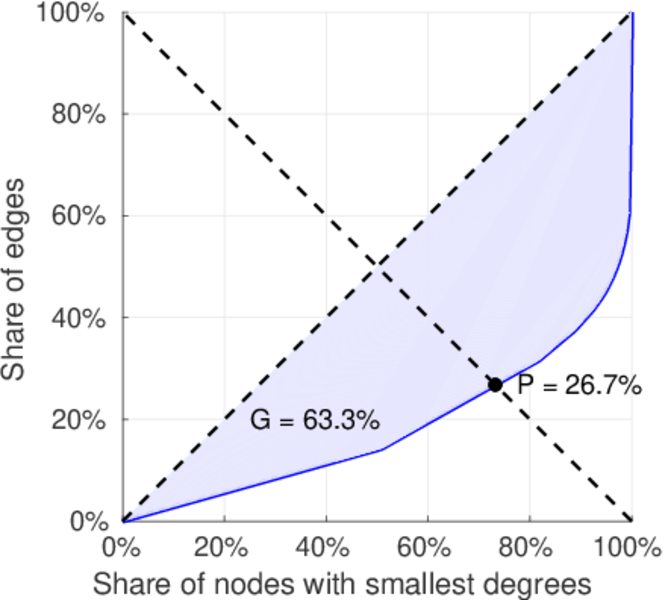
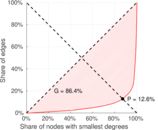
| Gini coefficient | G = | 0.645 767
|
| Balanced inequality ratio | P = | 0.259 874
|
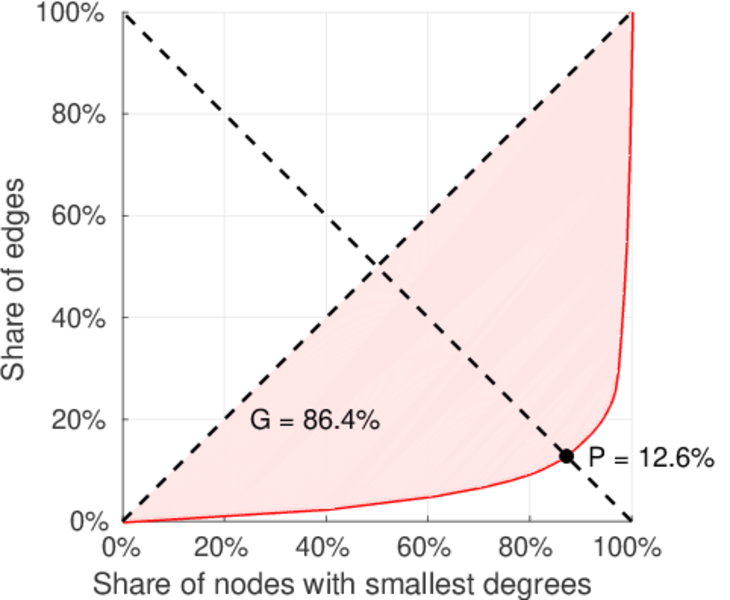
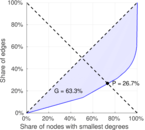
| Left balanced inequality ratio | P1 = | 0.126 180
|
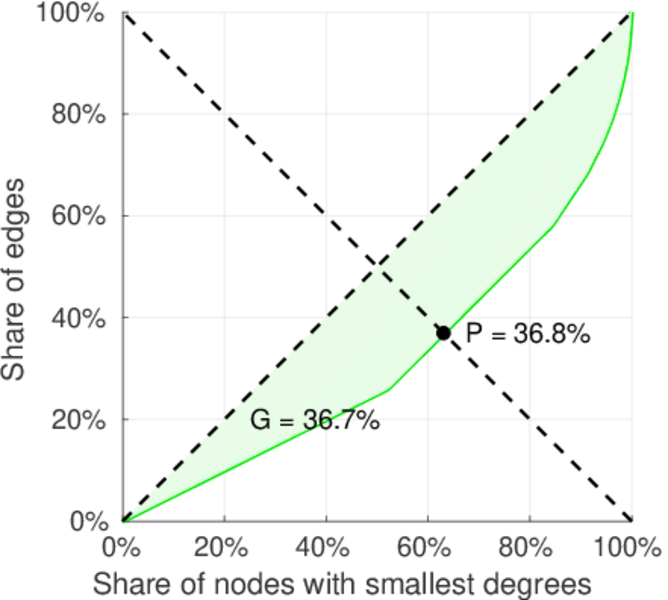
| Right balanced inequality ratio | P2 = | 0.368 053
|
| Relative edge distribution entropy | Her = | 0.785 942
|
| Power law exponent | γ = | 4.491 31
|
| Tail power law exponent | γt = | 2.511 00
|
| Tail power law exponent with p | γ3 = | 2.511 00
|
| p-value | p = | 0.000 00
|
| Left tail power law exponent with p | γ3,1 = | 1.791 00
|
| Left p-value | p1 = | 0.123 000
|
| Right tail power law exponent with p | γ3,2 = | 5.351 00
|
| Right p-value | p2 = | 0.048 000 0
|
| Degree assortativity | ρ = | −0.167 158
|
| Degree assortativity p-value | pρ = | 1.661 14 × 10−13
|
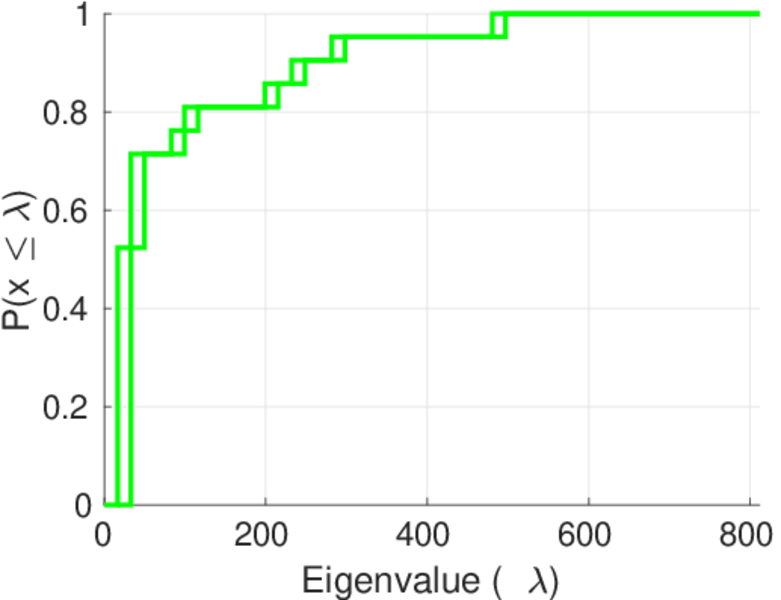
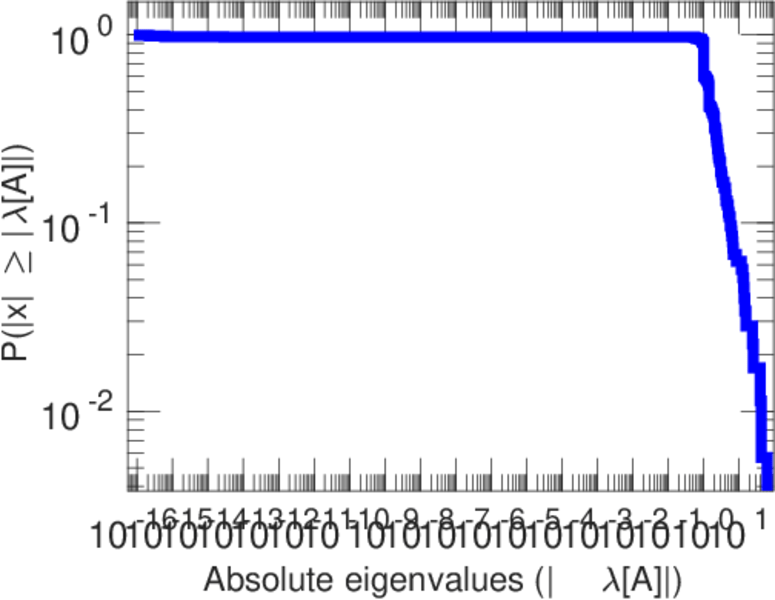
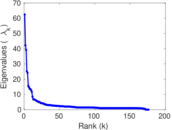
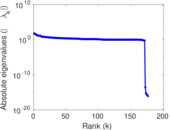
| Spectral norm | α = | 62.440 1
|
| Algebraic connectivity | a = | 0.012 672 7
|
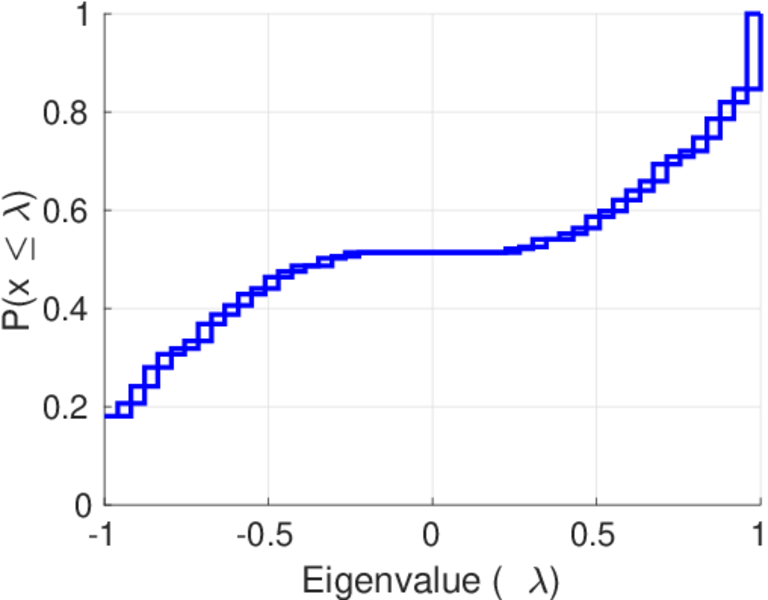
| Spectral separation | |λ1[A] / λ2[A]| = | 1.479 56
|
| Controllability | C = | 1,262
|
| Relative controllability | Cr = | 0.786 783
|
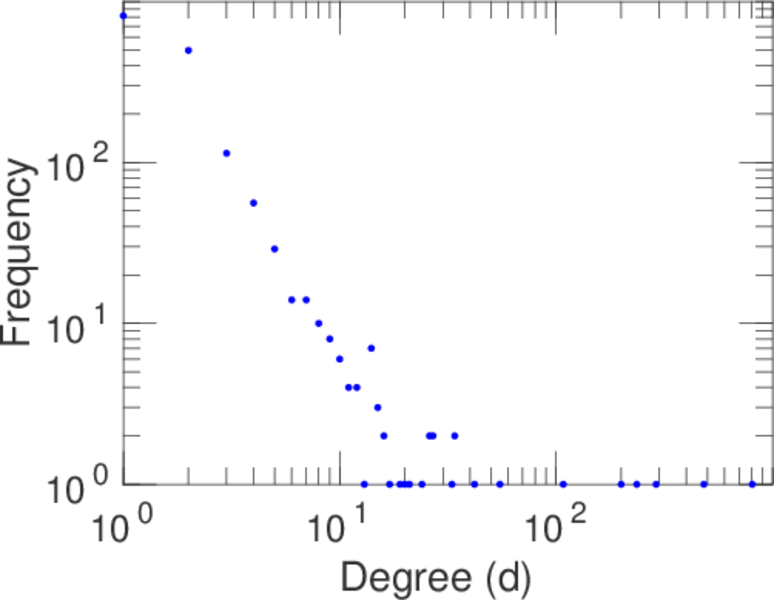
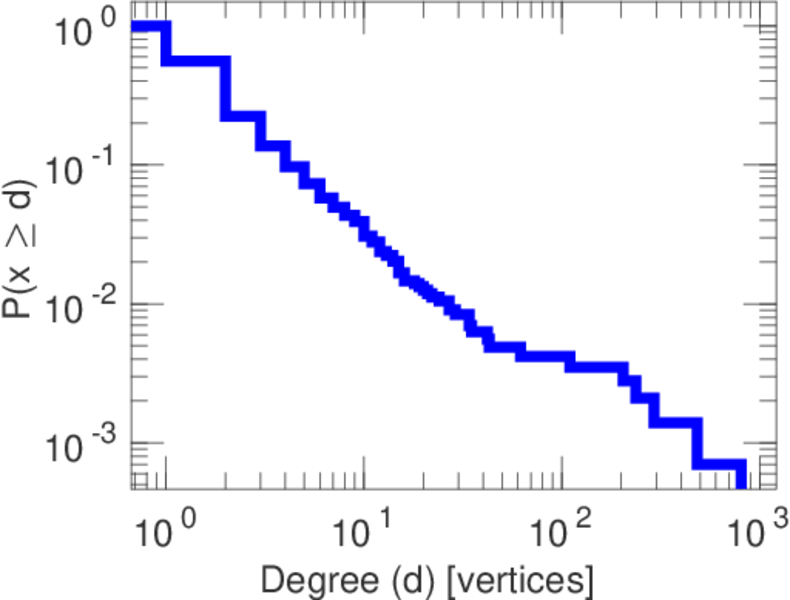
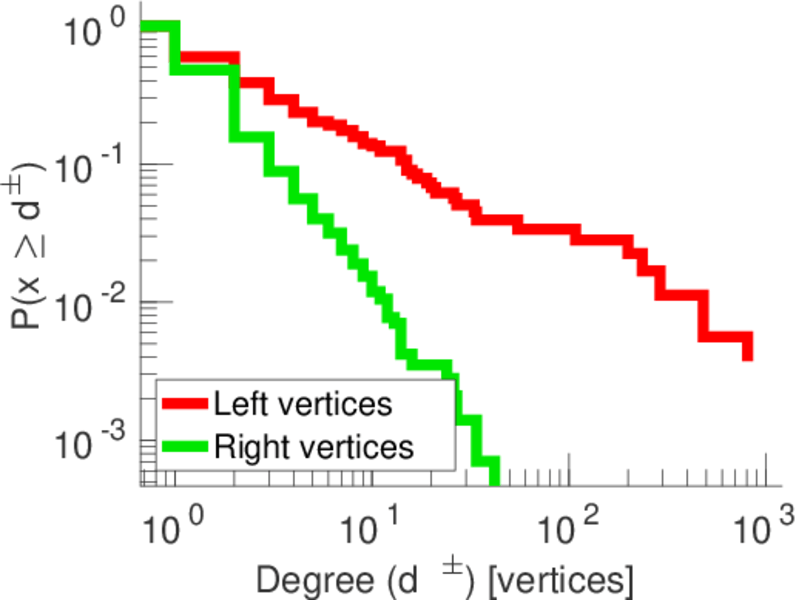
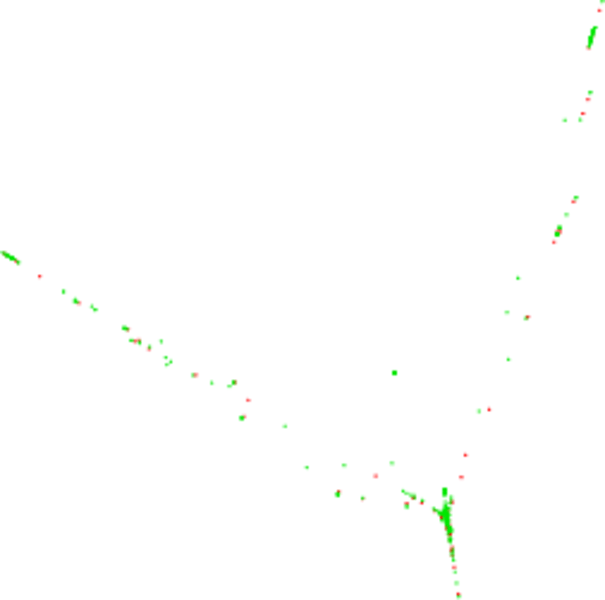
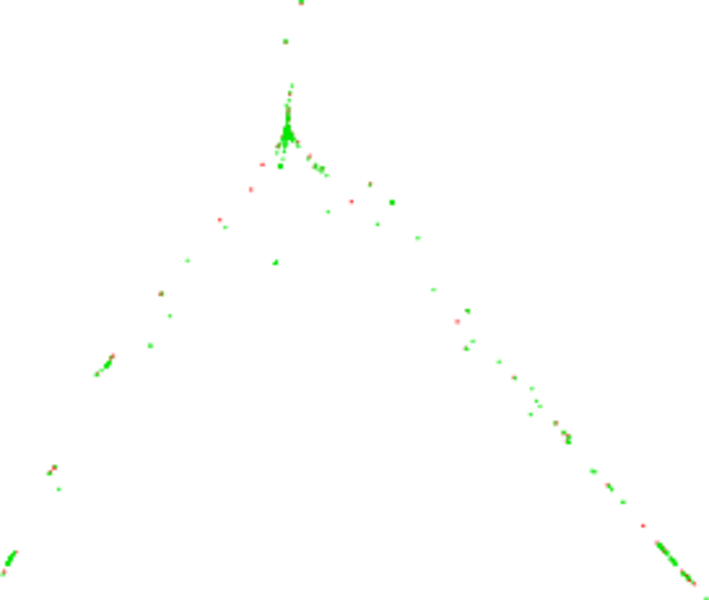
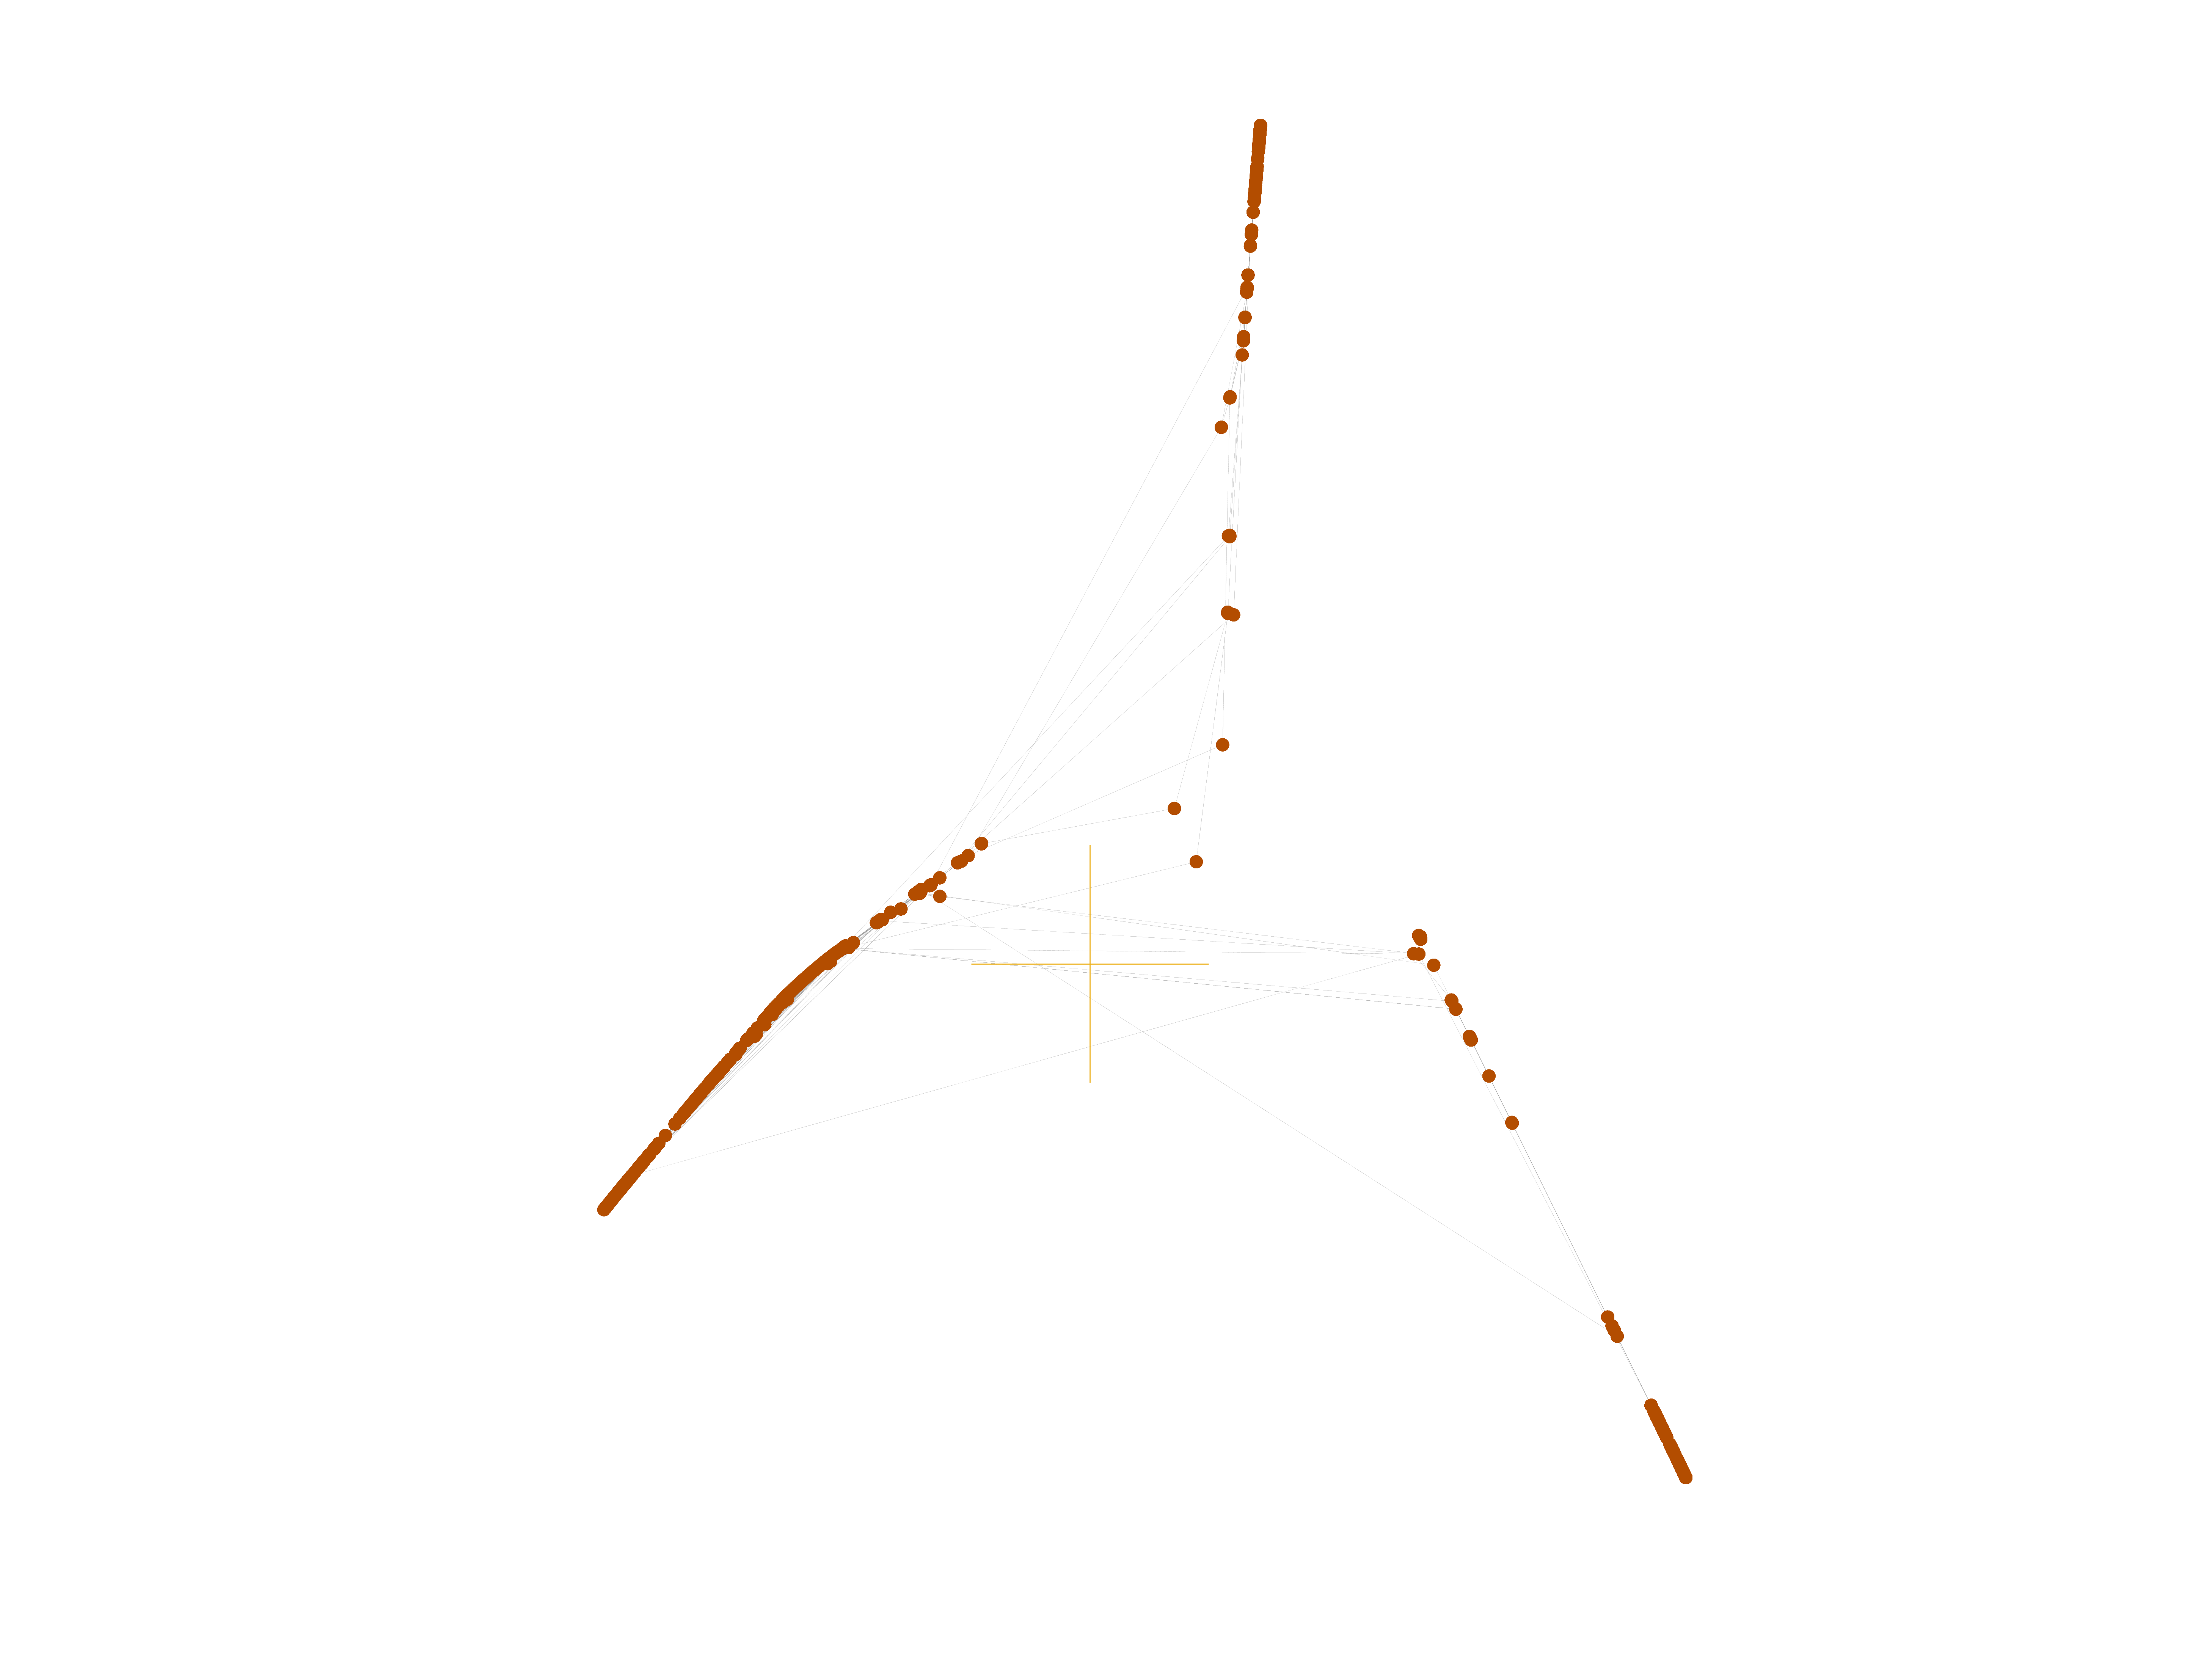
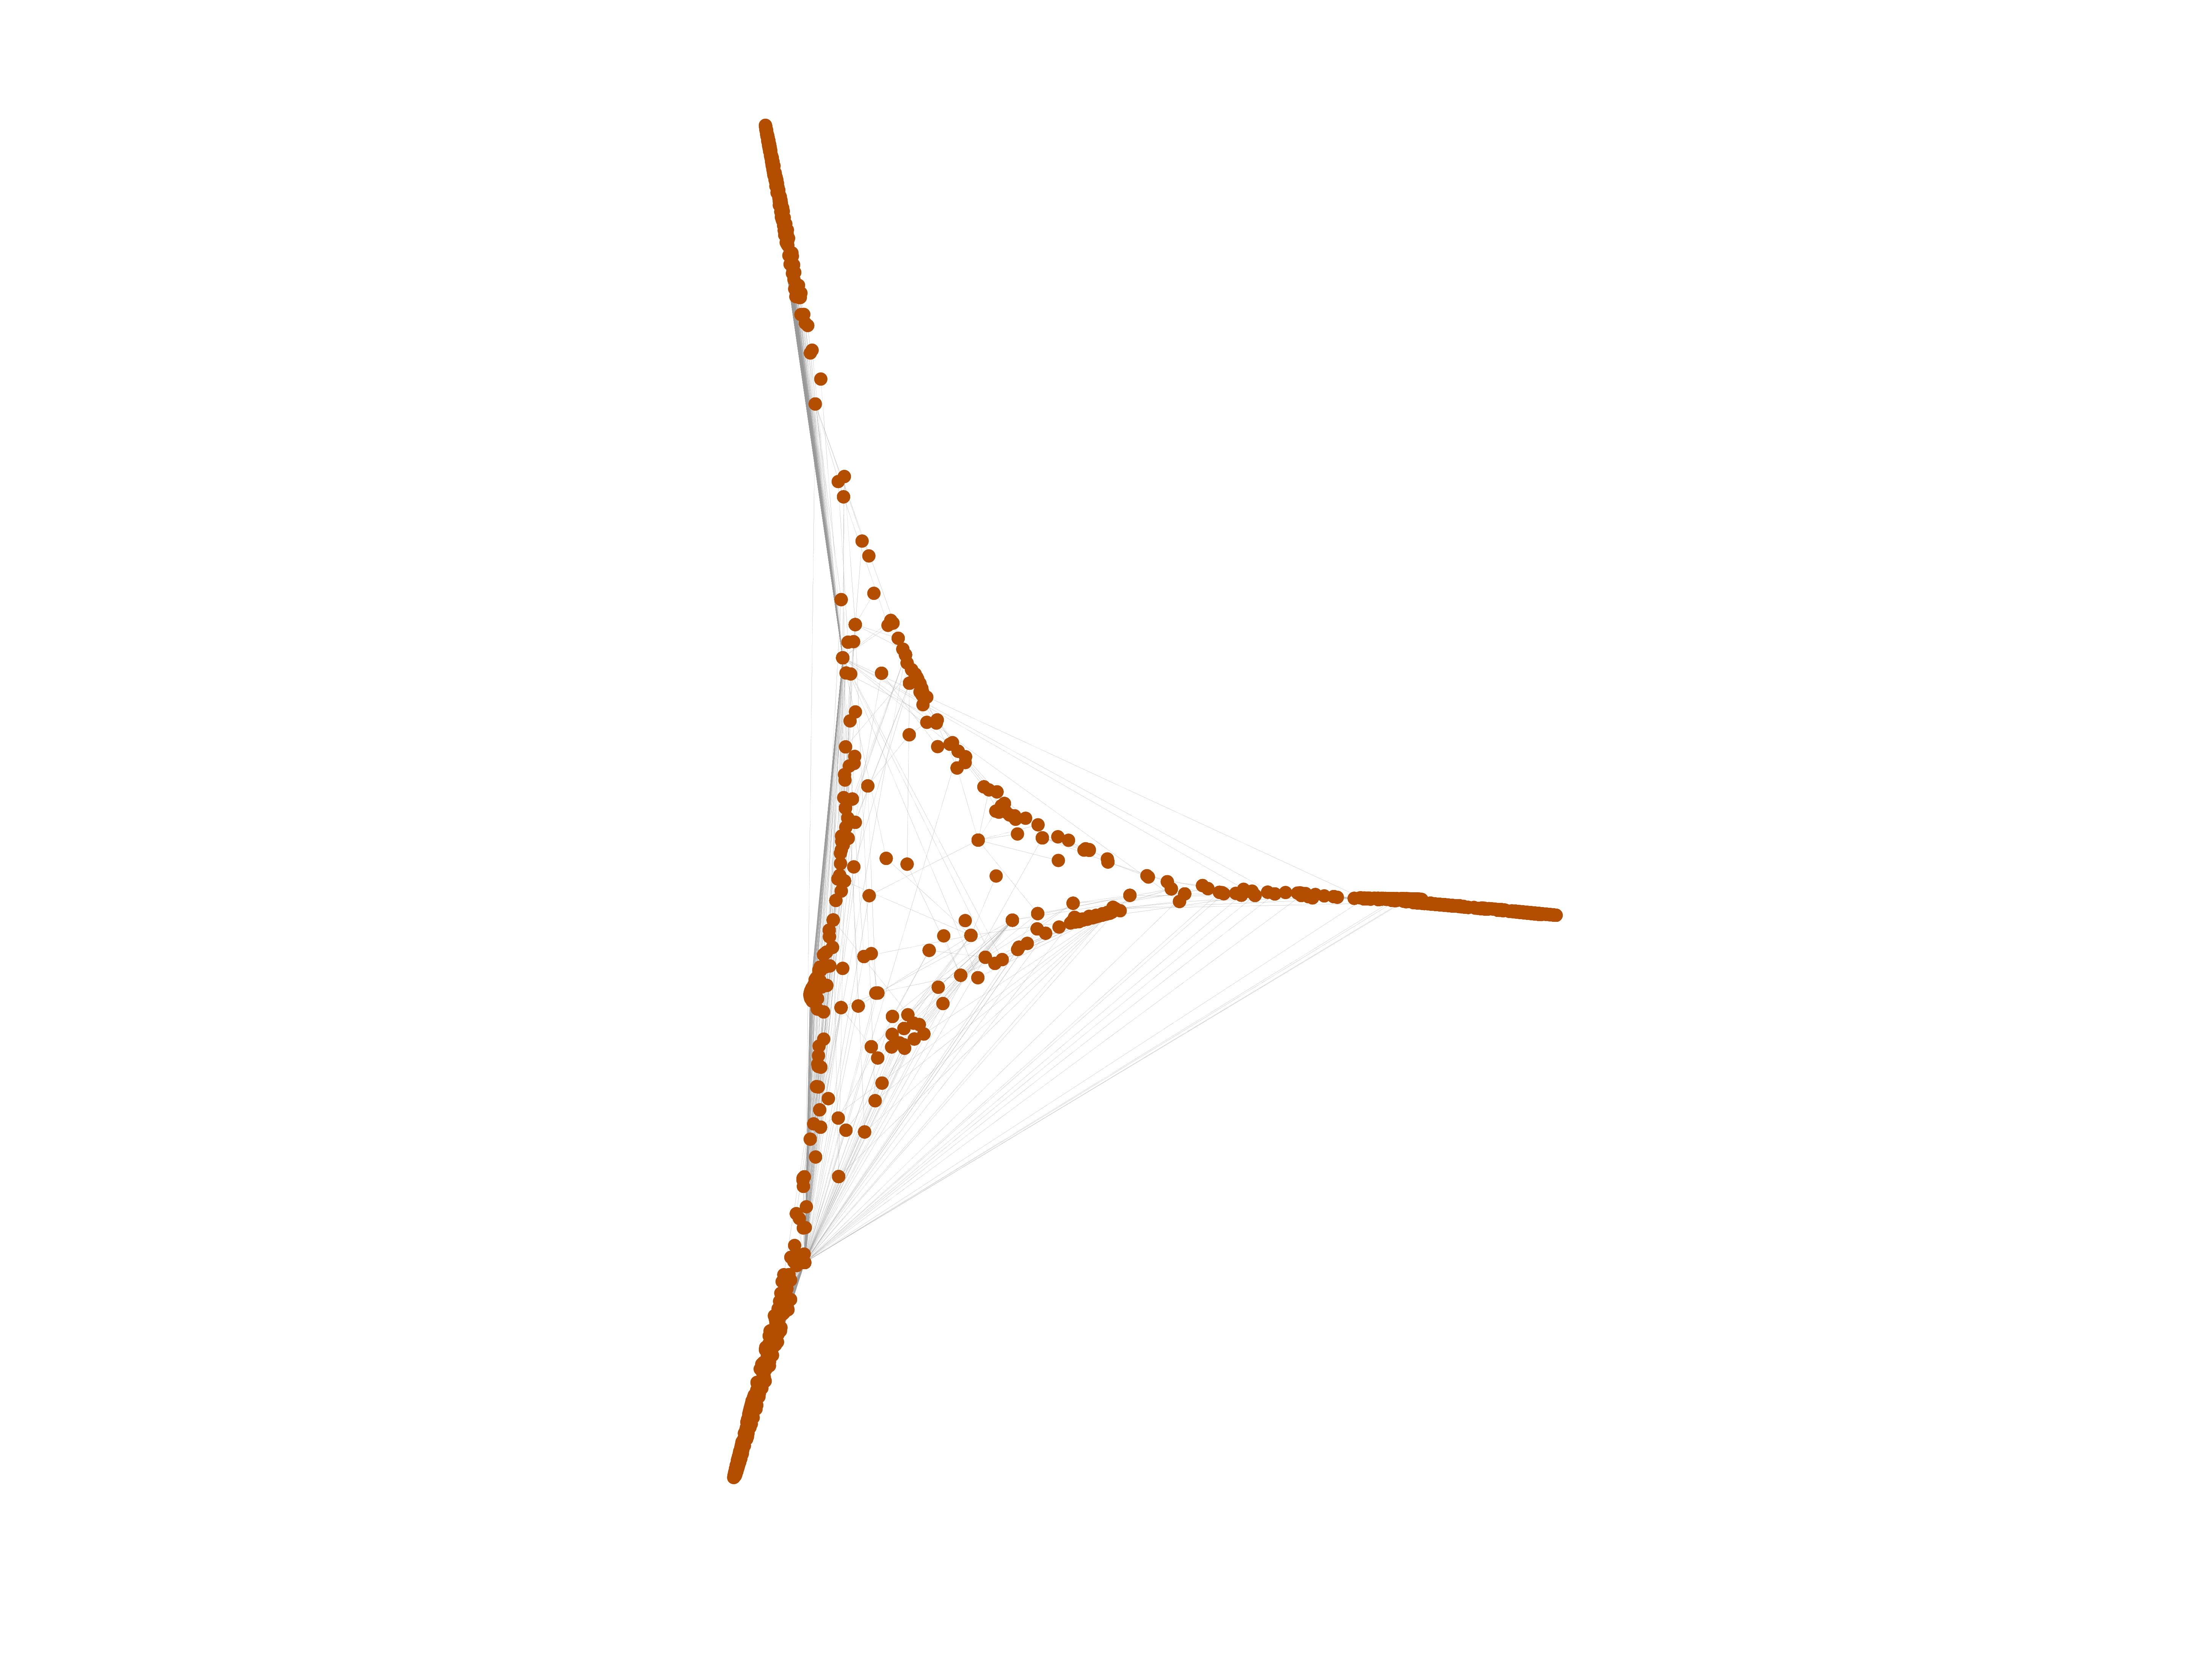
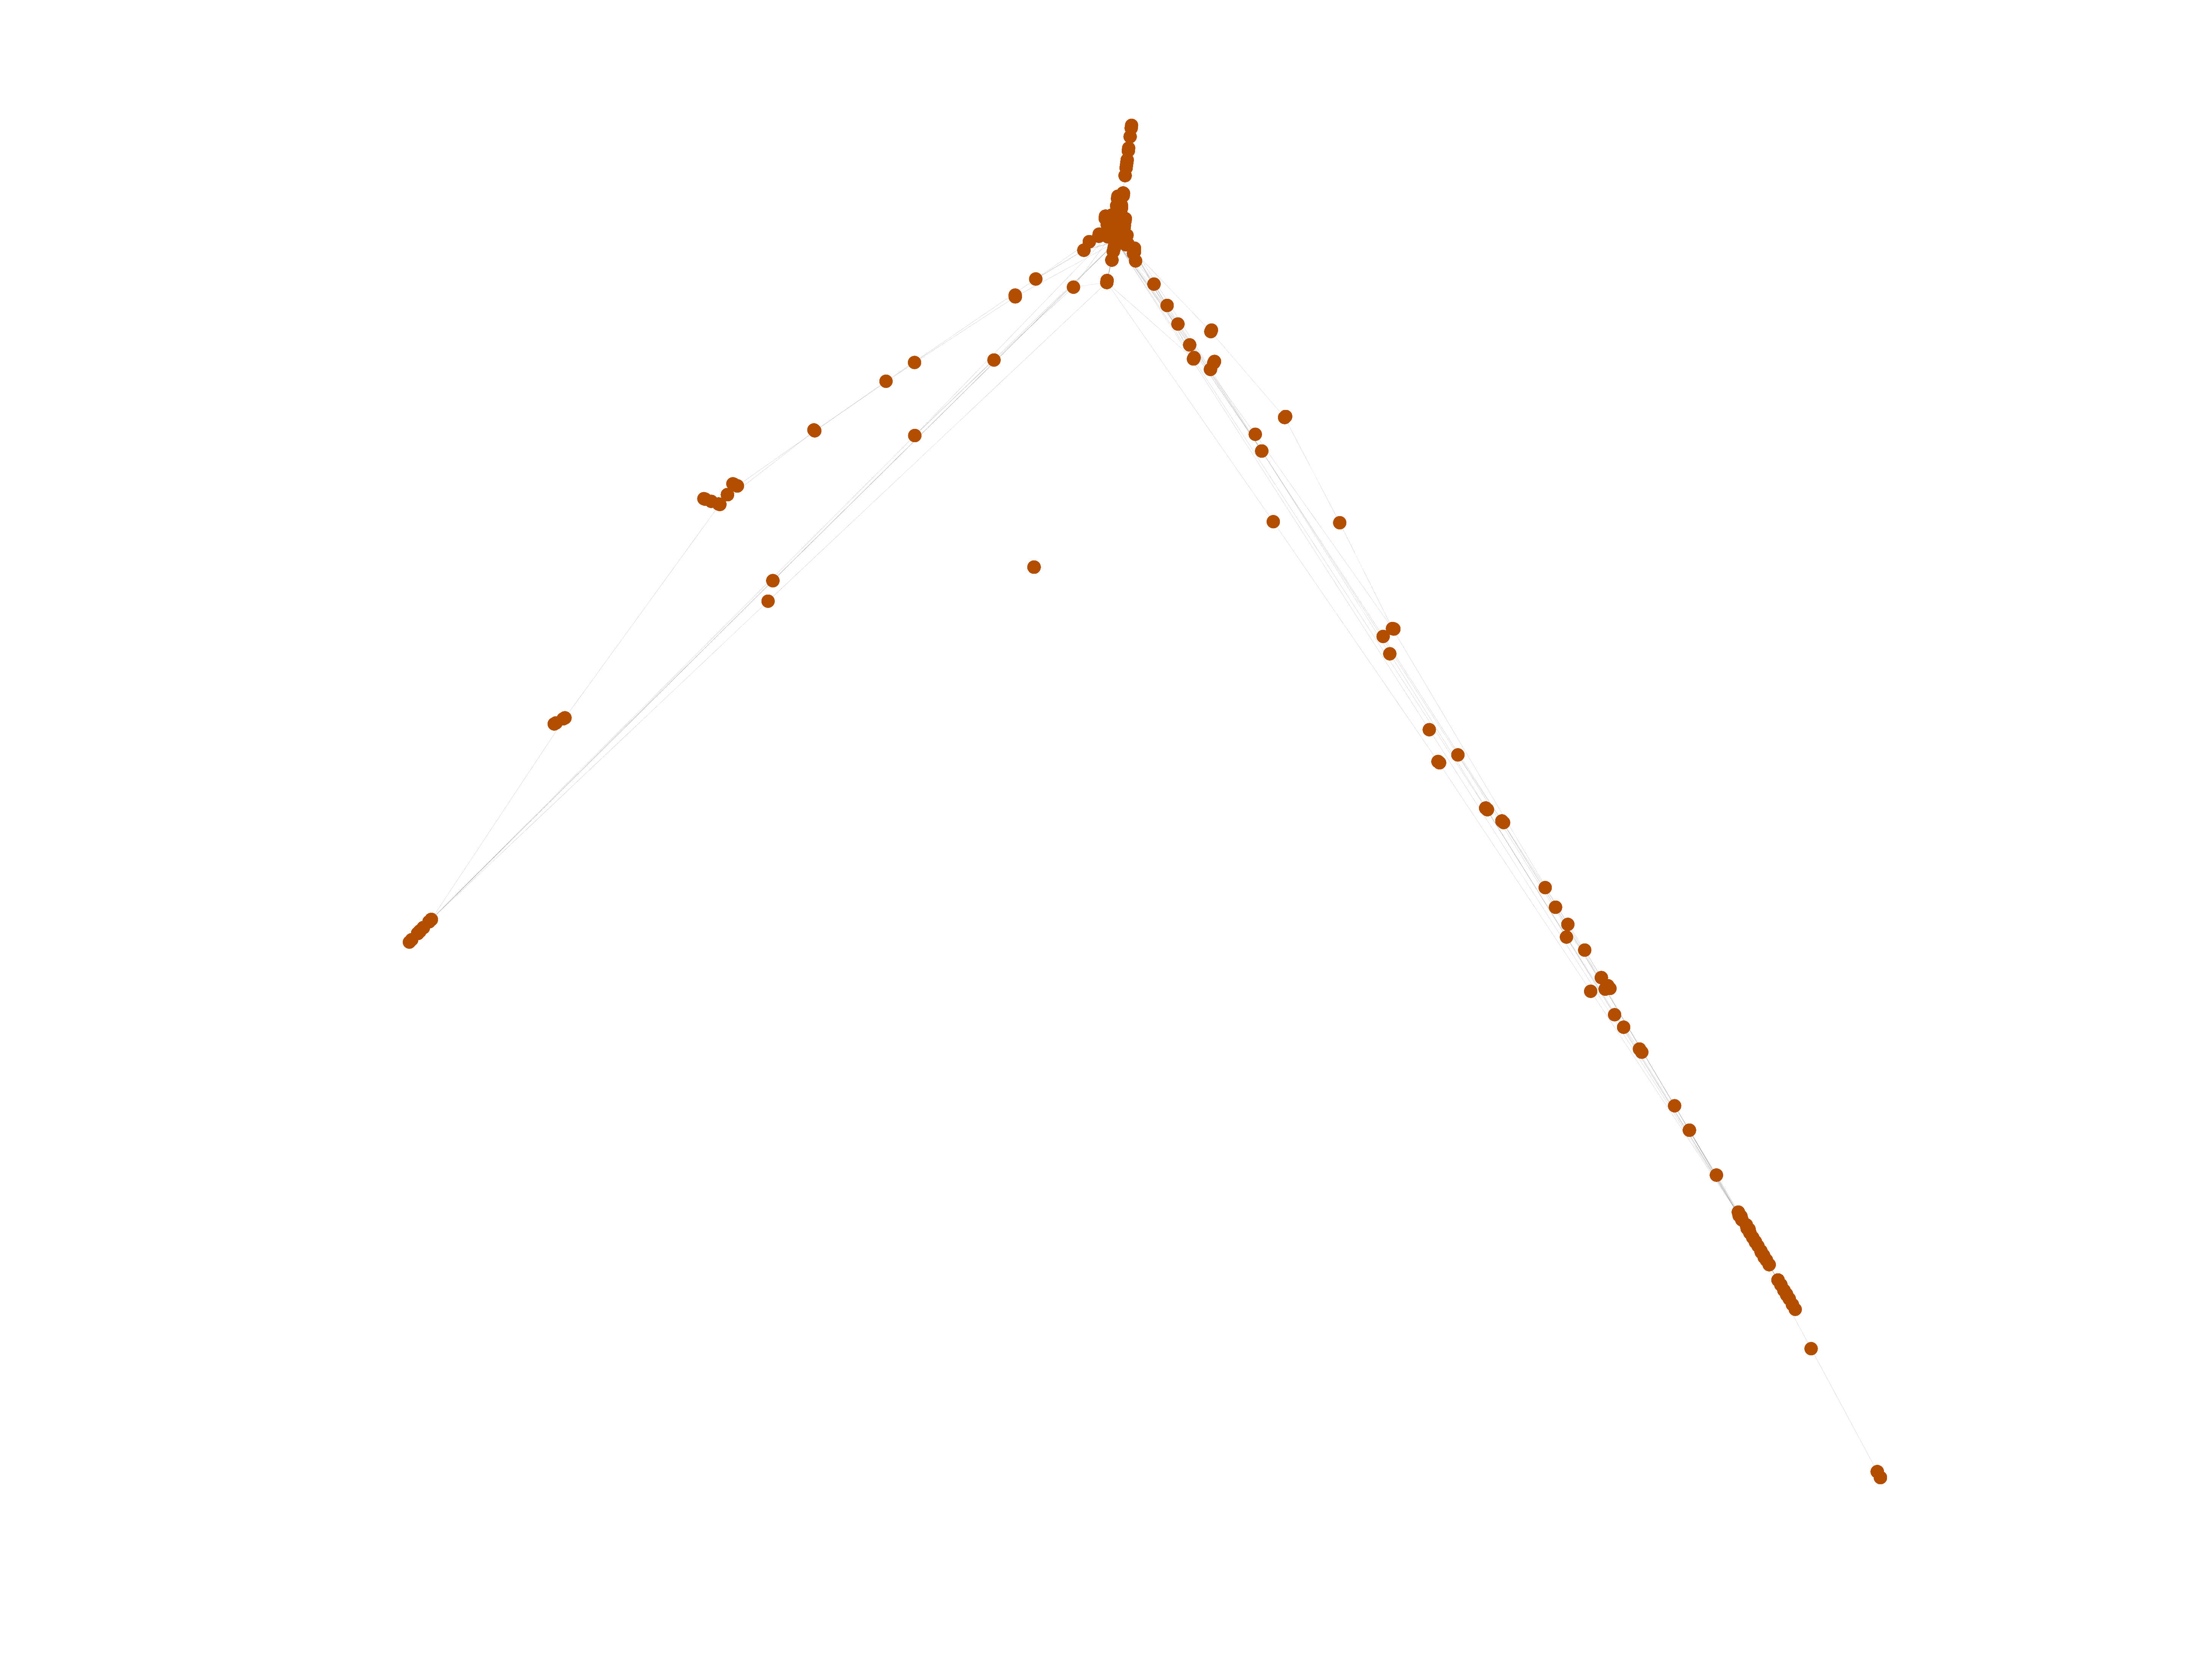
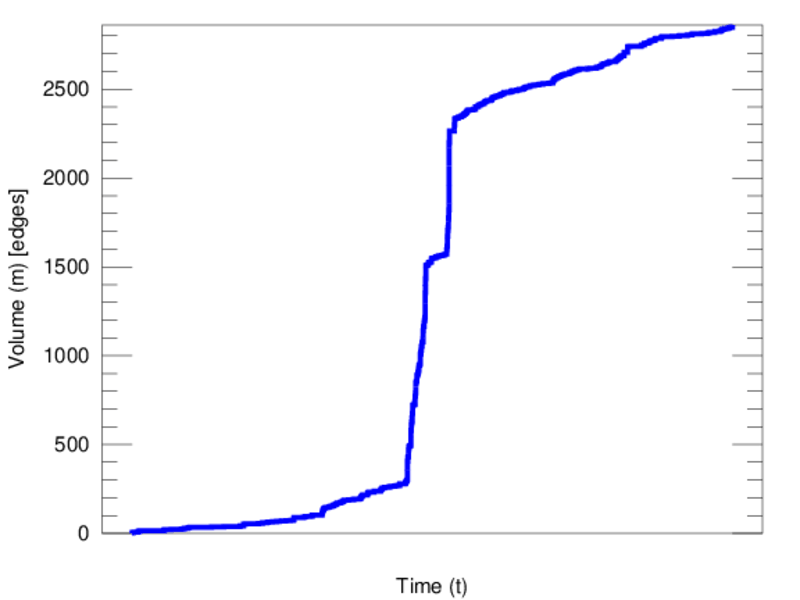
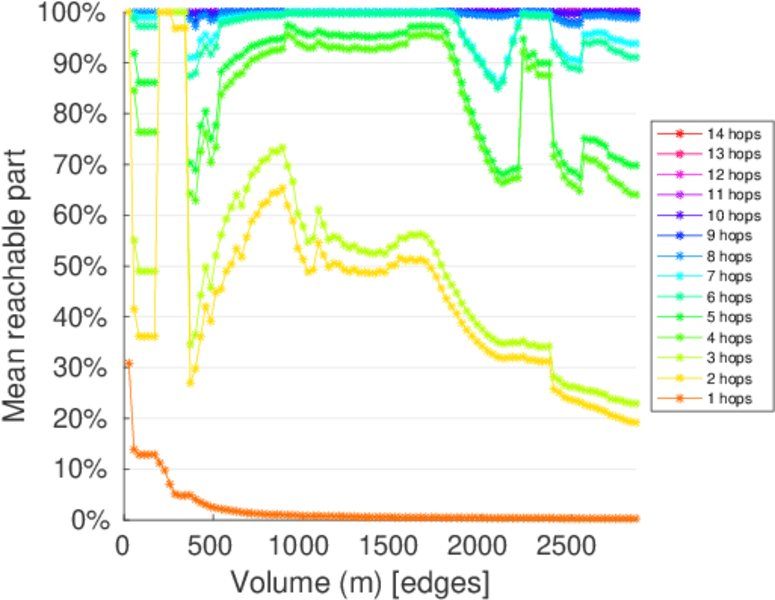
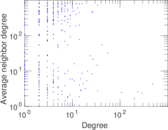
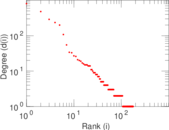
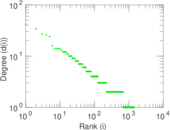
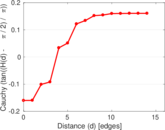
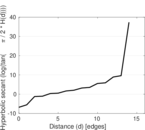
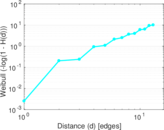
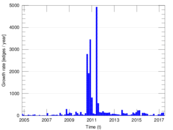
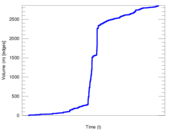
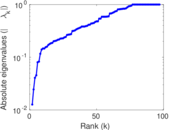
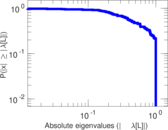
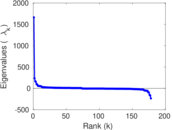
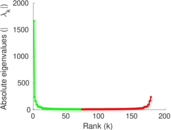
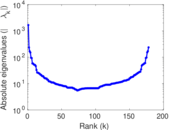
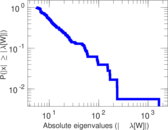
Plots


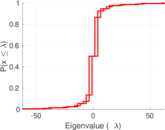
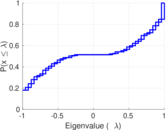
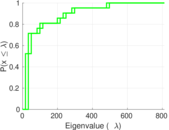


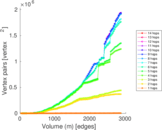
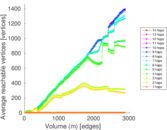

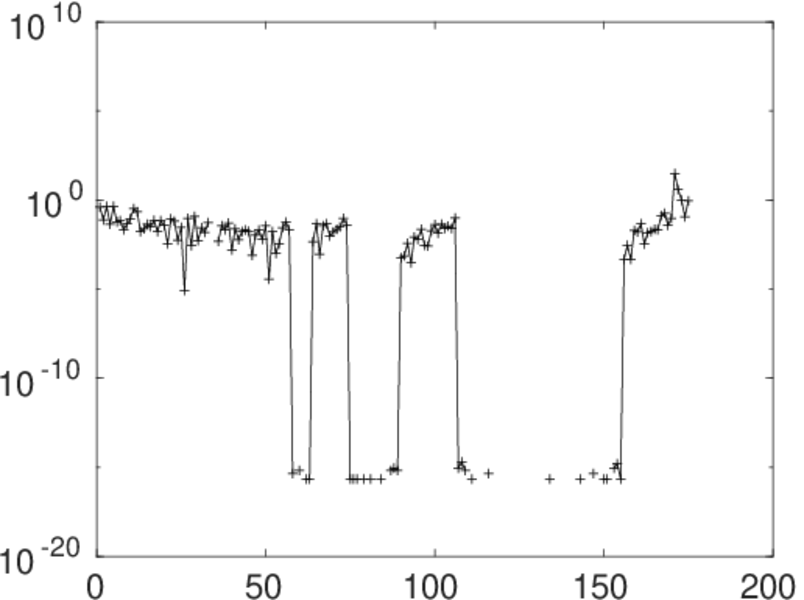
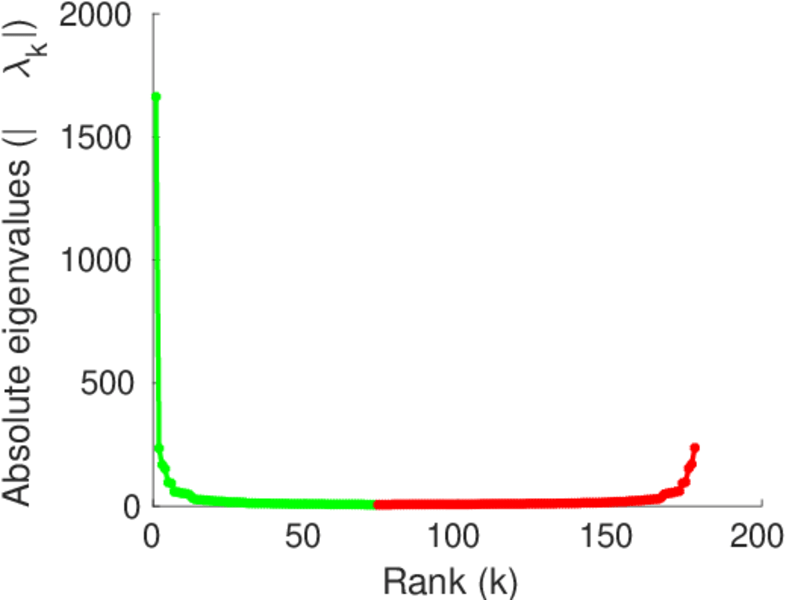
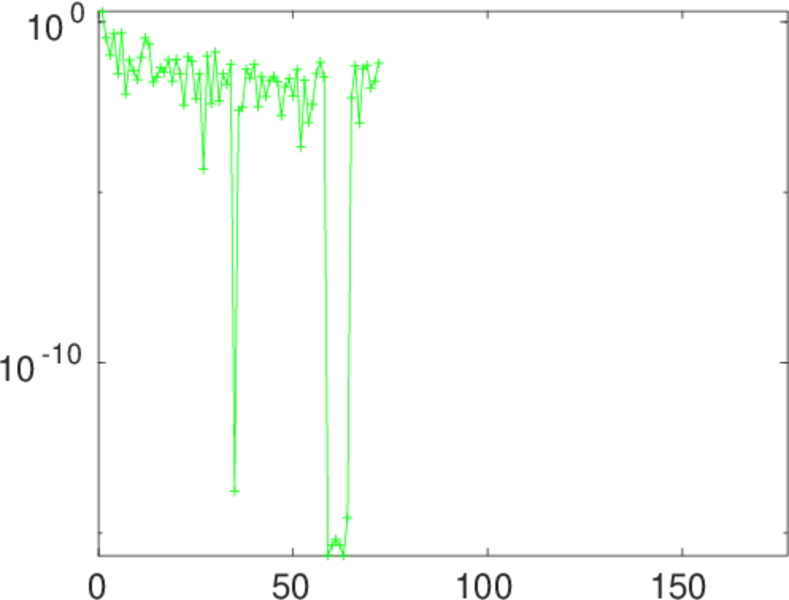
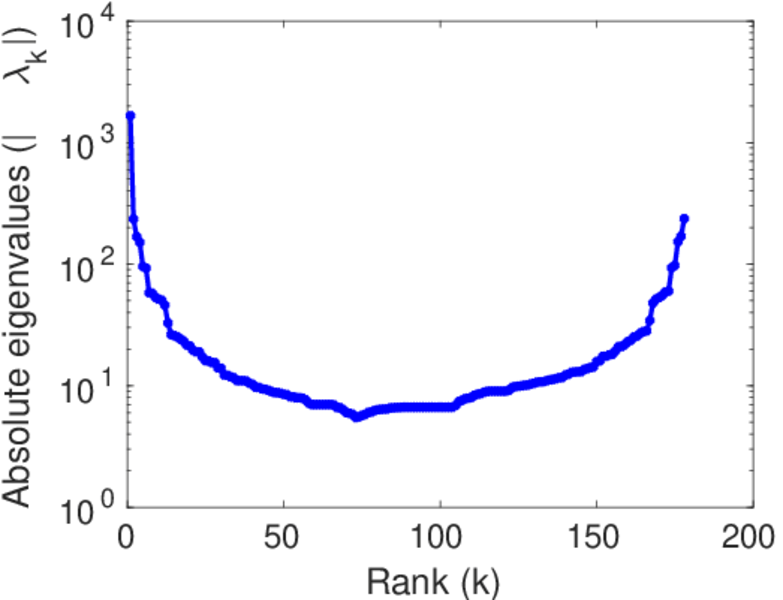
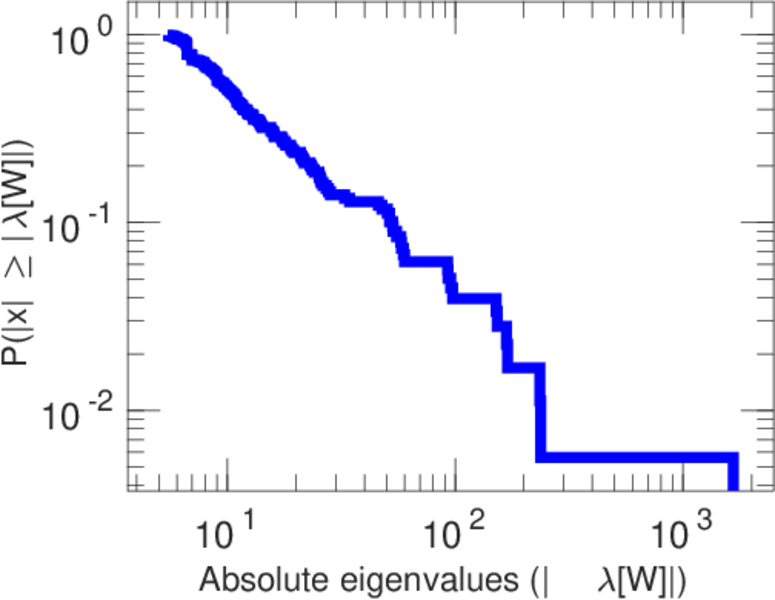
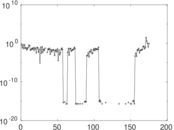
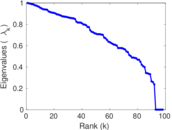
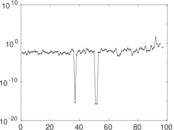
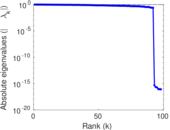
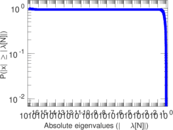
Matrix decompositions plots


Downloads
References
|
[1]
|
Jérôme Kunegis.
KONECT – The Koblenz Network Collection.
In Proc. Int. Conf. on World Wide Web Companion, pages
1343–1350, 2013.
[ http ]
|
|
[2]
|
Wikimedia Foundation.
Wikimedia downloads.
http://dumps.wikimedia.org/, January 2010.
|
 KONECT ‣ Networks ‣
Buy Me a Coffee
KONECT ‣ Networks ‣
Buy Me a Coffee