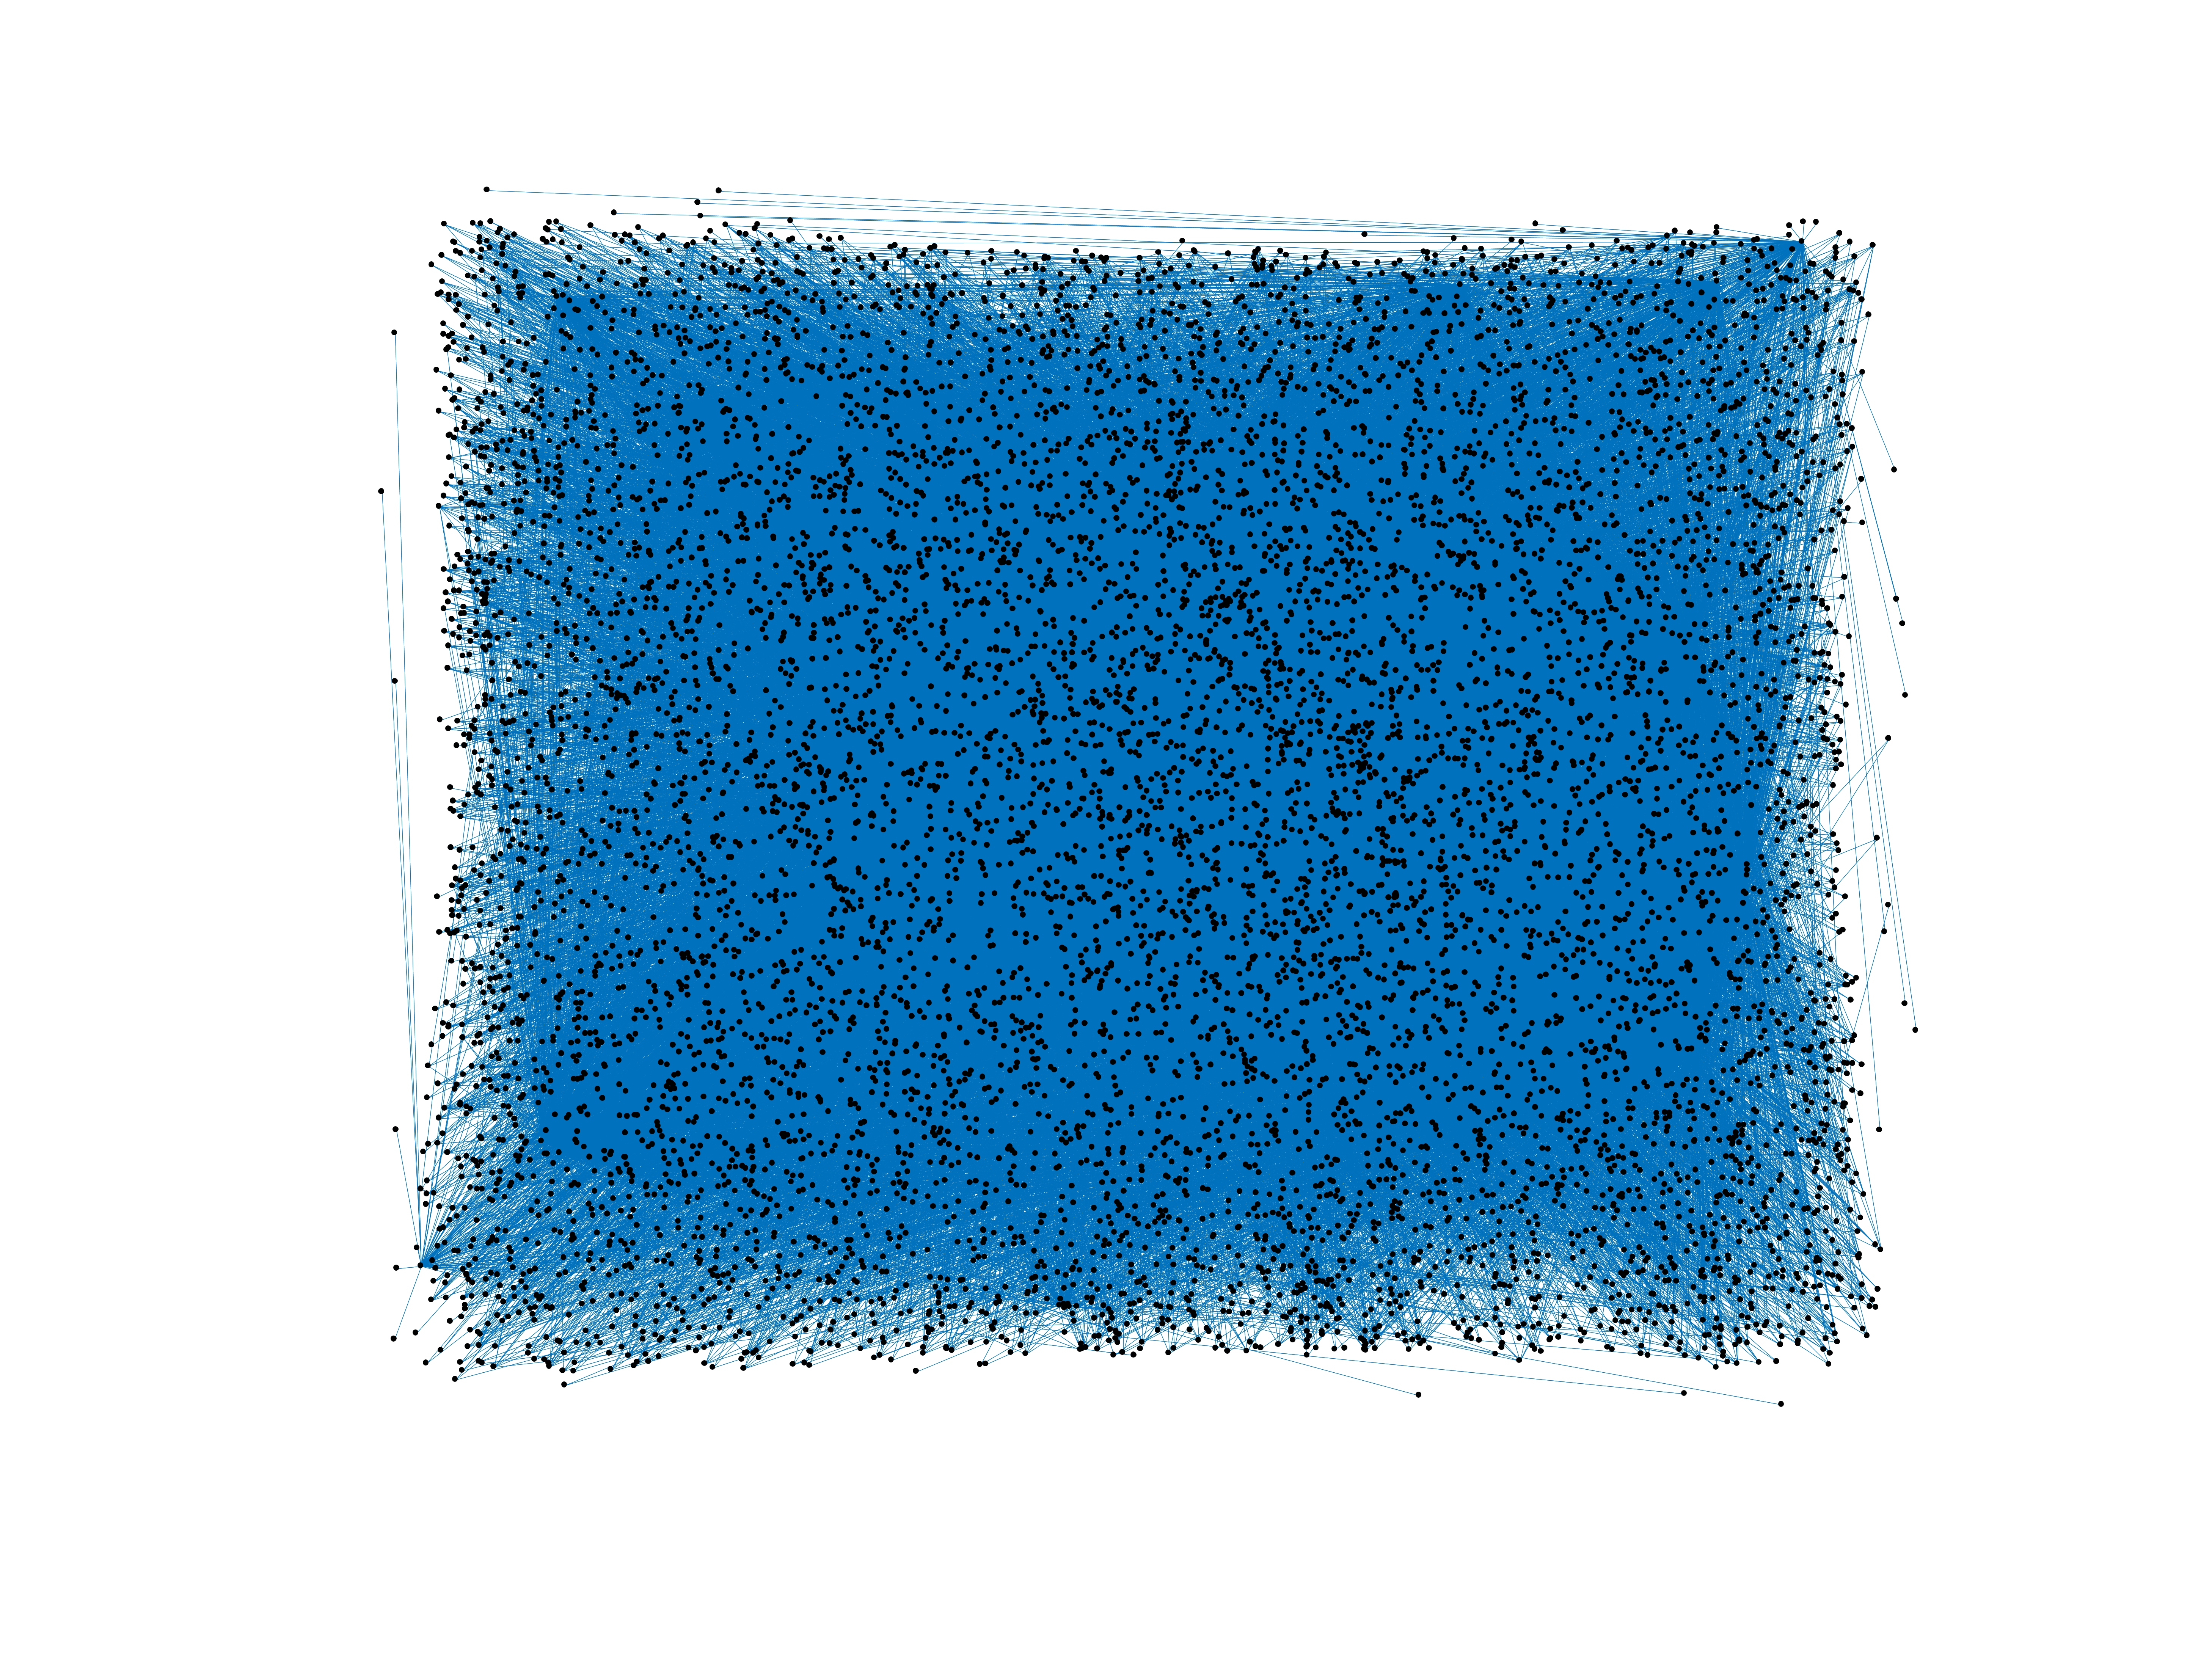
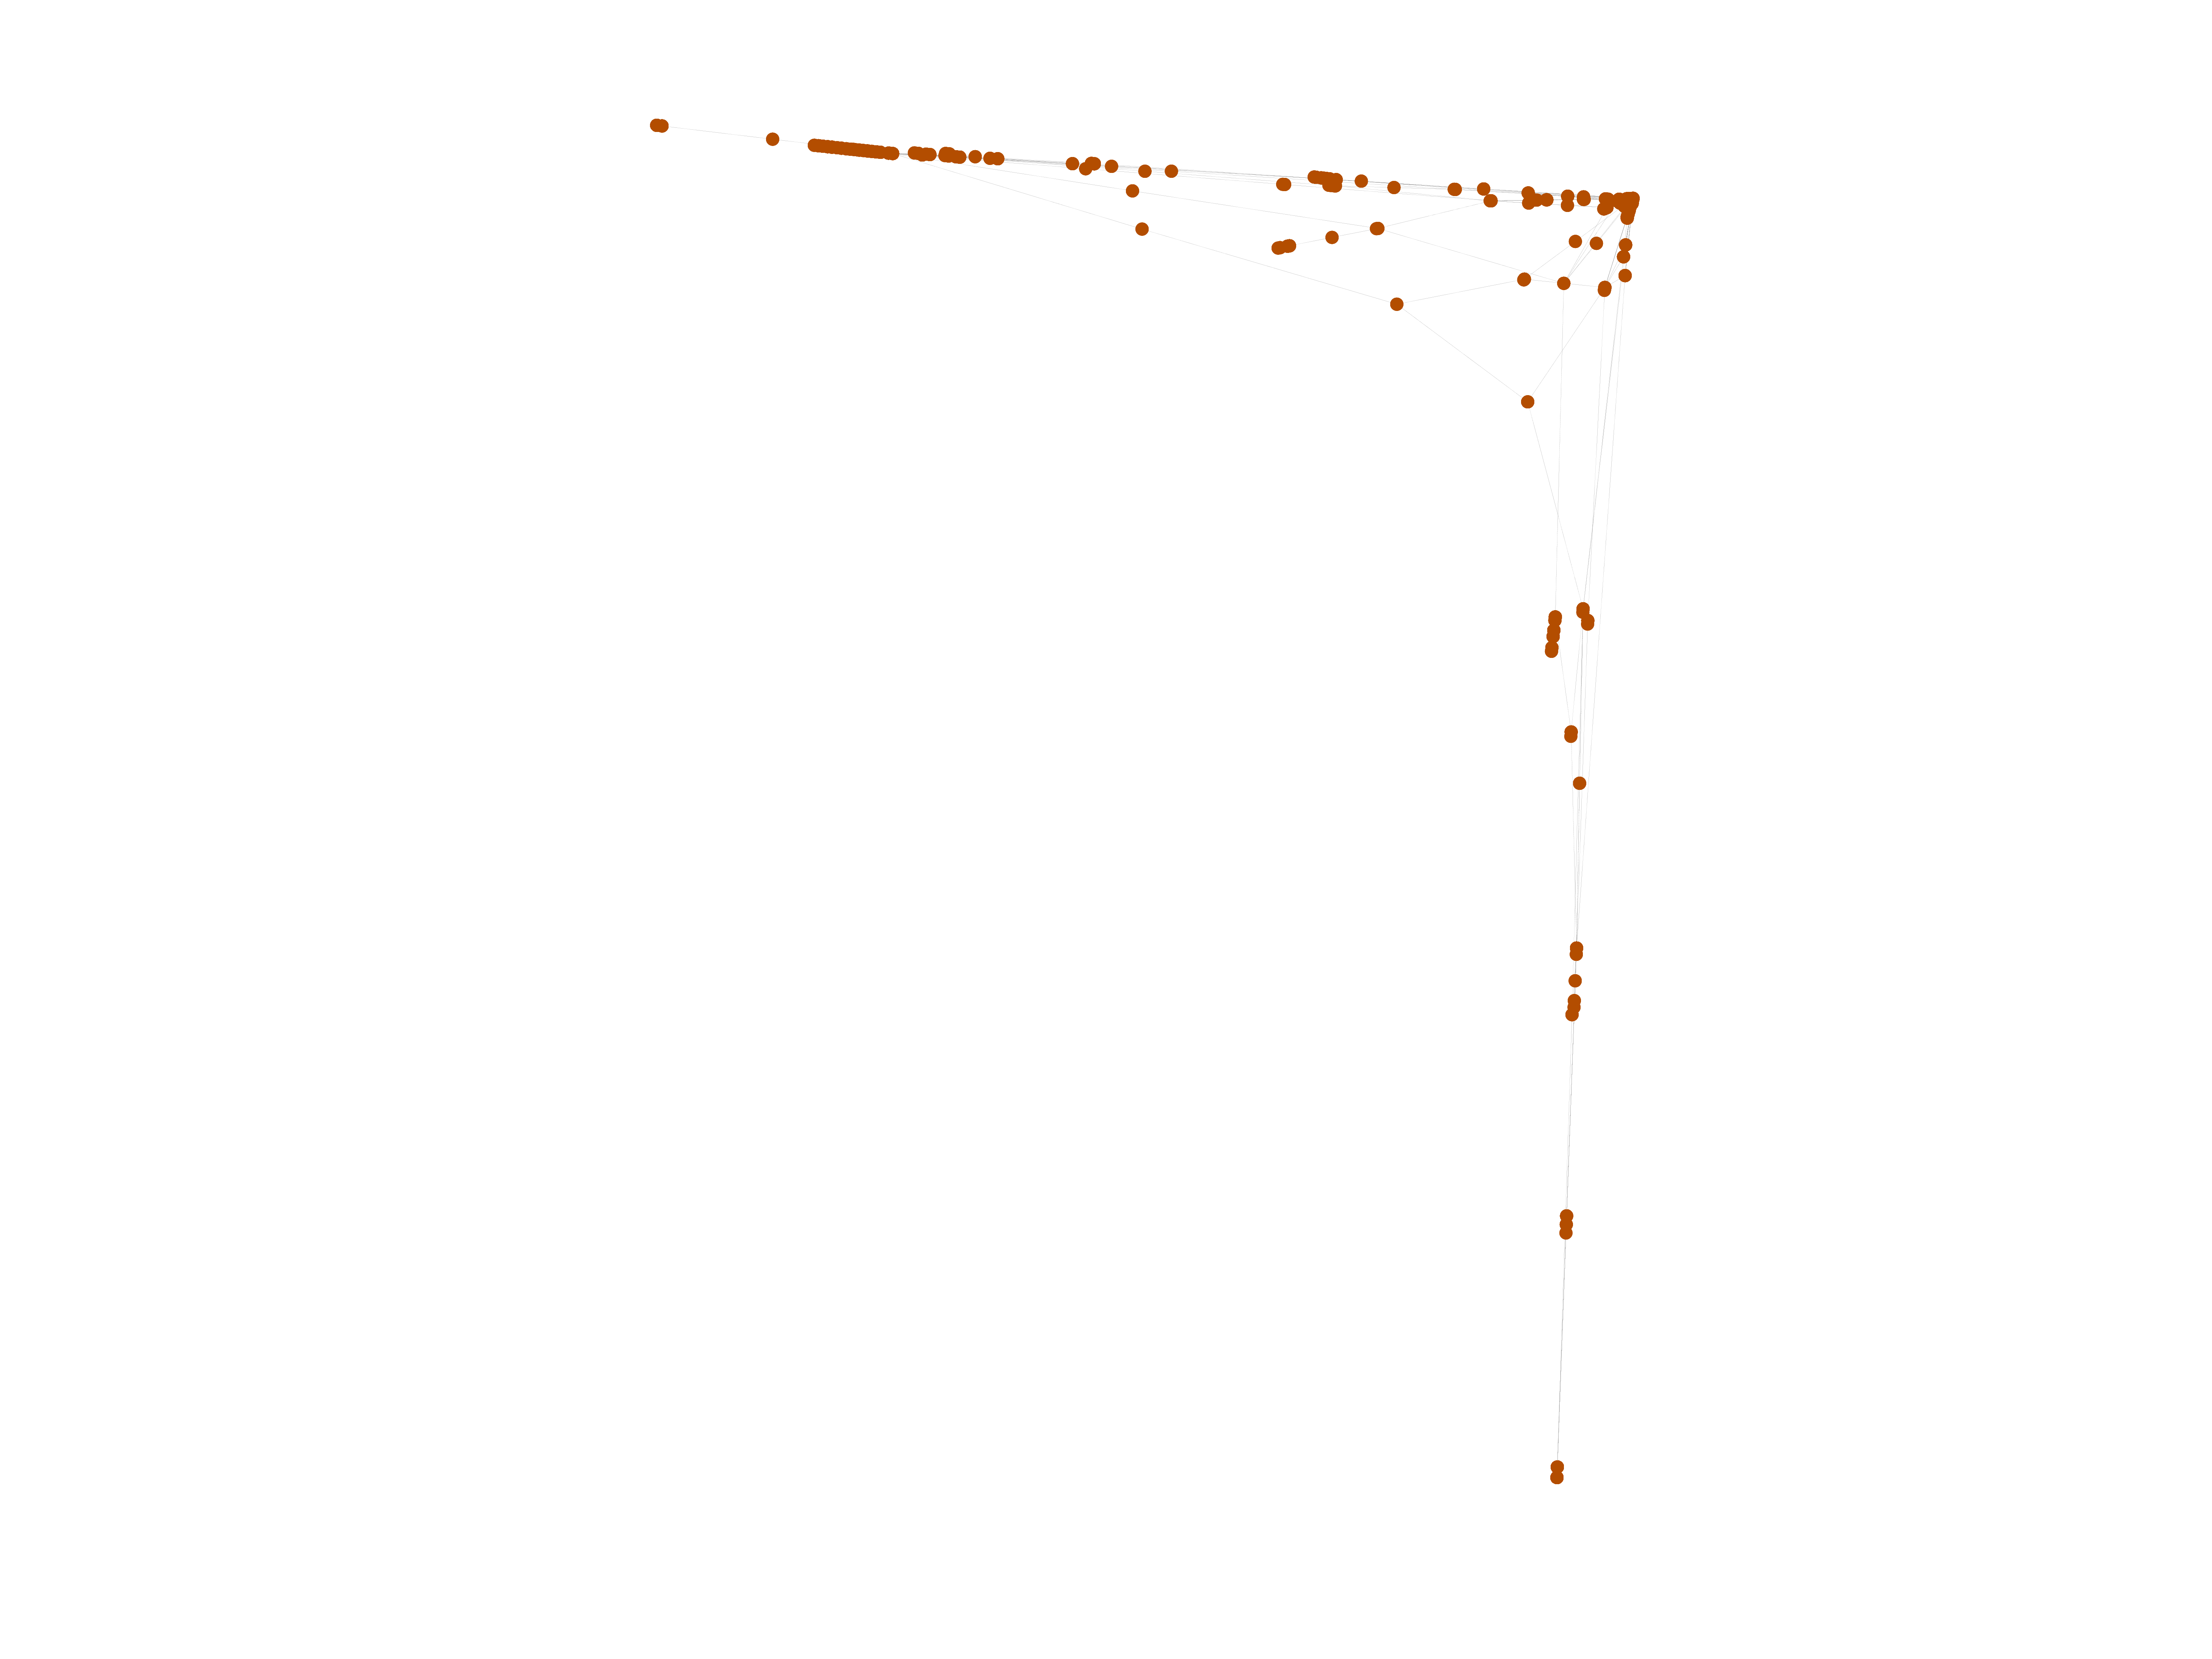
Wiktionary edits (tt)
This is the bipartite edit network of the Tatar Wiktionary. It contains users
and pages from the Tatar Wiktionary, connected by edit events. Each edge
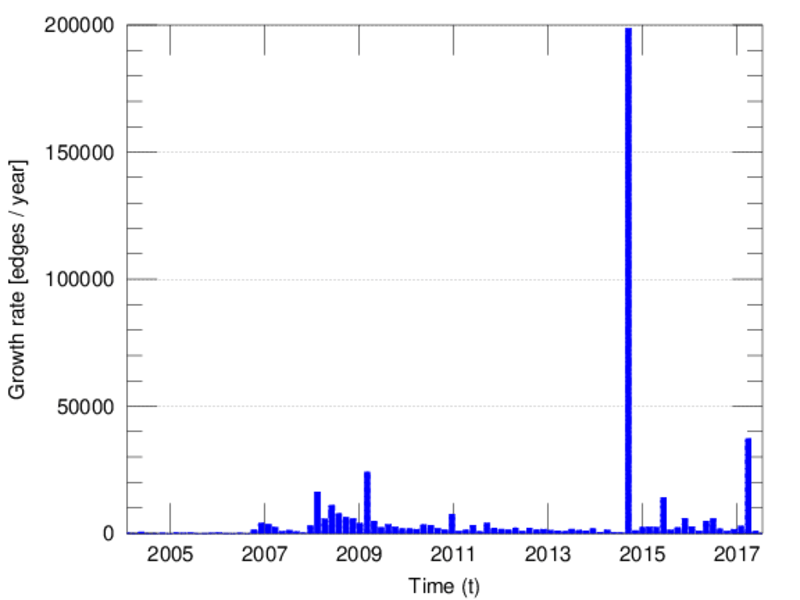
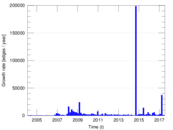
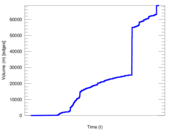
represents an edit. The dataset includes the timestamp of each edit.
Metadata
Statistics
| Size | n = | 9,149
|
| Left size | n1 = | 237
|
| Right size | n2 = | 8,912
|
| Volume | m = | 68,723
|
| Unique edge count | m̿ = | 35,571
|
| Wedge count | s = | 75,577,930
|
| Claw count | z = | 138,585,751,655
|
| Cross count | x = | 204,809,020,040,590
|
| Square count | q = | 80,189,464
|
| 4-Tour count | T4 = | 943,898,906
|
| Maximum degree | dmax = | 26,761
|
| Maximum left degree | d1max = | 26,761
|
| Maximum right degree | d2max = | 67
|
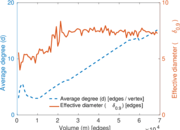
| Average degree | d = | 15.023 1
|
| Average left degree | d1 = | 289.970
|
| Average right degree | d2 = | 7.711 29
|
| Fill | p = | 0.016 841 2
|
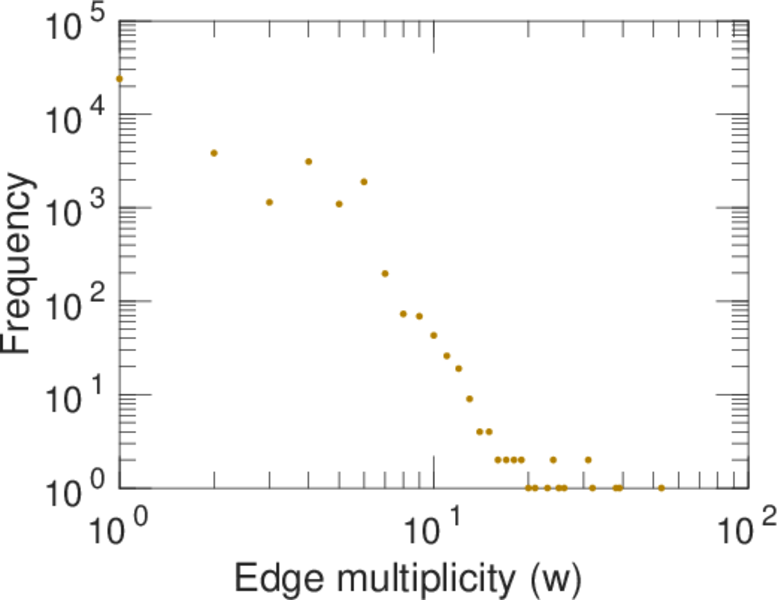
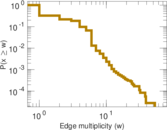
| Average edge multiplicity | m̃ = | 1.932 00
|
| Size of LCC | N = | 8,841
|
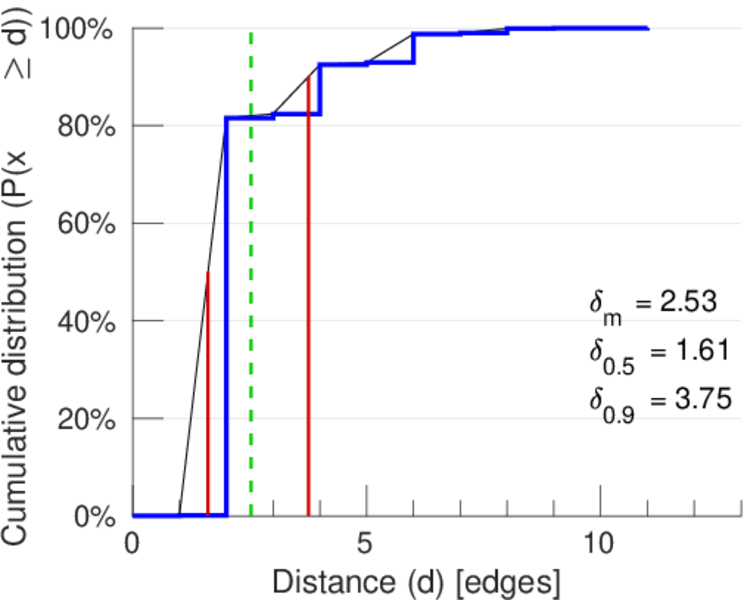
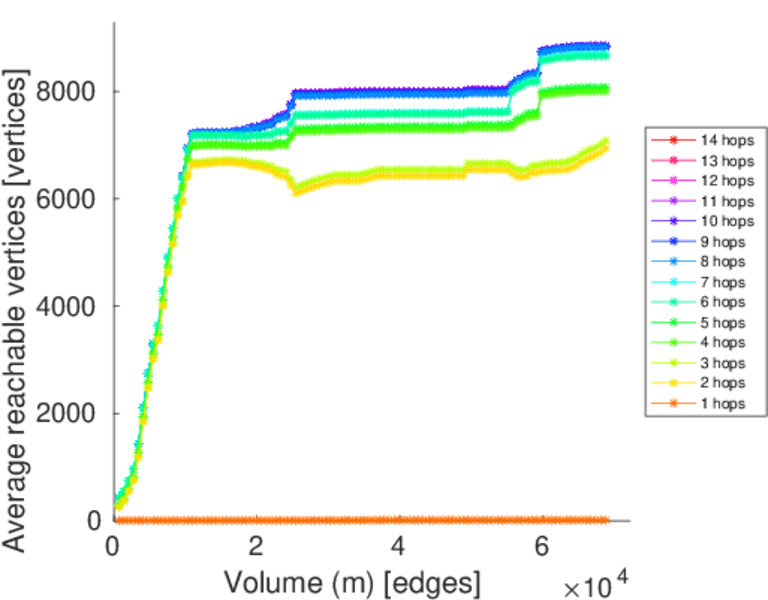
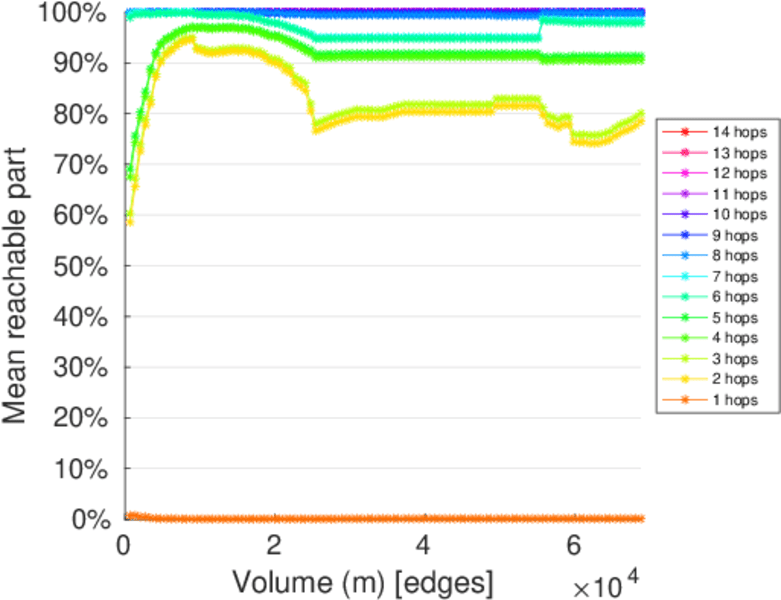
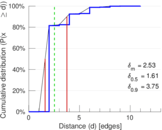
| Diameter | δ = | 13
|
| 50-Percentile effective diameter | δ0.5 = | 1.612 77
|
| 90-Percentile effective diameter | δ0.9 = | 3.754 97
|
| Median distance | δM = | 2
|
| Mean distance | δm = | 2.530 18
|
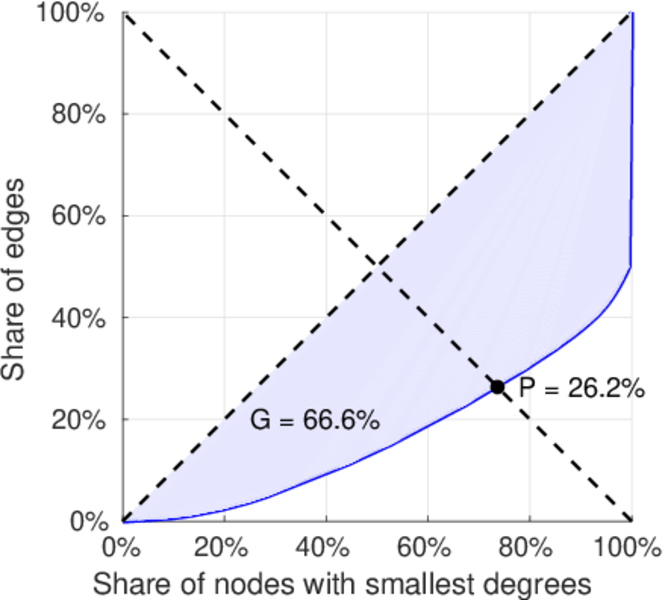
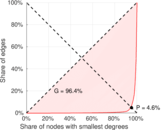
| Gini coefficient | G = | 0.660 680
|
| Balanced inequality ratio | P = | 0.264 235
|
| Left balanced inequality ratio | P1 = | 0.046 301 8
|
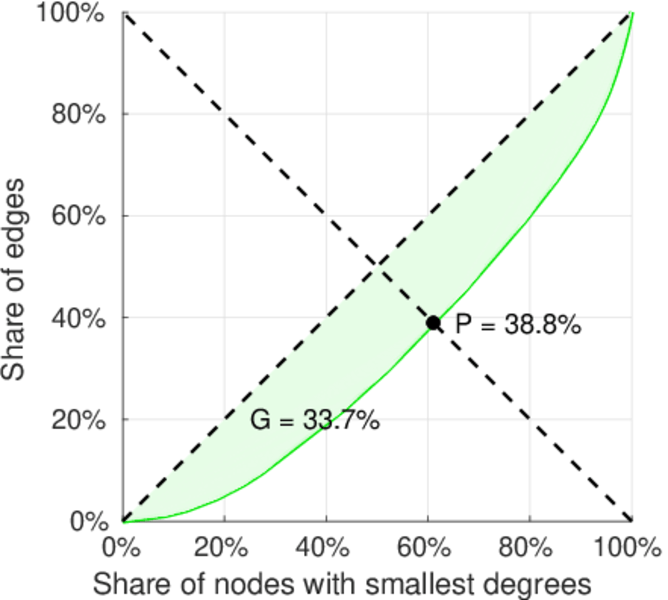
| Right balanced inequality ratio | P2 = | 0.388 182
|
| Relative edge distribution entropy | Her = | 0.705 336
|
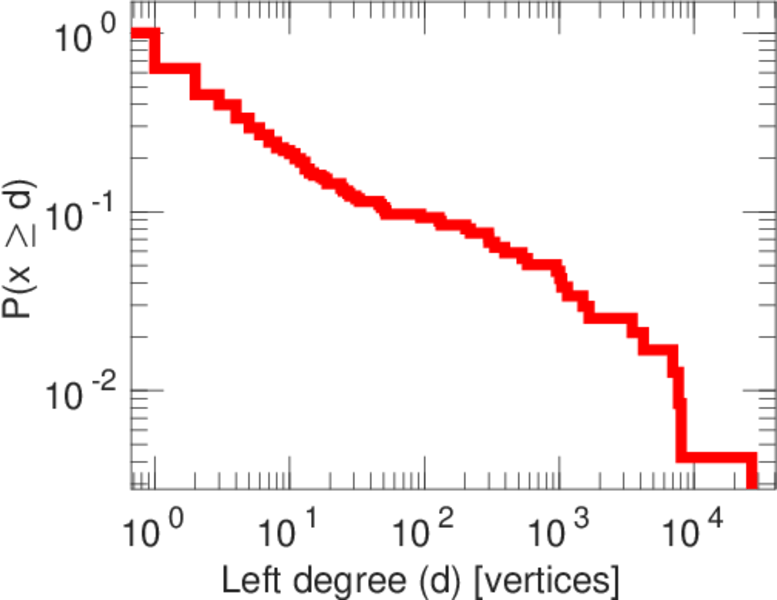
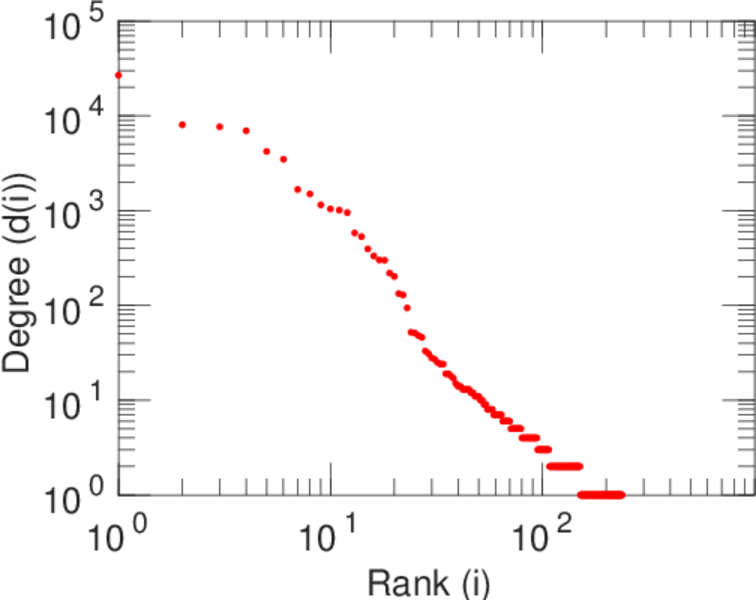
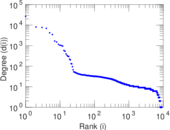
| Power law exponent | γ = | 1.818 53
|
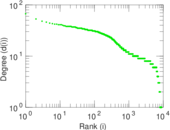
| Tail power law exponent | γt = | 4.061 00
|
| Tail power law exponent with p | γ3 = | 4.061 00
|
| p-value | p = | 0.000 00
|
| Left tail power law exponent with p | γ3,1 = | 1.561 00
|
| Left p-value | p1 = | 0.001 000 00
|
| Right tail power law exponent with p | γ3,2 = | 4.471 00
|
| Right p-value | p2 = | 0.000 00
|
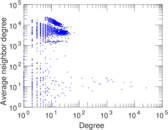
| Degree assortativity | ρ = | −0.329 387
|
| Degree assortativity p-value | pρ = | 0.000 00
|
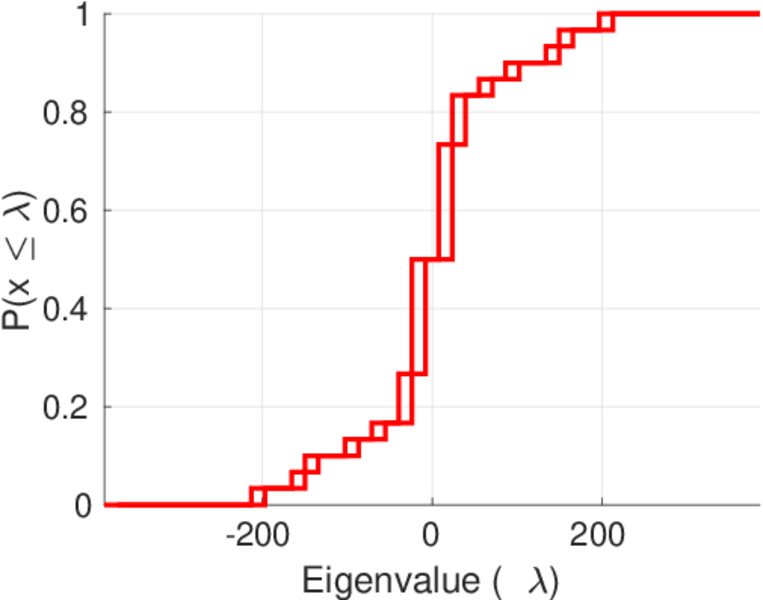
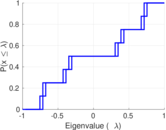
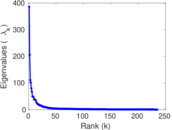
| Spectral norm | α = | 385.816
|
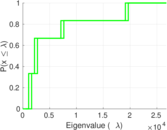
| Algebraic connectivity | a = | 0.012 775 6
|
| Spectral separation | |λ1[A] / λ2[A]| = | 1.878 72
|
| Controllability | C = | 8,629
|
| Relative controllability | Cr = | 0.949 389
|
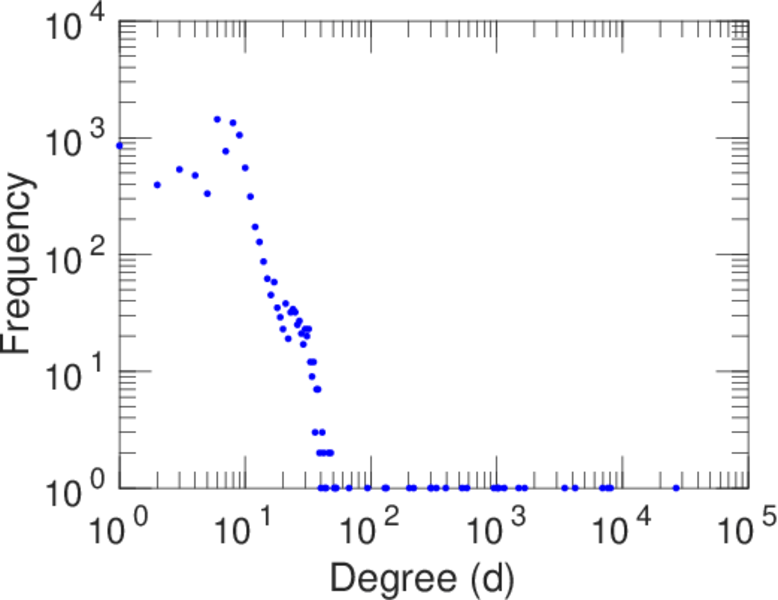
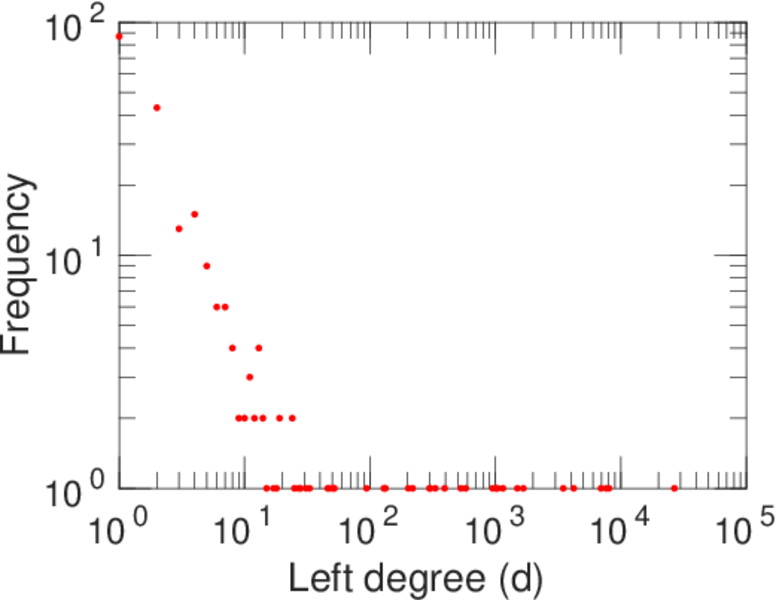
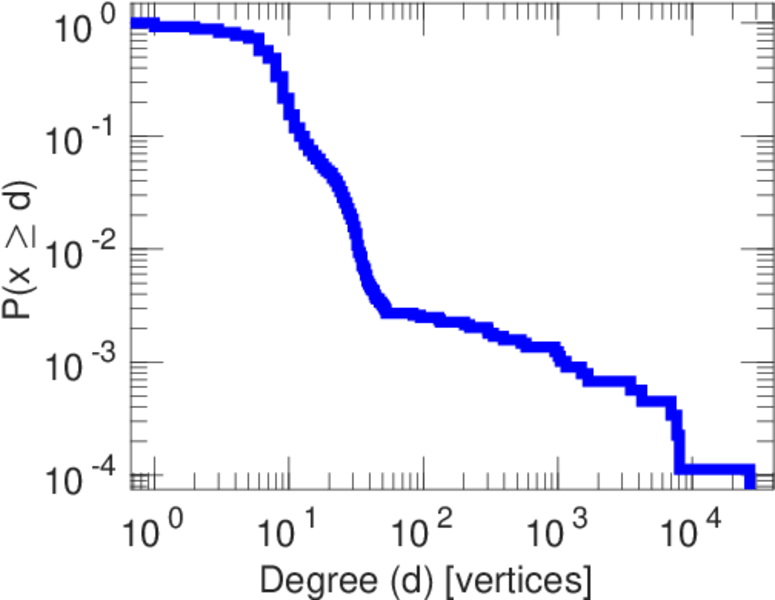
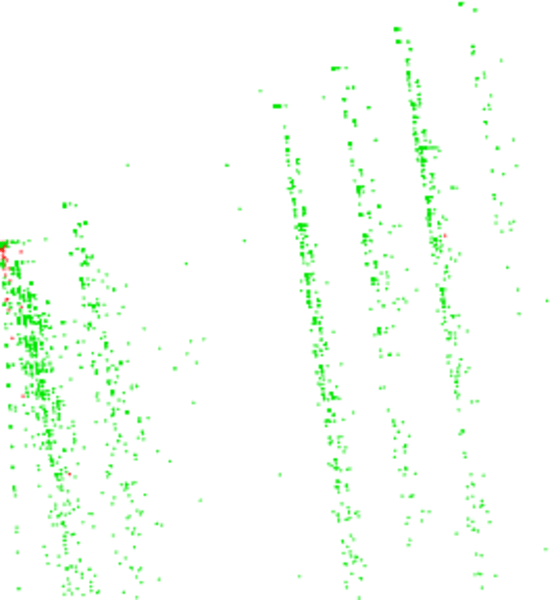
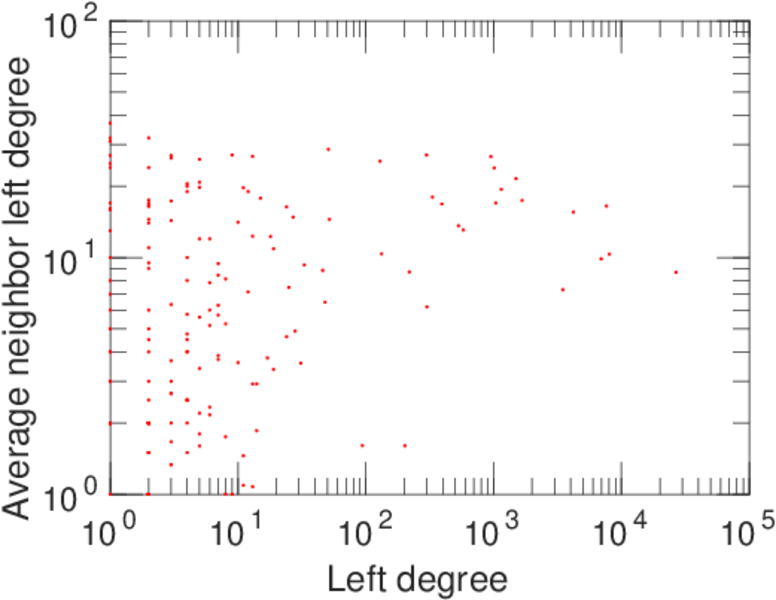
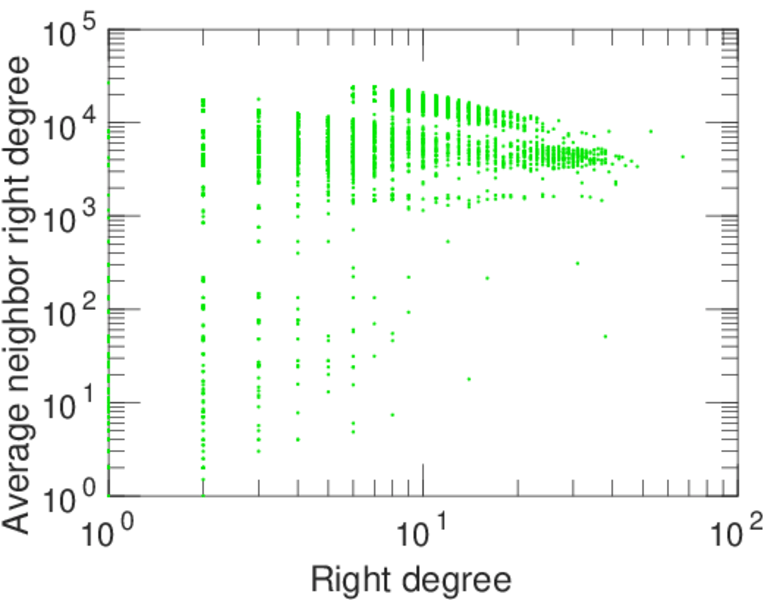
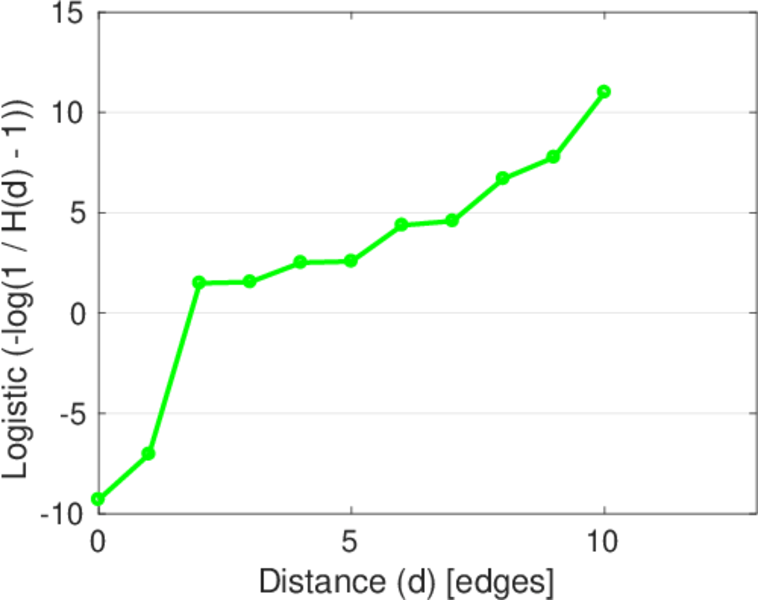
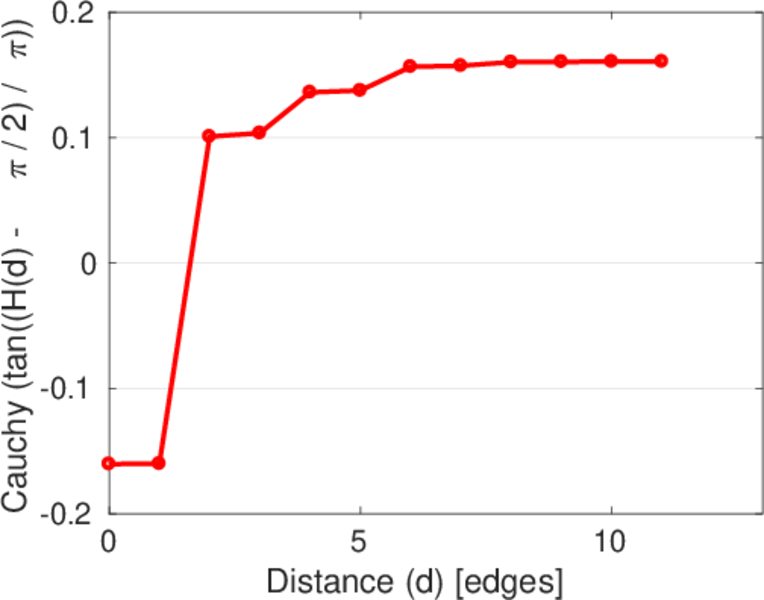
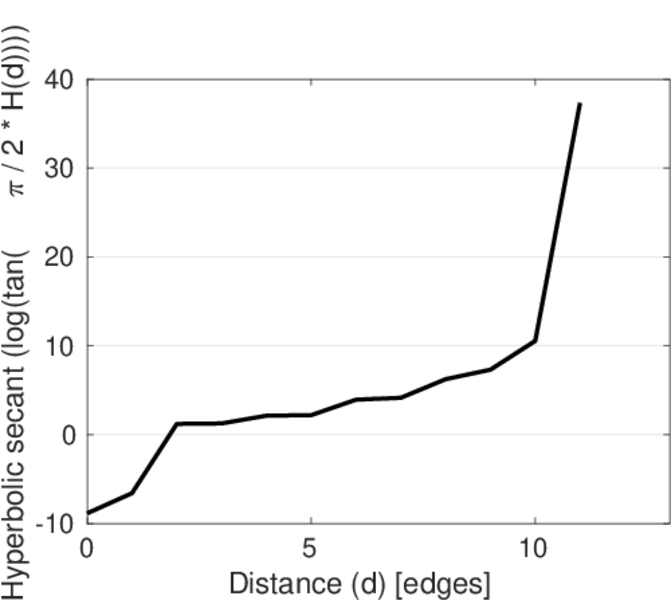
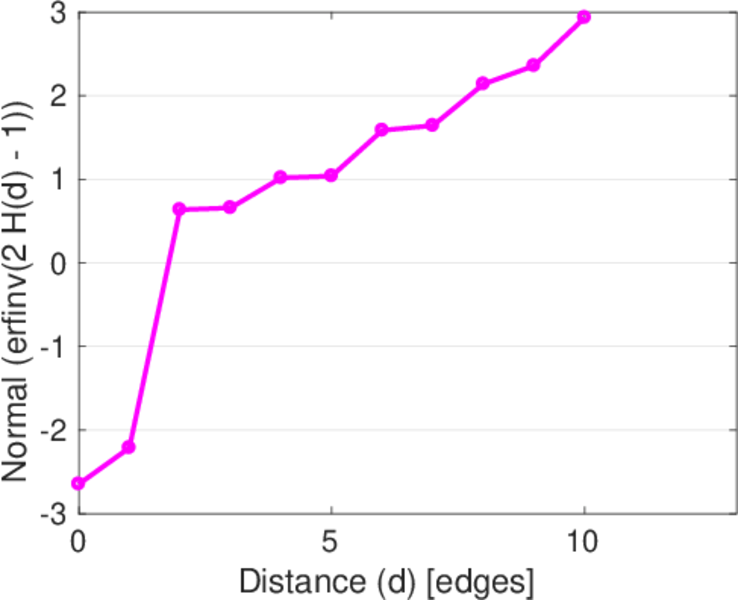
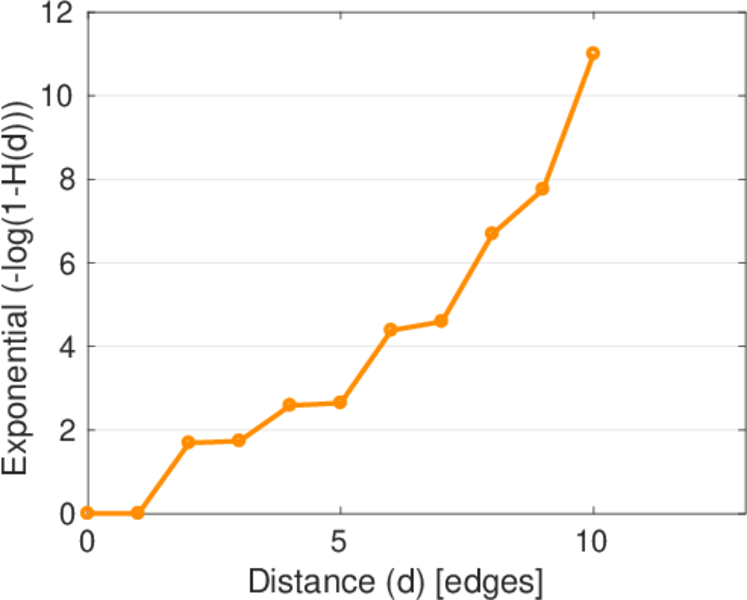
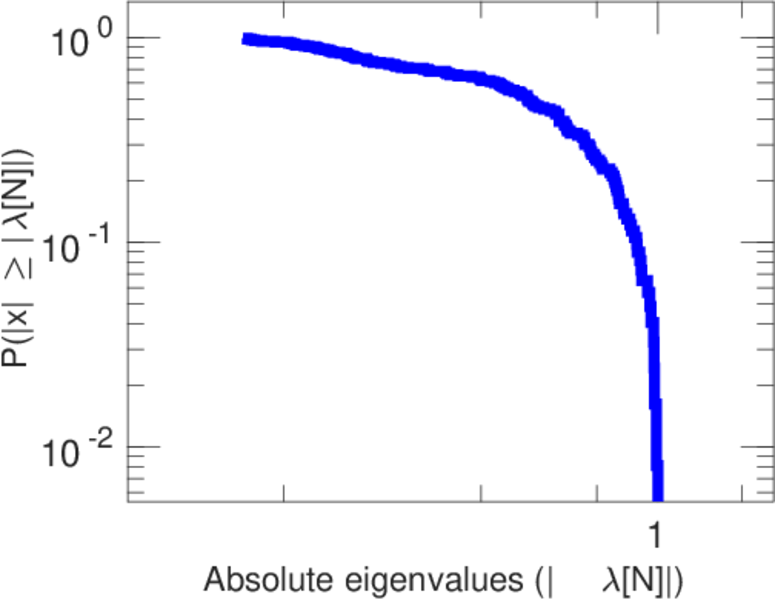
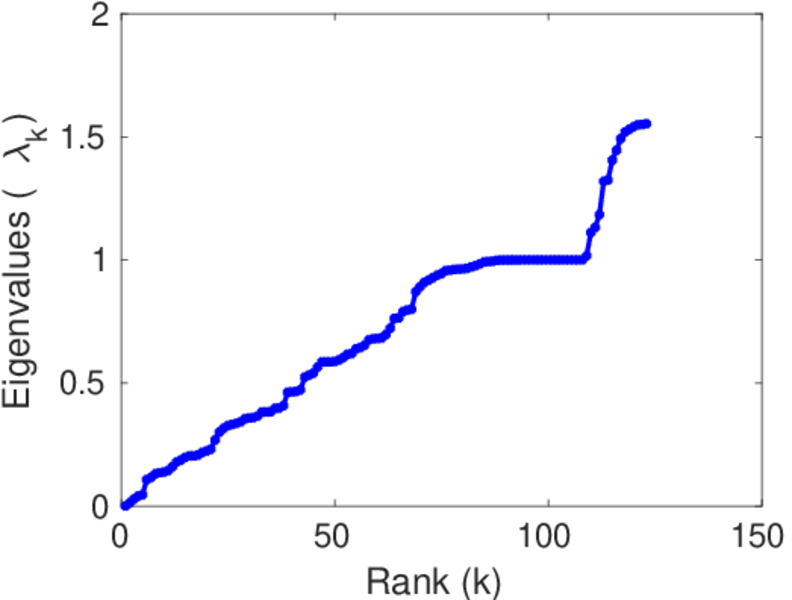
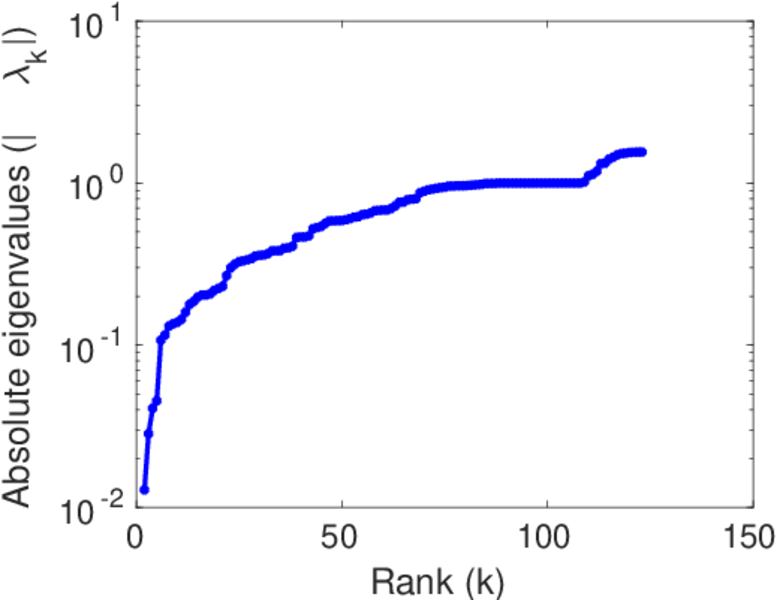
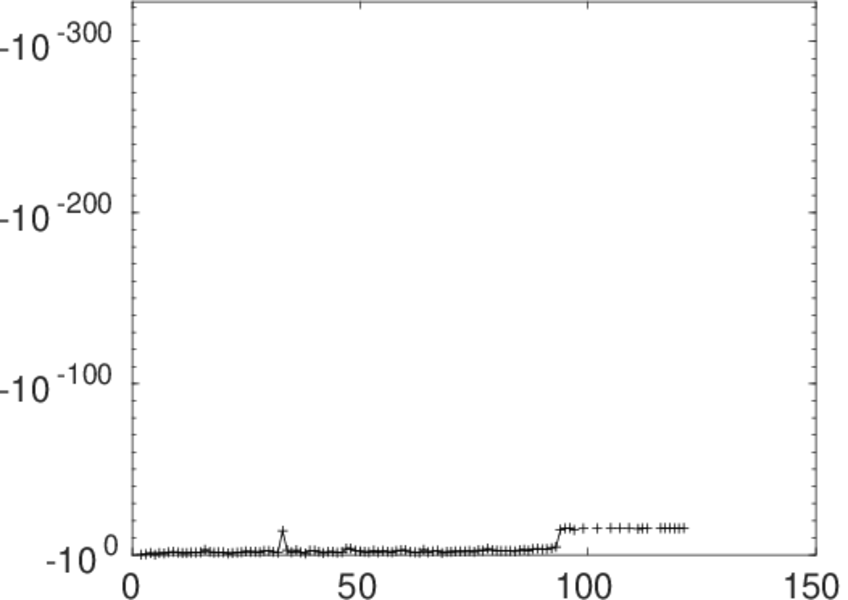
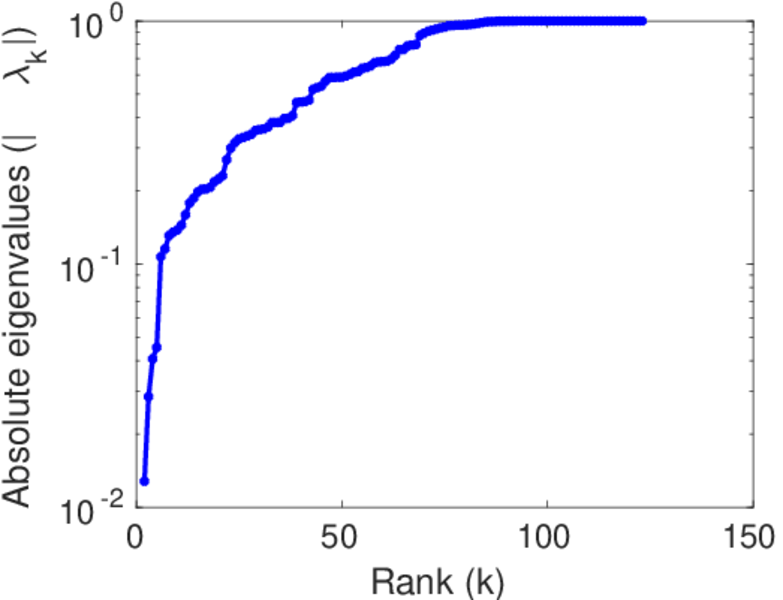
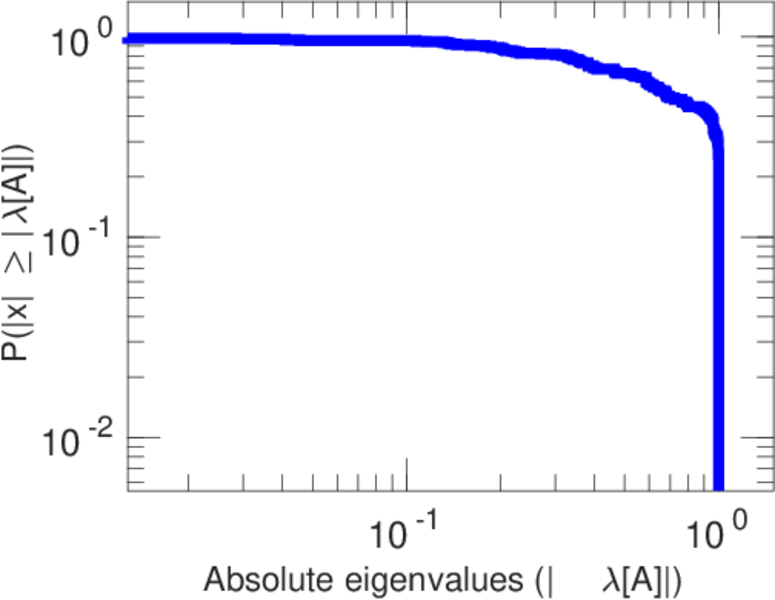
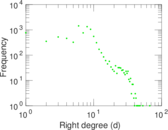
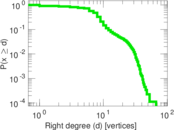
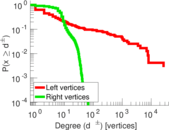
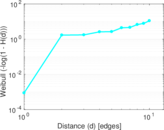
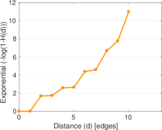
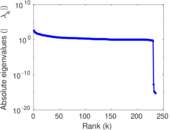
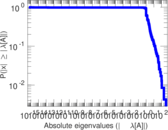
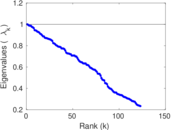
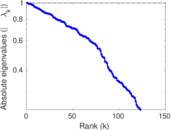
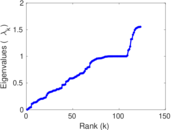
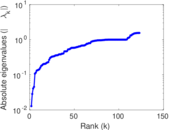
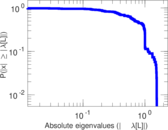
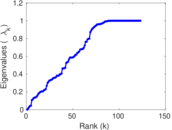
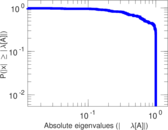
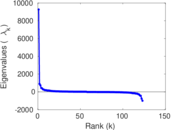
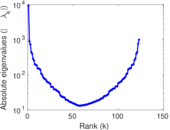
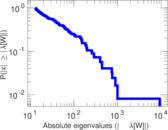
Plots


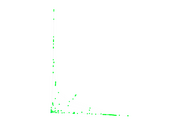


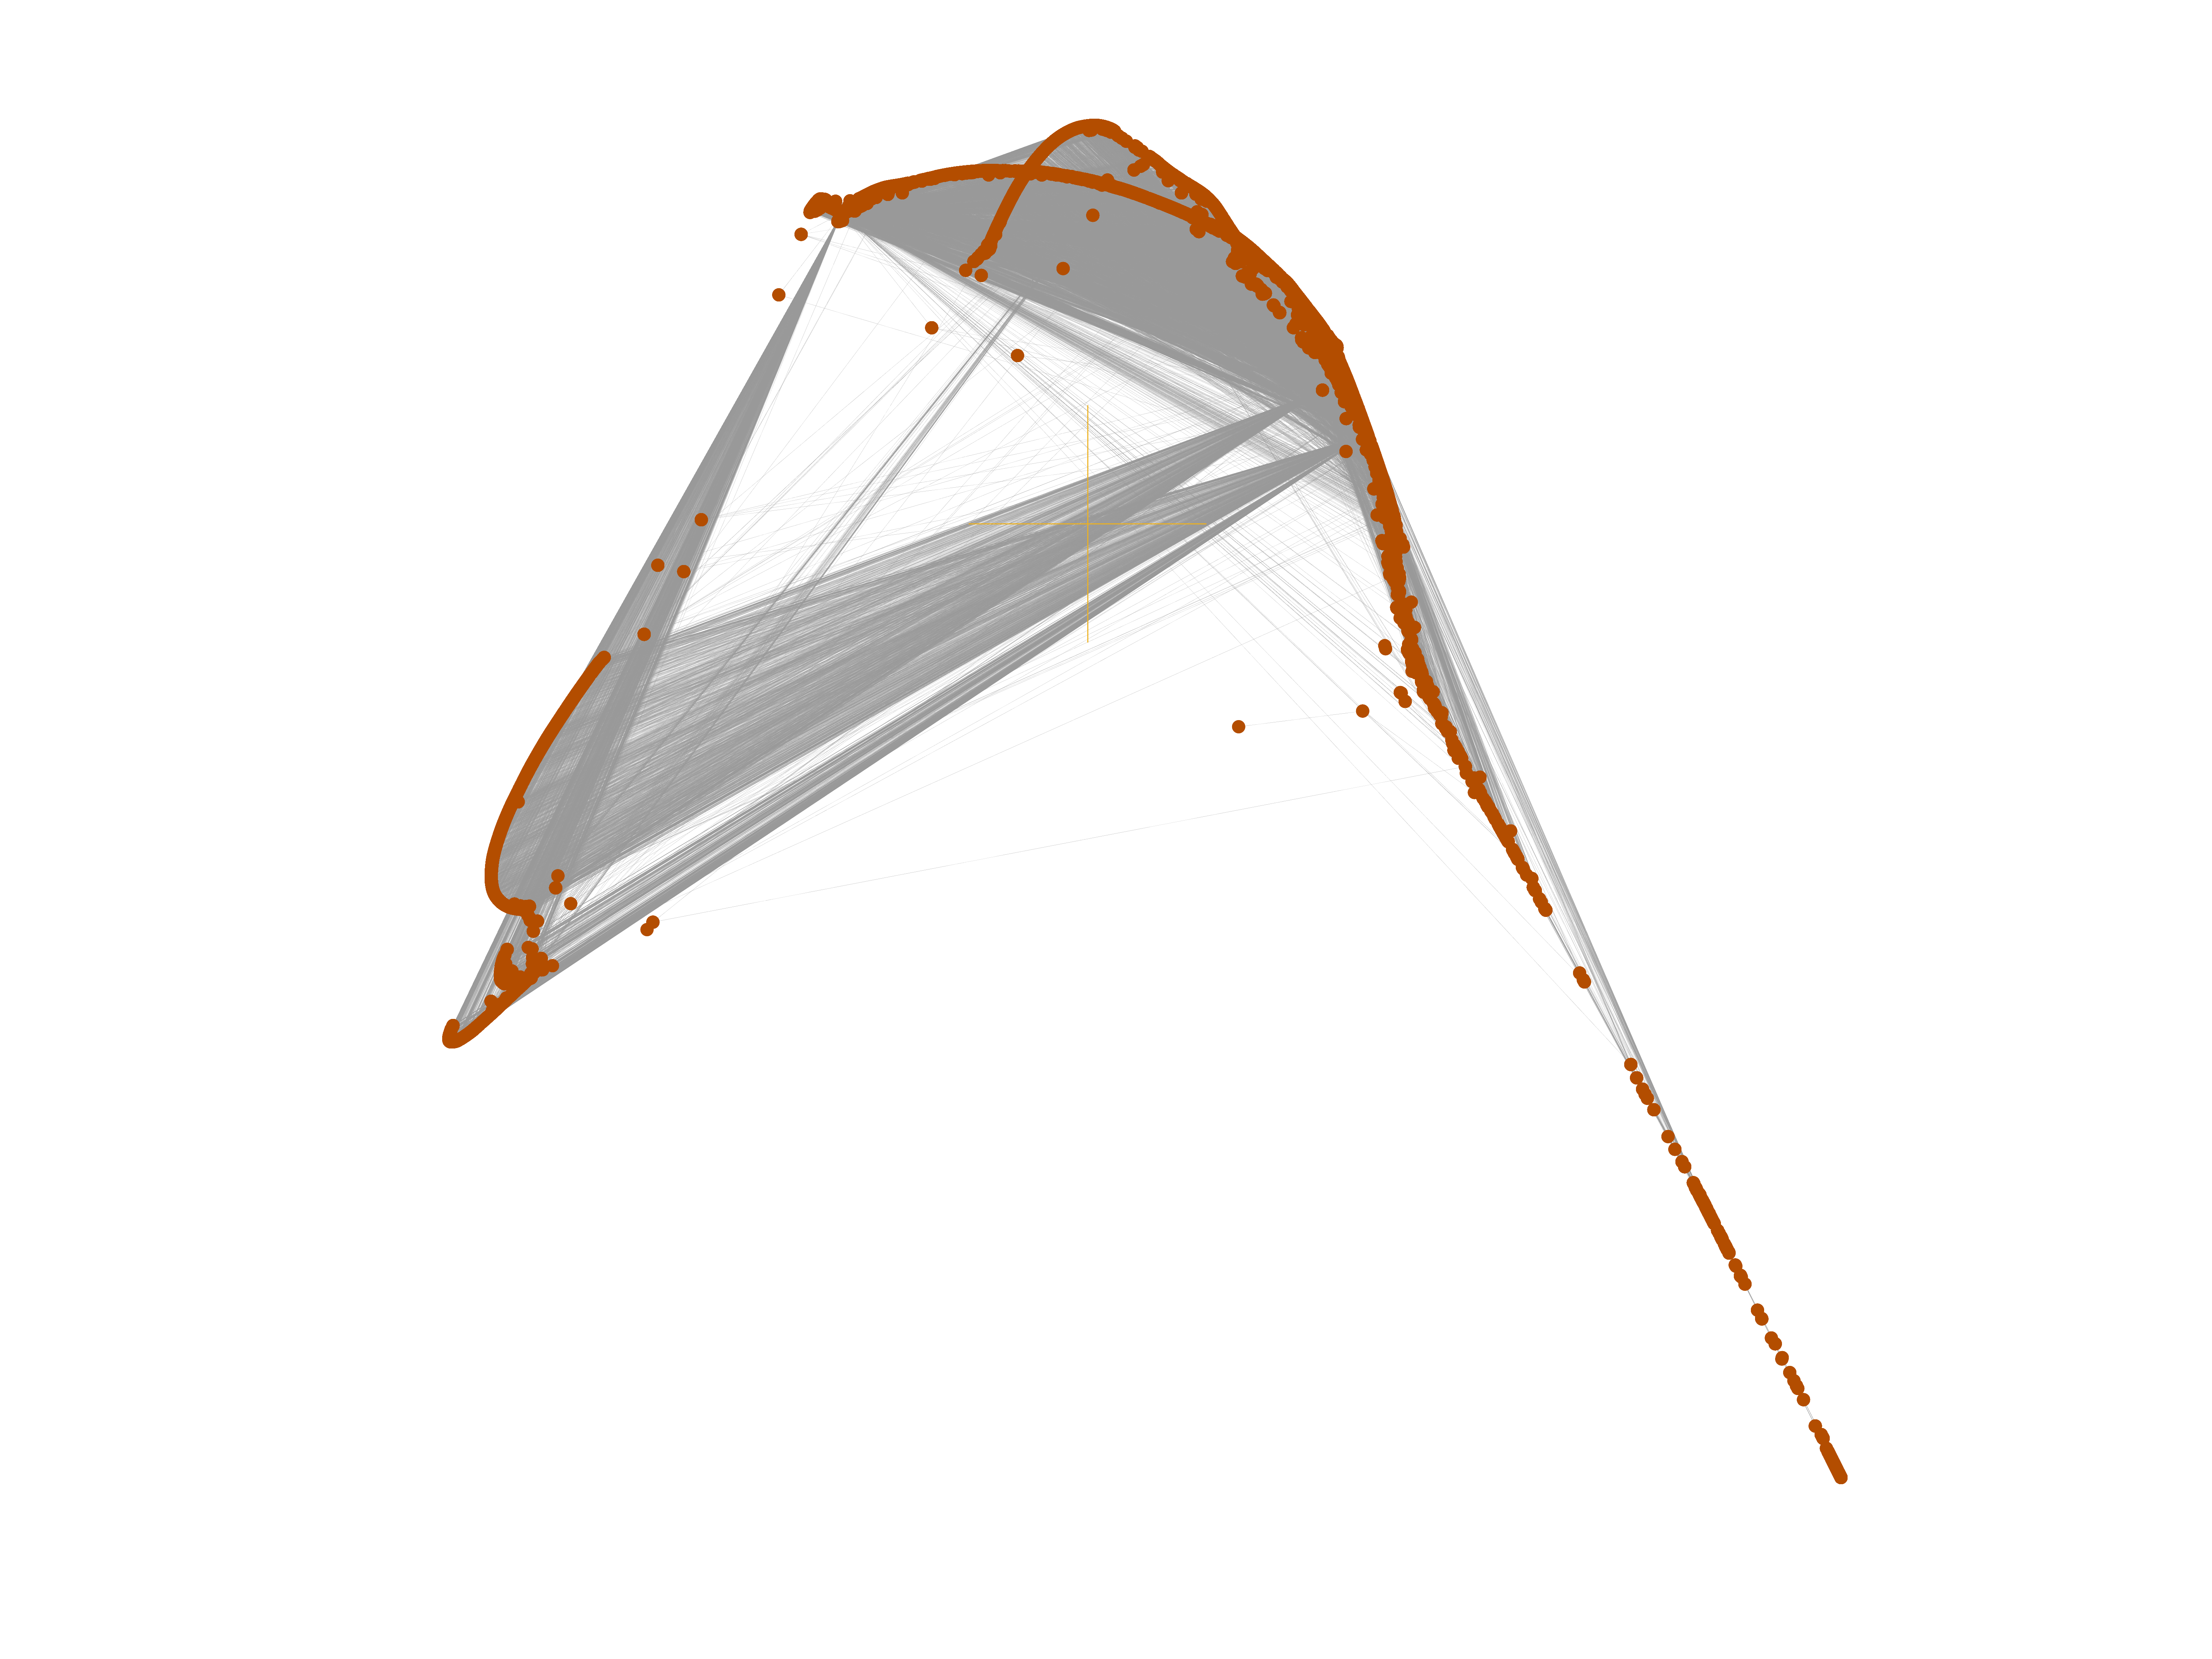
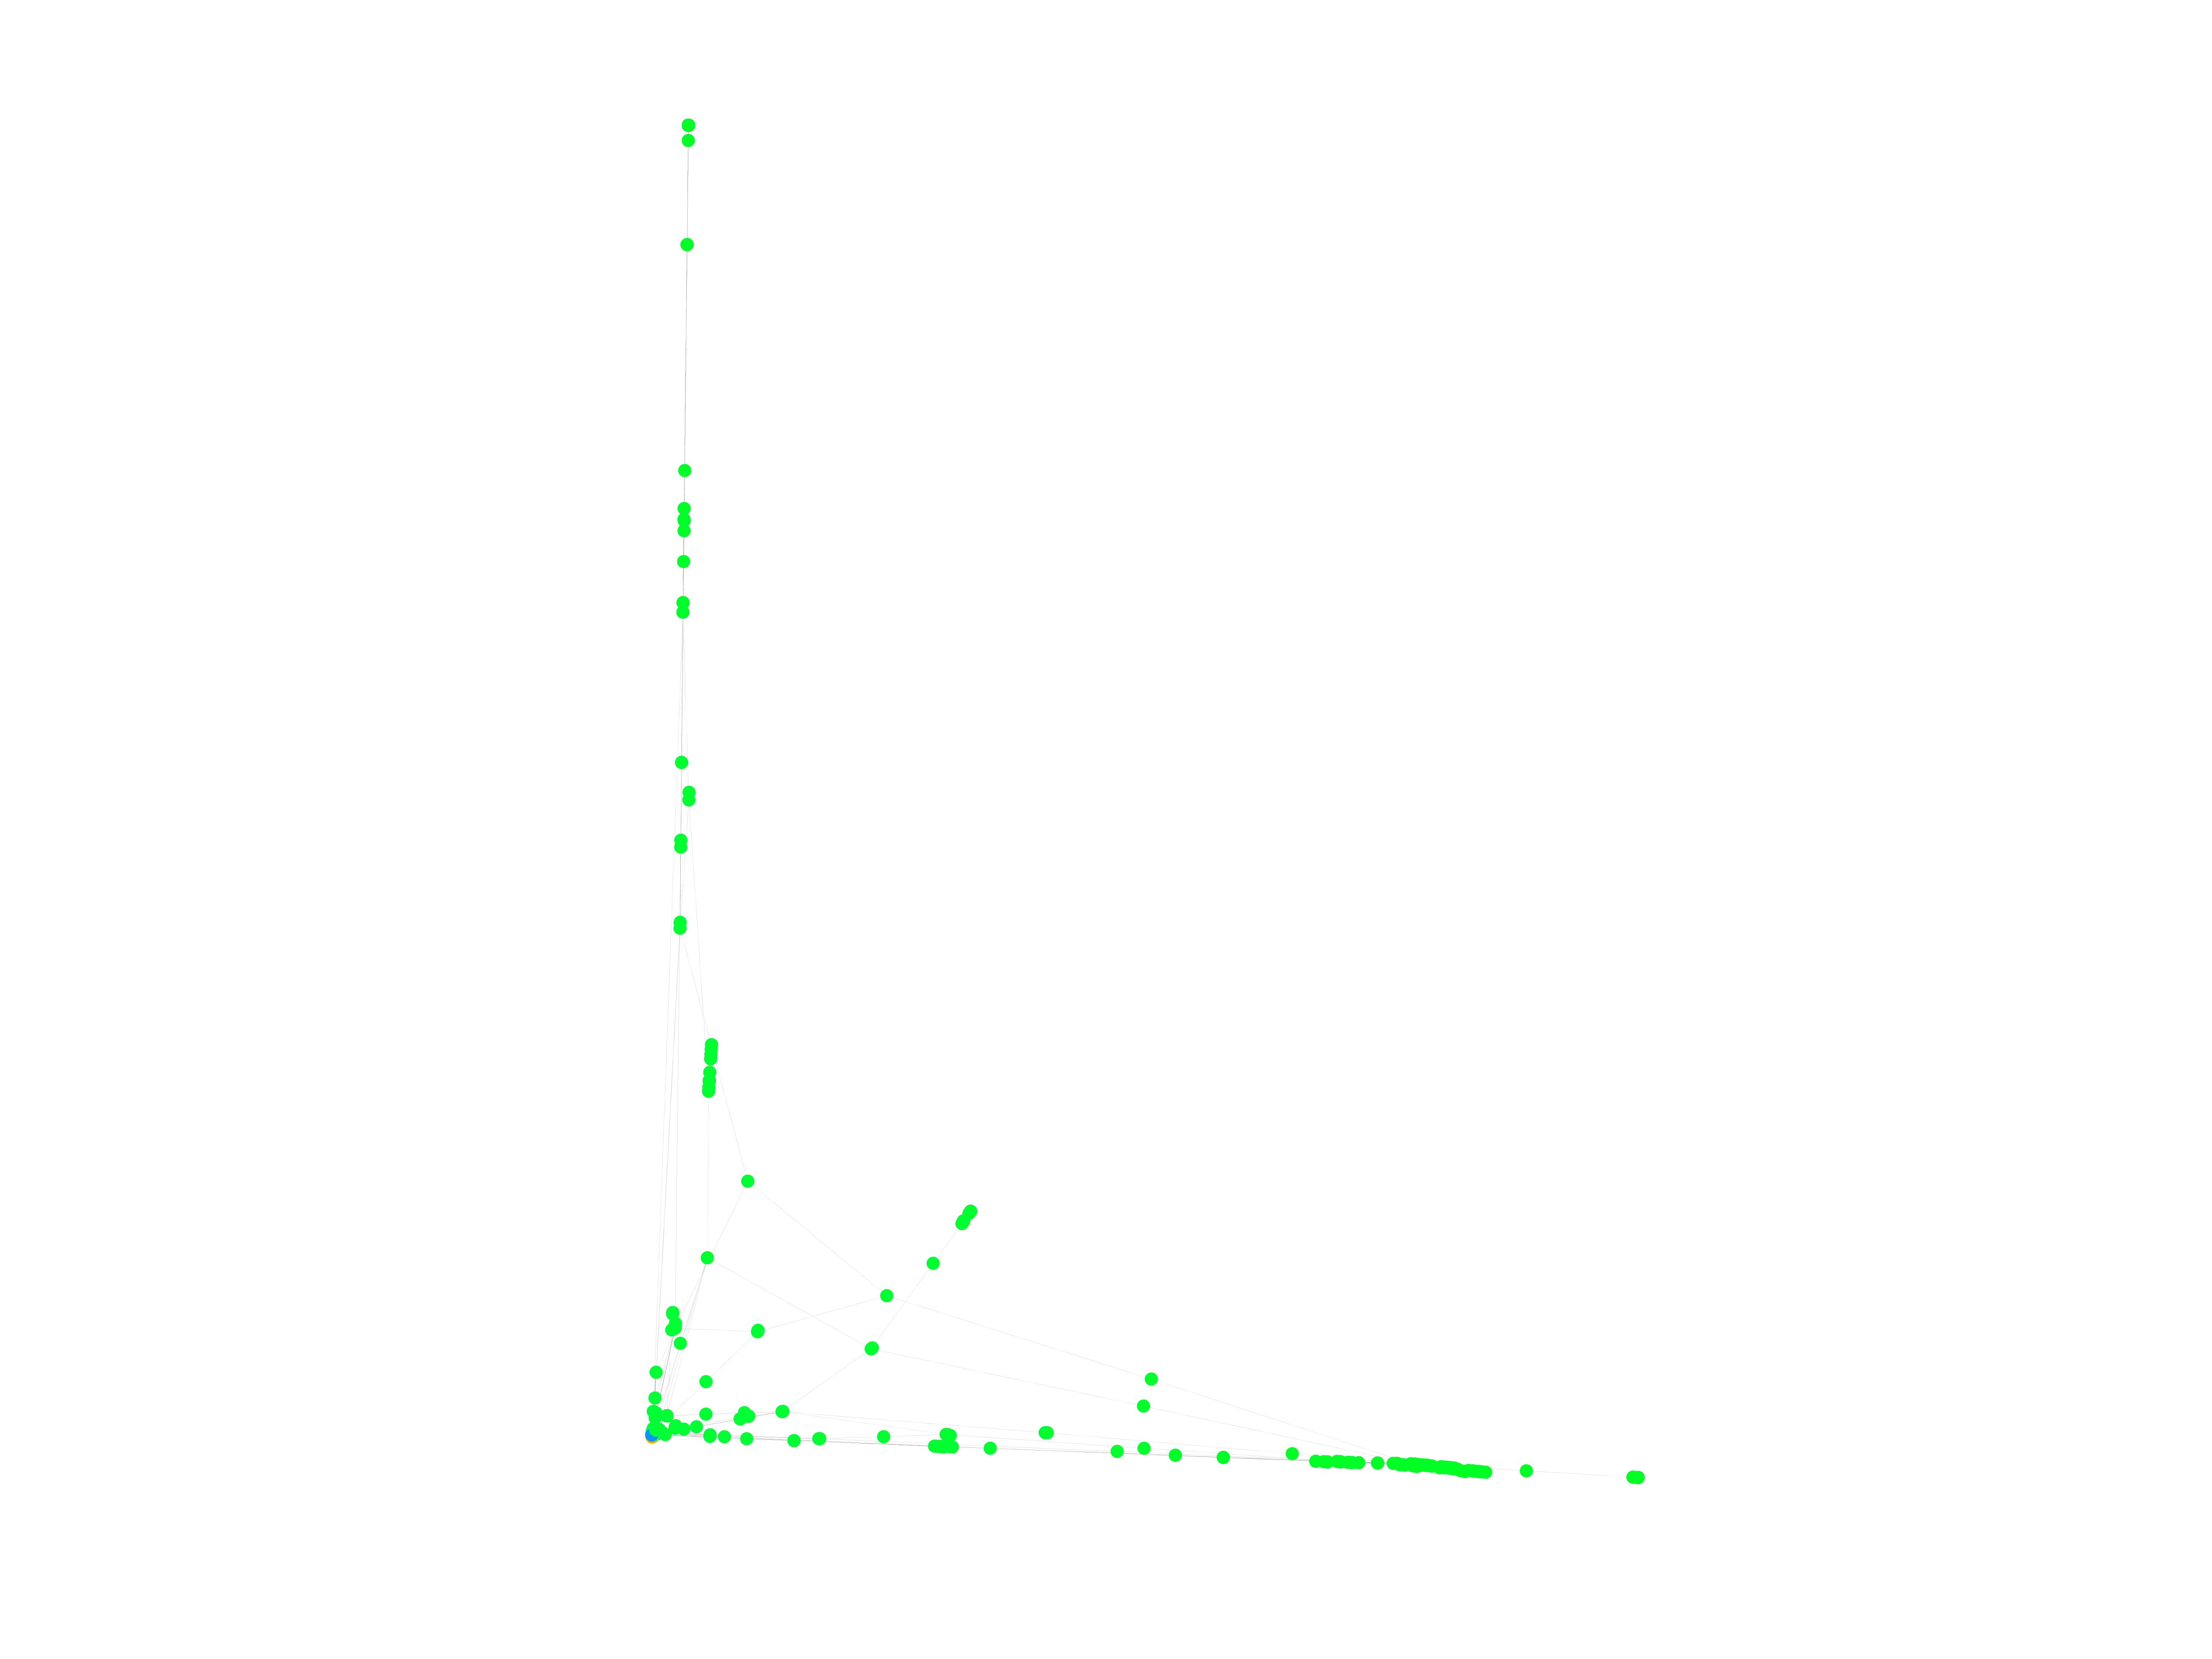
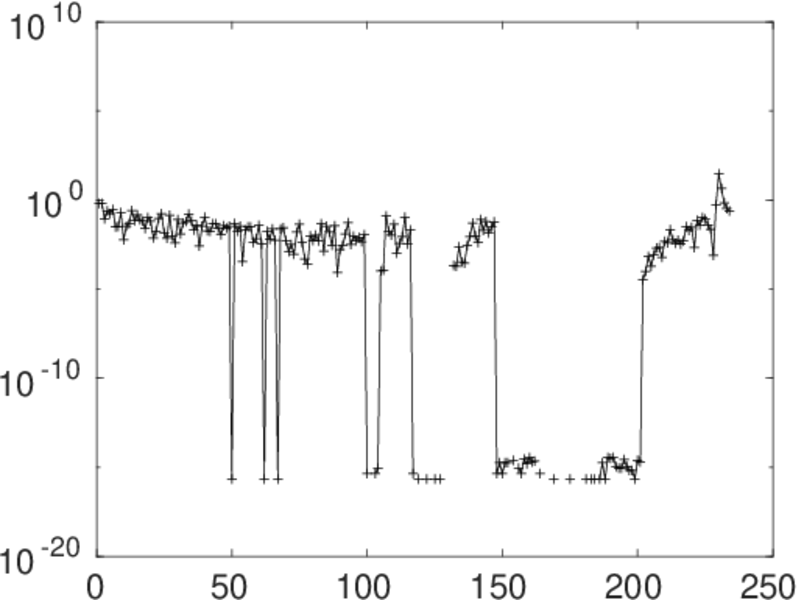
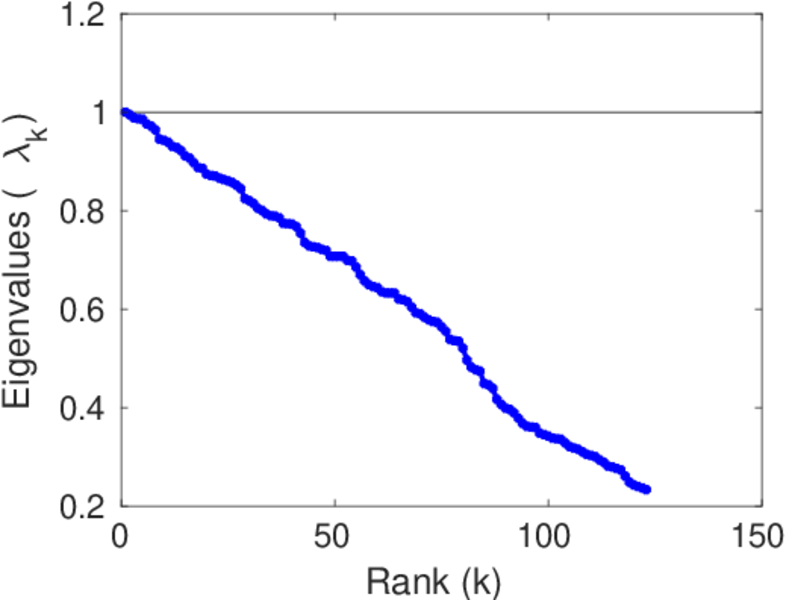
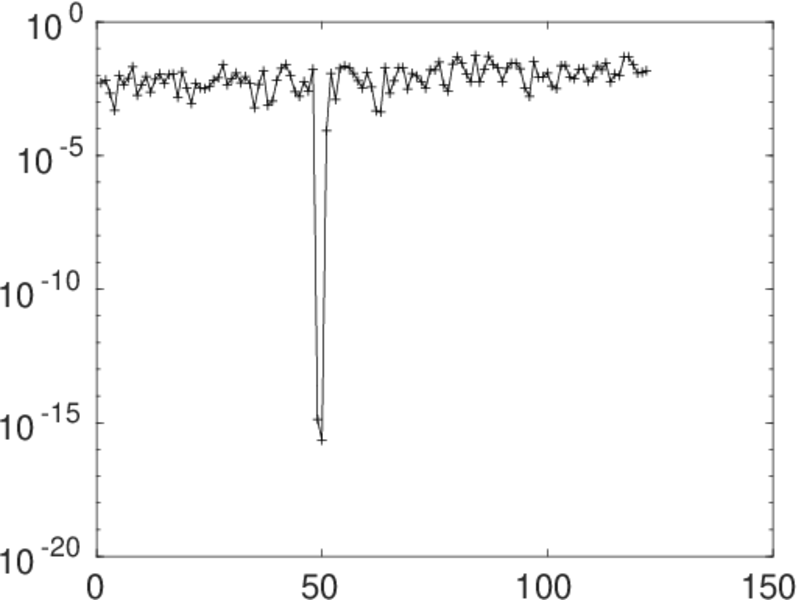
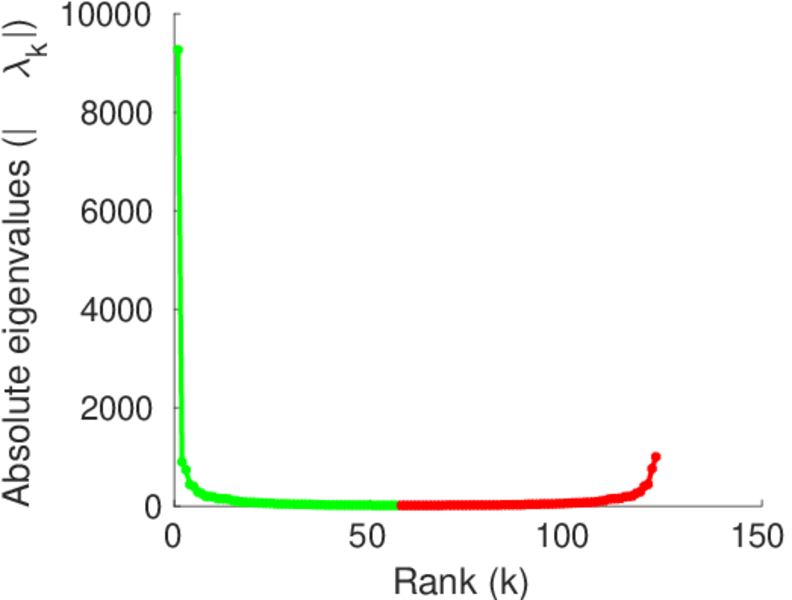
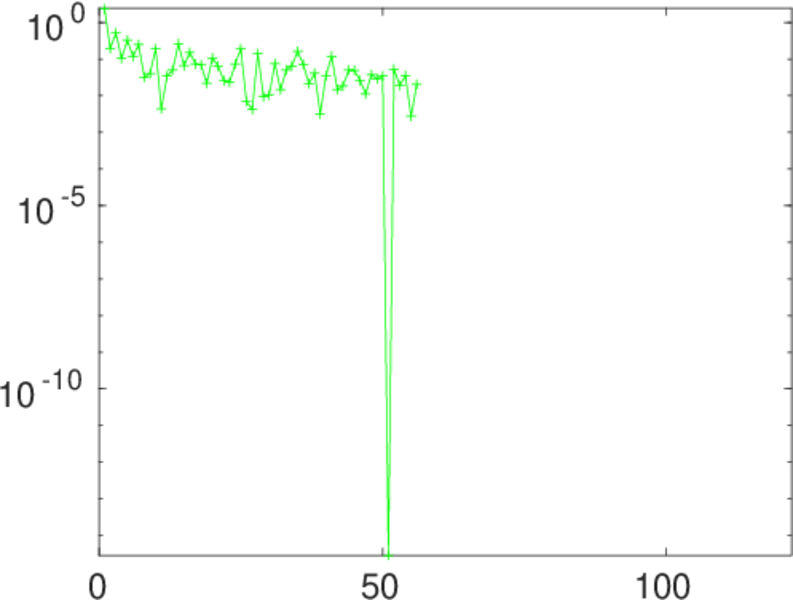
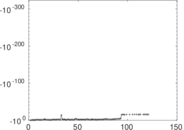
Matrix decompositions plots


Downloads
References
|
[1]
|
Jérôme Kunegis.
KONECT – The Koblenz Network Collection.
In Proc. Int. Conf. on World Wide Web Companion, pages
1343–1350, 2013.
[ http ]
|
|
[2]
|
Wikimedia Foundation.
Wikimedia downloads.
http://dumps.wikimedia.org/, January 2010.
|
 KONECT ‣ Networks ‣
Buy Me a Coffee
KONECT ‣ Networks ‣
Buy Me a Coffee