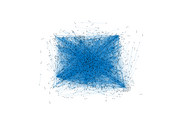
Wikipedia edits (tum)
This is the bipartite edit network of the Tumbuka Wikipedia. It contains users
and pages from the Tumbuka Wikipedia, connected by edit events. Each edge
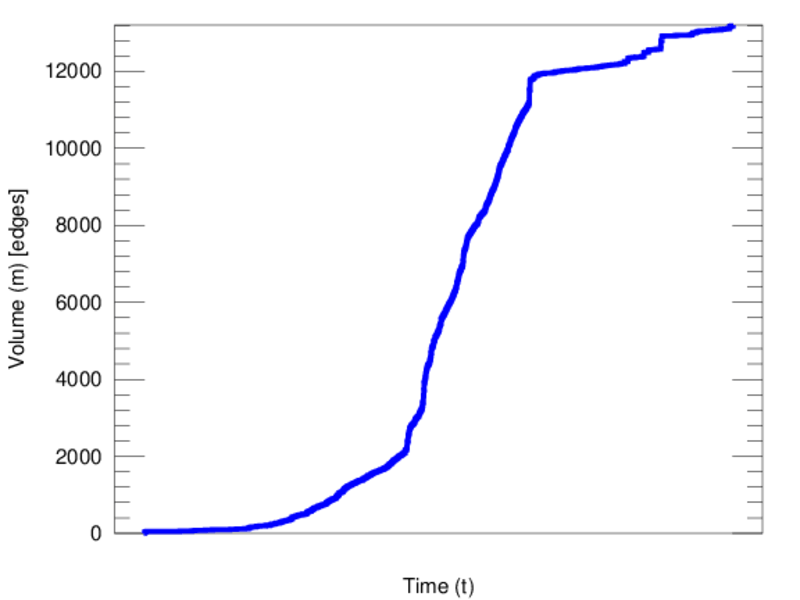
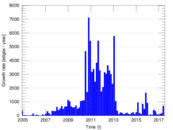
represents an edit. The dataset includes the timestamp of each edit.
Metadata
Statistics
| Size | n = | 2,373
|
| Left size | n1 = | 519
|
| Right size | n2 = | 1,854
|
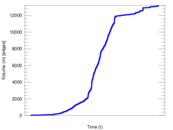
| Volume | m = | 13,205
|
| Unique edge count | m̿ = | 5,865
|
| Wedge count | s = | 381,120
|
| Claw count | z = | 23,369,632
|
| Cross count | x = | 1,350,891,091
|
| Square count | q = | 898,463
|
| 4-Tour count | T4 = | 8,726,374
|
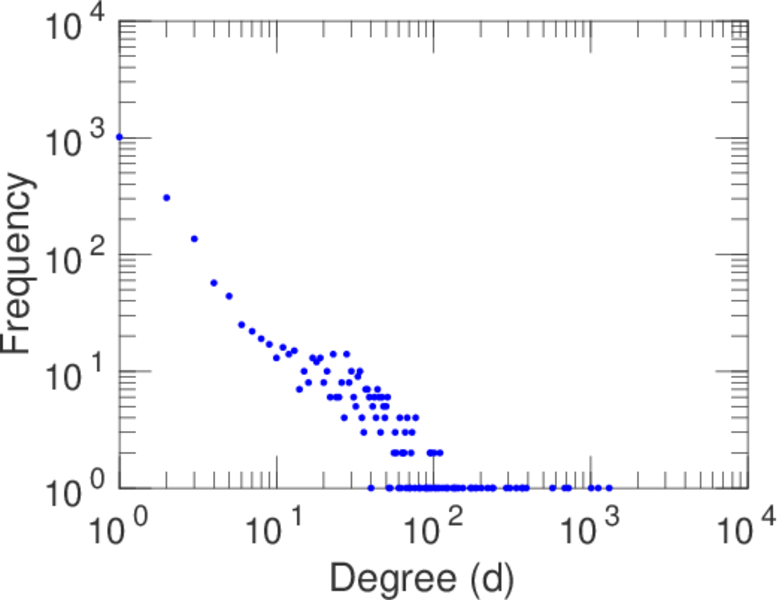
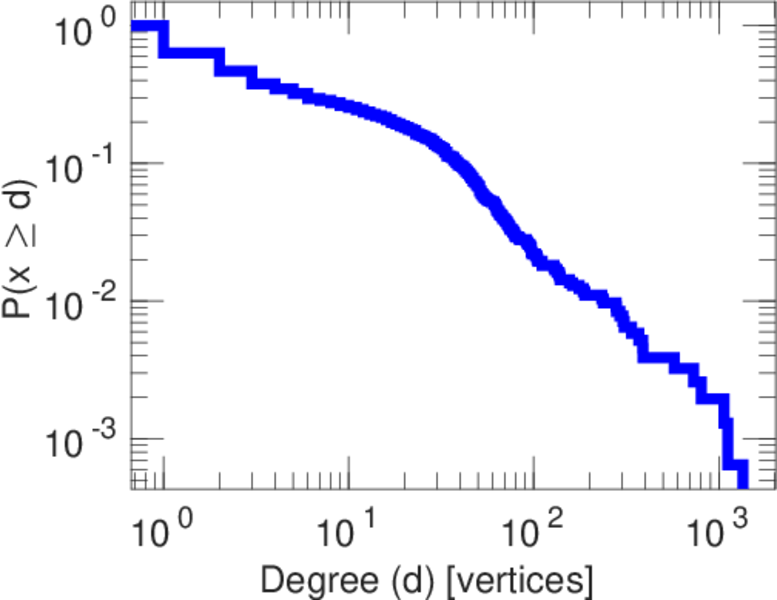
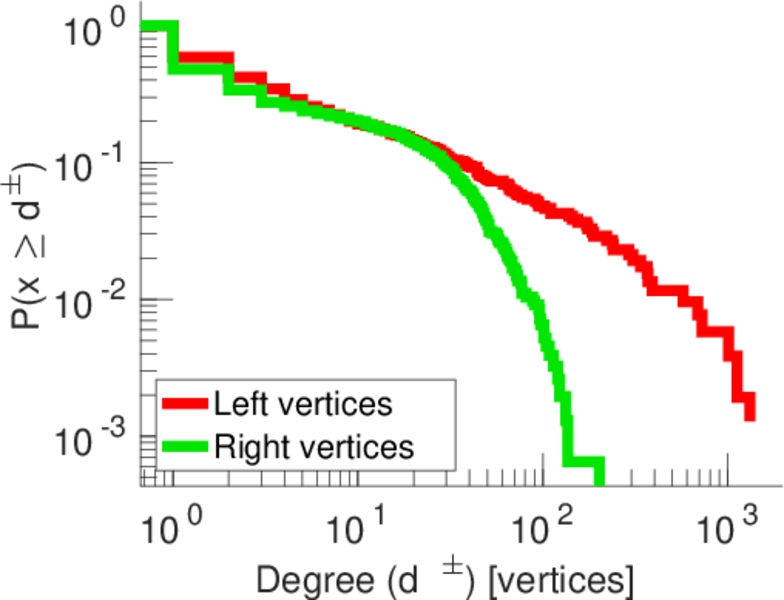
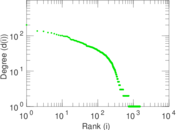
| Maximum degree | dmax = | 1,313
|
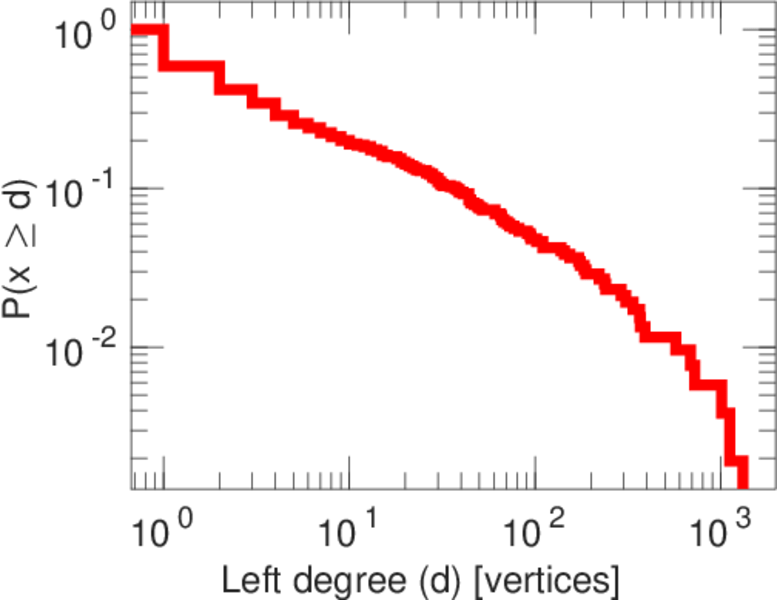
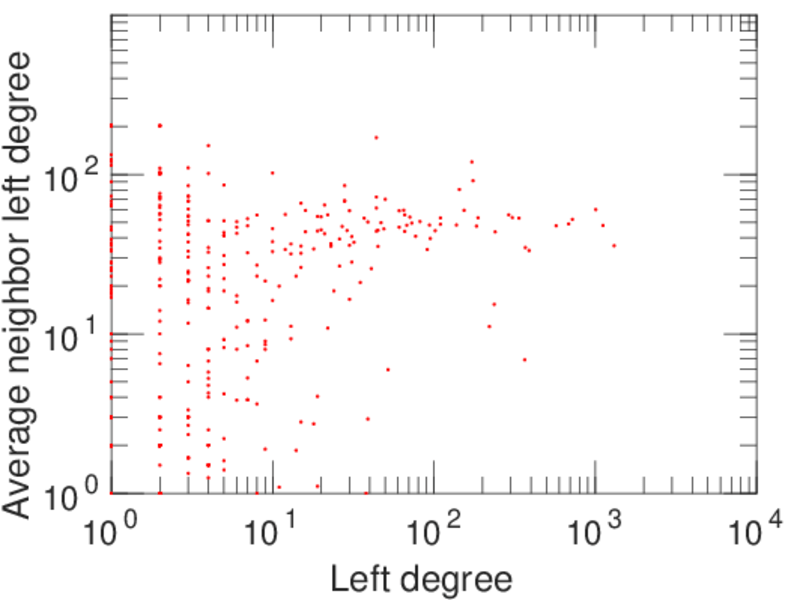
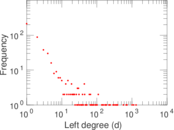
| Maximum left degree | d1max = | 1,313
|
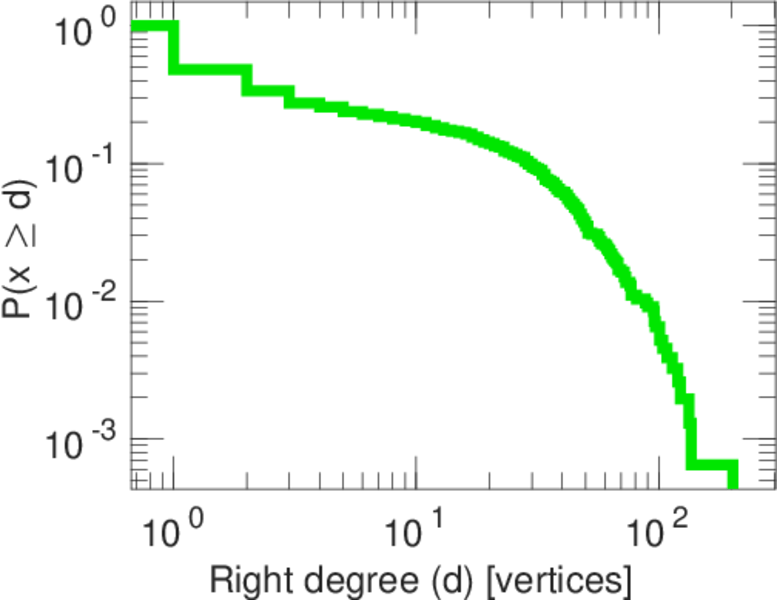
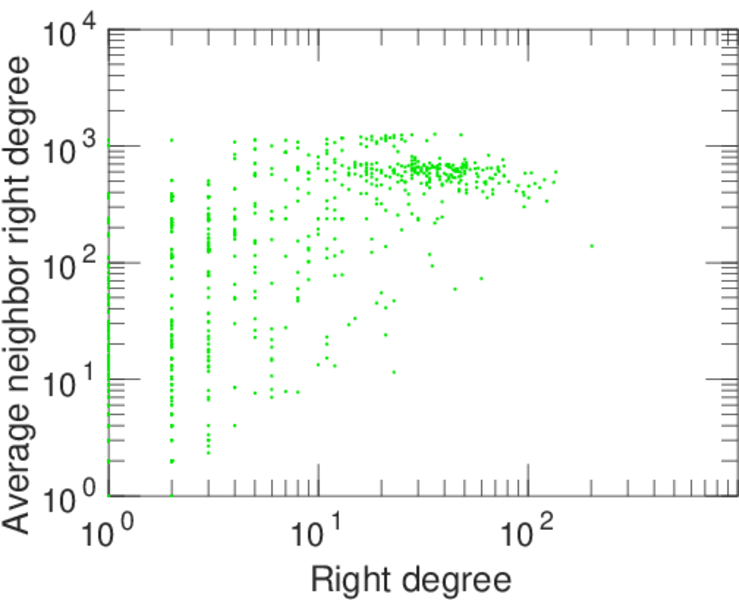
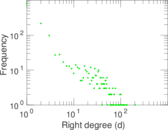
| Maximum right degree | d2max = | 202
|
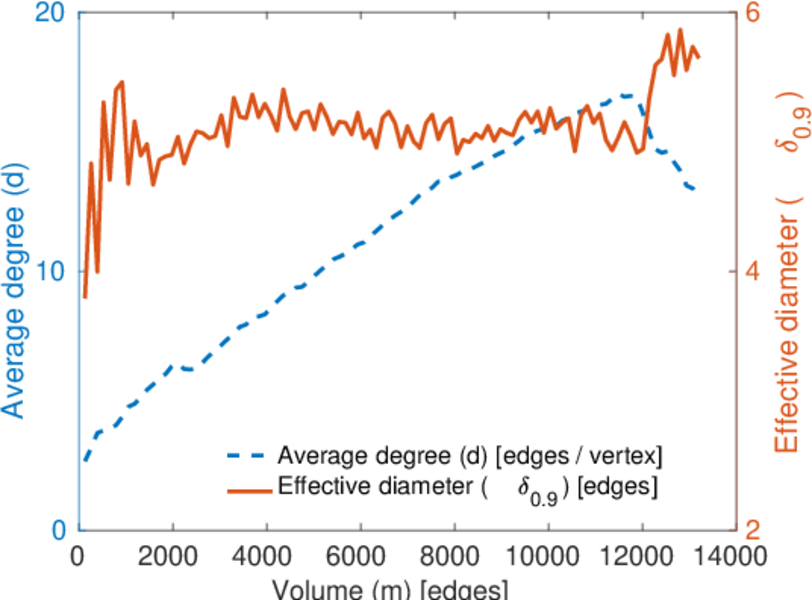
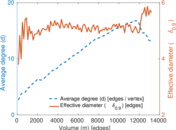
| Average degree | d = | 11.129 4
|
| Average left degree | d1 = | 25.443 2
|
| Average right degree | d2 = | 7.122 44
|
| Fill | p = | 0.006 095 24
|
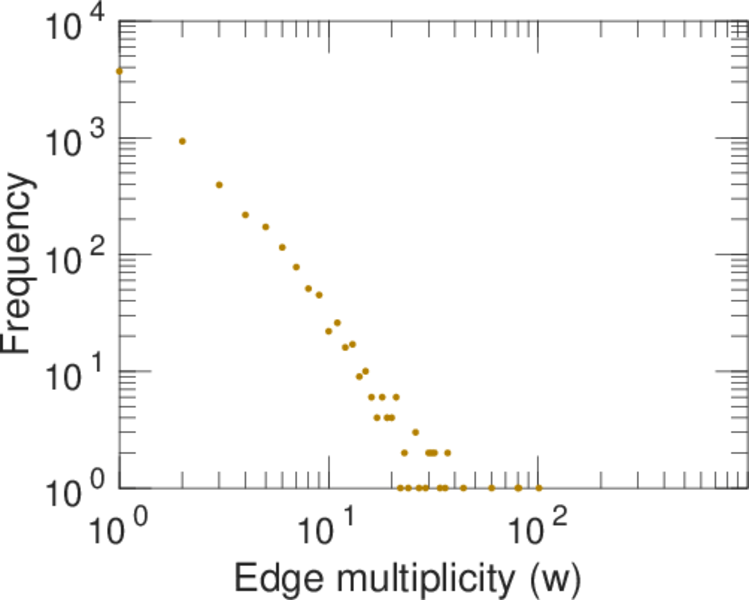
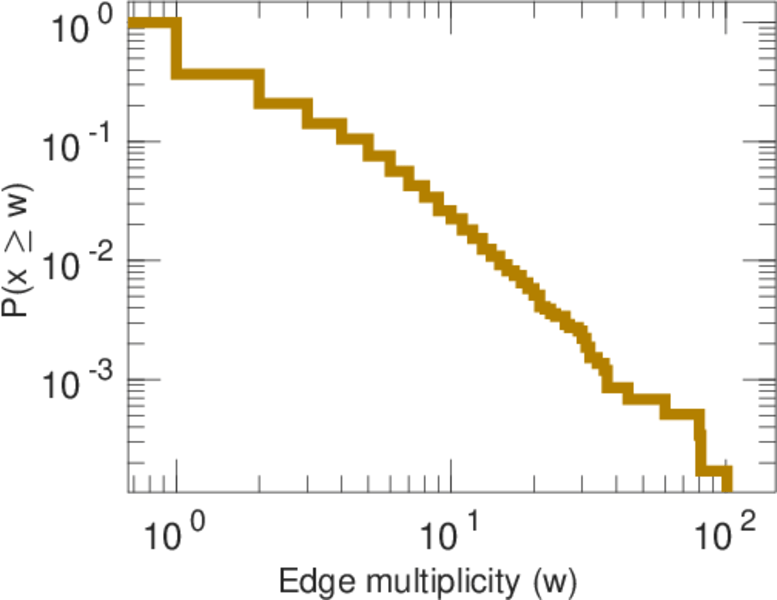
| Average edge multiplicity | m̃ = | 2.251 49
|
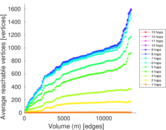
| Size of LCC | N = | 1,591
|
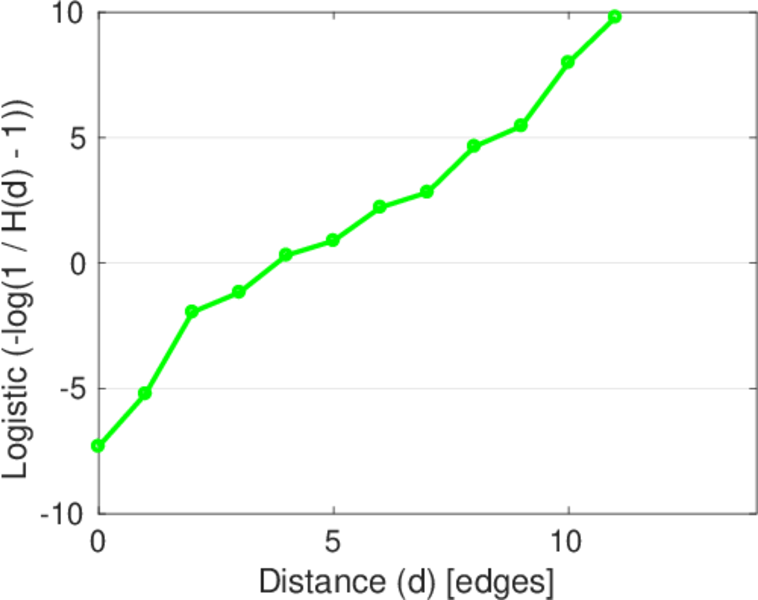
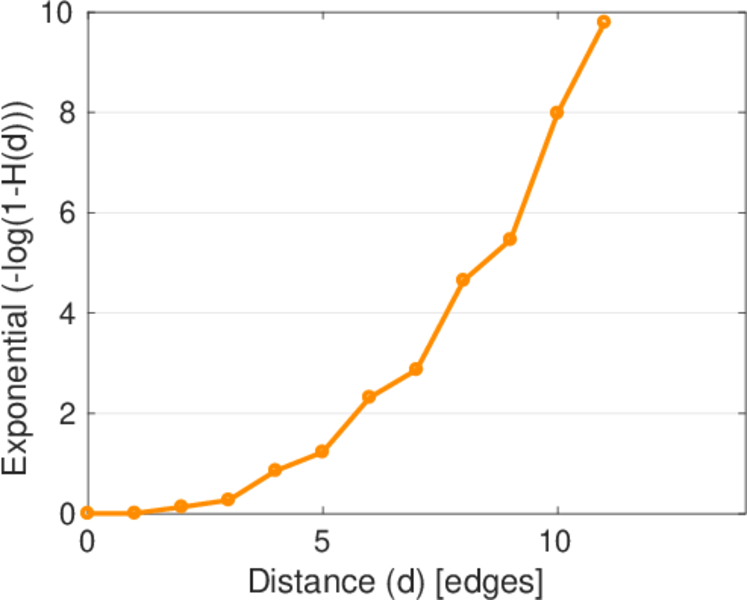
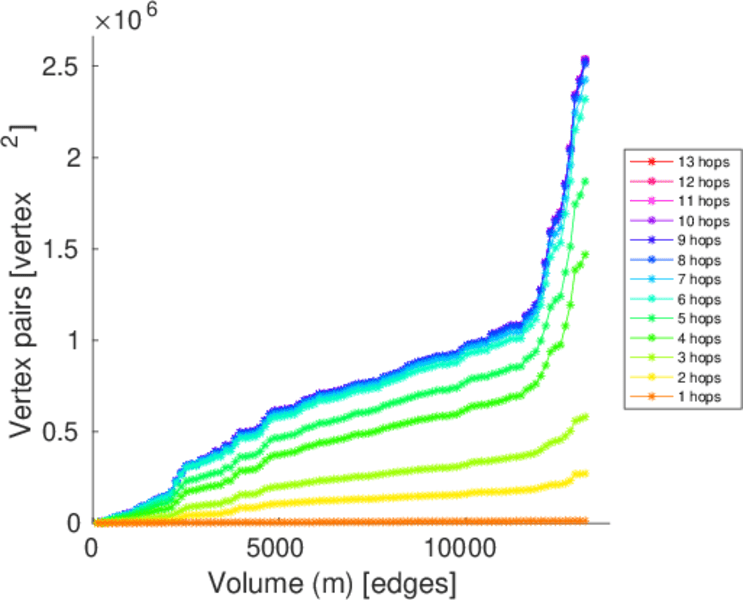
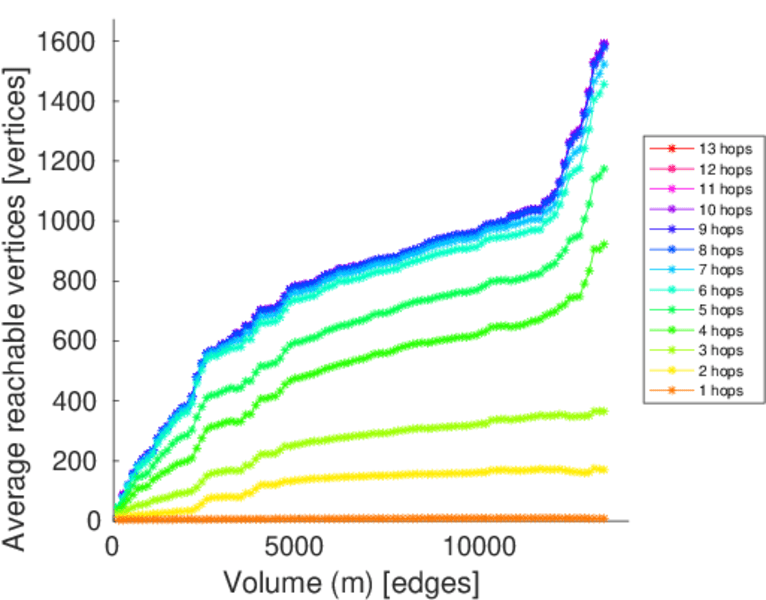
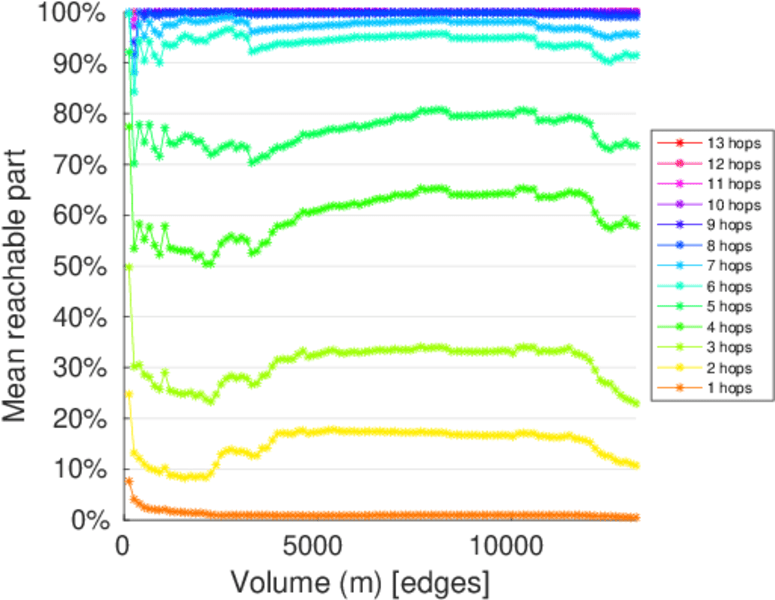
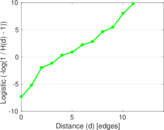
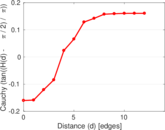
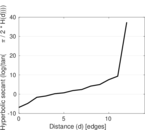
| Diameter | δ = | 13
|
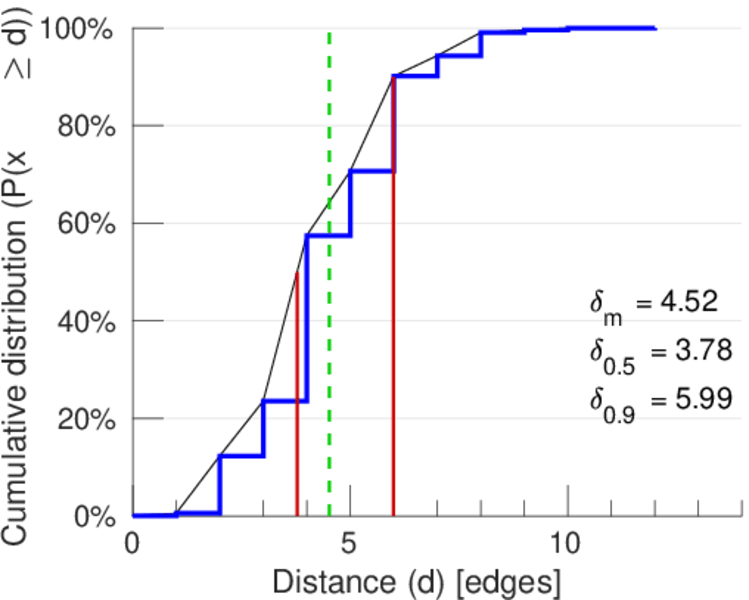
| 50-Percentile effective diameter | δ0.5 = | 3.780 26
|
| 90-Percentile effective diameter | δ0.9 = | 5.993 65
|
| Median distance | δM = | 4
|
| Mean distance | δm = | 4.524 45
|
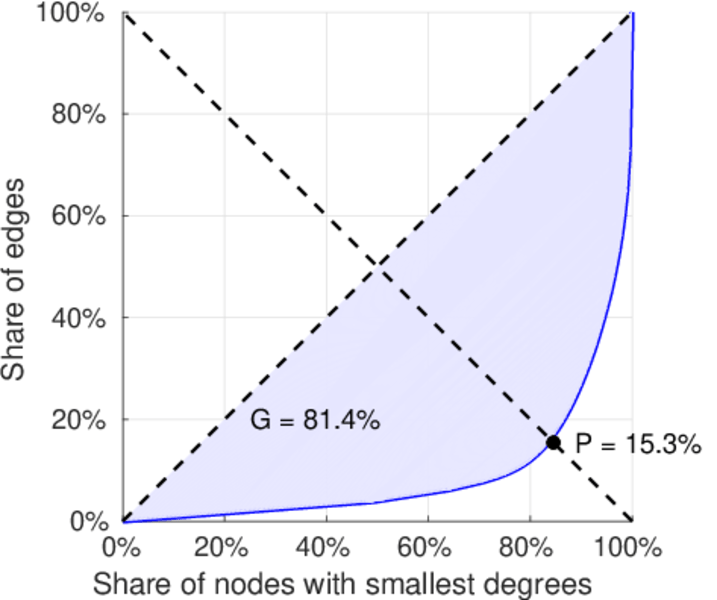
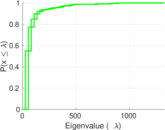
| Gini coefficient | G = | 0.802 794
|
| Balanced inequality ratio | P = | 0.172 965
|
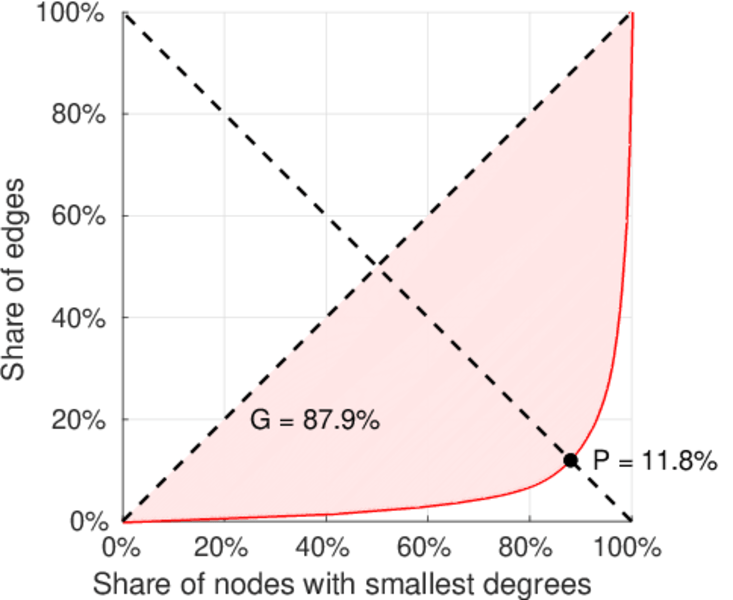
| Left balanced inequality ratio | P1 = | 0.118 137
|
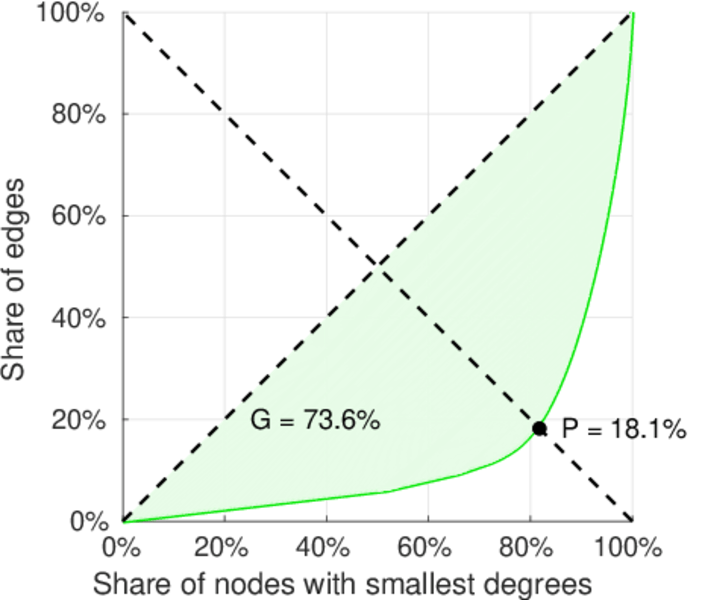
| Right balanced inequality ratio | P2 = | 0.180 613
|
| Relative edge distribution entropy | Her = | 0.822 469
|
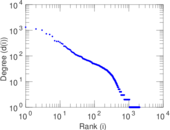
| Power law exponent | γ = | 2.427 05
|
| Tail power law exponent | γt = | 2.271 00
|
| Tail power law exponent with p | γ3 = | 2.271 00
|
| p-value | p = | 0.693 000
|
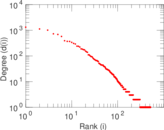
| Left tail power law exponent with p | γ3,1 = | 1.701 00
|
| Left p-value | p1 = | 0.153 000
|
| Right tail power law exponent with p | γ3,2 = | 5.021 00
|
| Right p-value | p2 = | 0.800 000
|
| Degree assortativity | ρ = | −0.045 760 2
|
| Degree assortativity p-value | pρ = | 0.000 455 651
|
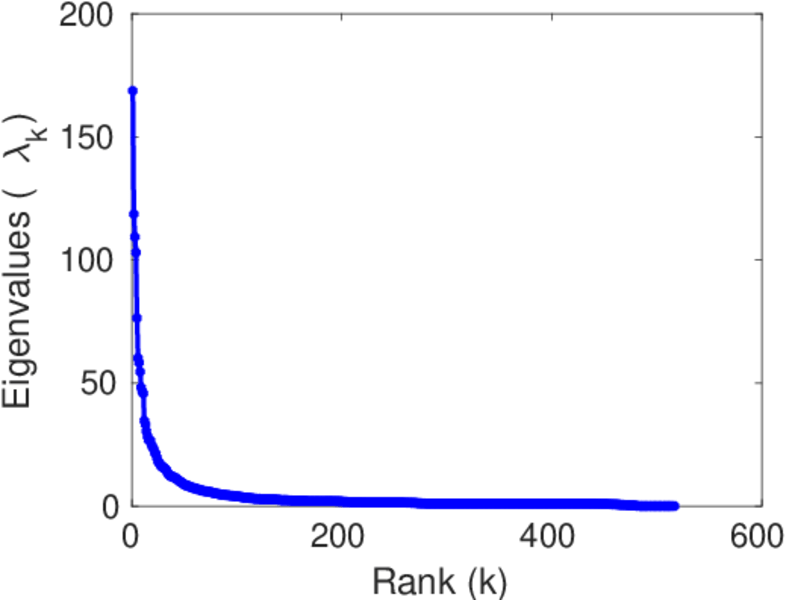
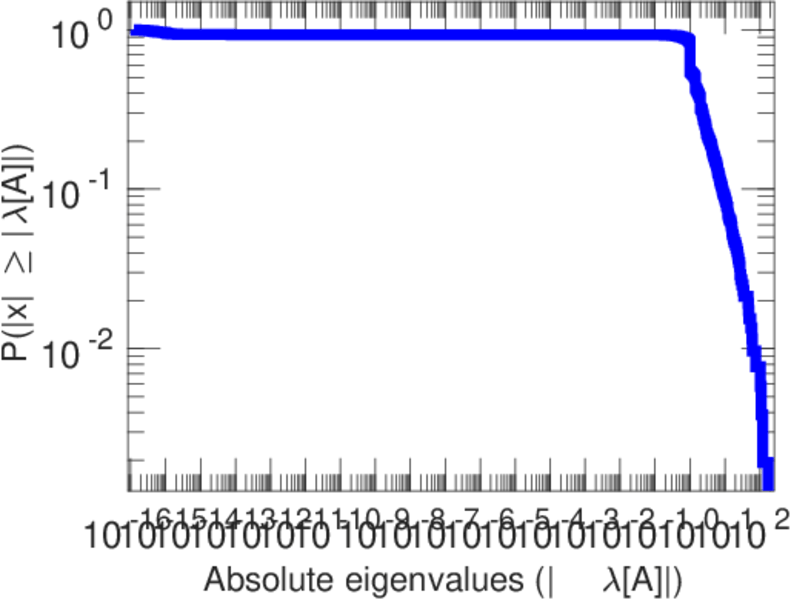
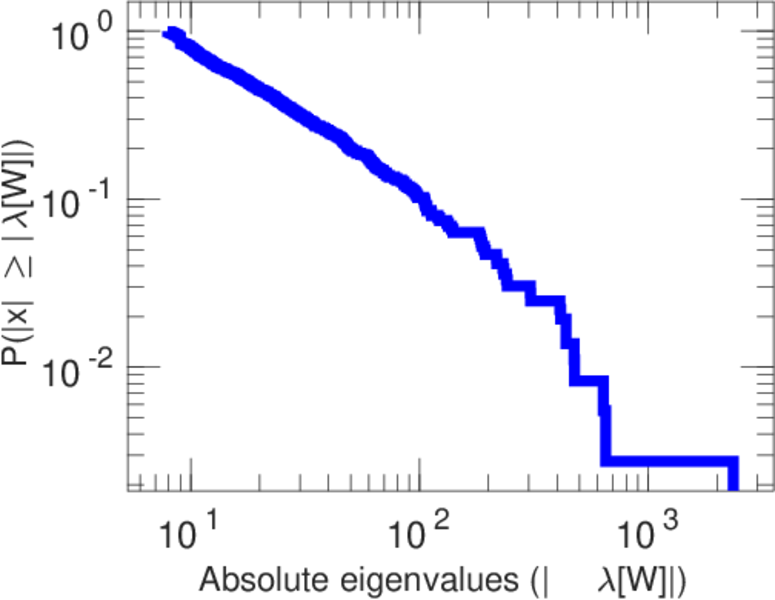
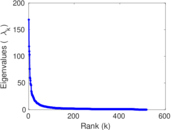
| Spectral norm | α = | 168.656
|
| Algebraic connectivity | a = | 0.015 897 3
|
| Spectral separation | |λ1[A] / λ2[A]| = | 1.422 67
|
| Controllability | C = | 1,094
|
| Relative controllability | Cr = | 0.532 101
|
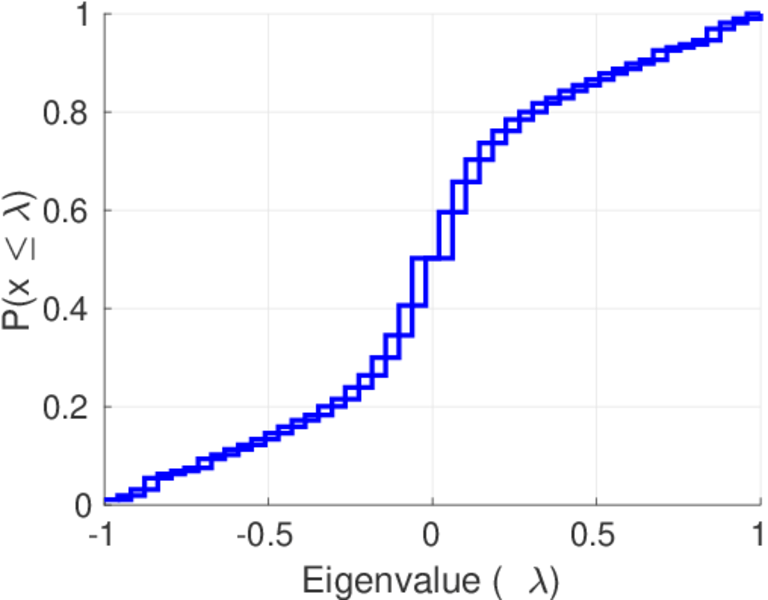
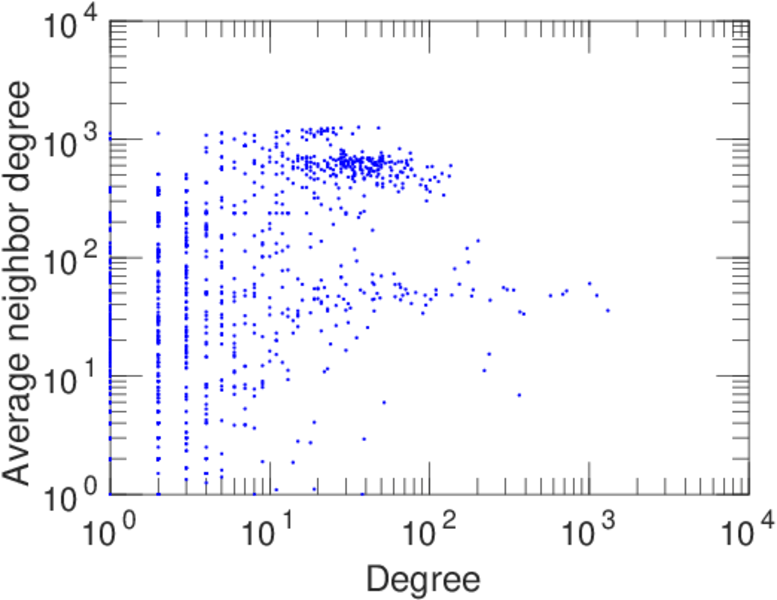
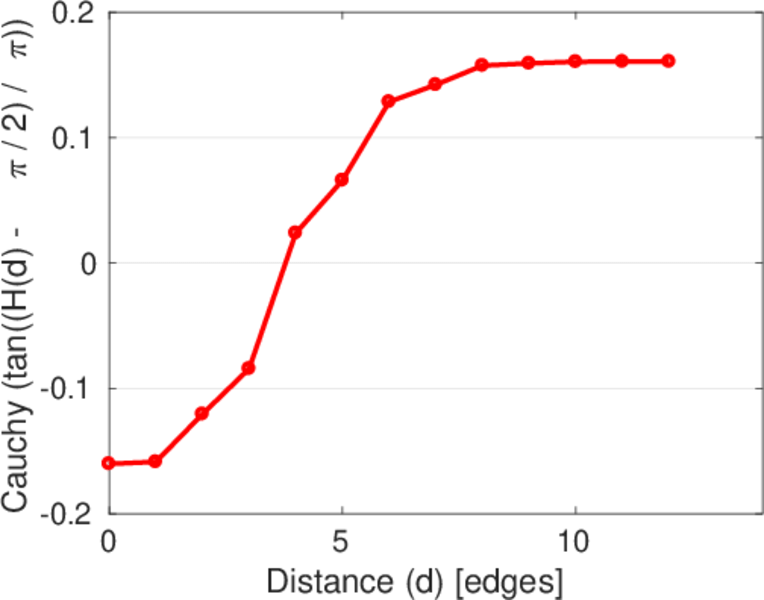
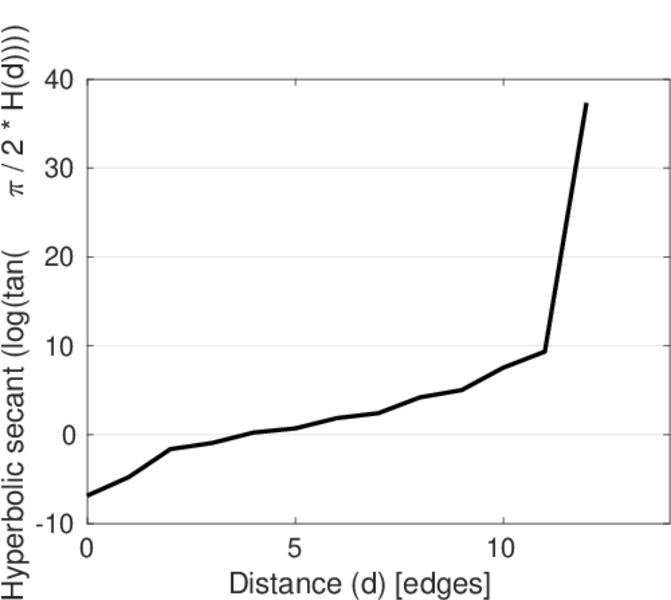
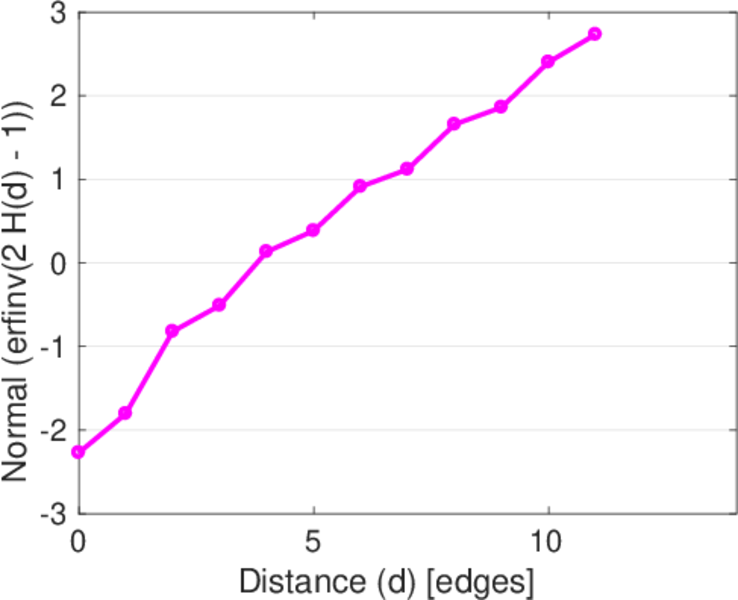
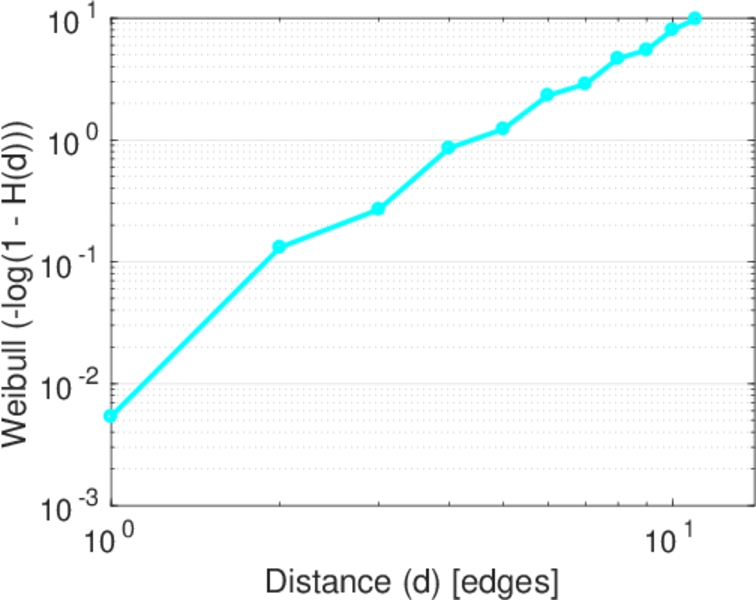
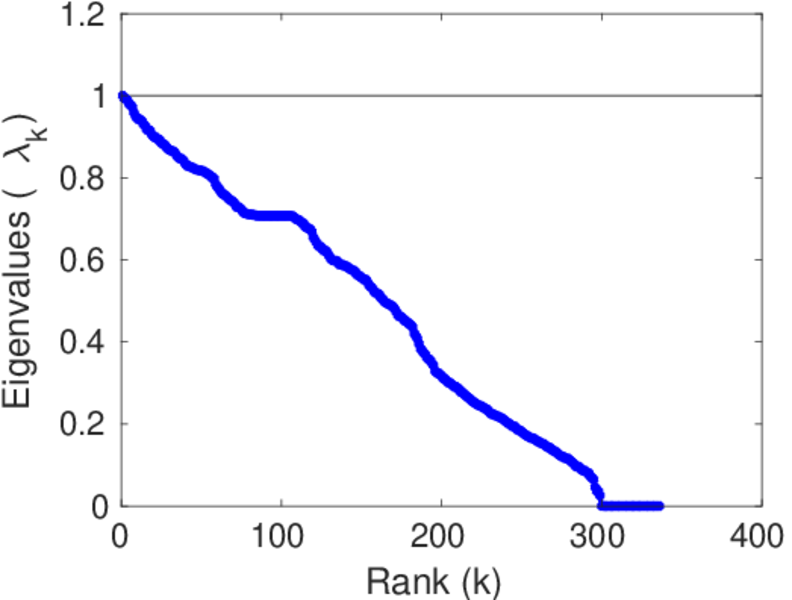
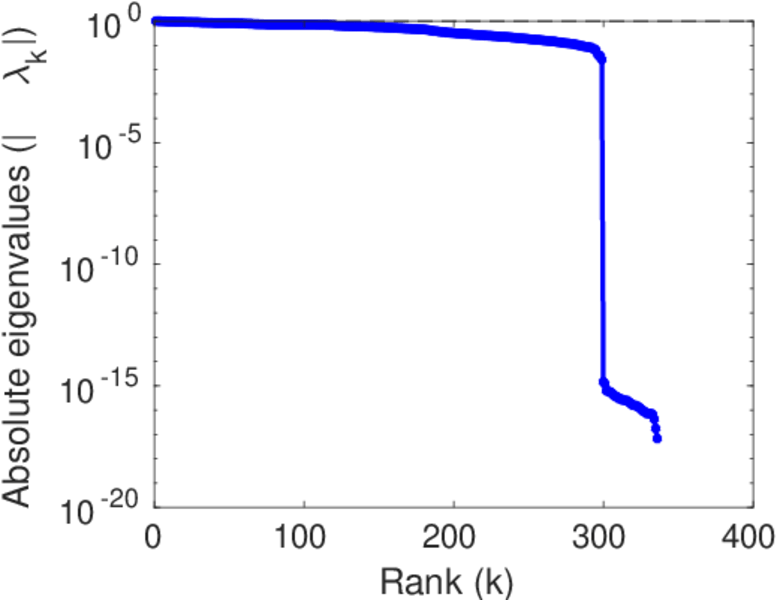
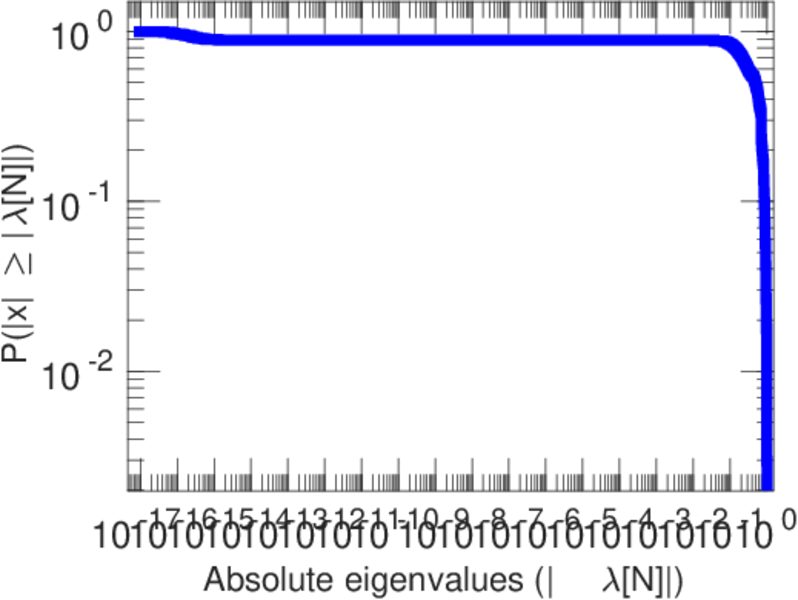
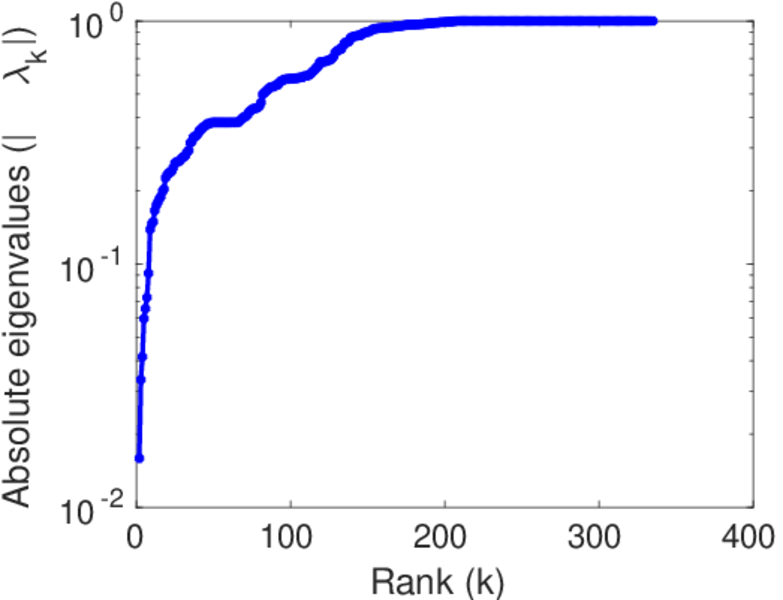
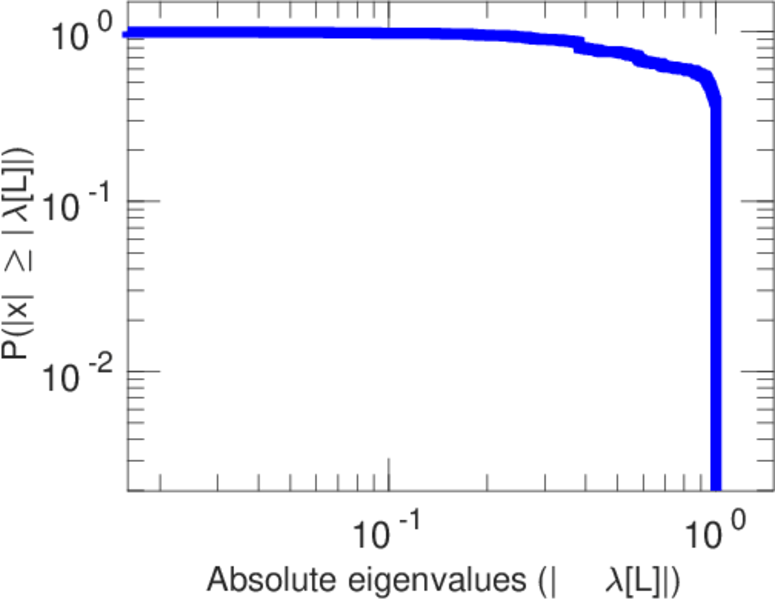
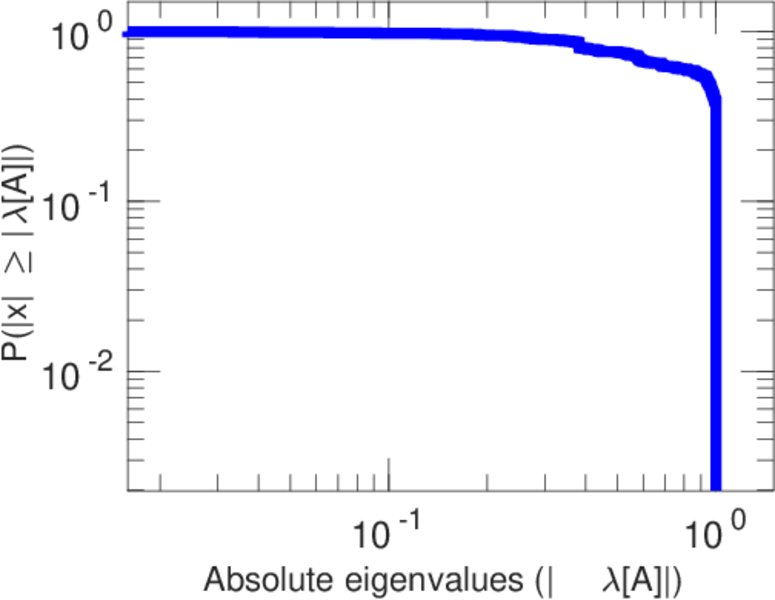
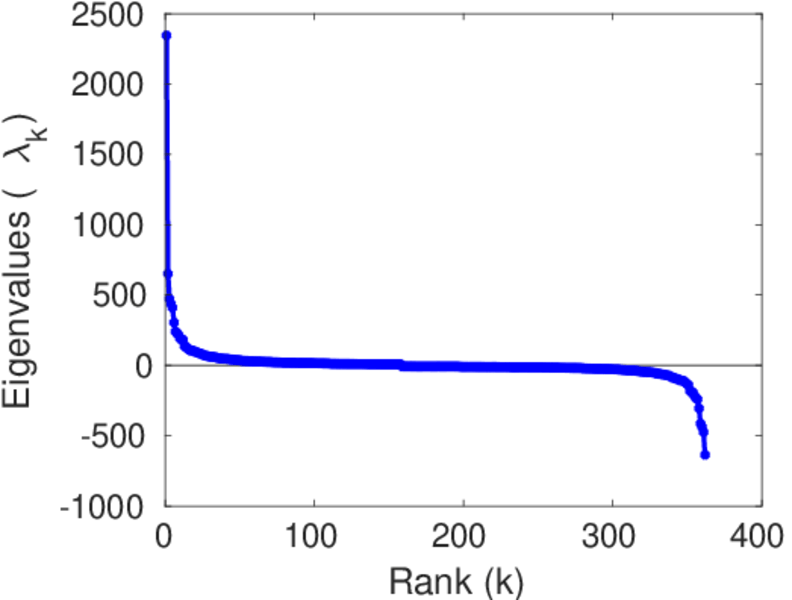
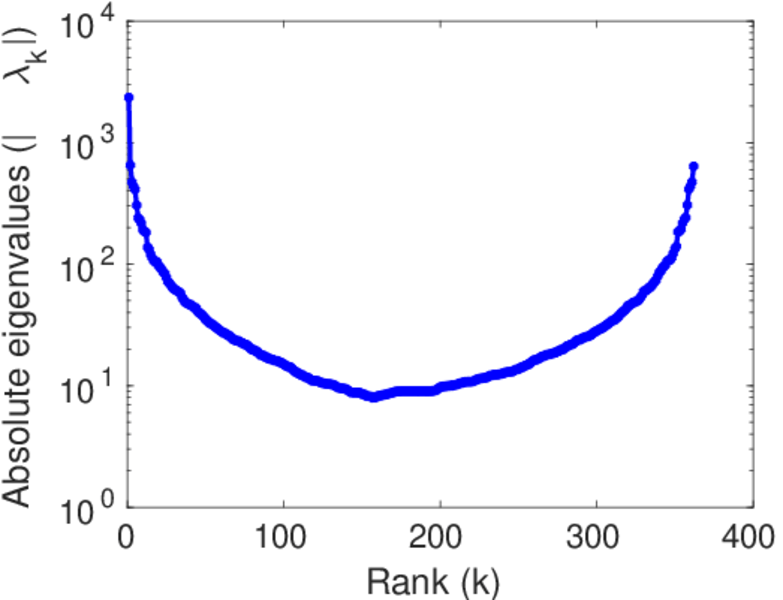
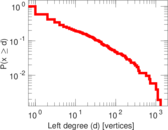
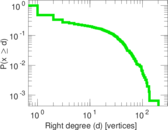
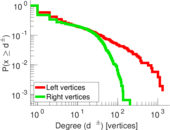
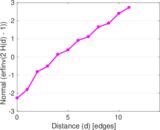
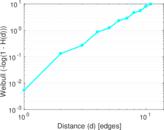
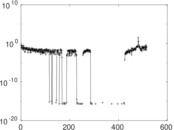
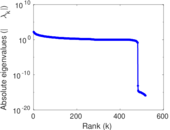
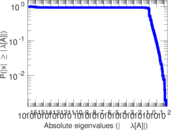
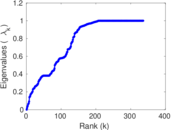
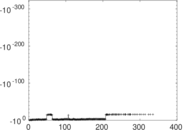
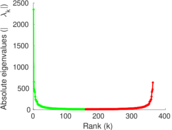
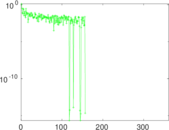
Plots


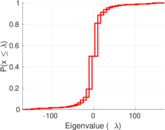

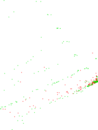


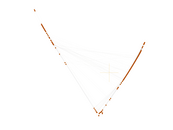


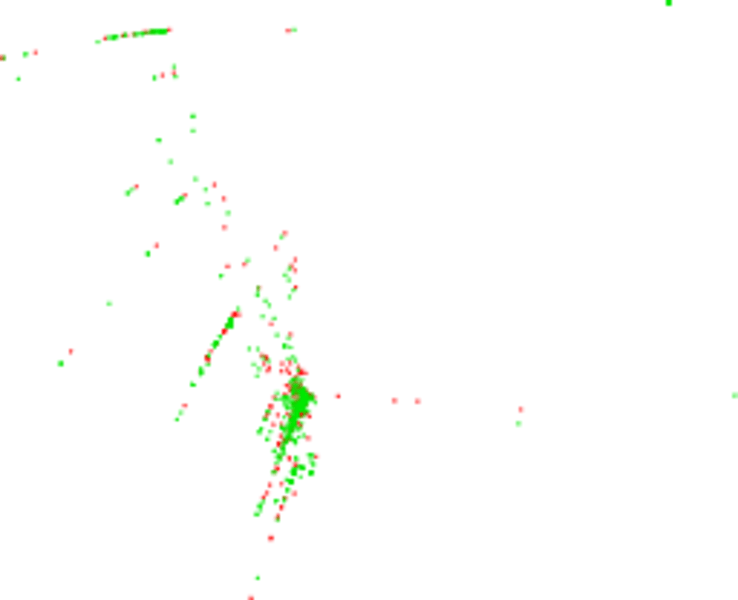
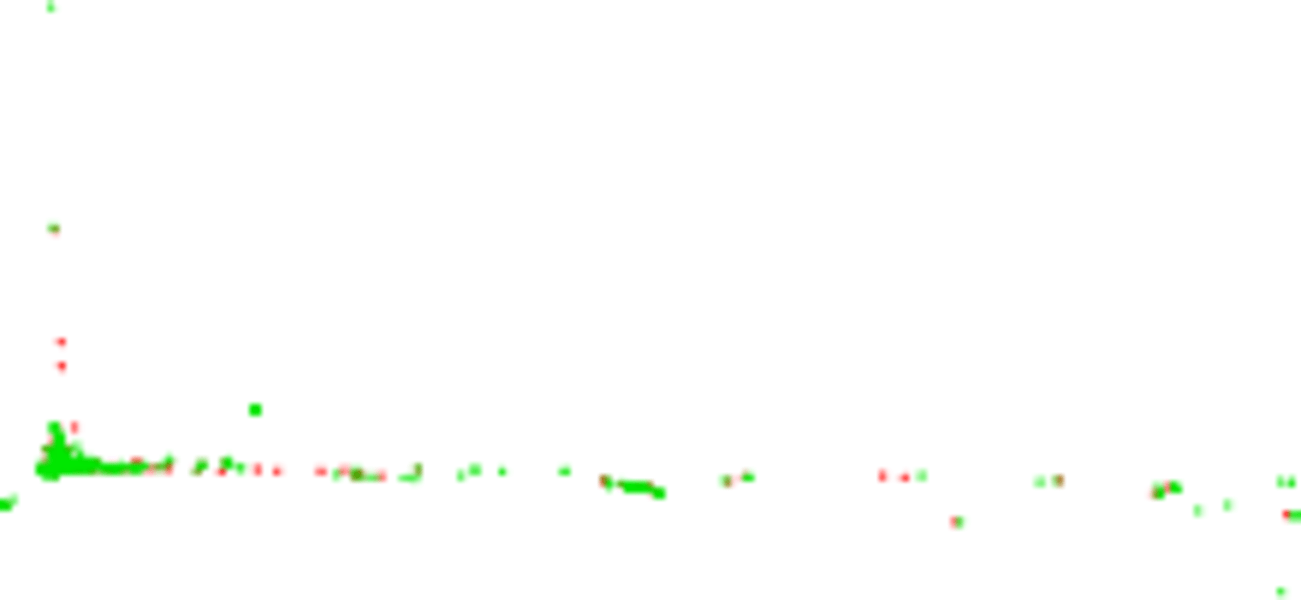
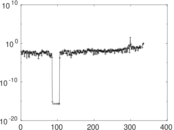
Matrix decompositions plots


Downloads
References
|
[1]
|
Jérôme Kunegis.
KONECT – The Koblenz Network Collection.
In Proc. Int. Conf. on World Wide Web Companion, pages
1343–1350, 2013.
[ http ]
|
|
[2]
|
Wikimedia Foundation.
Wikimedia downloads.
http://dumps.wikimedia.org/, January 2010.
|
 KONECT ‣ Networks ‣
Buy Me a Coffee
KONECT ‣ Networks ‣
Buy Me a Coffee