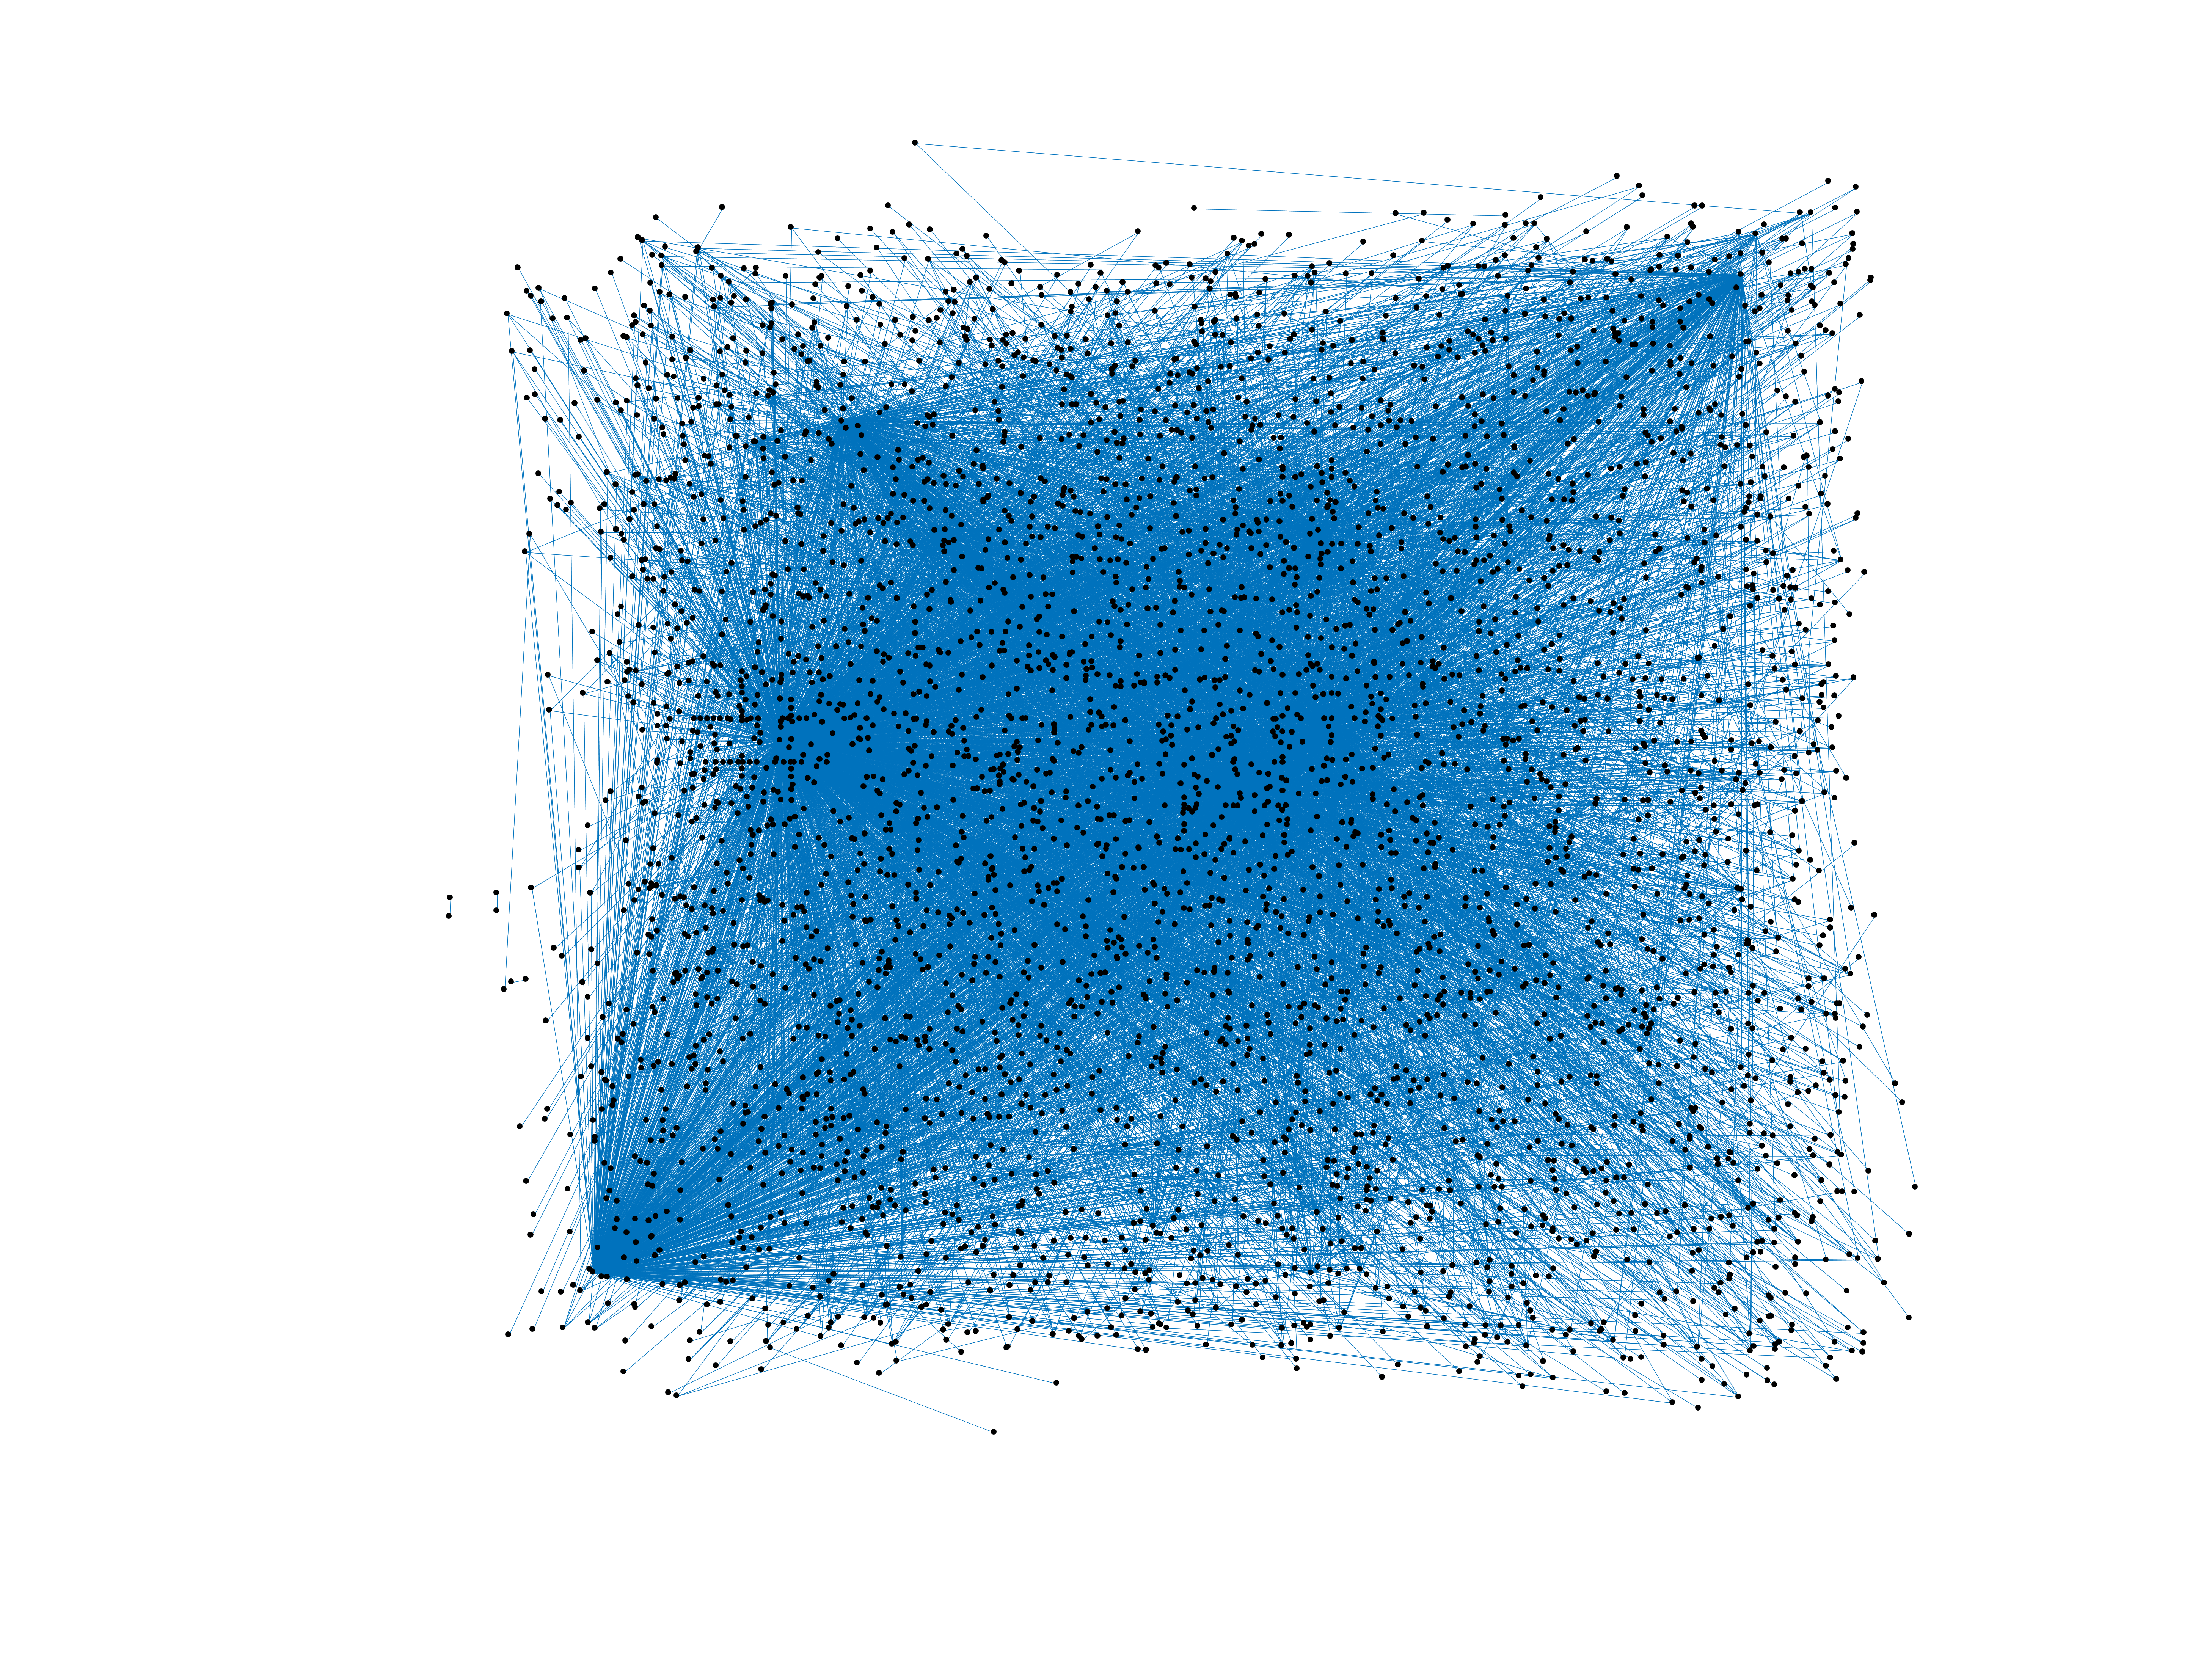
Wikipedia edits (tyv)
This is the bipartite edit network of the Tuvinian Wikipedia. It contains users
and pages from the Tuvinian Wikipedia, connected by edit events. Each edge
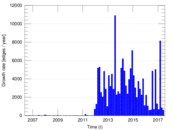
represents an edit. The dataset includes the timestamp of each edit.
Metadata
Statistics
| Size | n = | 4,156
|
| Left size | n1 = | 377
|
| Right size | n2 = | 3,779
|
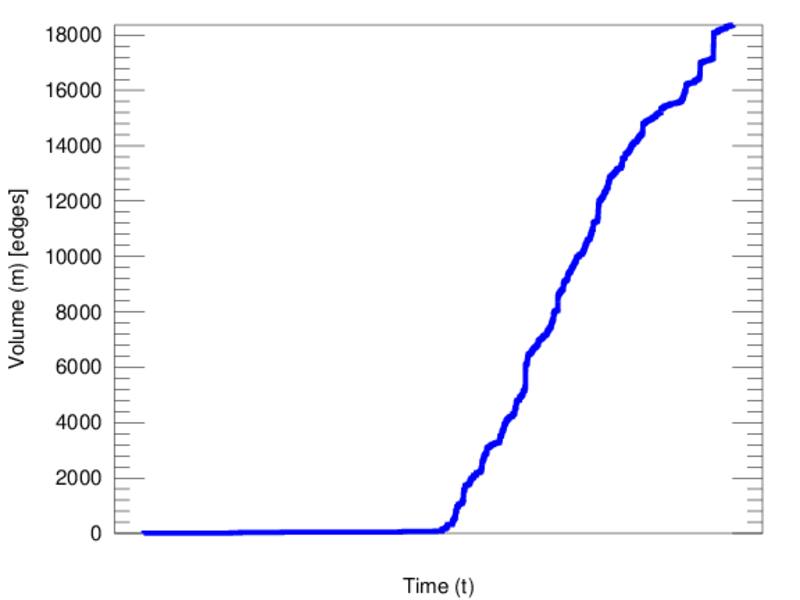
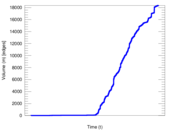
| Volume | m = | 18,361
|
| Unique edge count | m̿ = | 8,161
|
| Wedge count | s = | 3,170,466
|
| Claw count | z = | 1,617,125,553
|
| Cross count | x = | 747,169,496,667
|
| Square count | q = | 587,929
|
| 4-Tour count | T4 = | 17,407,862
|
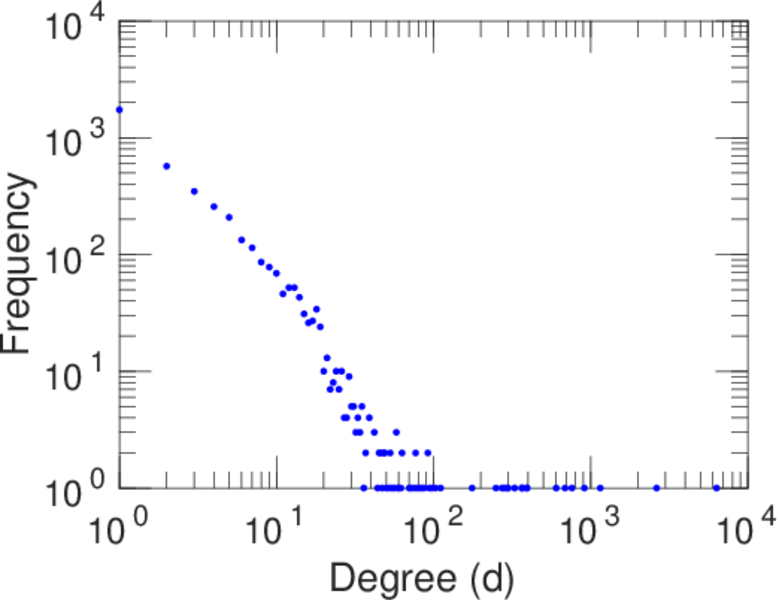
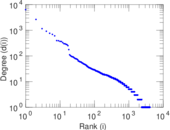
| Maximum degree | dmax = | 6,346
|
| Maximum left degree | d1max = | 6,346
|
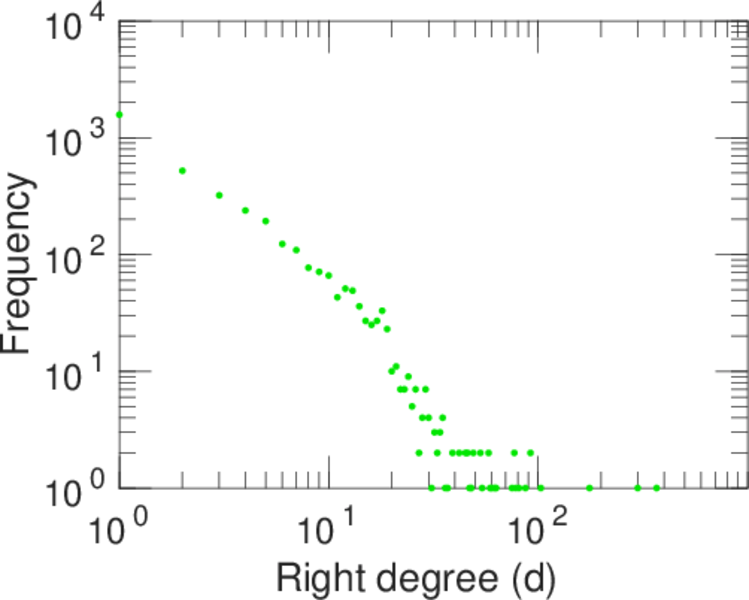
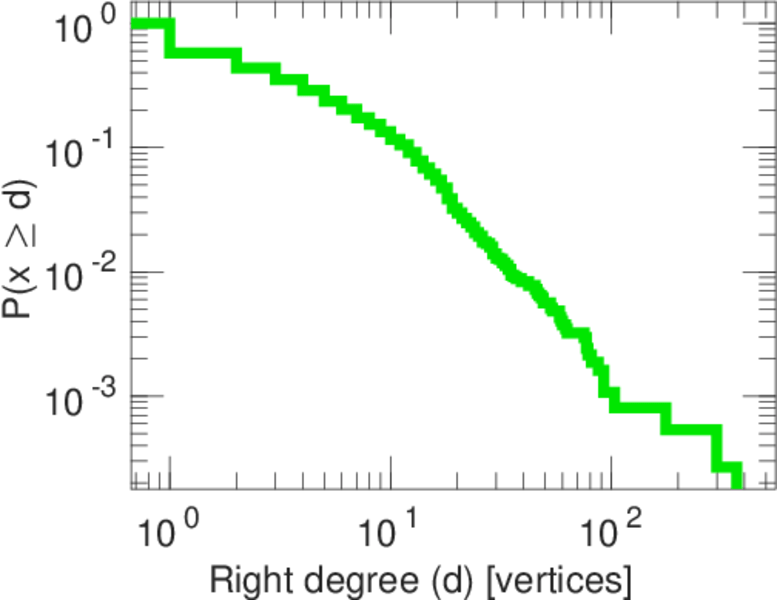
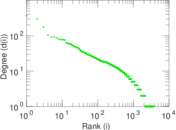
| Maximum right degree | d2max = | 368
|
| Average degree | d = | 8.835 90
|
| Average left degree | d1 = | 48.702 9
|
| Average right degree | d2 = | 4.858 69
|
| Fill | p = | 0.005 728 29
|
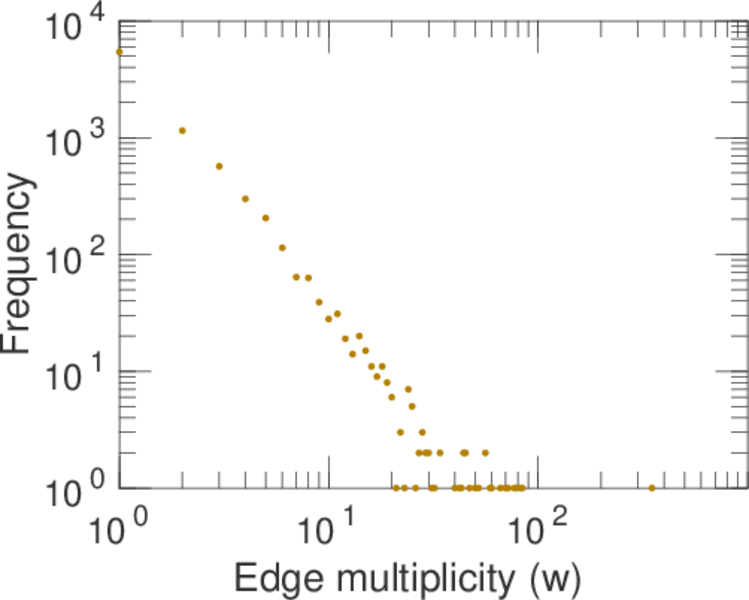
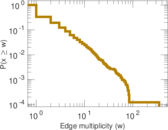
| Average edge multiplicity | m̃ = | 2.249 85
|
| Size of LCC | N = | 3,913
|
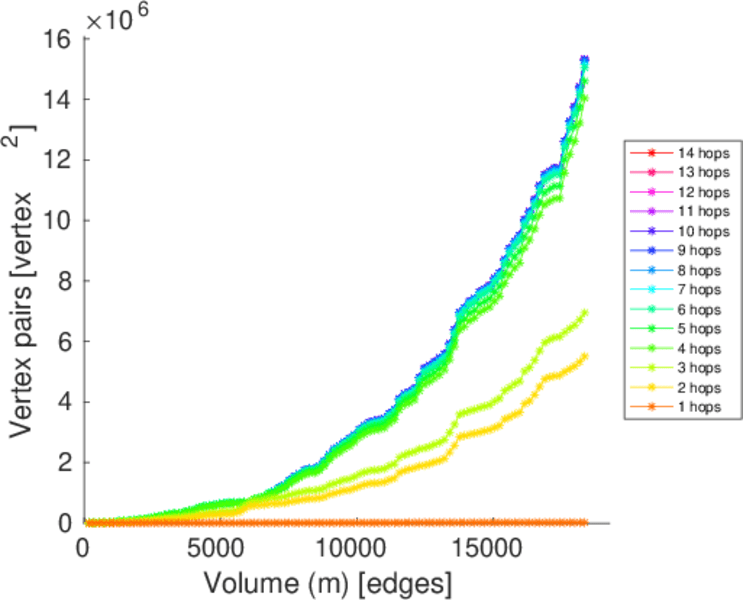
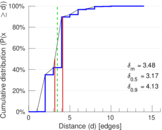
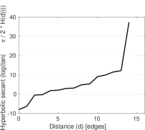
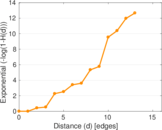
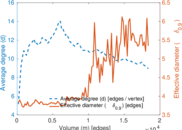
| Diameter | δ = | 14
|
| 50-Percentile effective diameter | δ0.5 = | 3.171 58
|
| 90-Percentile effective diameter | δ0.9 = | 4.133 57
|
| Median distance | δM = | 4
|
| Mean distance | δm = | 3.481 49
|
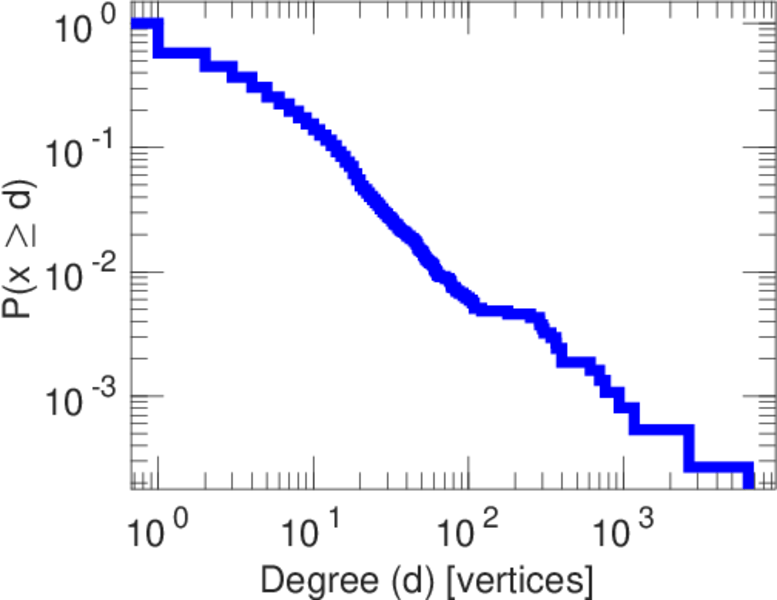
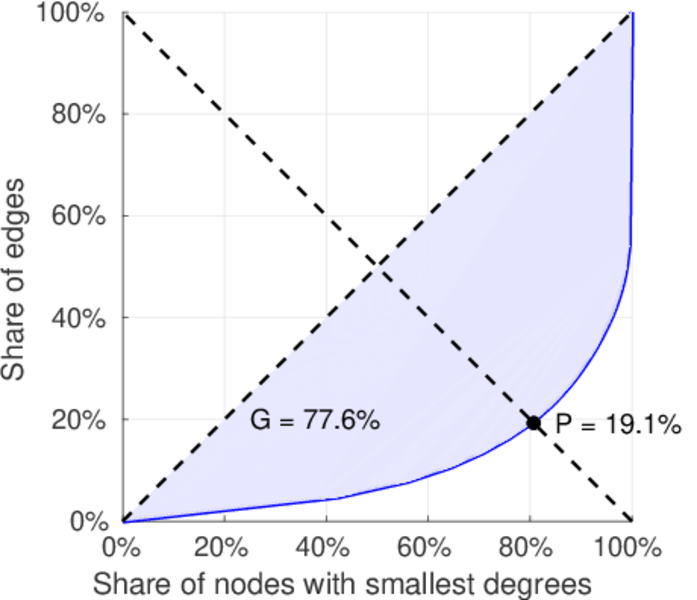
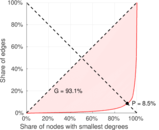
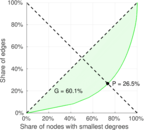
| Gini coefficient | G = | 0.786 598
|
| Balanced inequality ratio | P = | 0.188 525
|
| Left balanced inequality ratio | P1 = | 0.084 853 8
|
| Right balanced inequality ratio | P2 = | 0.265 018
|
| Relative edge distribution entropy | Her = | 0.759 484
|
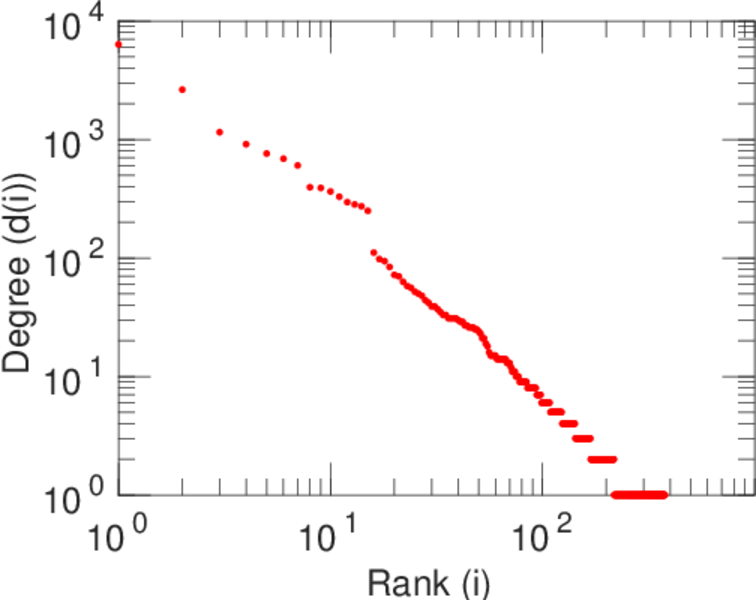
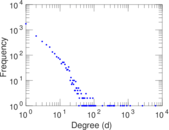
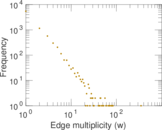
| Power law exponent | γ = | 2.793 53
|
| Tail power law exponent | γt = | 1.771 00
|
| Tail power law exponent with p | γ3 = | 1.771 00
|
| p-value | p = | 0.430 000
|
| Left tail power law exponent with p | γ3,1 = | 1.661 00
|
| Left p-value | p1 = | 0.710 000
|
| Right tail power law exponent with p | γ3,2 = | 6.051 00
|
| Right p-value | p2 = | 0.076 000 0
|
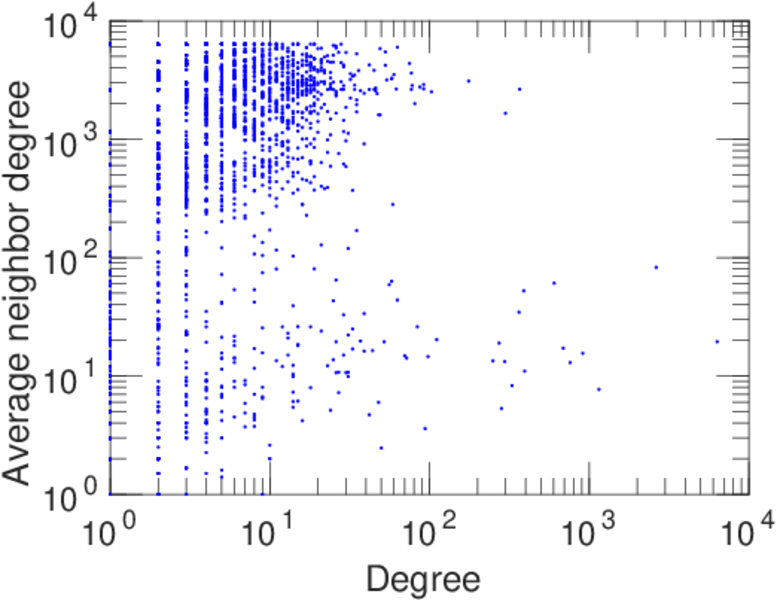
| Degree assortativity | ρ = | −0.259 253
|
| Degree assortativity p-value | pρ = | 1.825 77 × 10−125
|
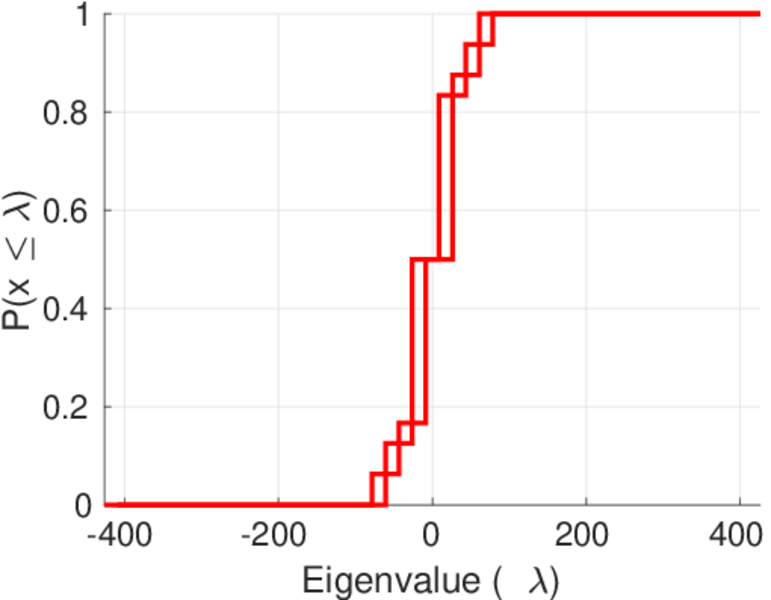
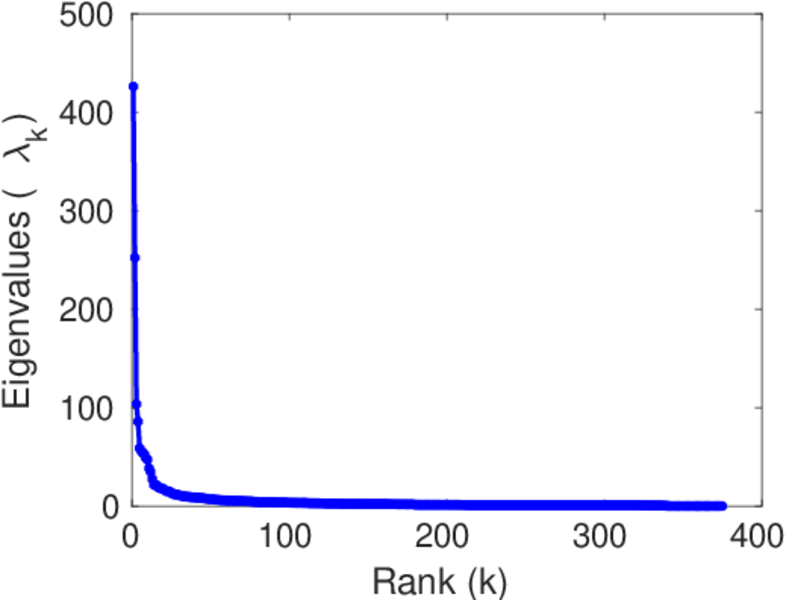
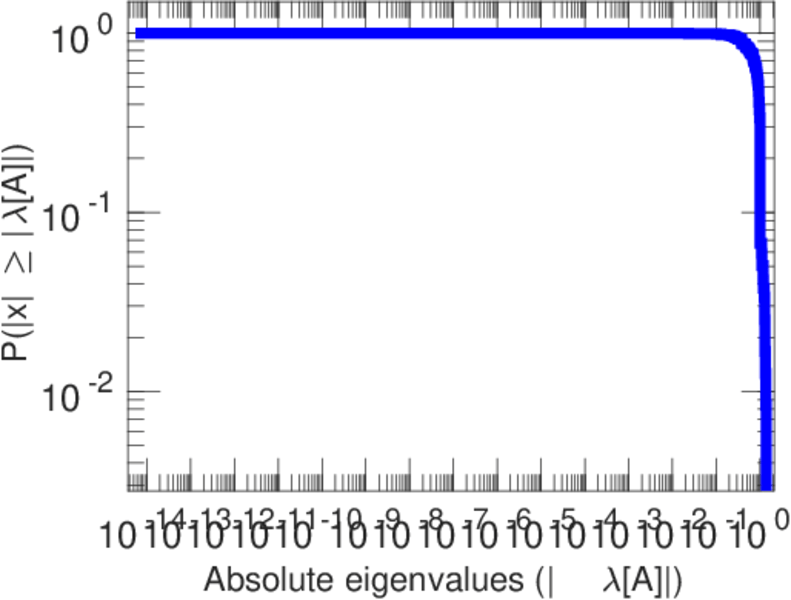
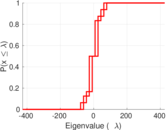
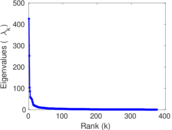
| Spectral norm | α = | 426.091
|
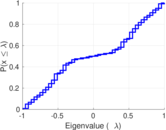
| Algebraic connectivity | a = | 0.023 209 2
|
| Spectral separation | |λ1[A] / λ2[A]| = | 1.689 59
|
| Controllability | C = | 3,425
|
| Relative controllability | Cr = | 0.834 348
|
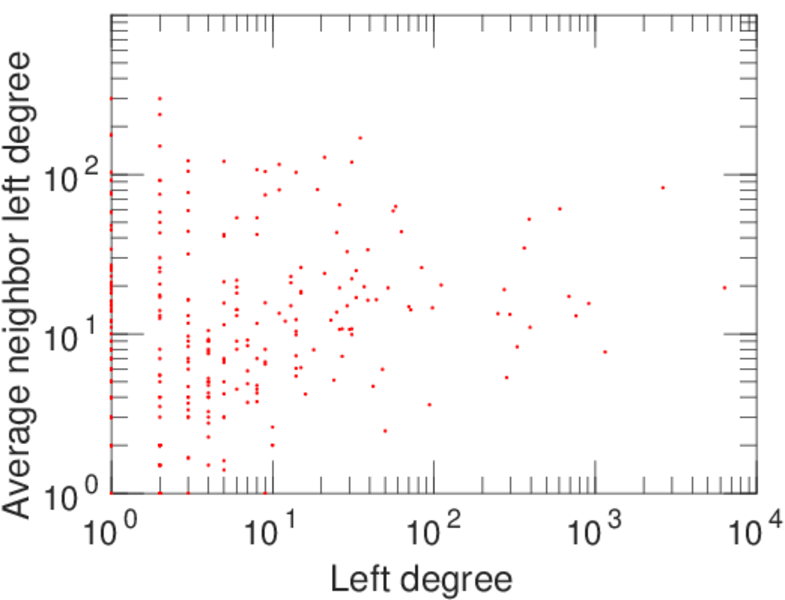
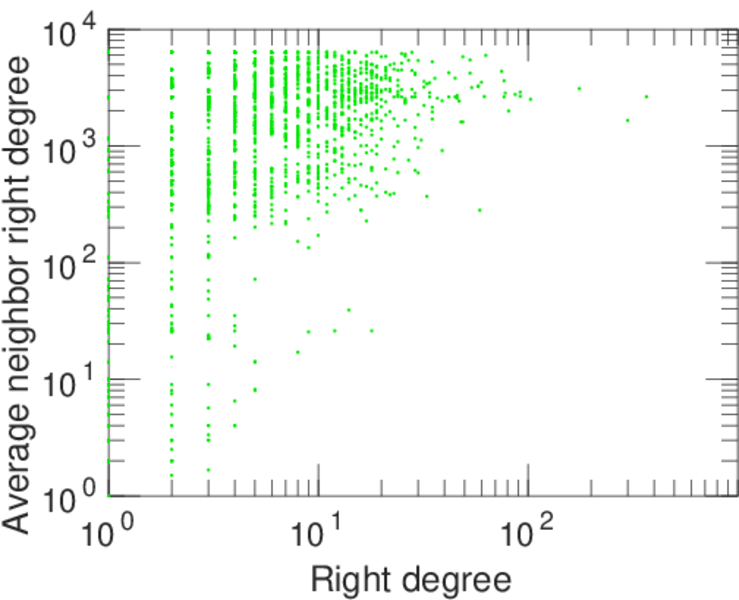
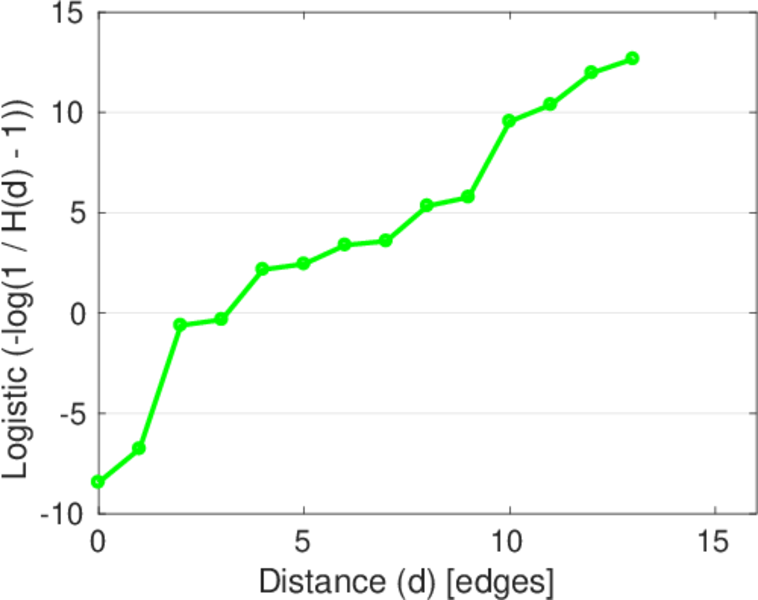
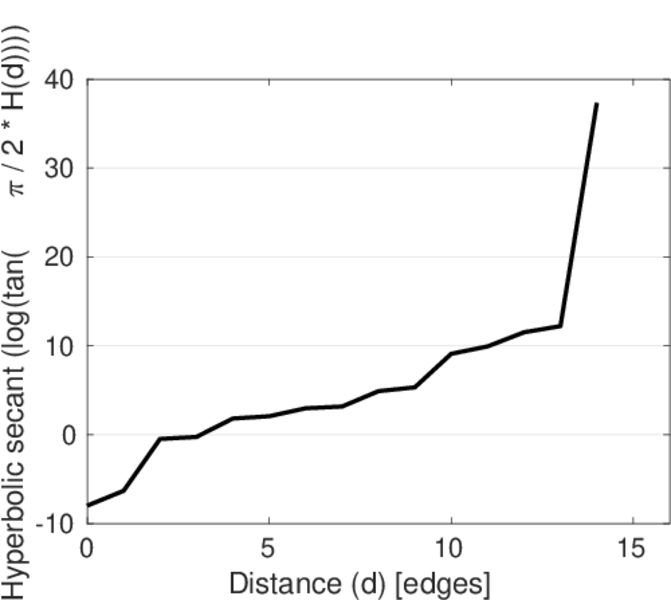
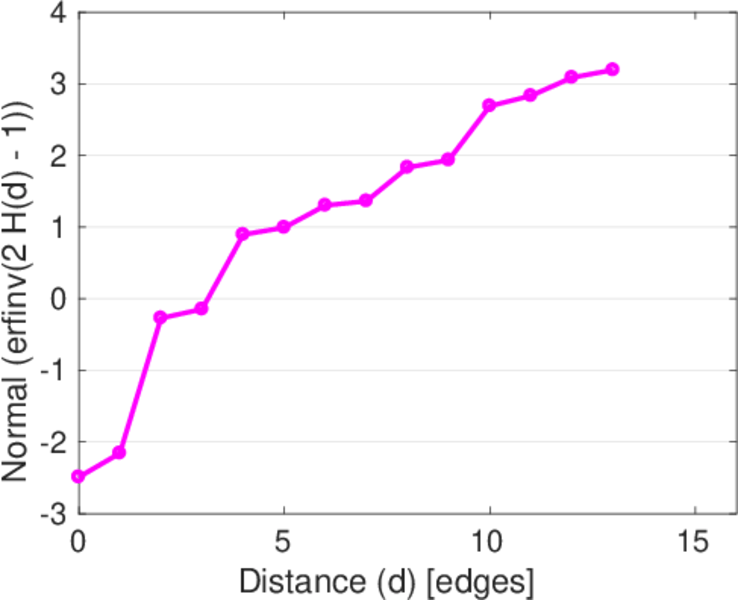
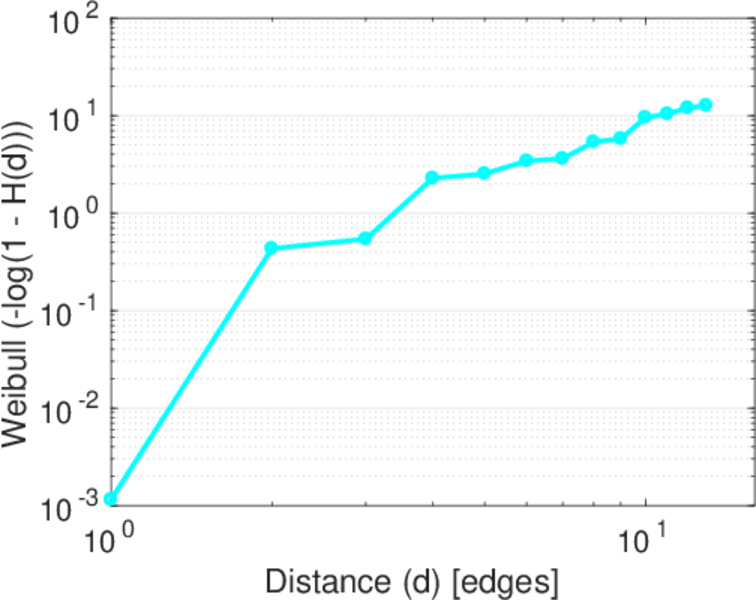
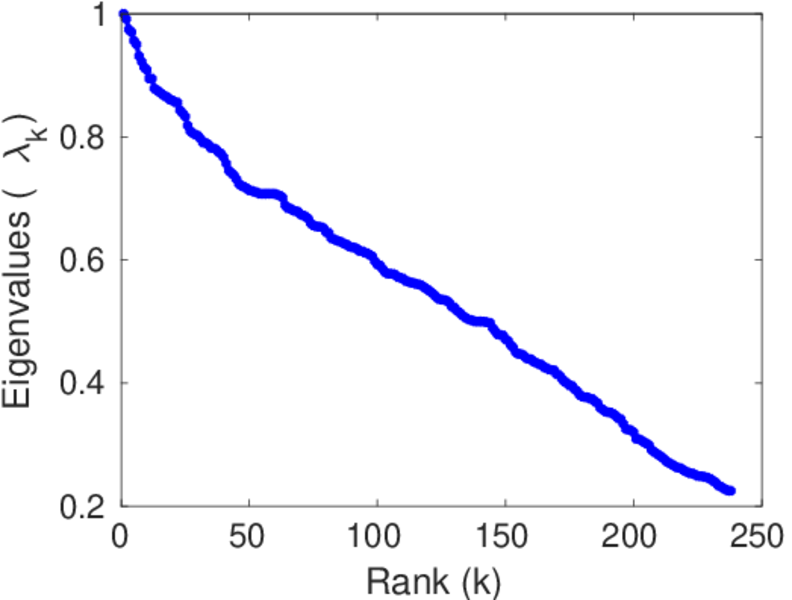
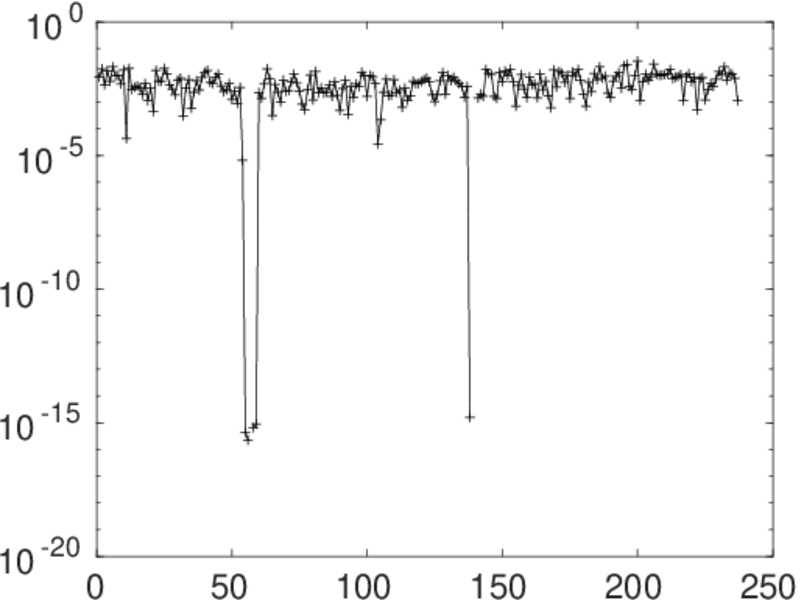
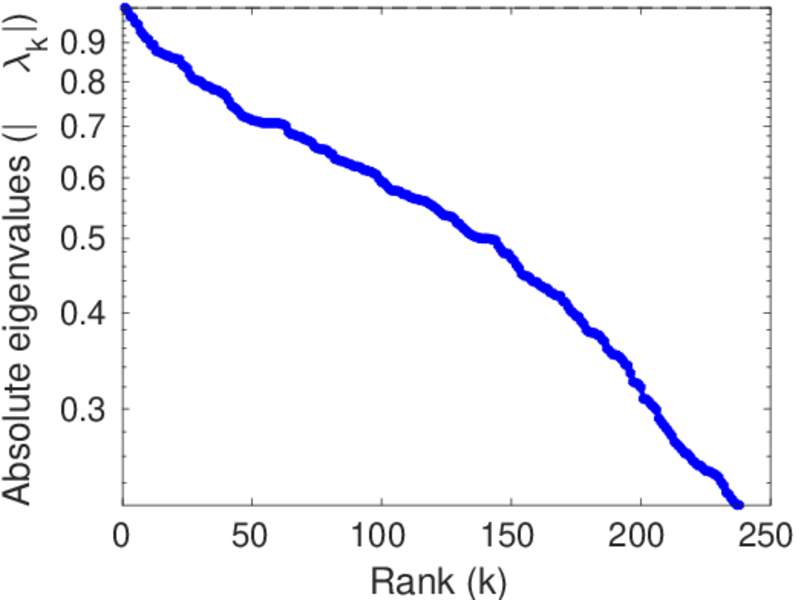
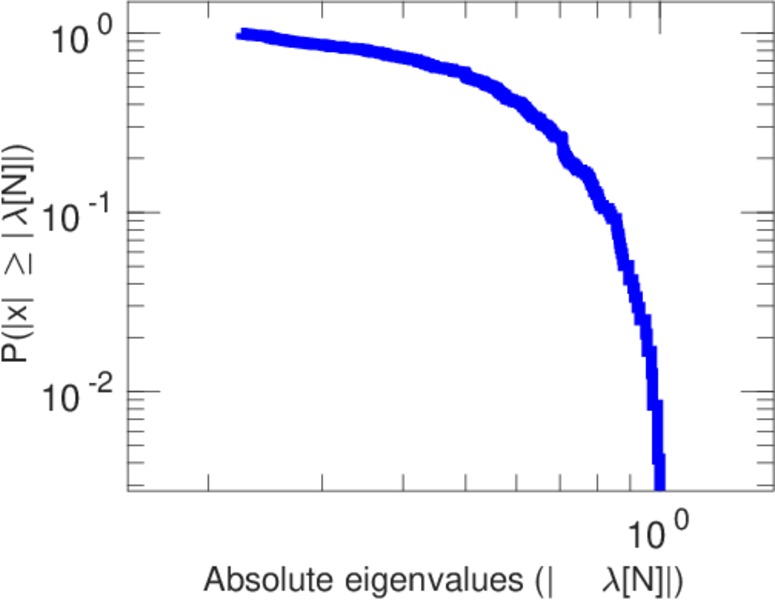
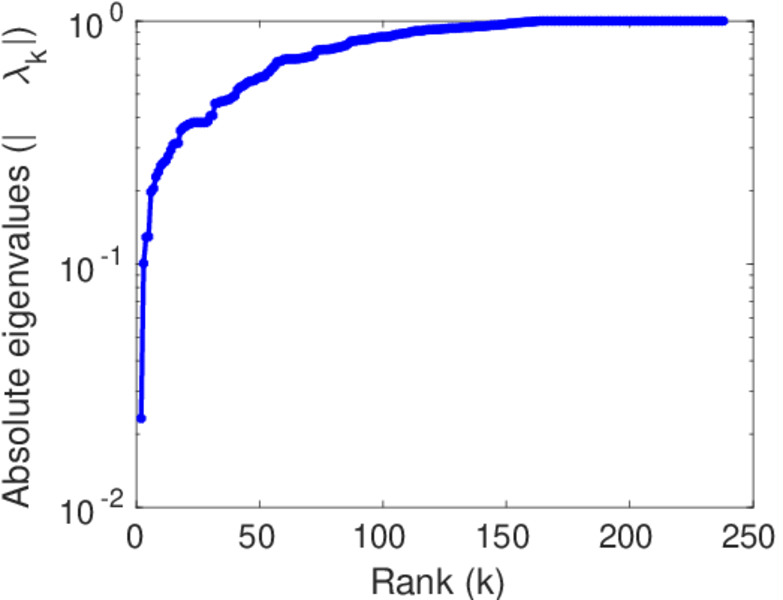
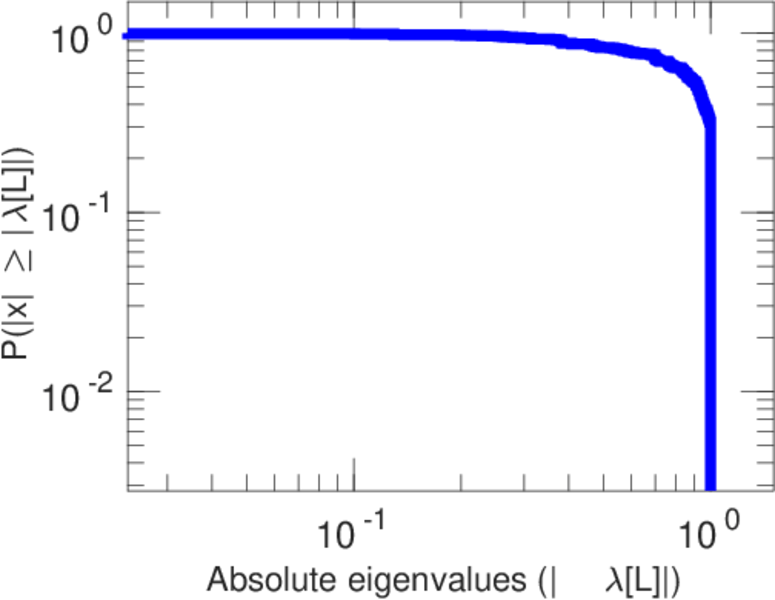
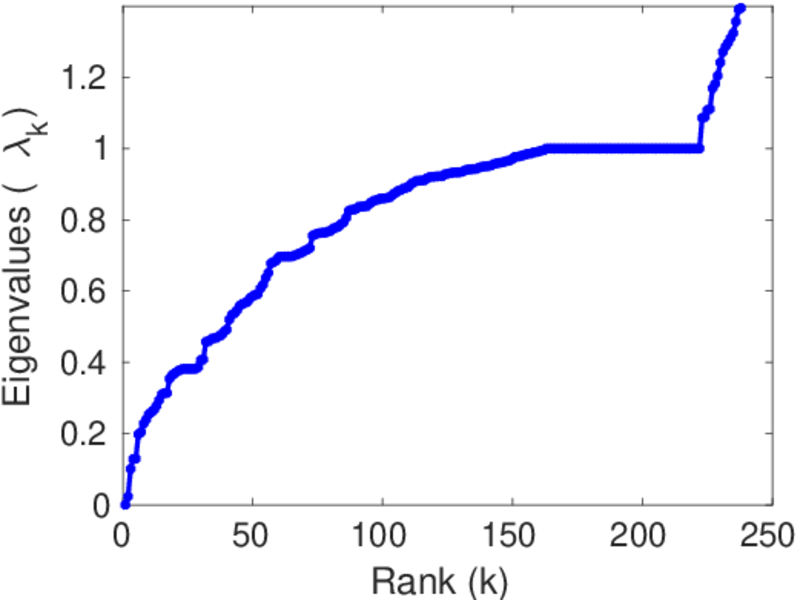
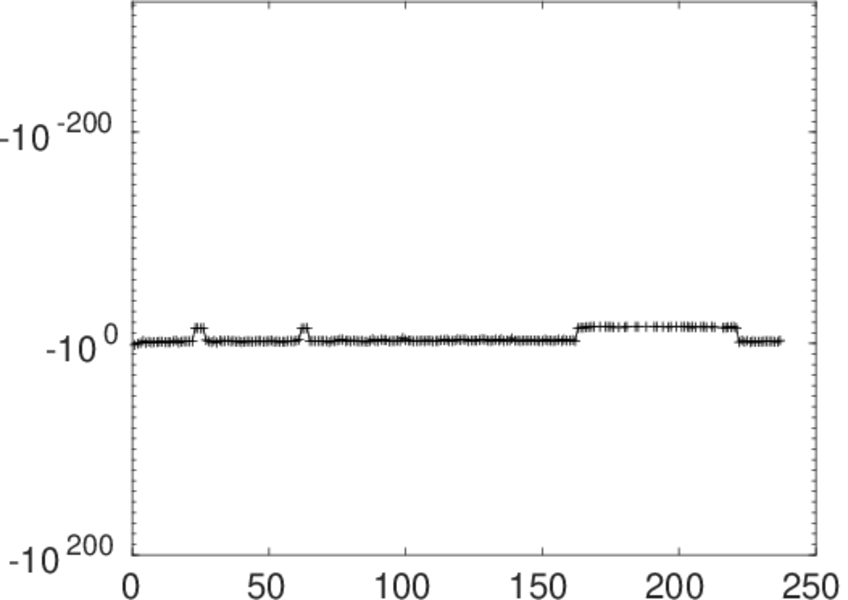
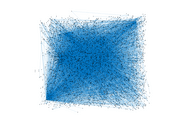
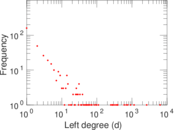
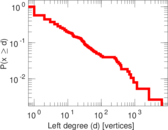
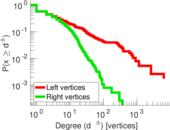
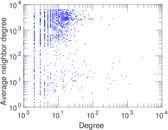
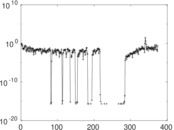
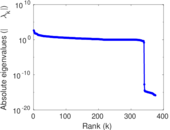
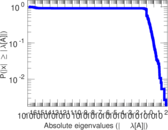
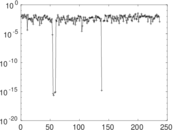
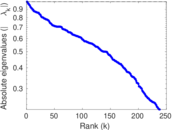
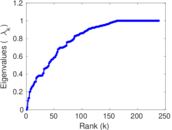
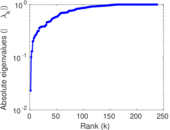
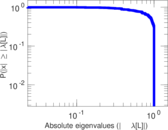
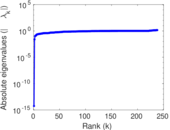
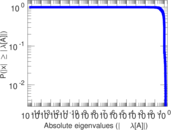
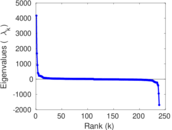
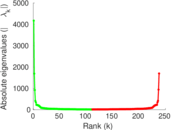
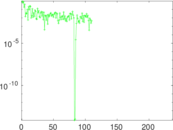
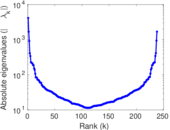
Plots


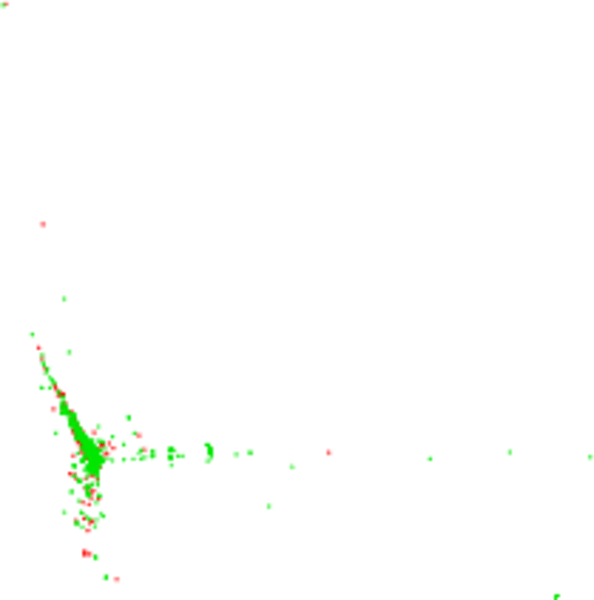
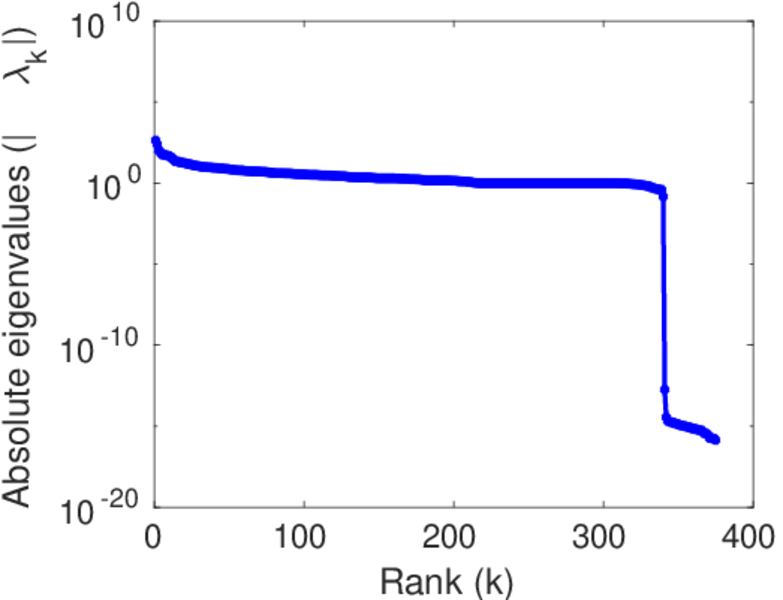
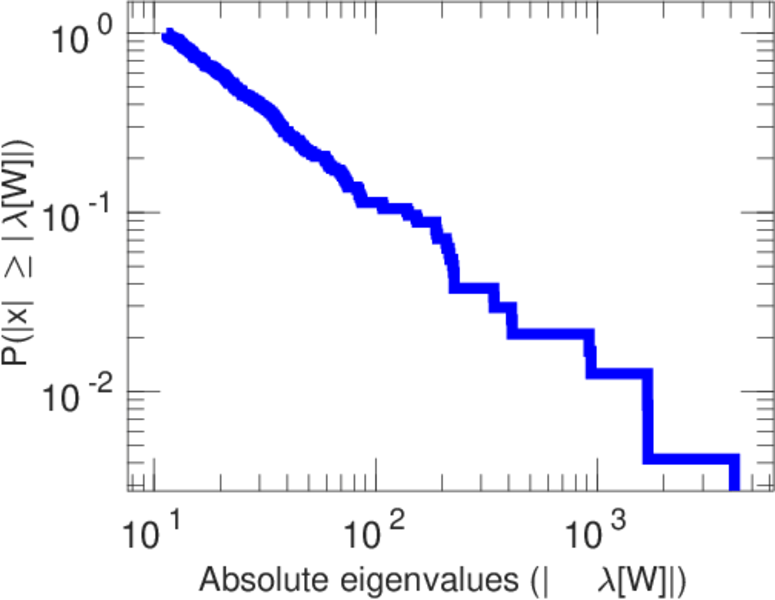
Matrix decompositions plots


Downloads
References
|
[1]
|
Jérôme Kunegis.
KONECT – The Koblenz Network Collection.
In Proc. Int. Conf. on World Wide Web Companion, pages
1343–1350, 2013.
[ http ]
|
|
[2]
|
Wikimedia Foundation.
Wikimedia downloads.
http://dumps.wikimedia.org/, January 2010.
|
 KONECT ‣ Networks ‣
Buy Me a Coffee
KONECT ‣ Networks ‣
Buy Me a Coffee