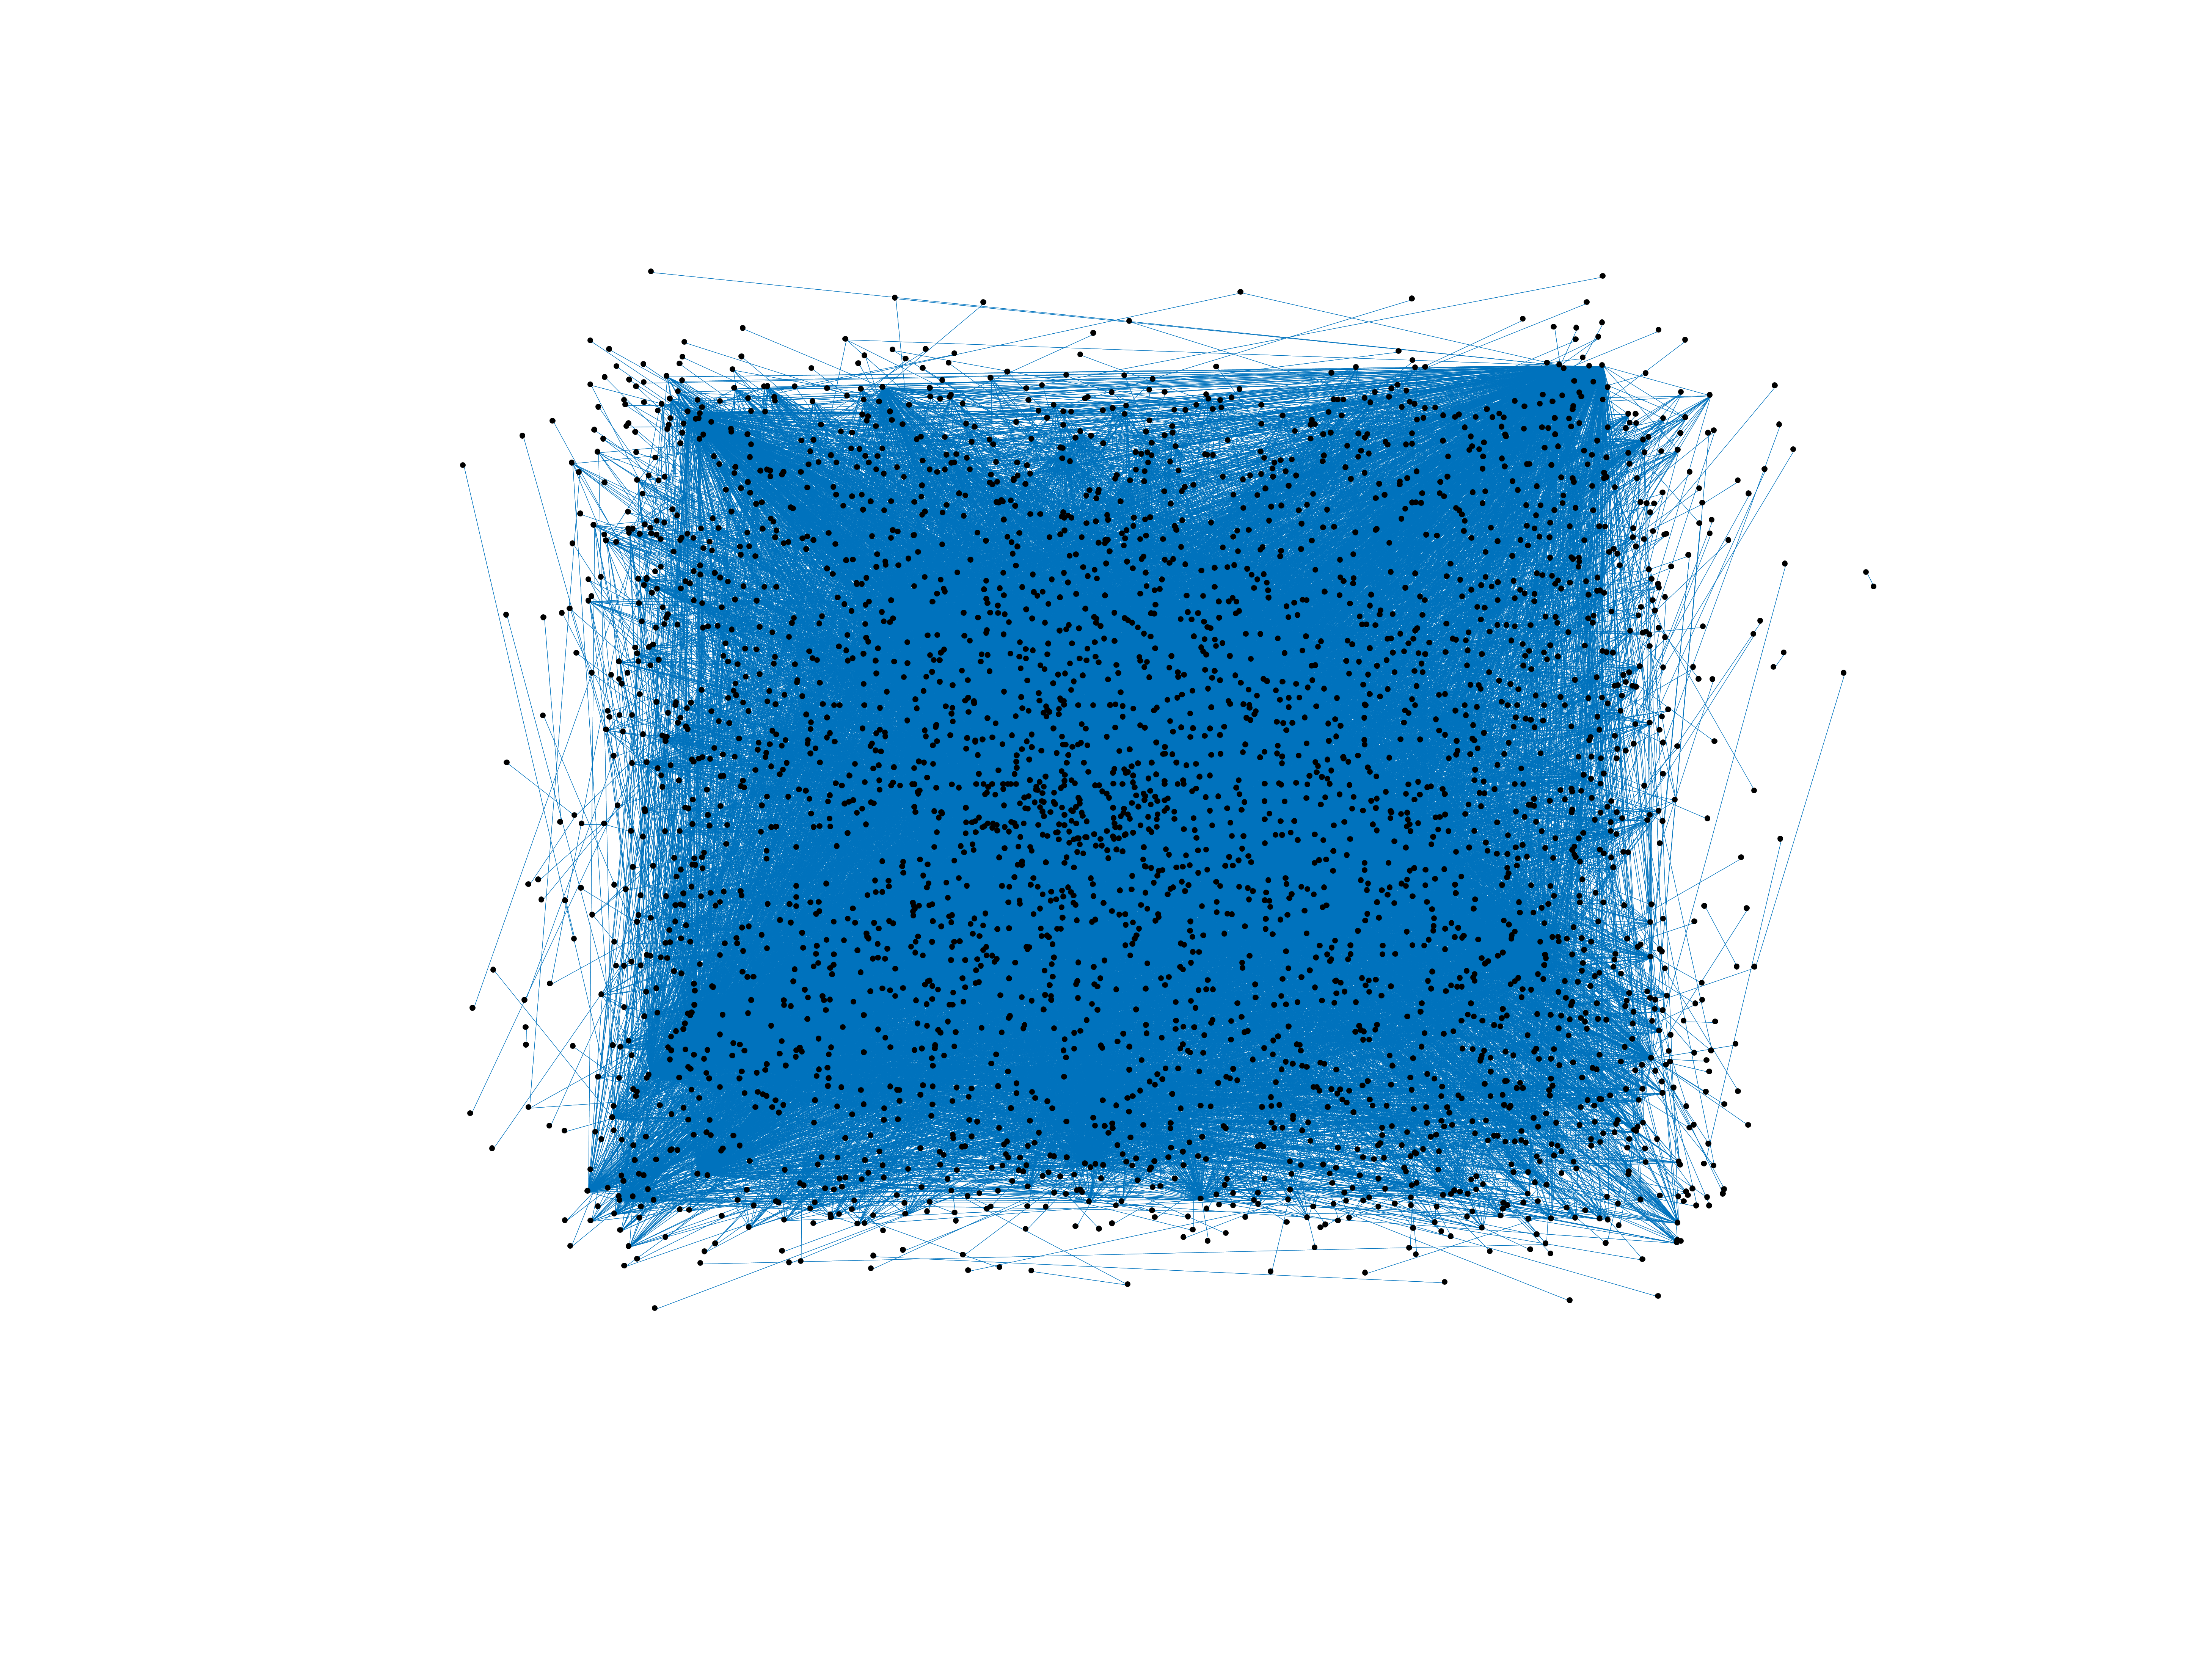
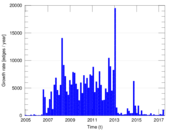
Wikipedia edits (ty)
This is the bipartite edit network of the Tahitian Wikipedia. It contains users
and pages from the Tahitian Wikipedia, connected by edit events. Each edge
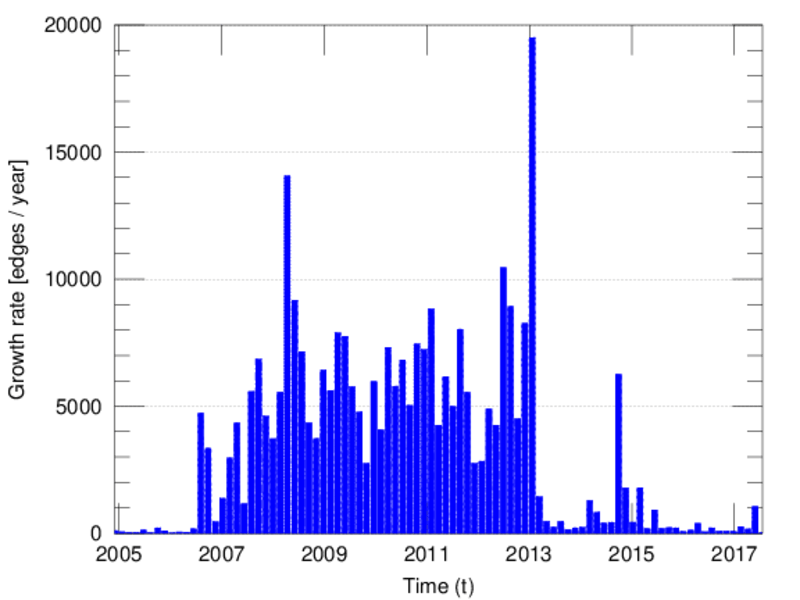
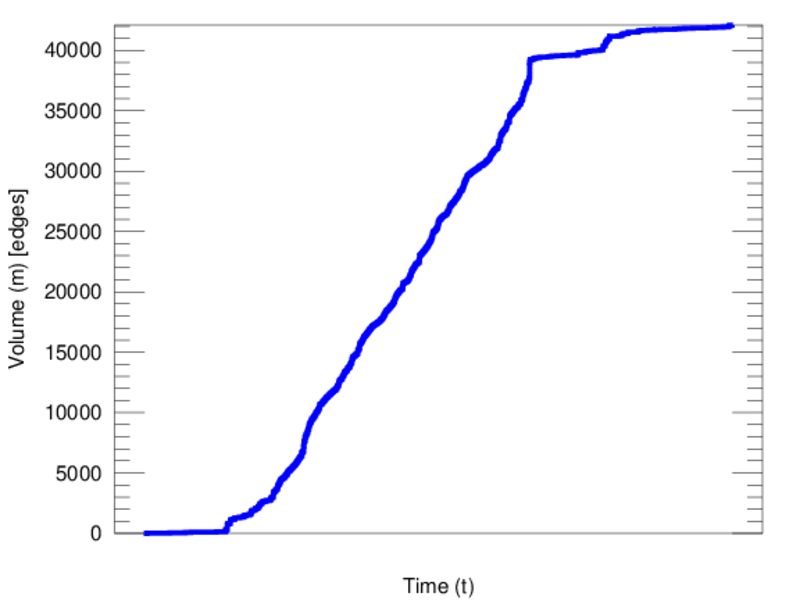
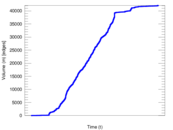
represents an edit. The dataset includes the timestamp of each edit.
Metadata
Statistics
| Size | n = | 3,404
|
| Left size | n1 = | 620
|
| Right size | n2 = | 2,784
|
| Volume | m = | 42,098
|
| Unique edge count | m̿ = | 19,396
|
| Wedge count | s = | 4,224,295
|
| Claw count | z = | 853,421,818
|
| Cross count | x = | 156,187,915,595
|
| Square count | q = | 17,294,040
|
| 4-Tour count | T4 = | 155,297,780
|
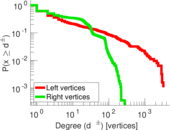
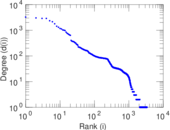
| Maximum degree | dmax = | 3,258
|
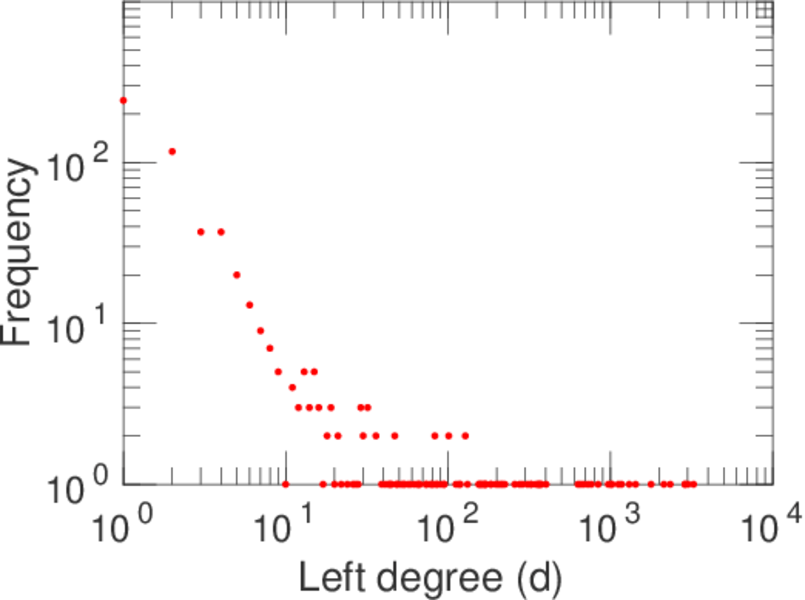
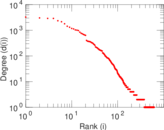
| Maximum left degree | d1max = | 3,258
|
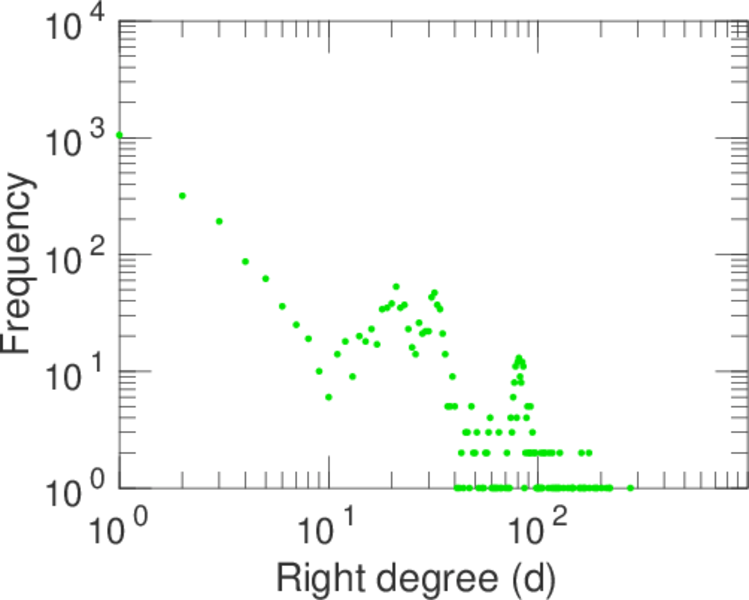
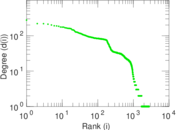
| Maximum right degree | d2max = | 276
|
| Average degree | d = | 24.734 4
|
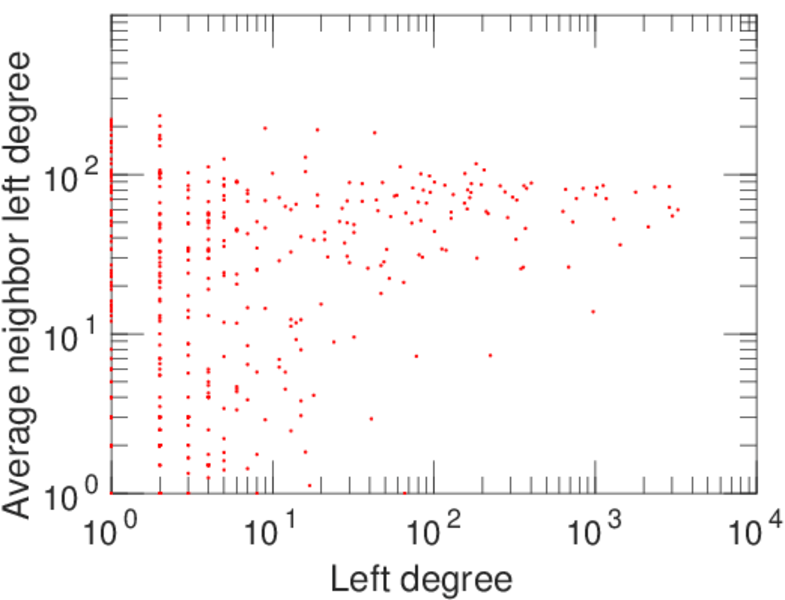
| Average left degree | d1 = | 67.900 0
|
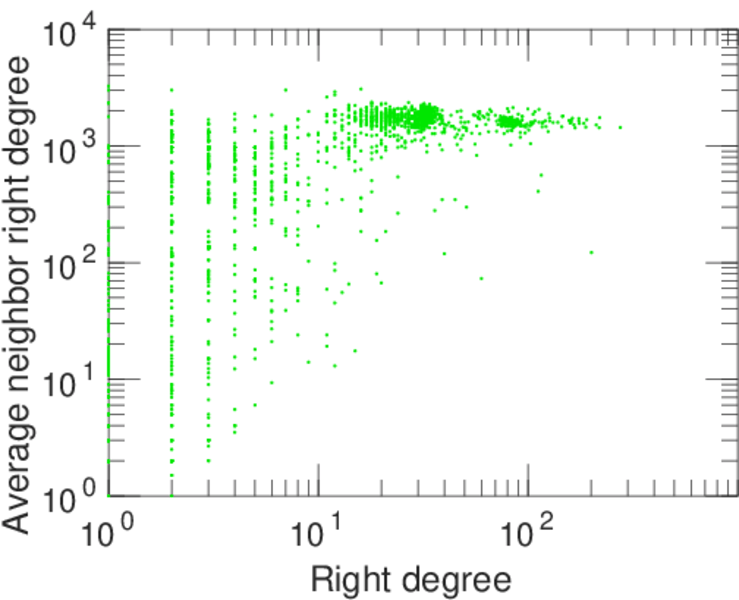
| Average right degree | d2 = | 15.121 4
|
| Fill | p = | 0.011 237 0
|
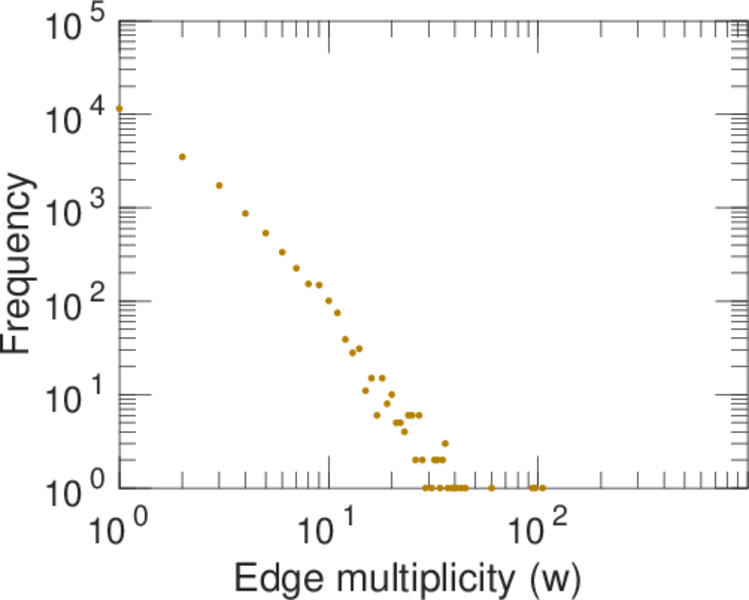
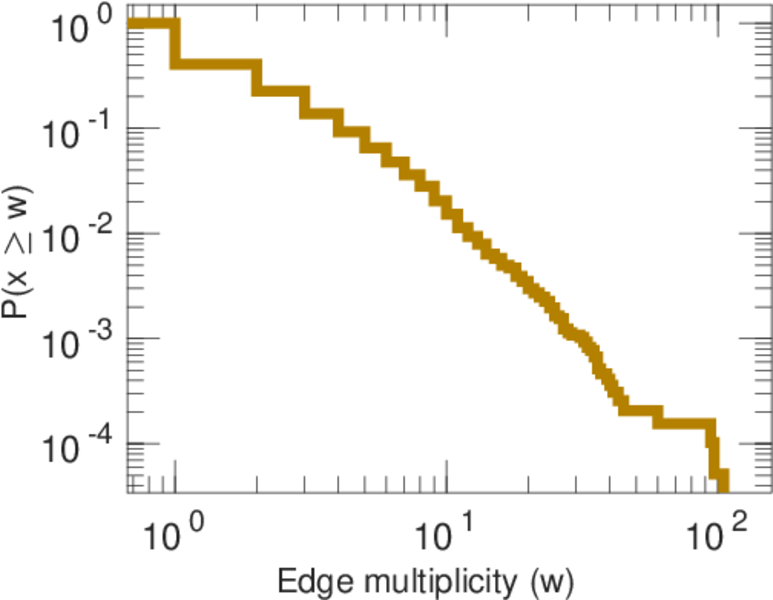
| Average edge multiplicity | m̃ = | 2.170 45
|
| Size of LCC | N = | 2,844
|
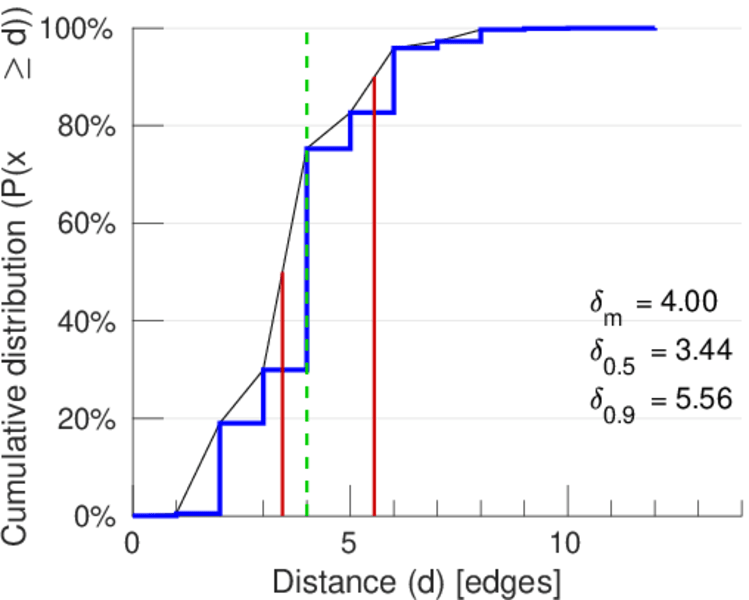
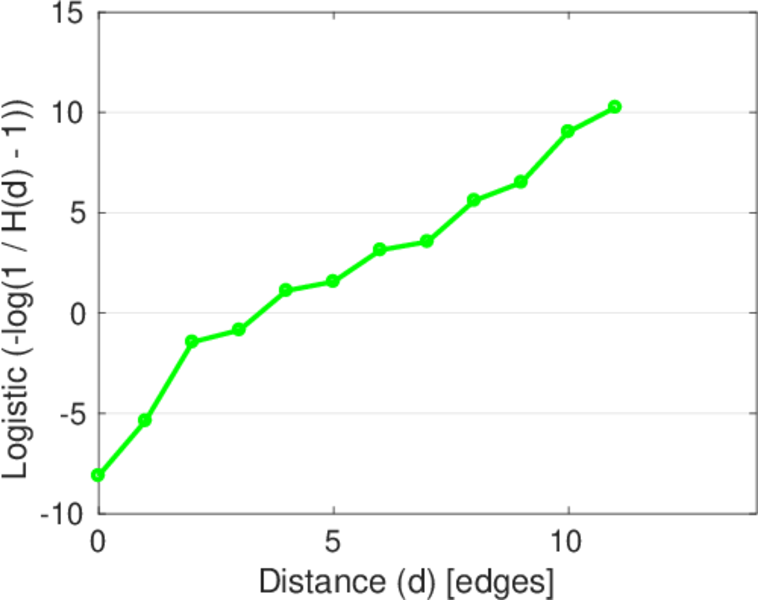
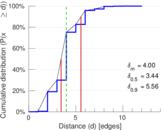
| Diameter | δ = | 13
|
| 50-Percentile effective diameter | δ0.5 = | 3.442 52
|
| 90-Percentile effective diameter | δ0.9 = | 5.557 40
|
| Median distance | δM = | 4
|
| Mean distance | δm = | 4.001 32
|
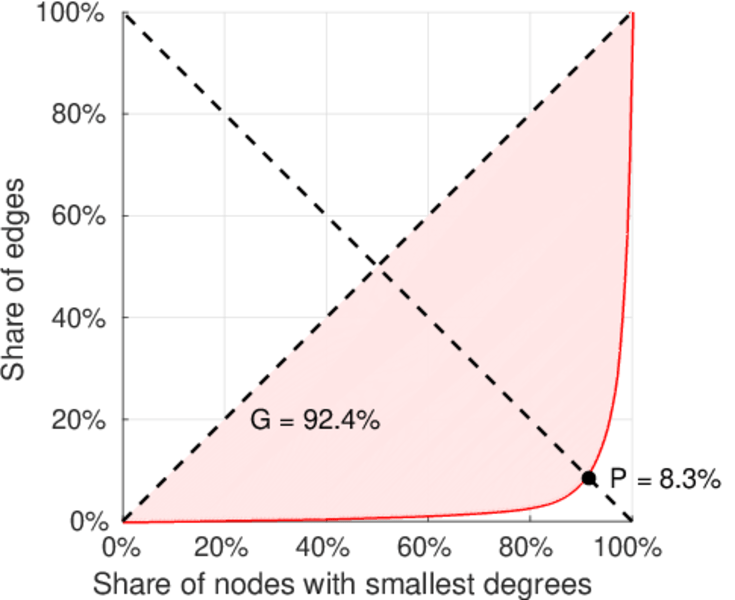
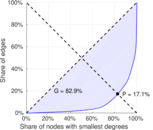
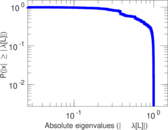
| Gini coefficient | G = | 0.818 632
|
| Balanced inequality ratio | P = | 0.180 769
|
| Left balanced inequality ratio | P1 = | 0.083 163 1
|
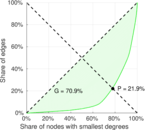
| Right balanced inequality ratio | P2 = | 0.219 250
|
| Relative edge distribution entropy | Her = | 0.798 415
|
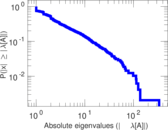
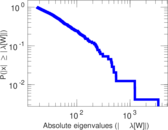
| Power law exponent | γ = | 1.905 57
|
| Tail power law exponent | γt = | 2.651 00
|
| Tail power law exponent with p | γ3 = | 2.651 00
|
| p-value | p = | 0.000 00
|
| Left tail power law exponent with p | γ3,1 = | 1.611 00
|
| Left p-value | p1 = | 0.000 00
|
| Right tail power law exponent with p | γ3,2 = | 7.491 00
|
| Right p-value | p2 = | 0.832 000
|
| Degree assortativity | ρ = | −0.023 458 7
|
| Degree assortativity p-value | pρ = | 0.001 085 70
|
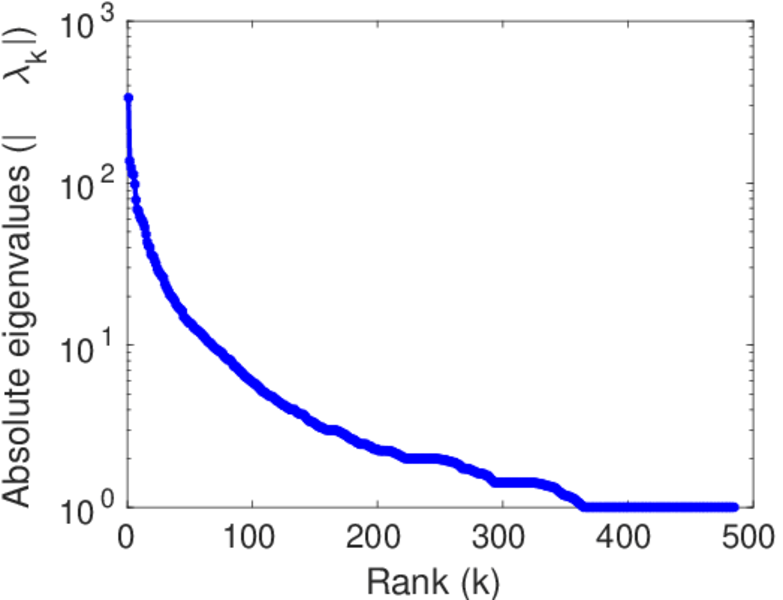
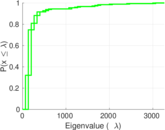
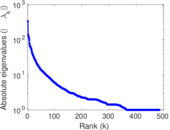
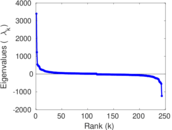
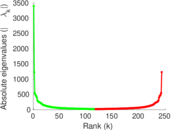
| Spectral norm | α = | 335.788
|
| Algebraic connectivity | a = | 0.026 260 0
|
| Spectral separation | |λ1[A] / λ2[A]| = | 2.446 94
|
| Controllability | C = | 2,226
|
| Relative controllability | Cr = | 0.659 360
|
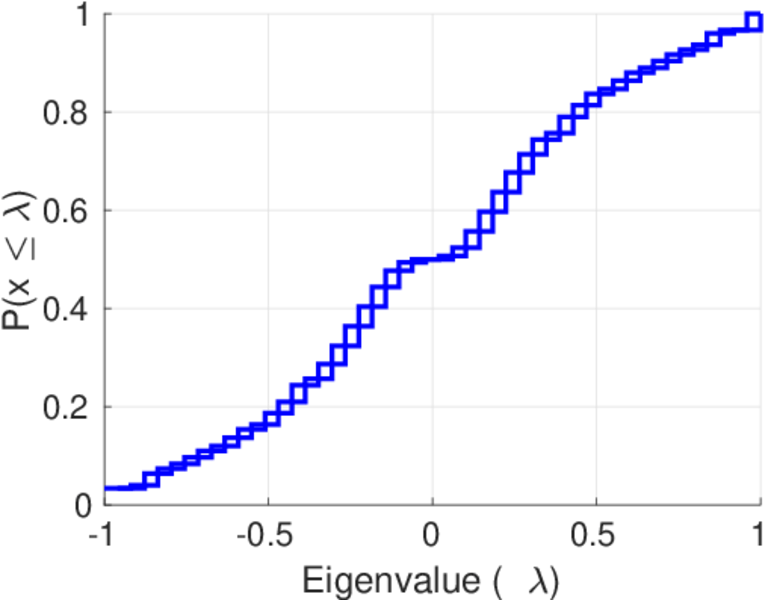
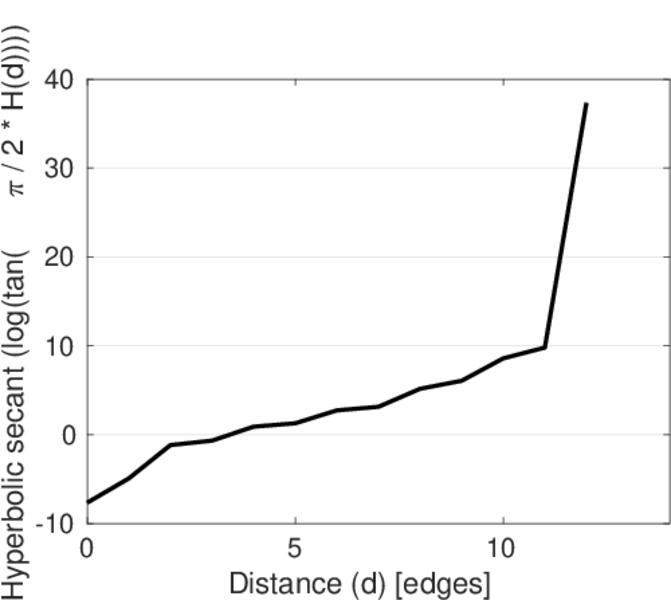
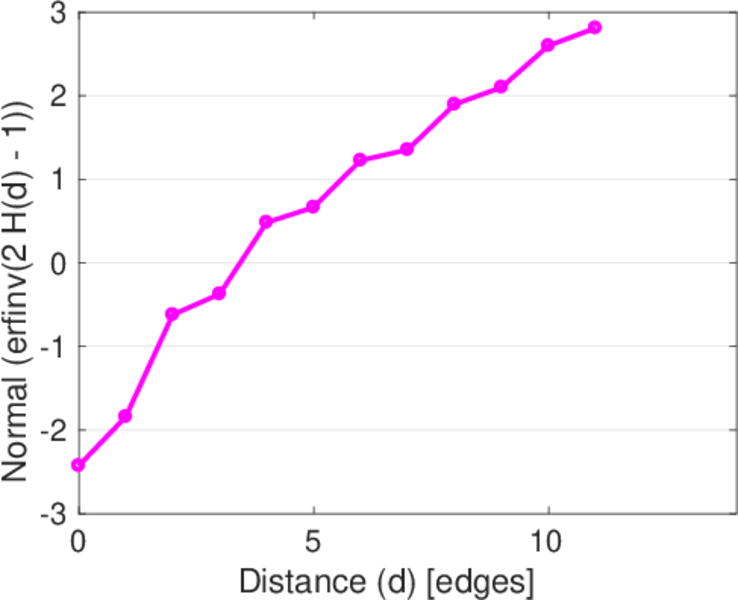
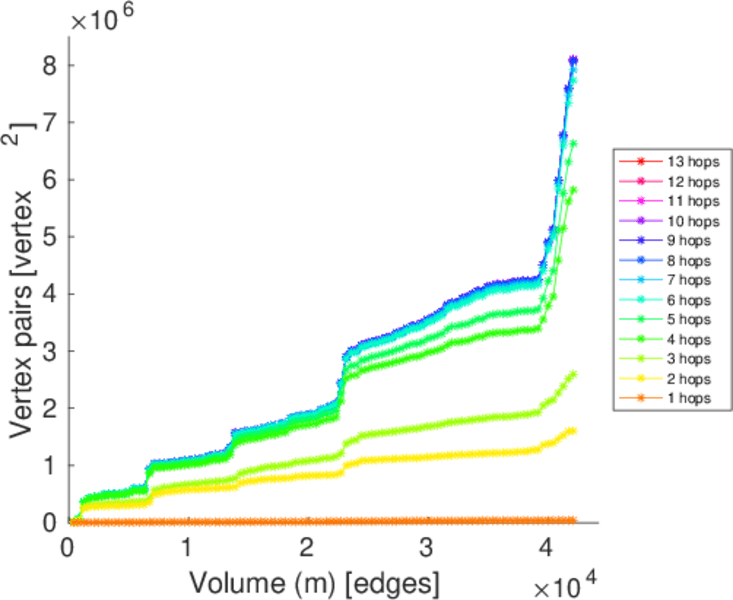
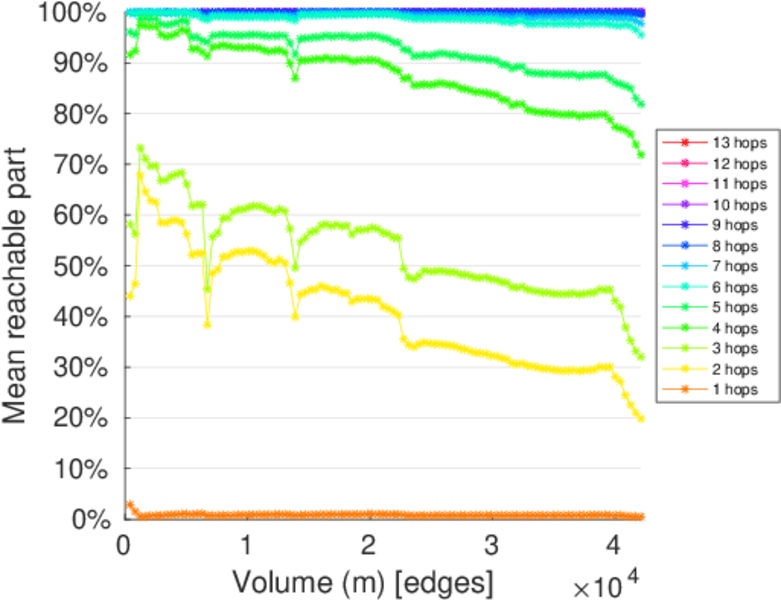
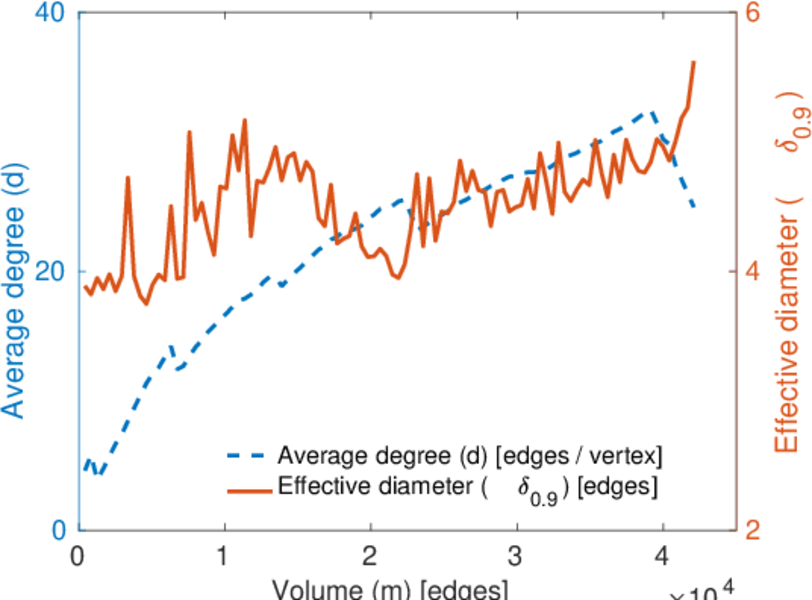
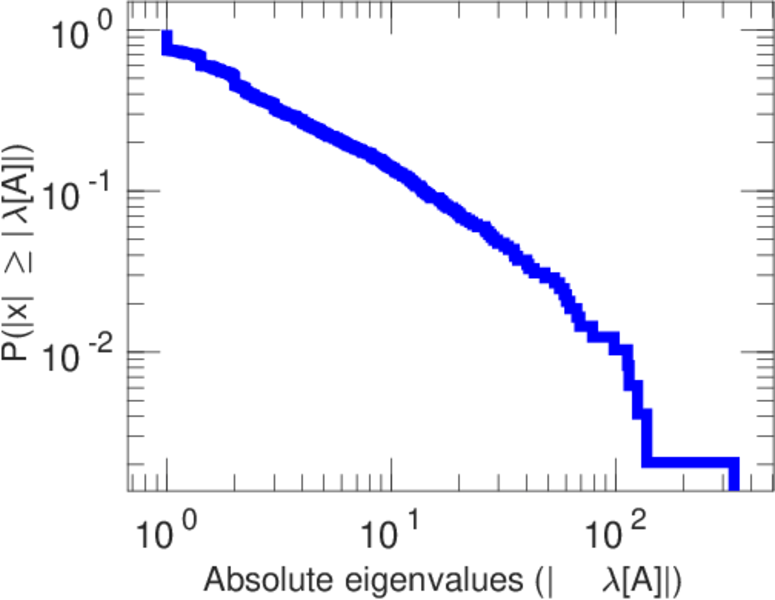
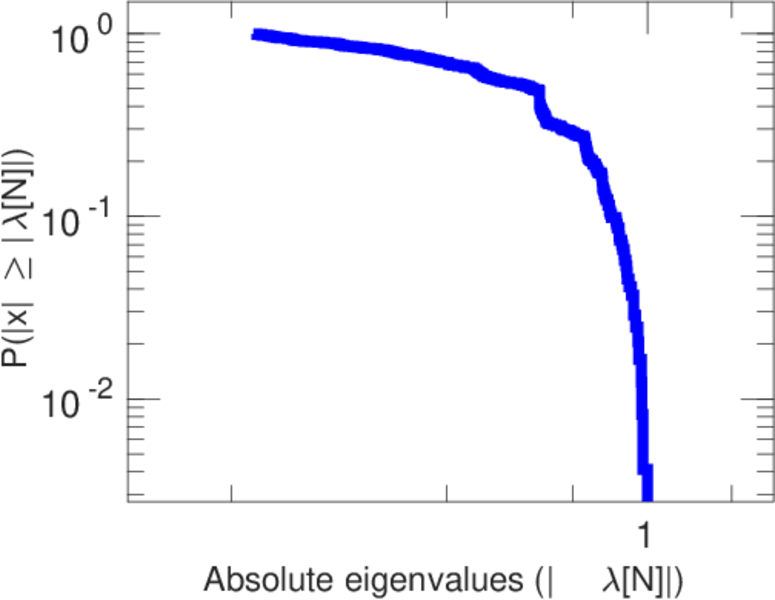
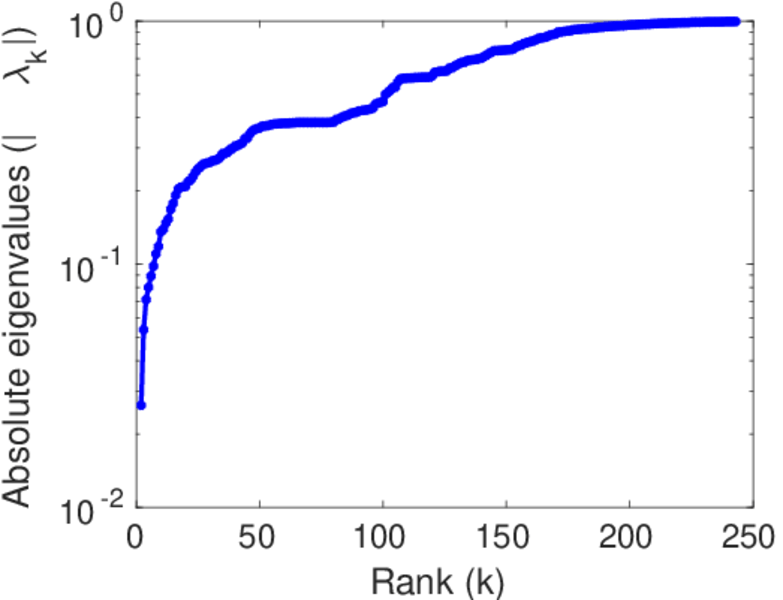
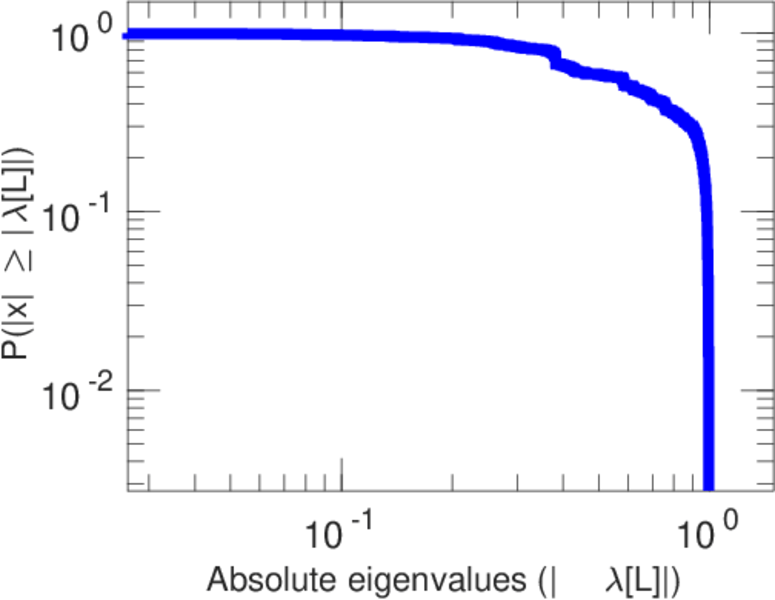
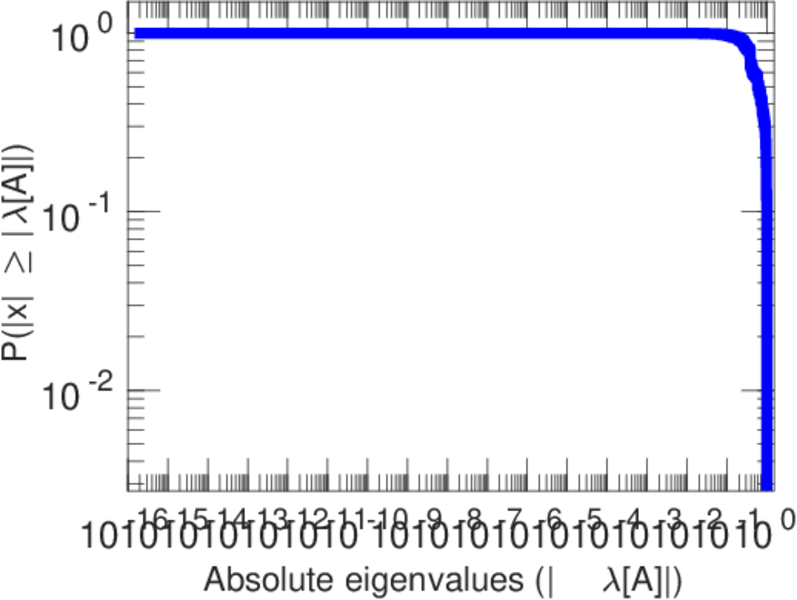
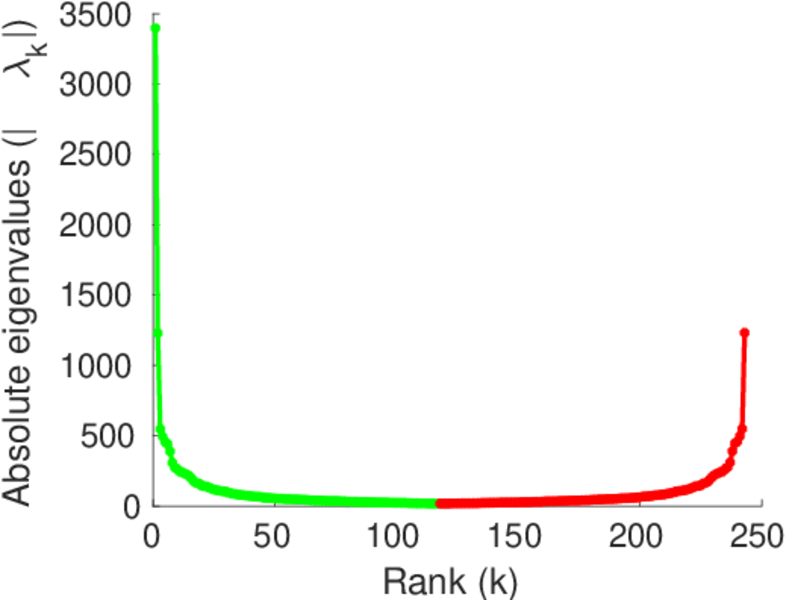
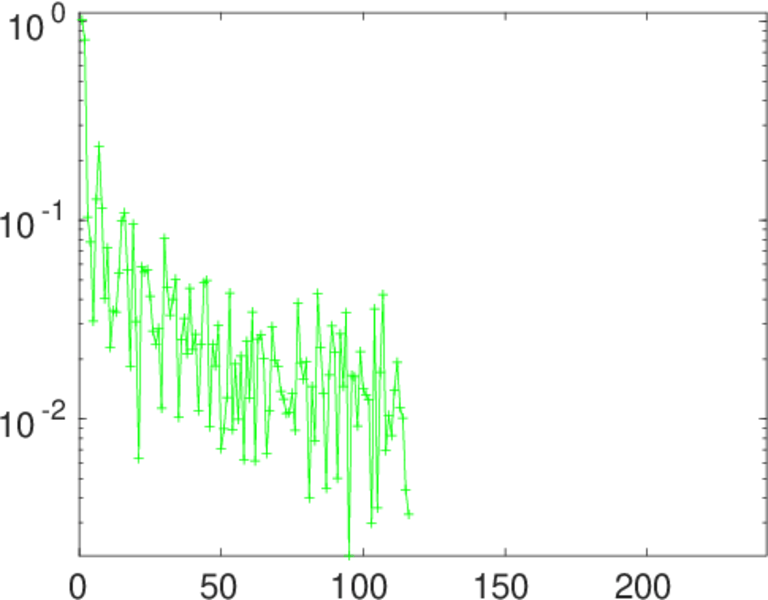
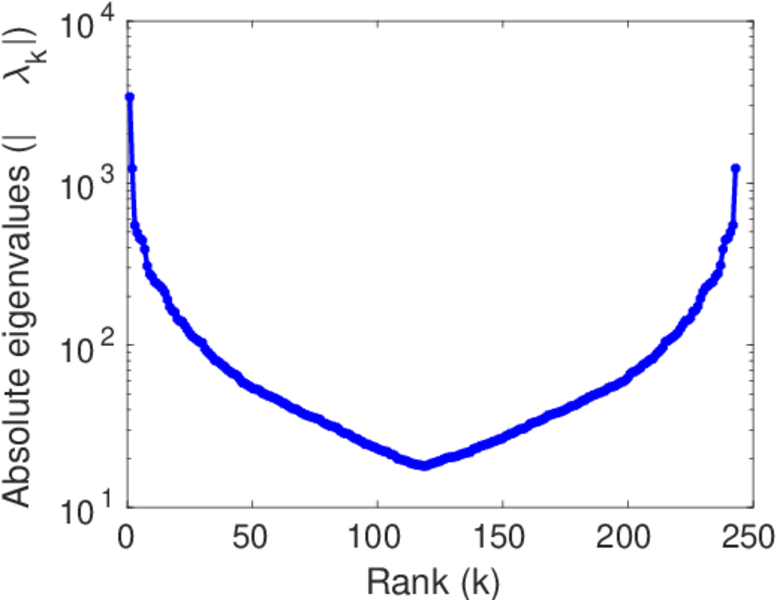
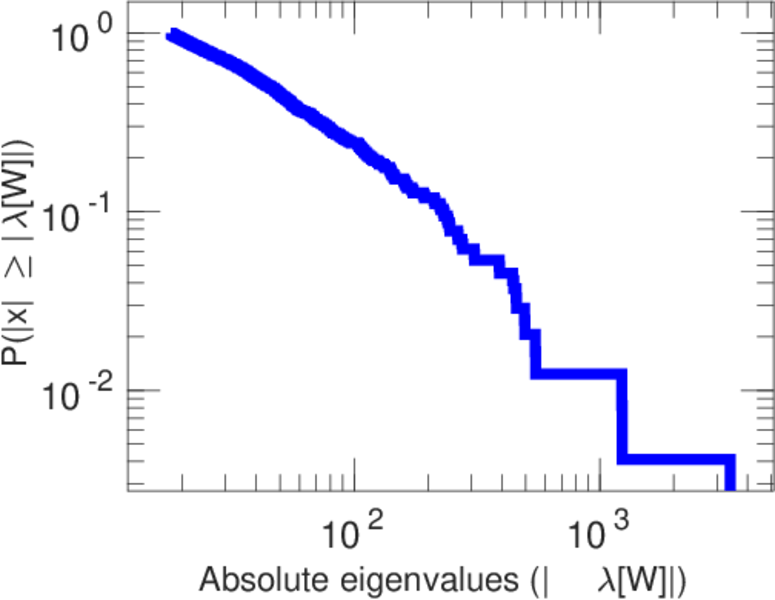
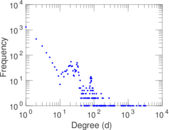
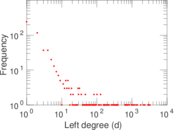
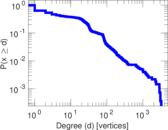
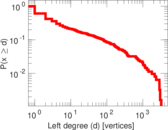
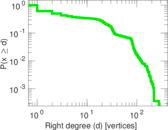
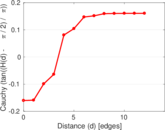
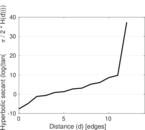
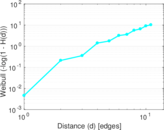
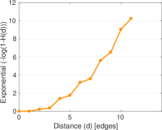
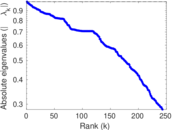
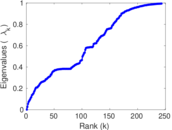
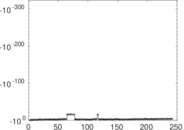
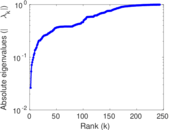
Plots


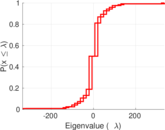

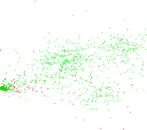
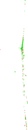
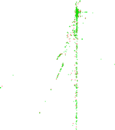


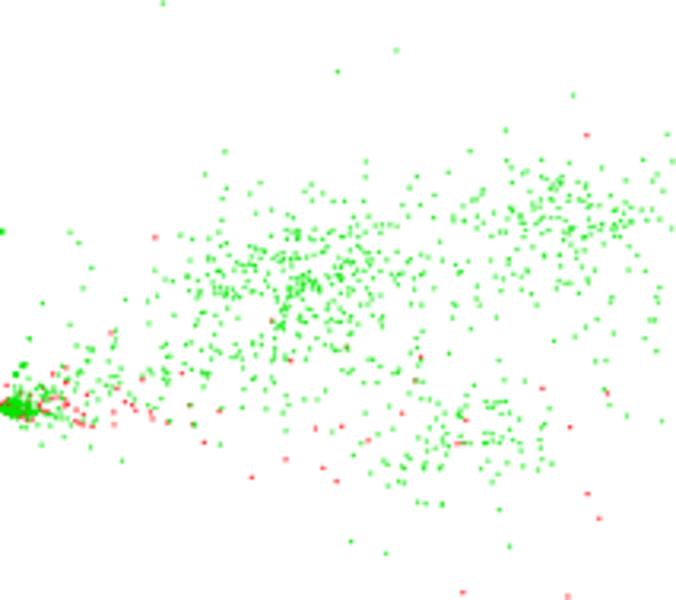
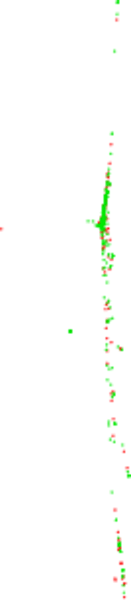
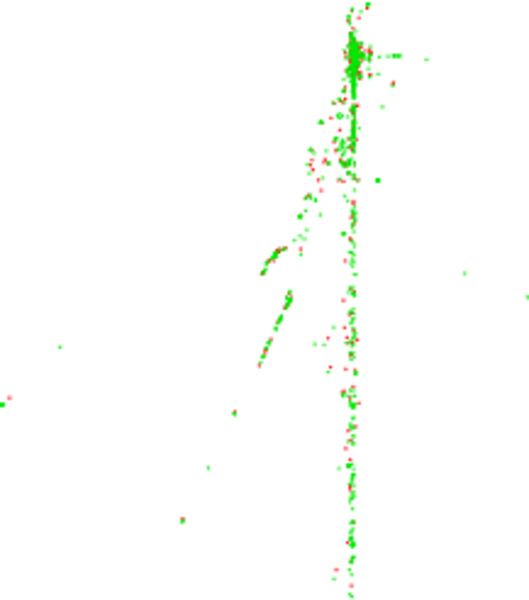
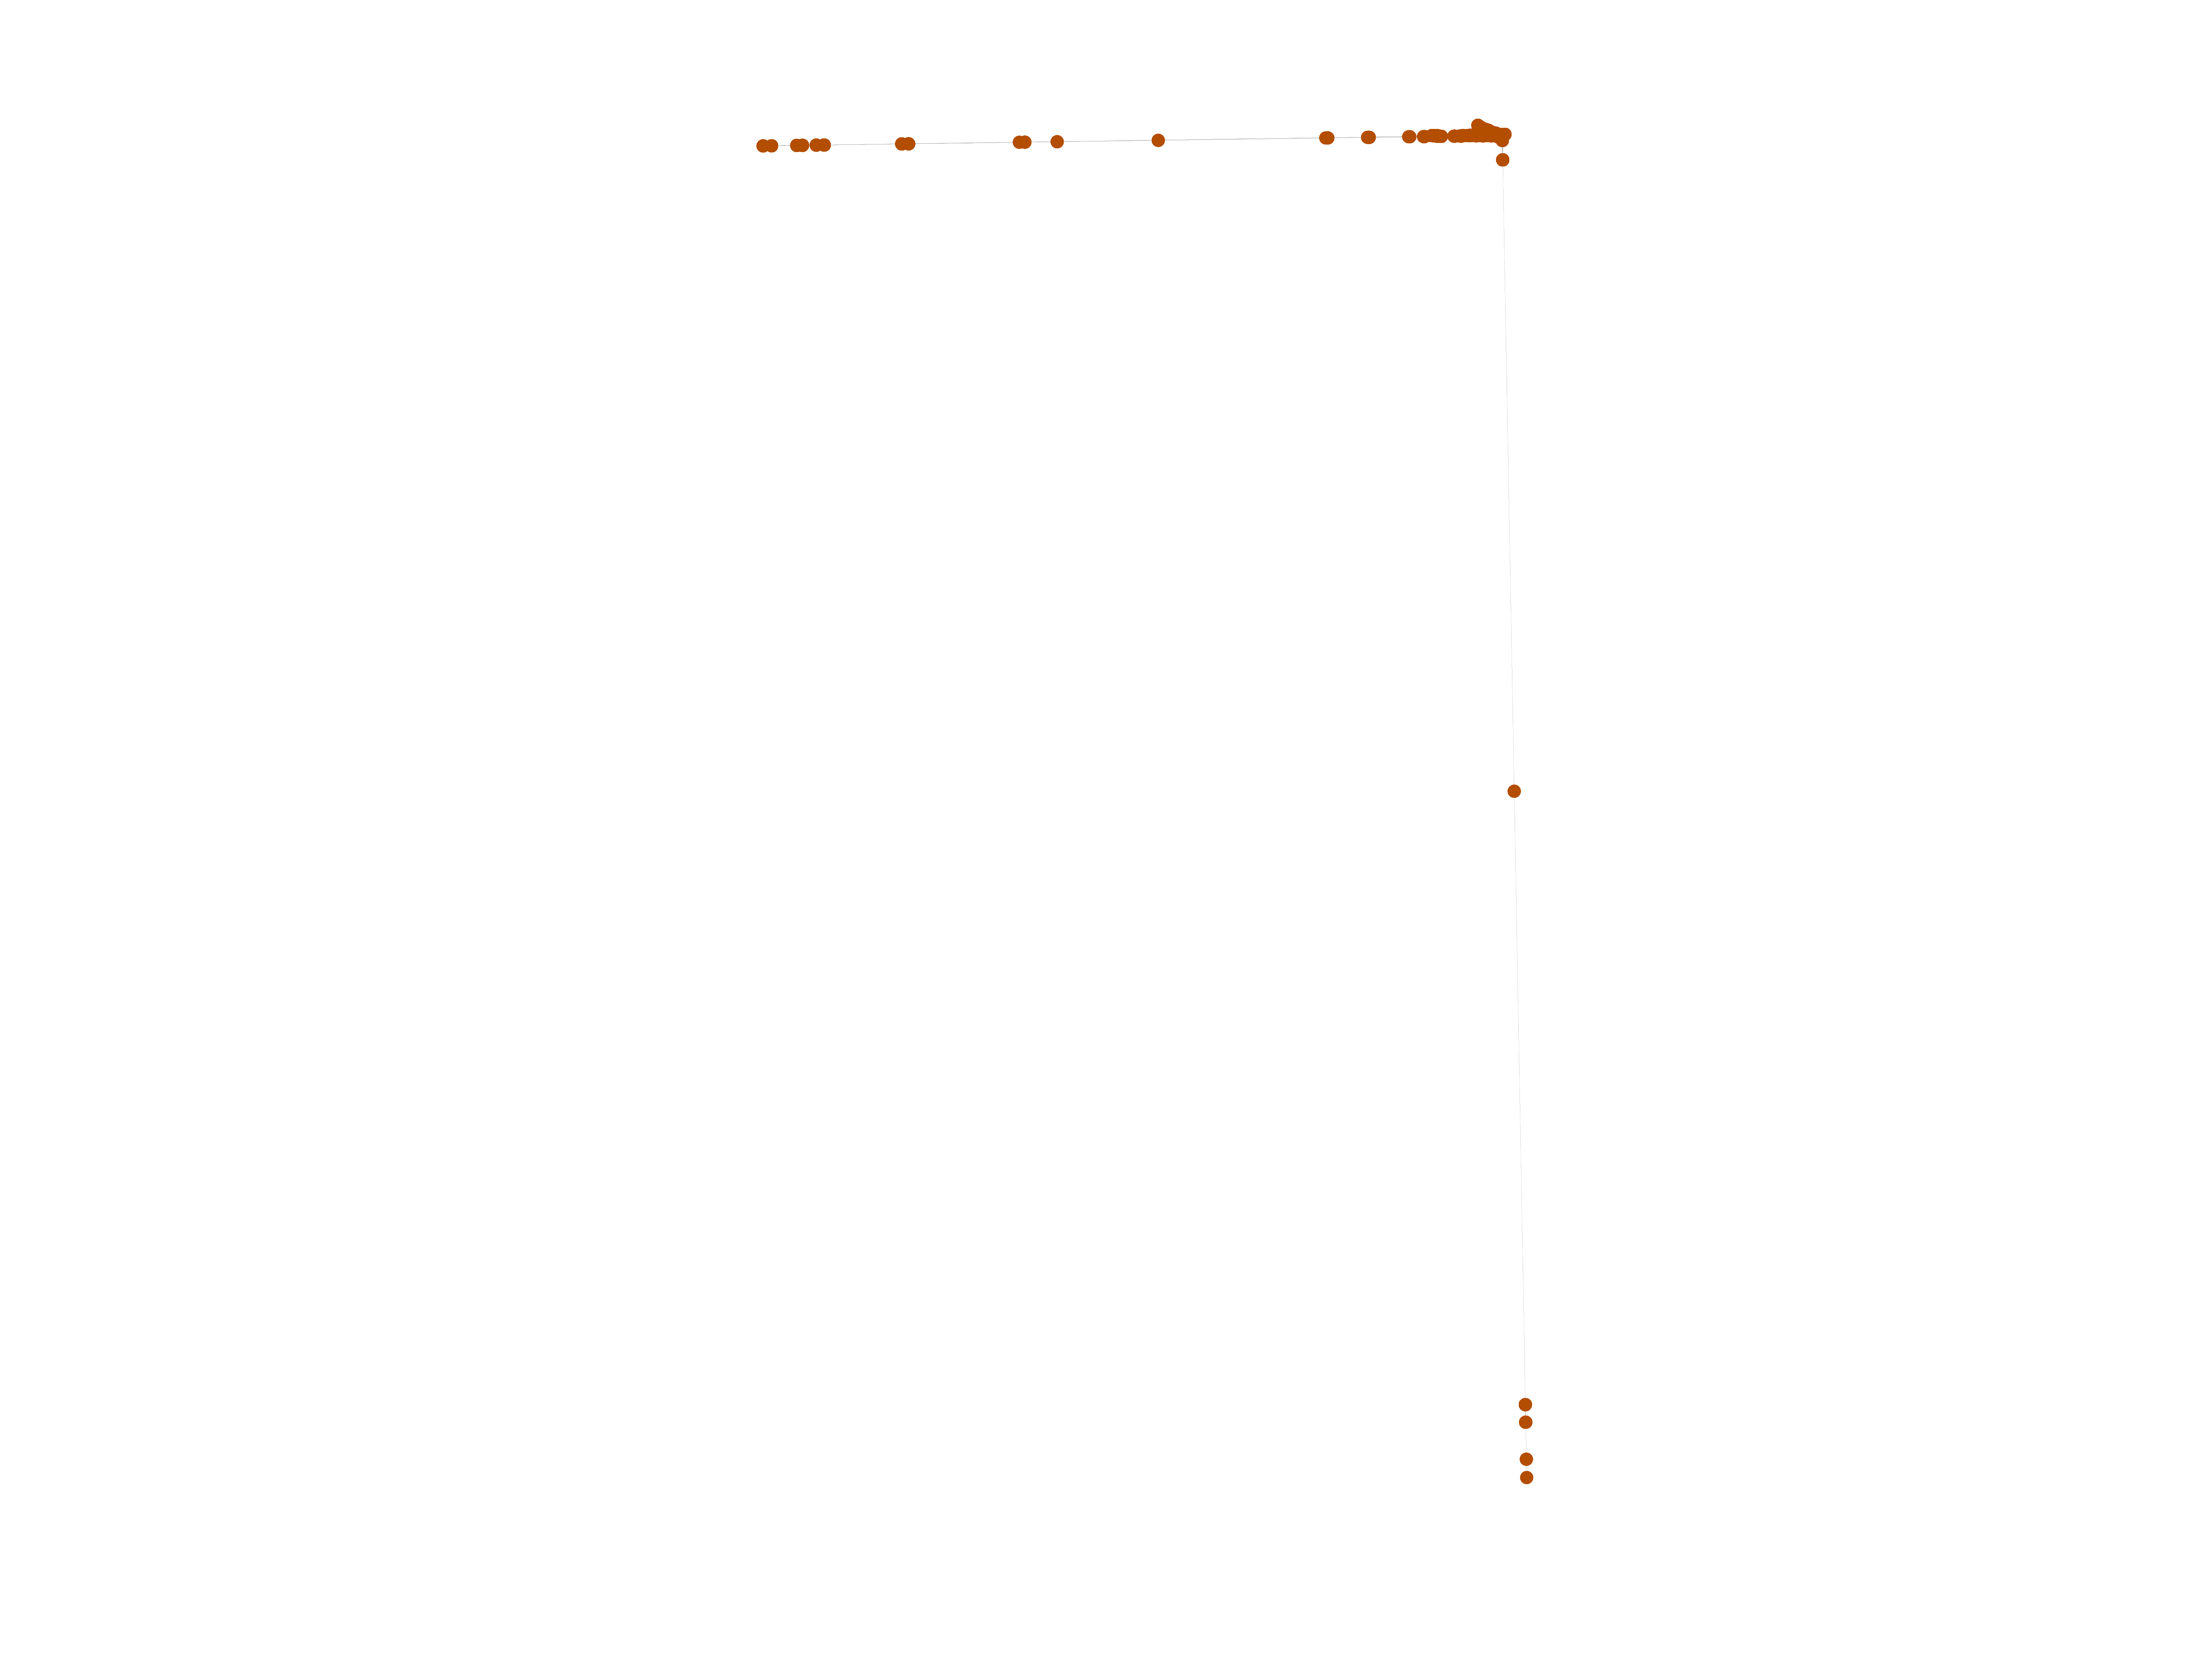
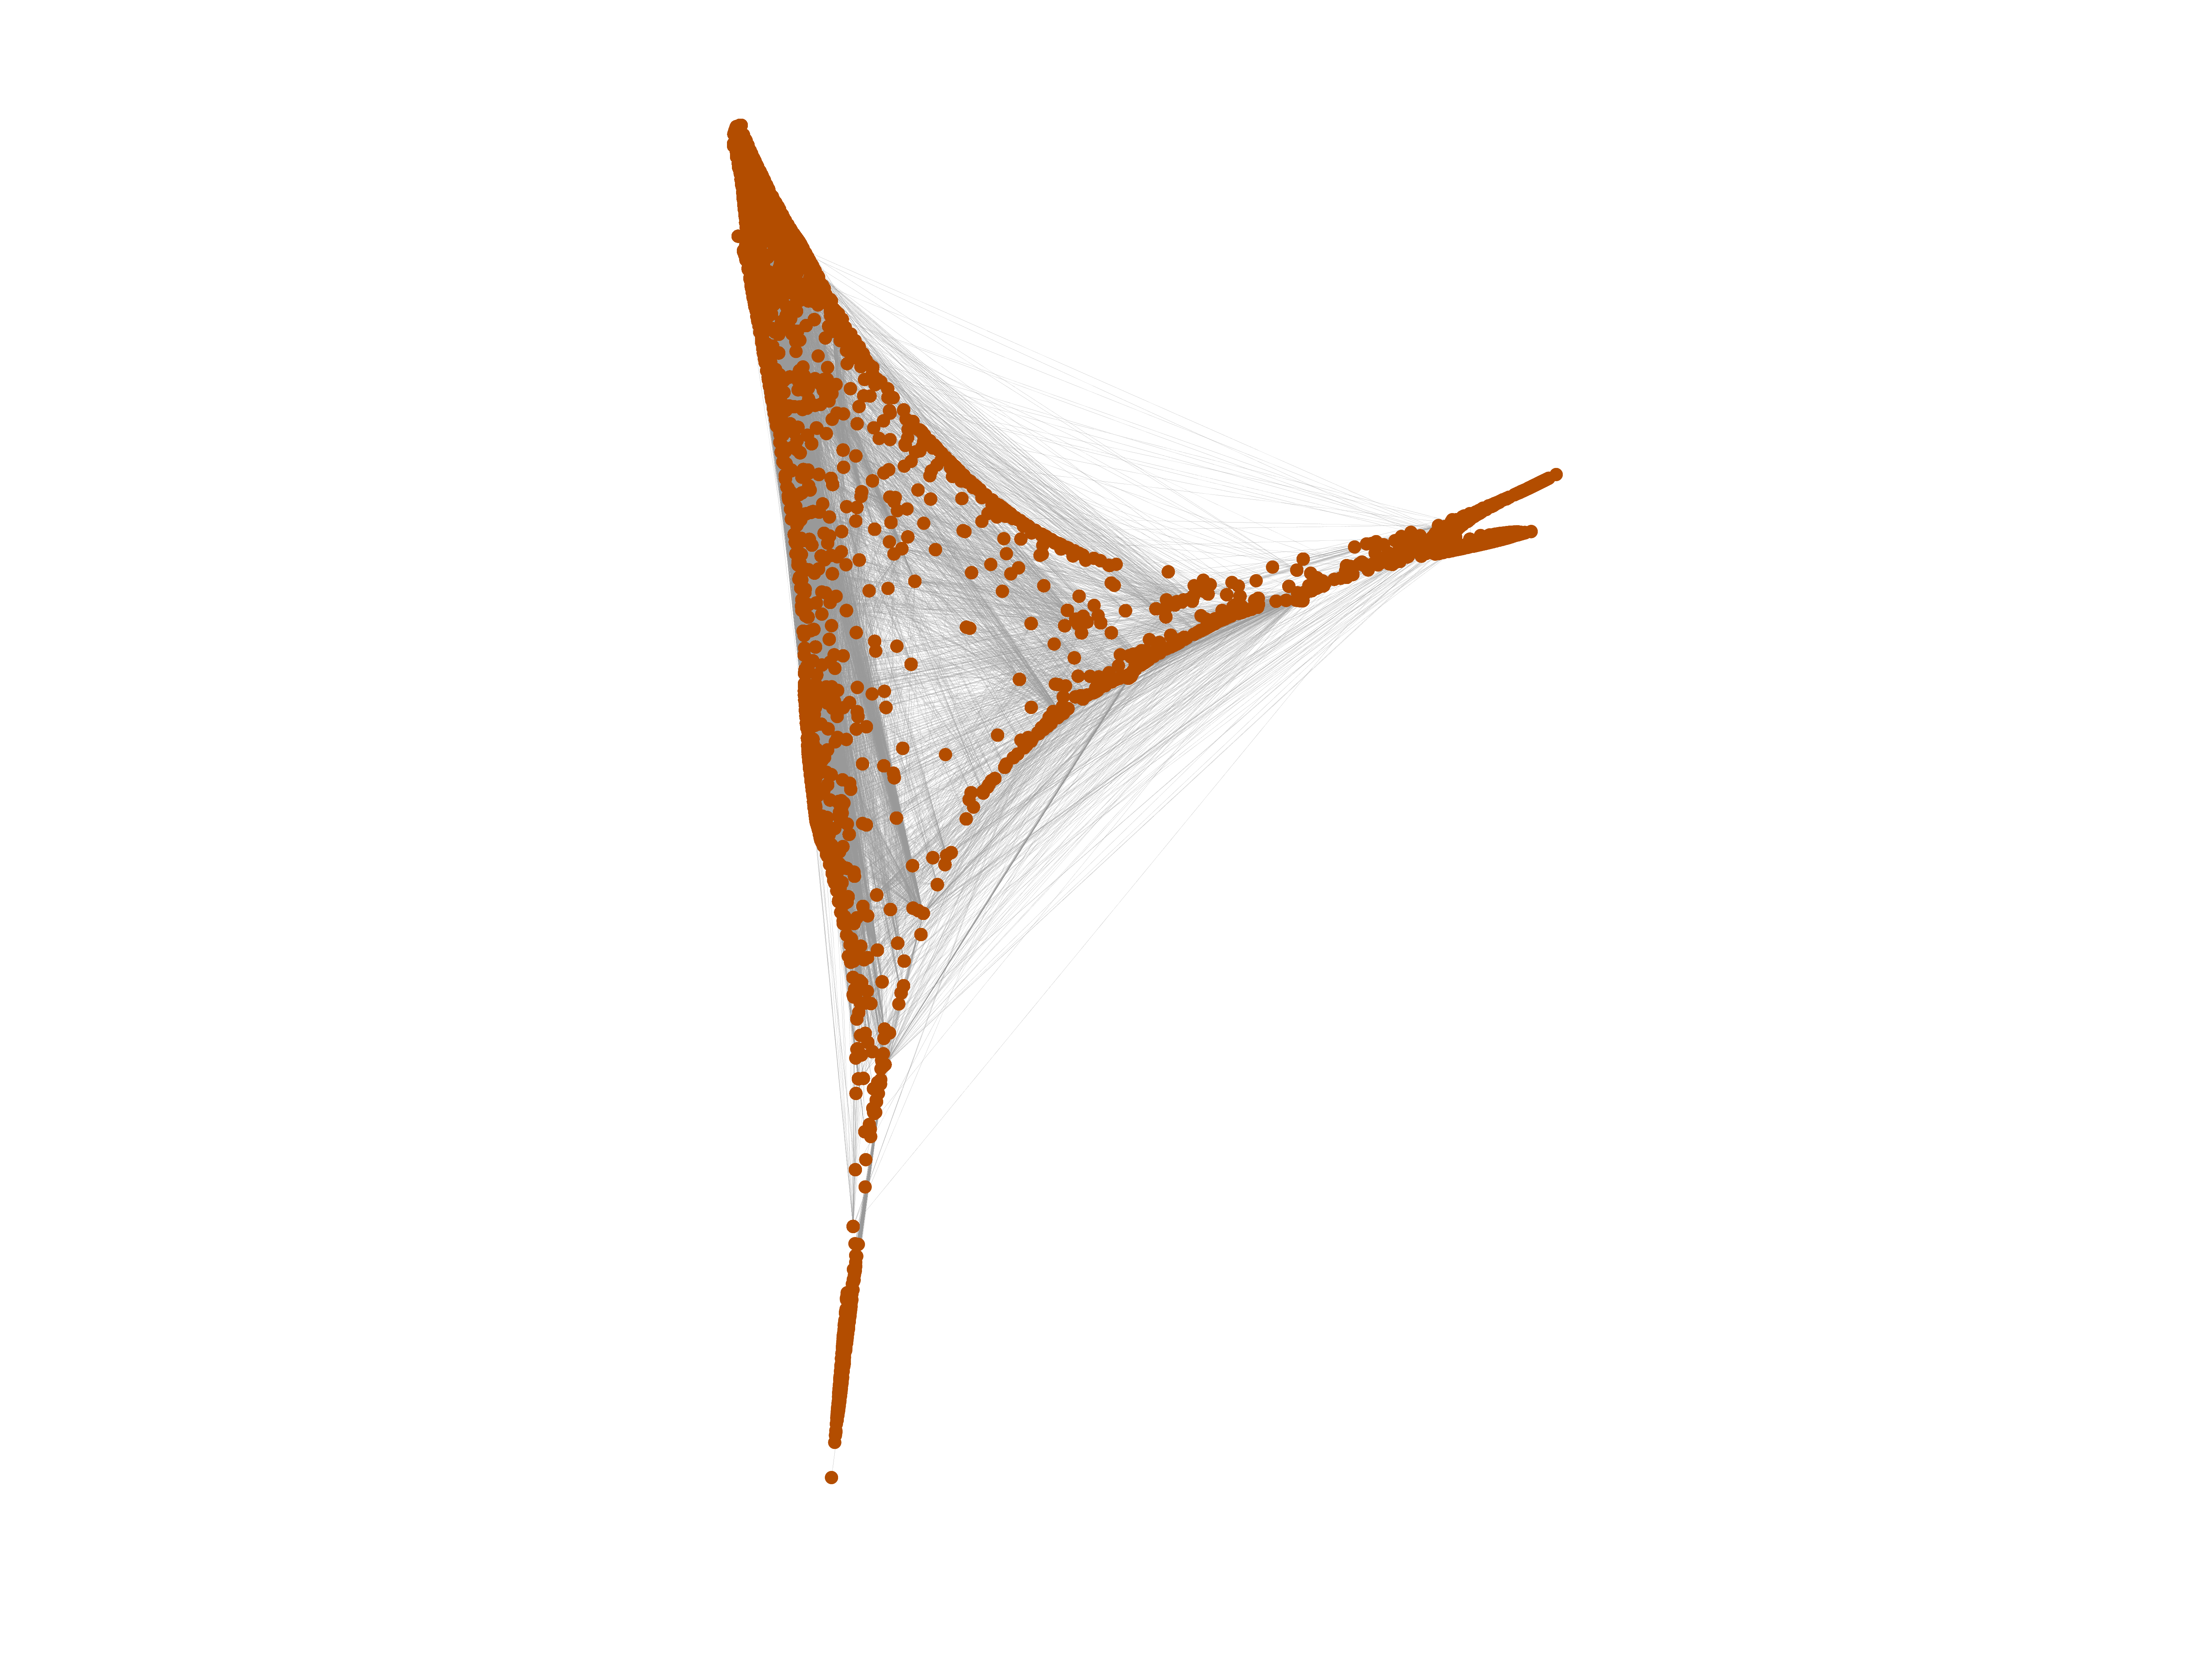
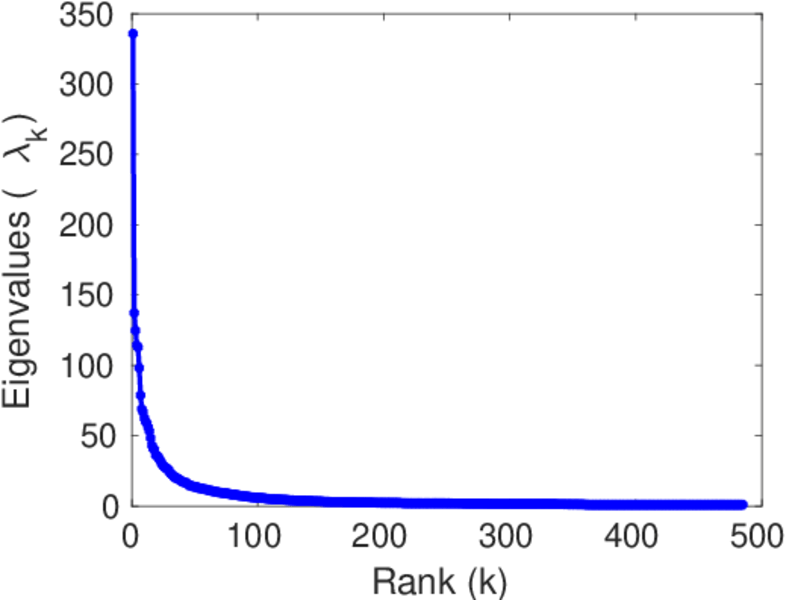
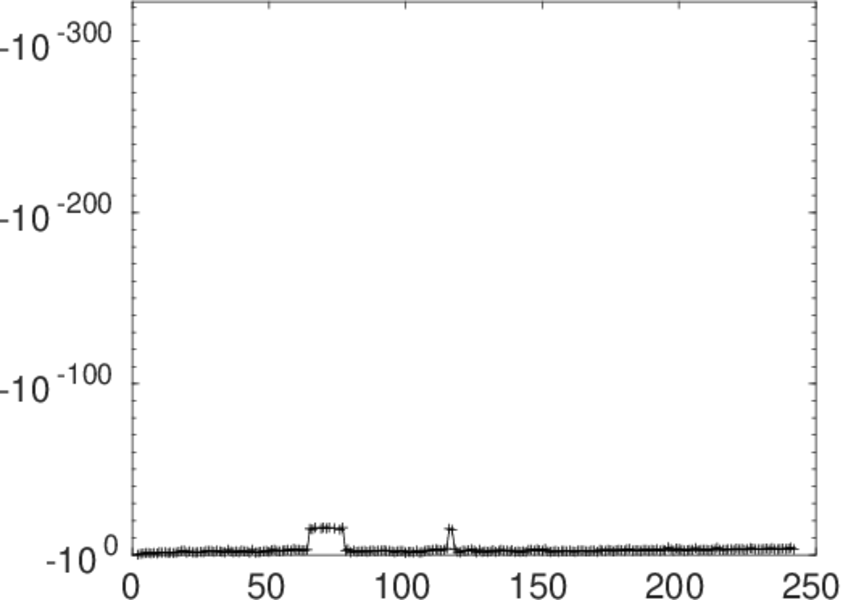
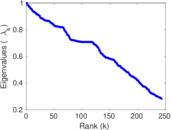
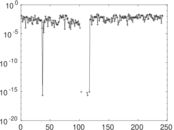
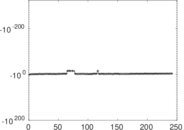
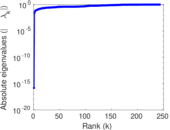
Matrix decompositions plots


Downloads
References
|
[1]
|
Jérôme Kunegis.
KONECT – The Koblenz Network Collection.
In Proc. Int. Conf. on World Wide Web Companion, pages
1343–1350, 2013.
[ http ]
|
|
[2]
|
Wikimedia Foundation.
Wikimedia downloads.
http://dumps.wikimedia.org/, January 2010.
|
 KONECT ‣ Networks ‣
Buy Me a Coffee
KONECT ‣ Networks ‣
Buy Me a Coffee