Wikipedia edits (udm)
This is the bipartite edit network of the Udmurt Wikipedia. It contains users
and pages from the Udmurt Wikipedia, connected by edit events. Each edge
represents an edit. The dataset includes the timestamp of each edit.
Metadata
Statistics
| Size | n = | 11,065
|
| Left size | n1 = | 1,027
|
| Right size | n2 = | 10,038
|
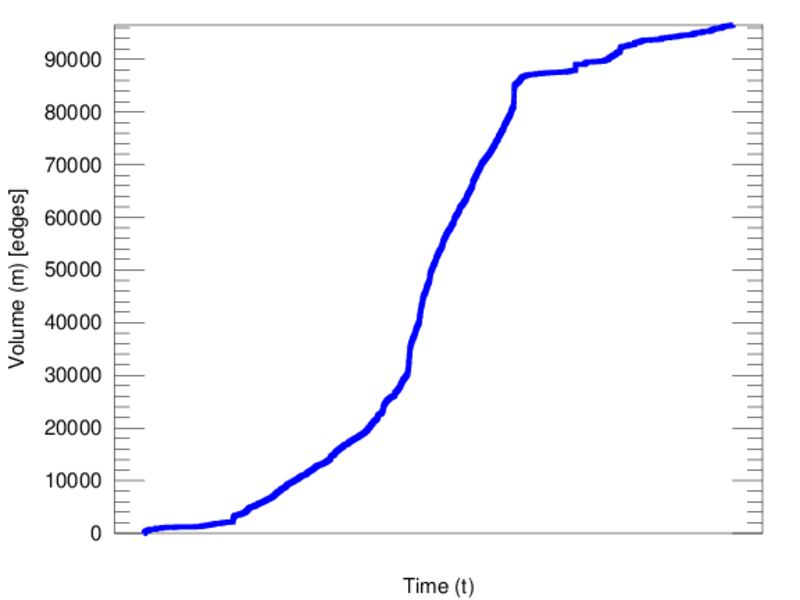
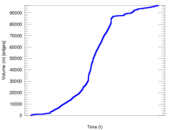
| Volume | m = | 96,529
|
| Unique edge count | m̿ = | 46,685
|
| Wedge count | s = | 33,041,094
|
| Claw count | z = | 28,568,102,865
|
| Cross count | x = | 22,975,137,170,795
|
| Square count | q = | 51,174,040
|
| 4-Tour count | T4 = | 541,686,958
|
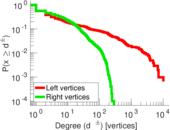
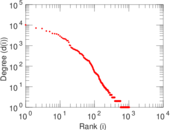
| Maximum degree | dmax = | 10,228
|
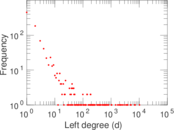
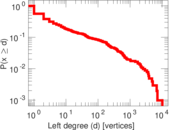
| Maximum left degree | d1max = | 10,228
|
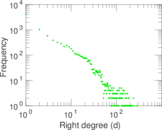
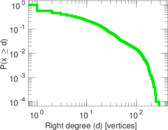
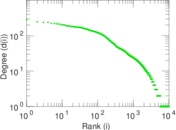
| Maximum right degree | d2max = | 284
|
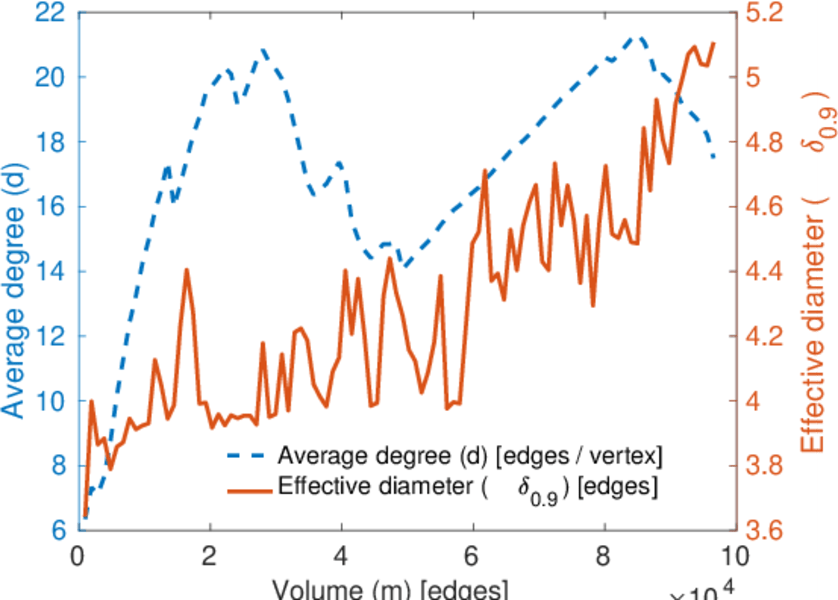
| Average degree | d = | 17.447 6
|
| Average left degree | d1 = | 93.991 2
|
| Average right degree | d2 = | 9.616 36
|
| Fill | p = | 0.004 528 56
|
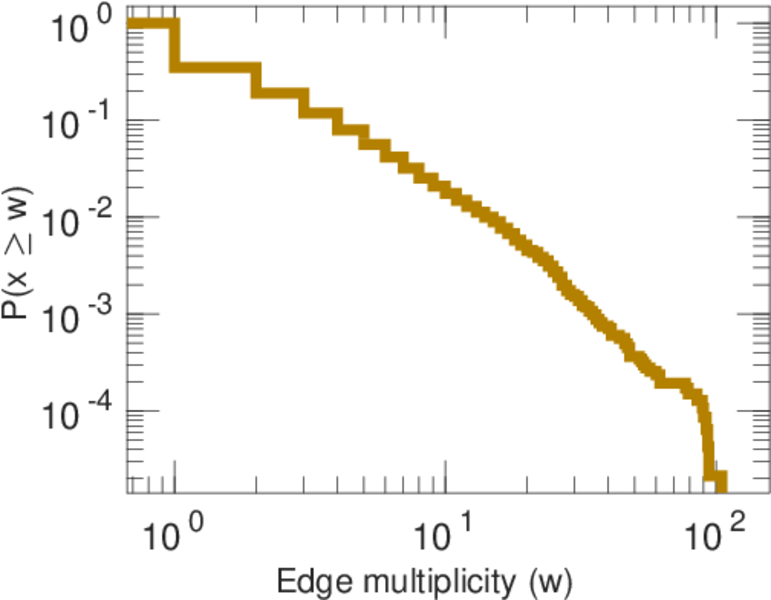
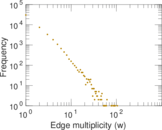
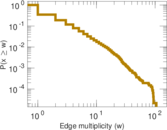
| Average edge multiplicity | m̃ = | 2.067 67
|
| Size of LCC | N = | 10,581
|
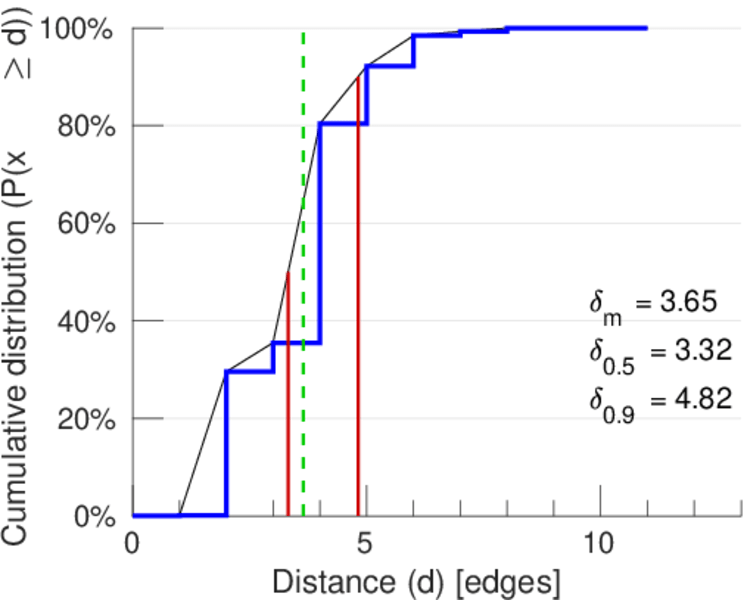
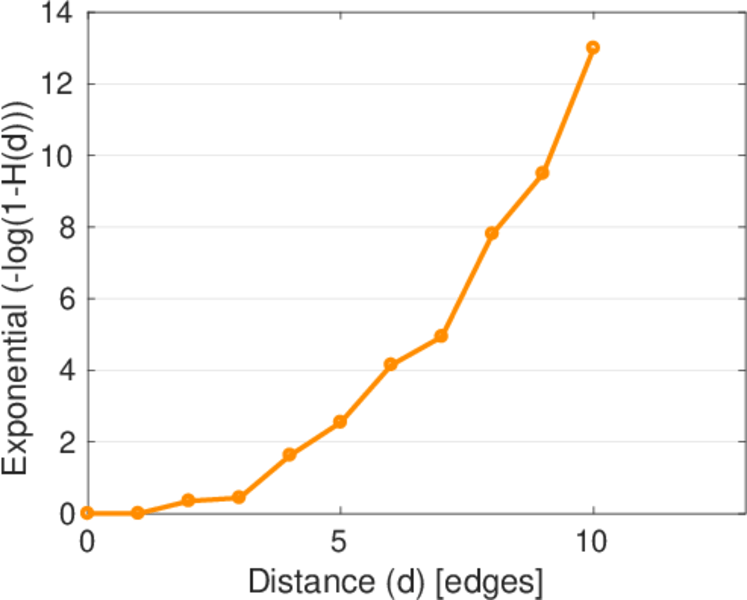
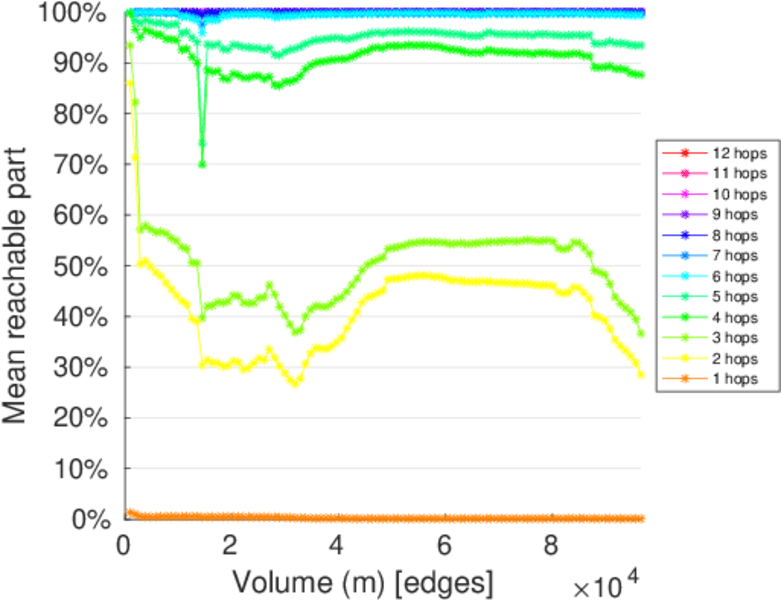
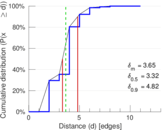
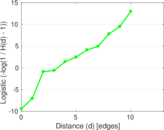
| Diameter | δ = | 12
|
| 50-Percentile effective diameter | δ0.5 = | 3.323 21
|
| 90-Percentile effective diameter | δ0.9 = | 4.816 51
|
| Median distance | δM = | 4
|
| Mean distance | δm = | 3.646 77
|
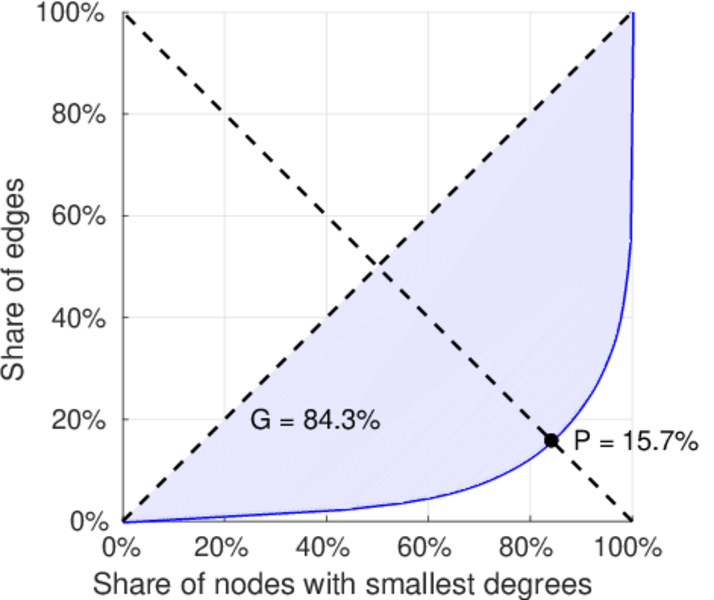
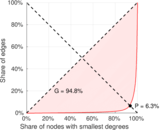
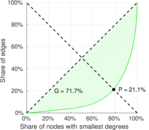
| Gini coefficient | G = | 0.845 388
|
| Balanced inequality ratio | P = | 0.158 217
|
| Left balanced inequality ratio | P1 = | 0.062 644 4
|
| Right balanced inequality ratio | P2 = | 0.210 704
|
| Relative edge distribution entropy | Her = | 0.761 521
|
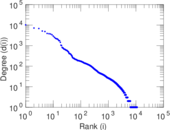
| Power law exponent | γ = | 2.126 15
|
| Tail power law exponent | γt = | 1.741 00
|
| Tail power law exponent with p | γ3 = | 1.741 00
|
| p-value | p = | 0.000 00
|
| Left tail power law exponent with p | γ3,1 = | 1.461 00
|
| Left p-value | p1 = | 0.000 00
|
| Right tail power law exponent with p | γ3,2 = | 3.681 00
|
| Right p-value | p2 = | 0.024 000 0
|
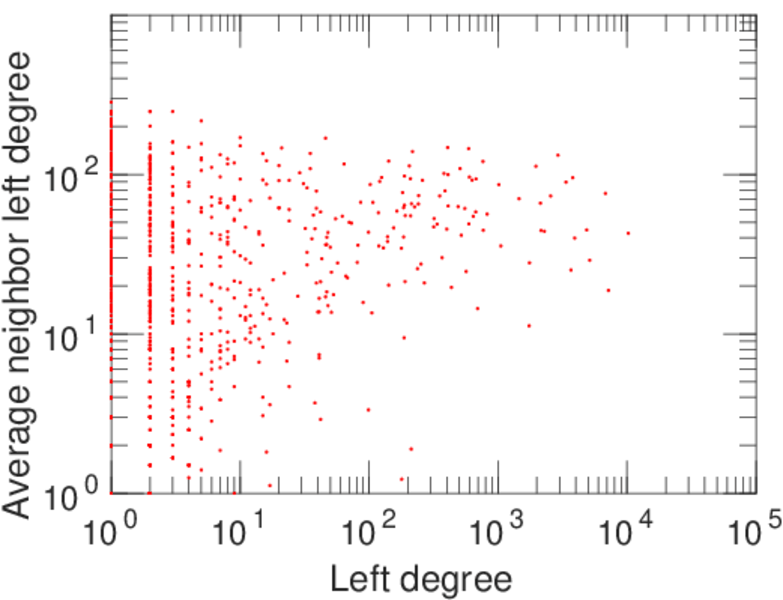
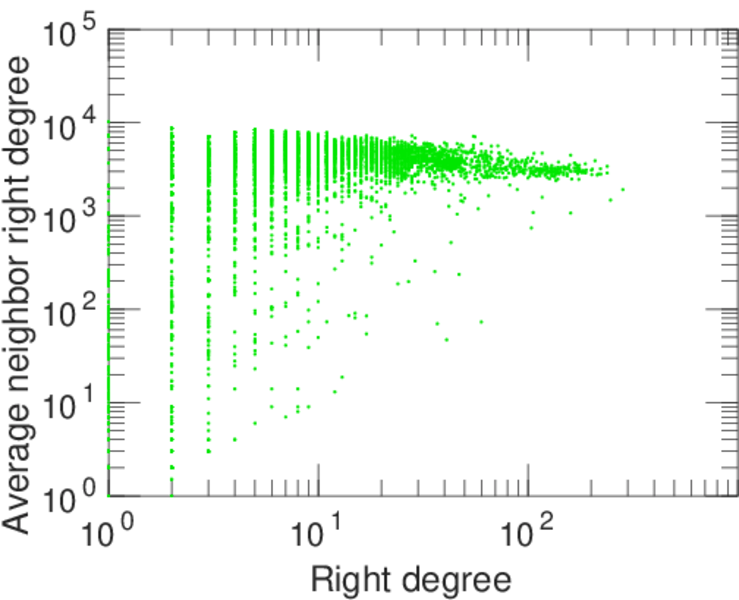
| Degree assortativity | ρ = | −0.291 938
|
| Degree assortativity p-value | pρ = | 0.000 00
|
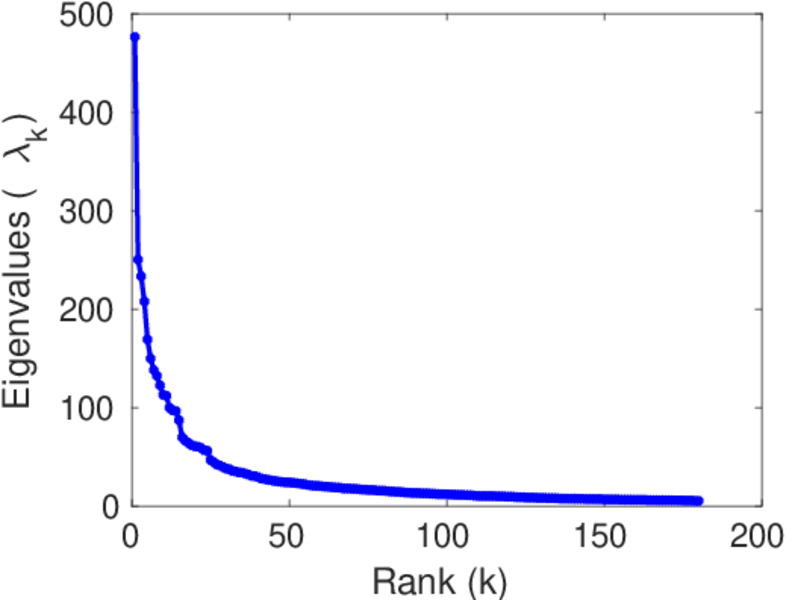
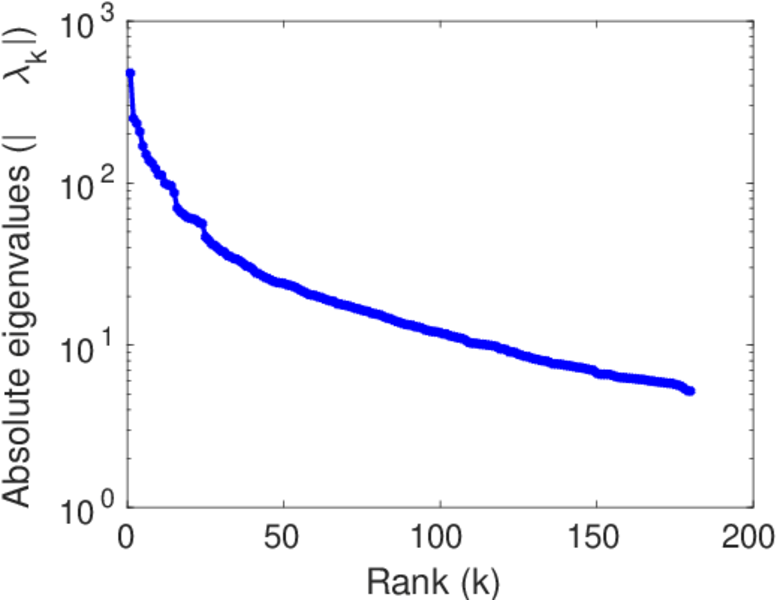
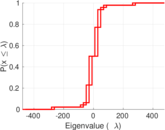
| Spectral norm | α = | 476.363
|
| Algebraic connectivity | a = | 0.026 190 0
|
| Spectral separation | |λ1[A] / λ2[A]| = | 1.903 63
|
| Controllability | C = | 9,136
|
| Relative controllability | Cr = | 0.827 686
|
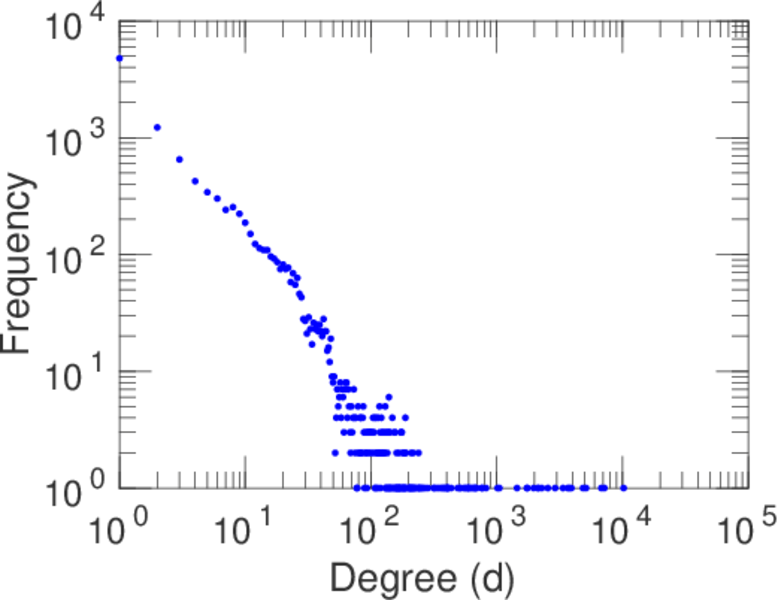
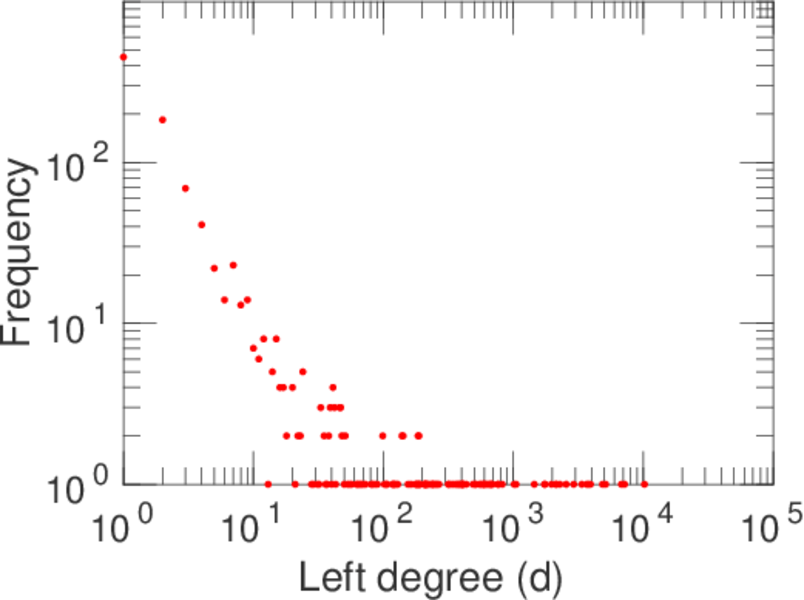
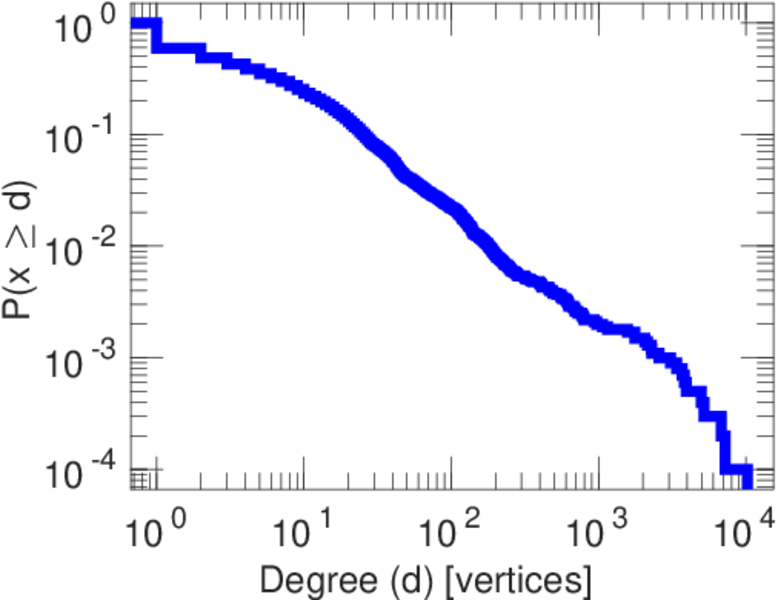
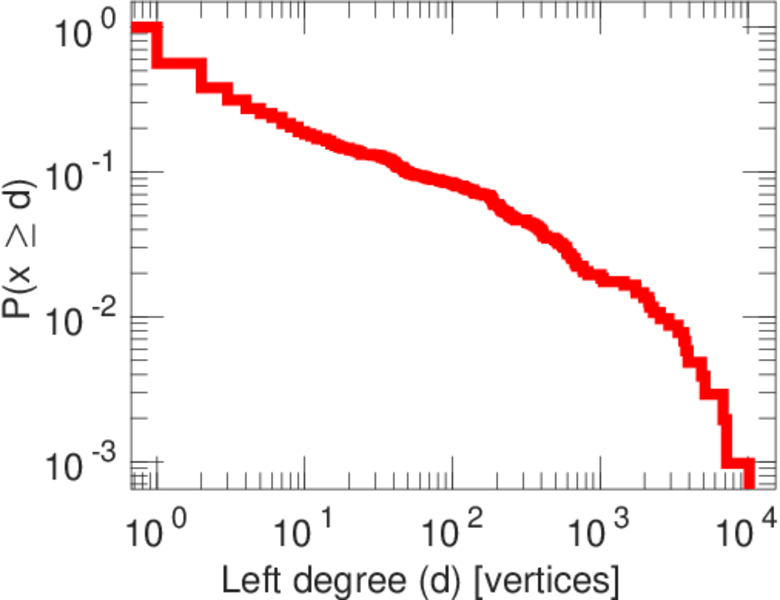
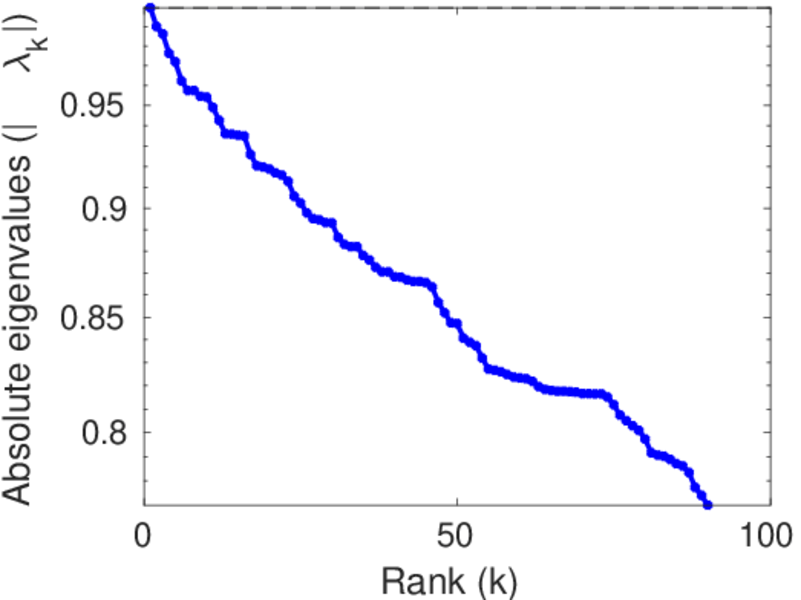
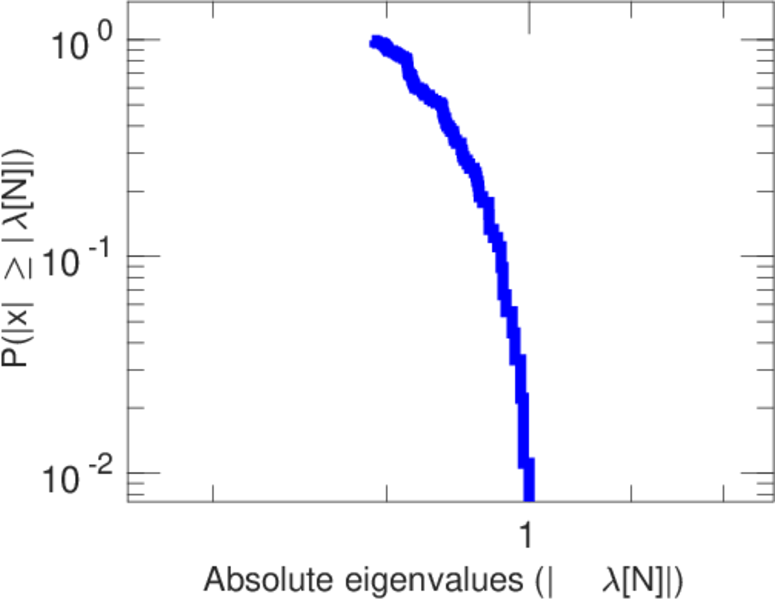
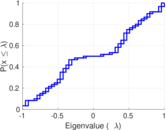
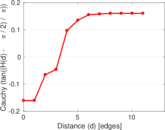
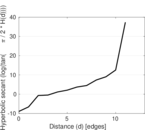
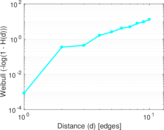
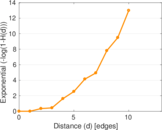
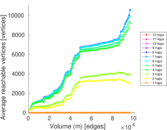
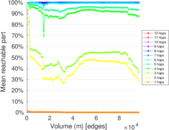
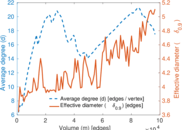
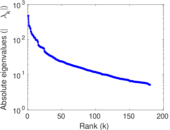
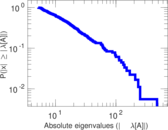
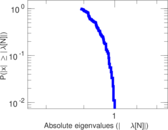
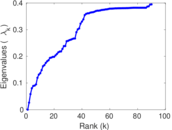
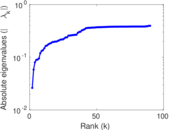
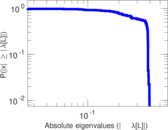
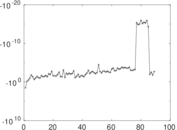
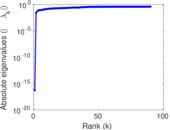
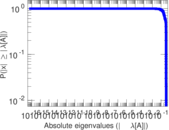
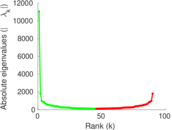
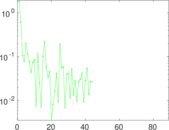
Plots


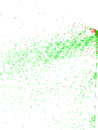

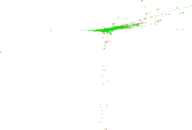


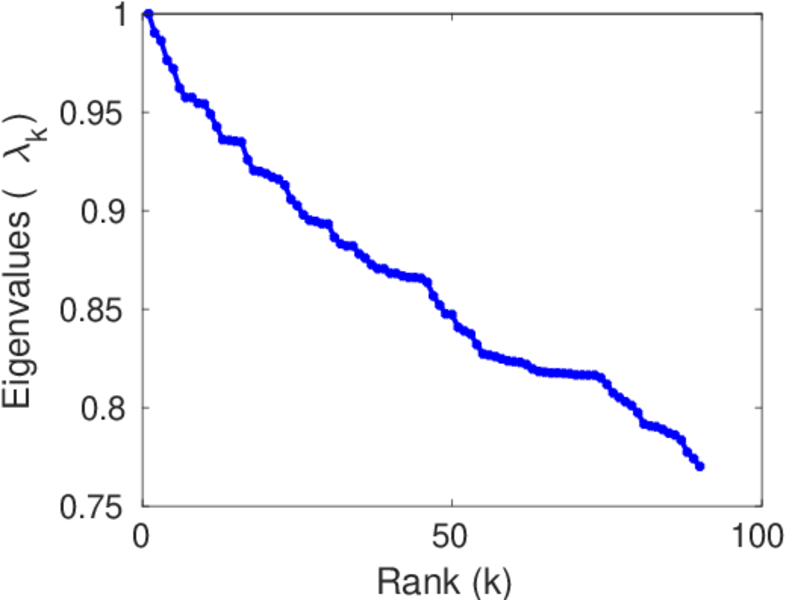
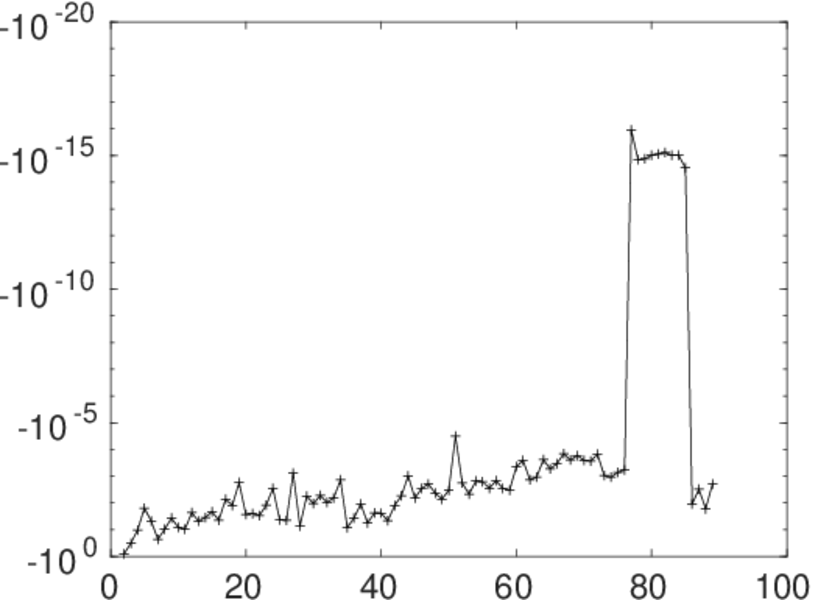
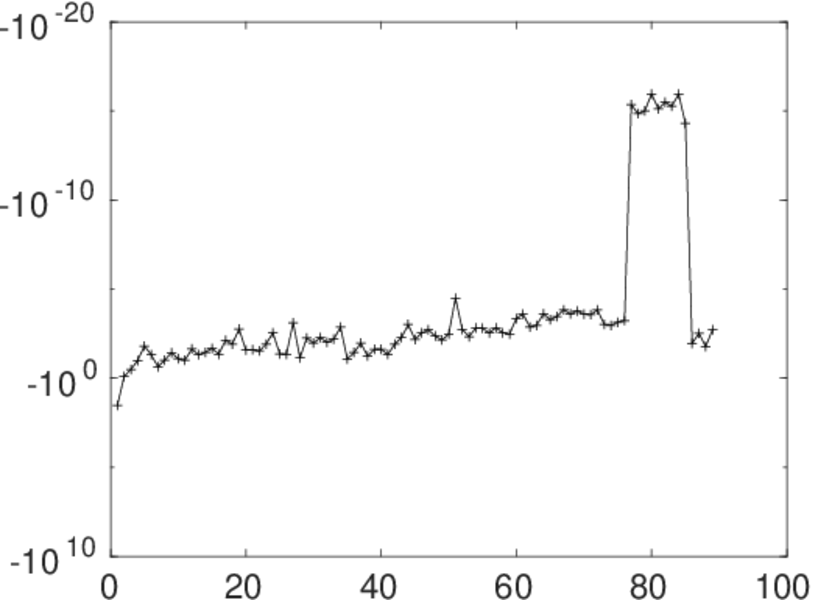
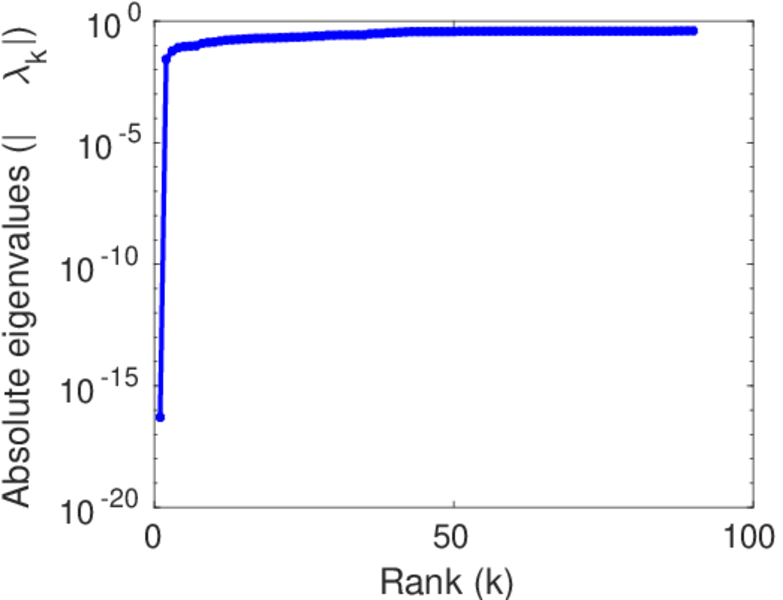
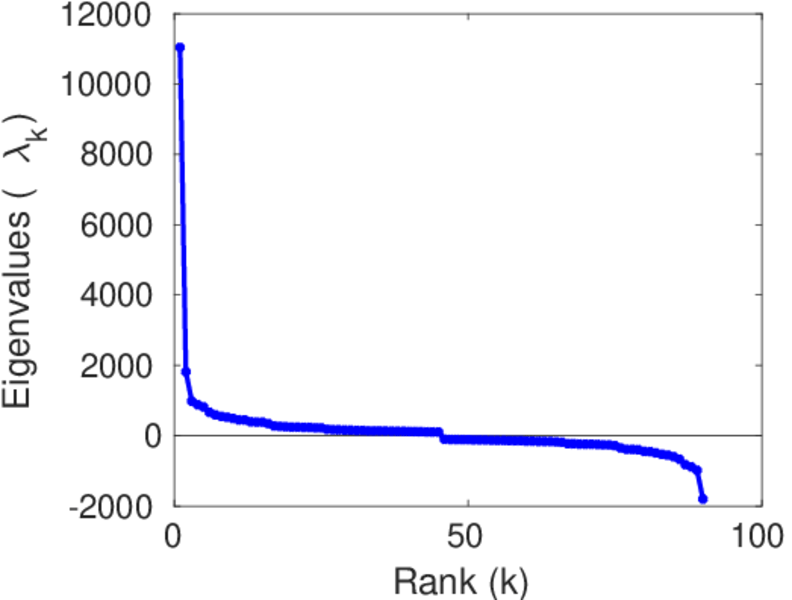
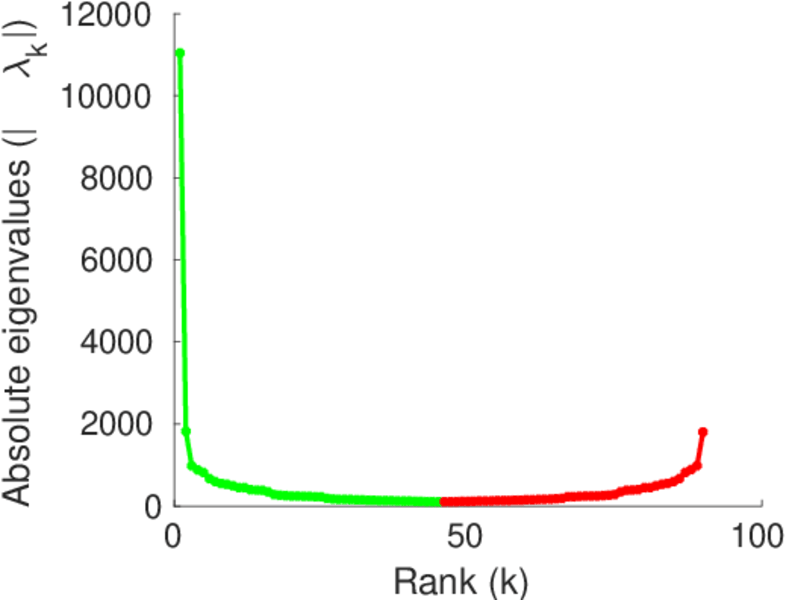
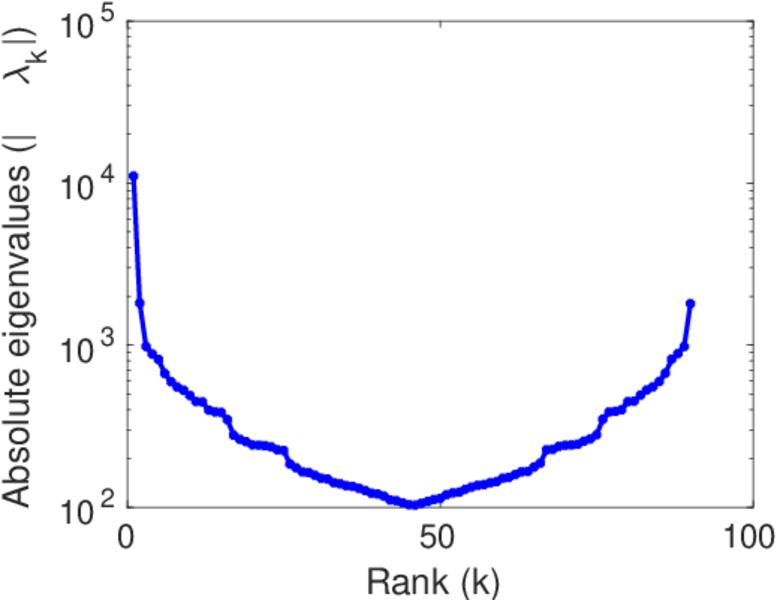
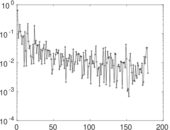
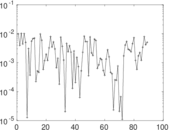
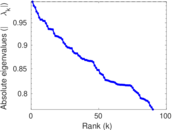
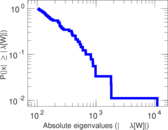
Matrix decompositions plots


Downloads
References
|
[1]
|
Jérôme Kunegis.
KONECT – The Koblenz Network Collection.
In Proc. Int. Conf. on World Wide Web Companion, pages
1343–1350, 2013.
[ http ]
|
|
[2]
|
Wikimedia Foundation.
Wikimedia downloads.
http://dumps.wikimedia.org/, January 2010.
|
 KONECT ‣ Networks ‣
Buy Me a Coffee
KONECT ‣ Networks ‣
Buy Me a Coffee