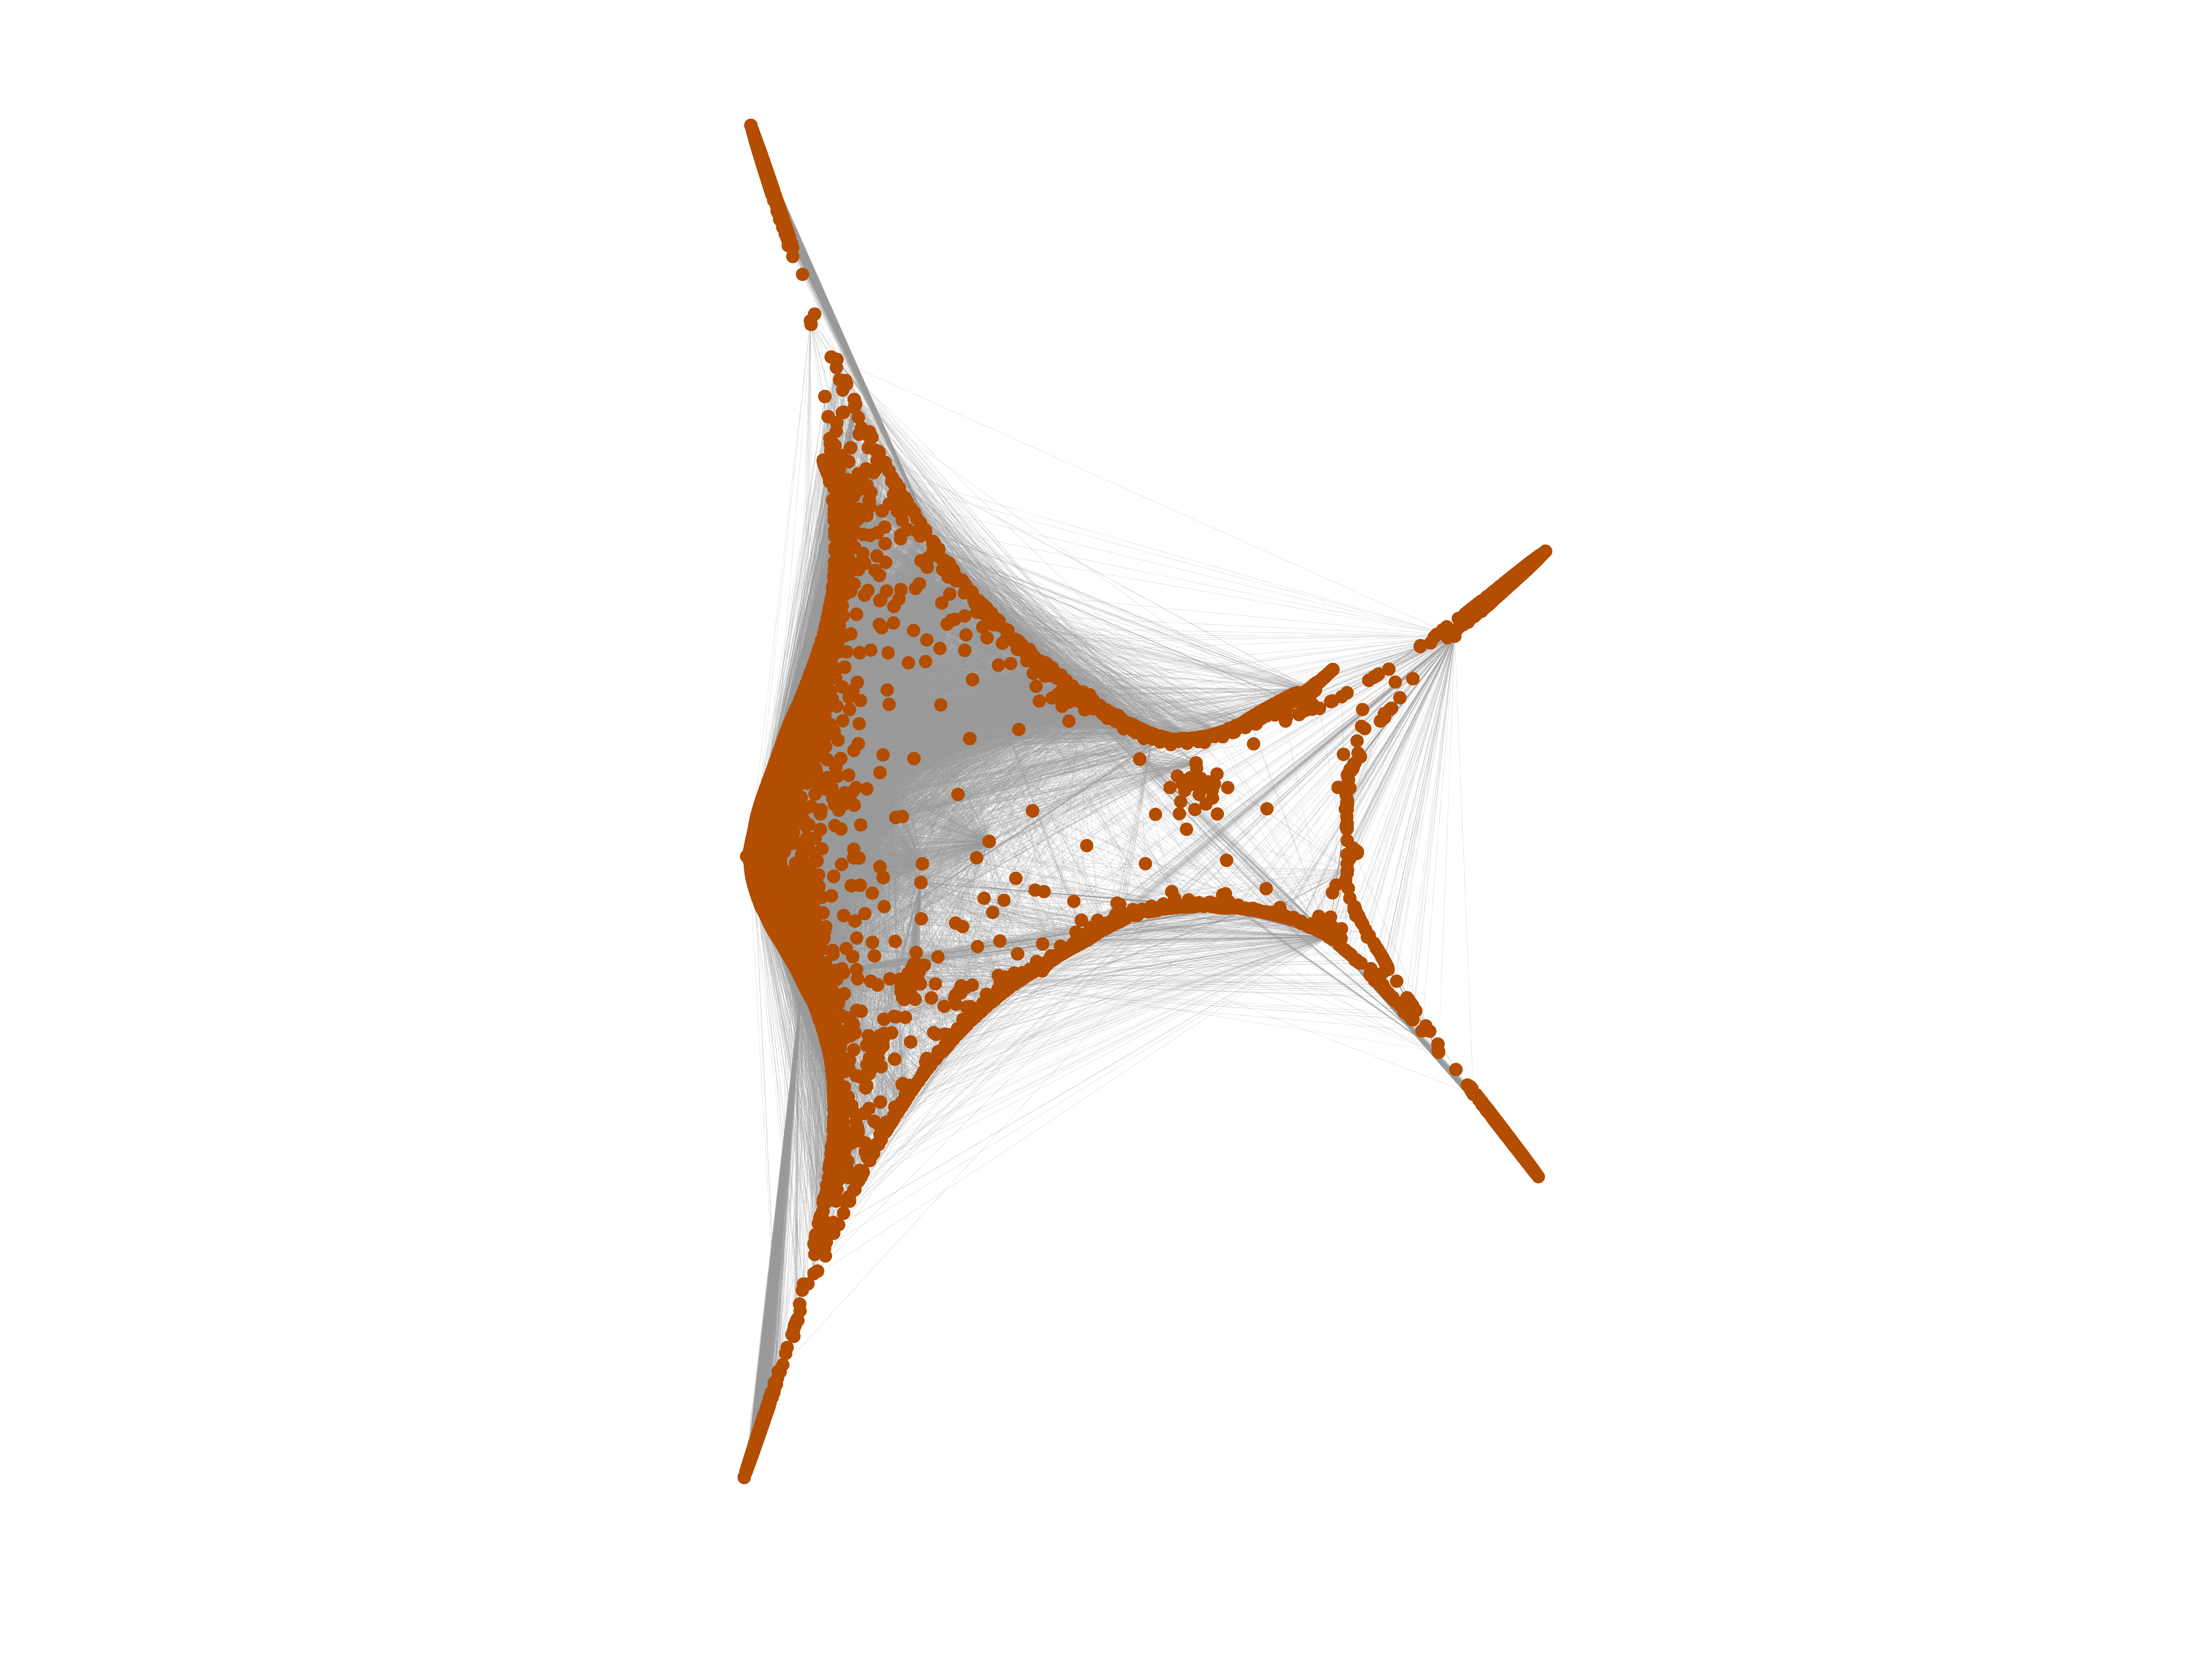
Wikipedia edits (ug)
This is the bipartite edit network of the Uyghur Wikipedia. It contains users
and pages from the Uyghur Wikipedia, connected by edit events. Each edge
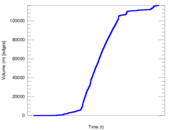
represents an edit. The dataset includes the timestamp of each edit.
Metadata
Statistics
| Size | n = | 12,183
|
| Left size | n1 = | 1,102
|
| Right size | n2 = | 11,081
|
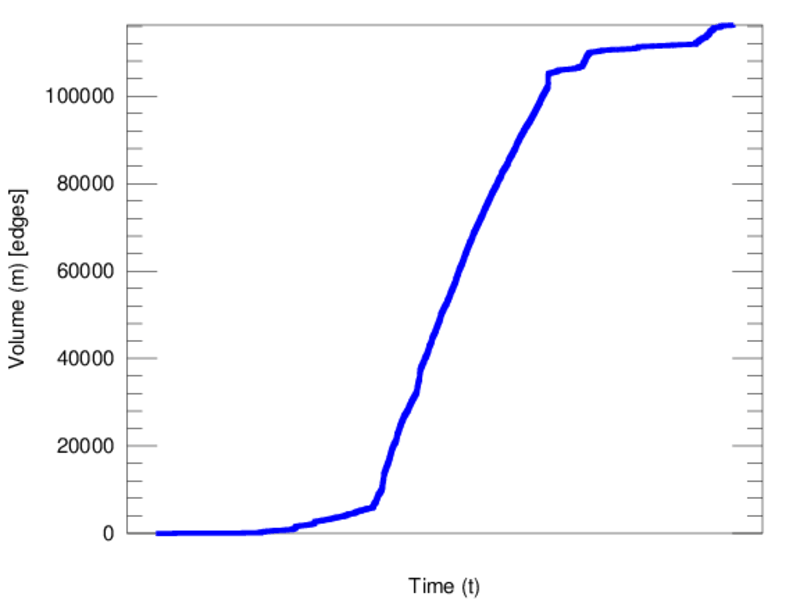
| Volume | m = | 116,274
|
| Unique edge count | m̿ = | 55,347
|
| Wedge count | s = | 33,902,617
|
| Claw count | z = | 20,514,180,121
|
| Cross count | x = | 10,950,231,379,116
|
| Square count | q = | 114,015,894
|
| 4-Tour count | T4 = | 1,047,862,790
|
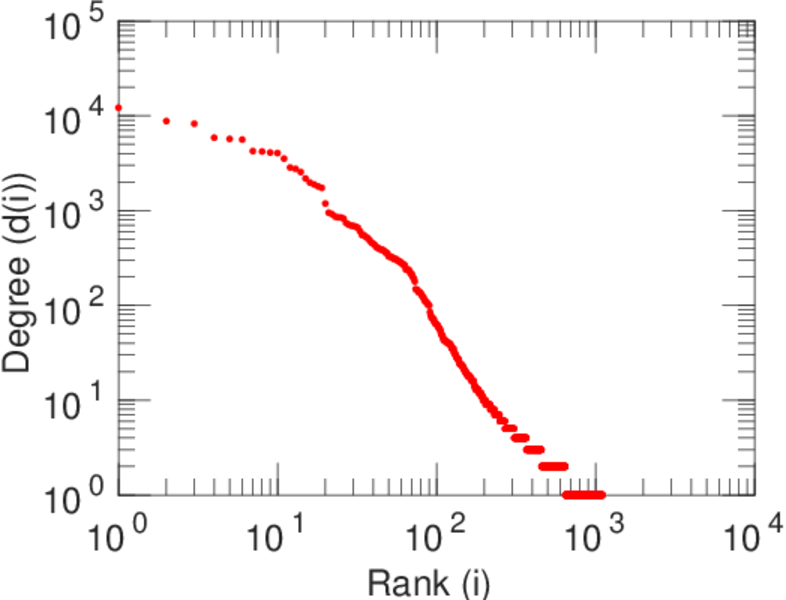
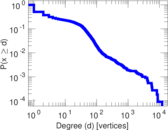
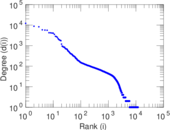
| Maximum degree | dmax = | 12,168
|
| Maximum left degree | d1max = | 12,168
|
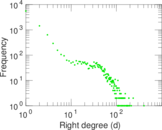
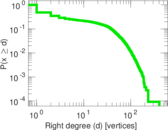
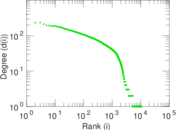
| Maximum right degree | d2max = | 406
|
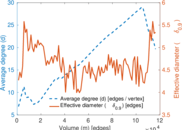
| Average degree | d = | 19.087 9
|
| Average left degree | d1 = | 105.512
|
| Average right degree | d2 = | 10.493 1
|
| Fill | p = | 0.004 532 46
|
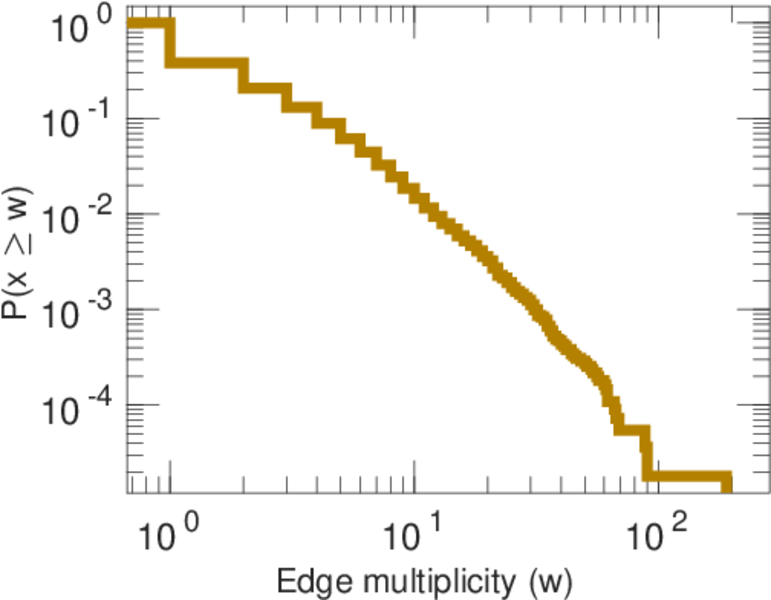
| Average edge multiplicity | m̃ = | 2.100 82
|
| Size of LCC | N = | 11,137
|
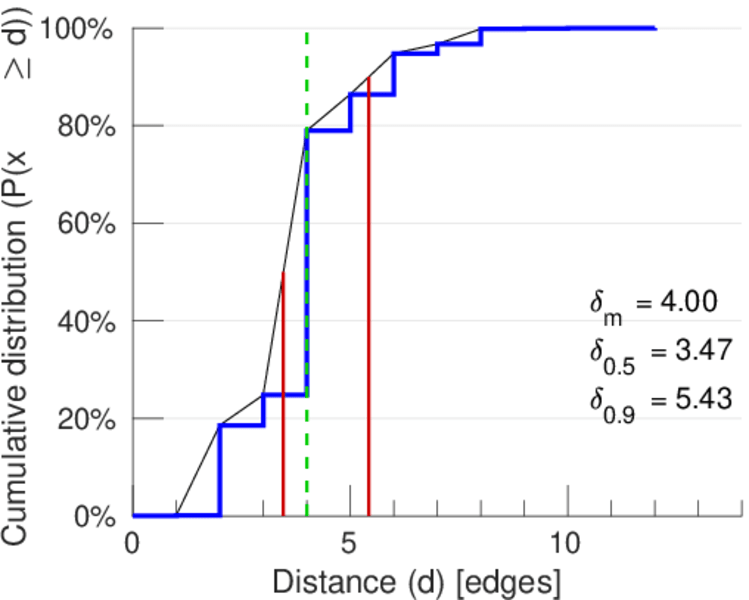
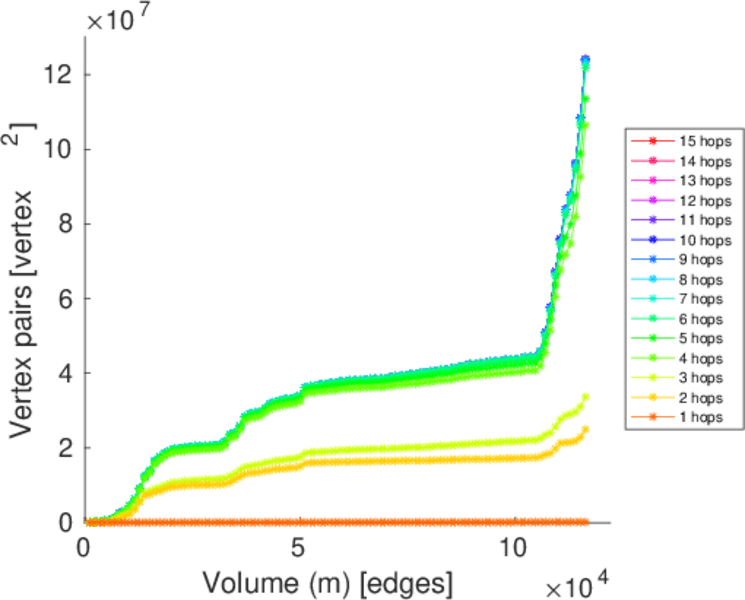
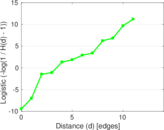
| Diameter | δ = | 14
|
| 50-Percentile effective diameter | δ0.5 = | 3.465 55
|
| 90-Percentile effective diameter | δ0.9 = | 5.430 73
|
| Median distance | δM = | 4
|
| Mean distance | δm = | 4.000 69
|
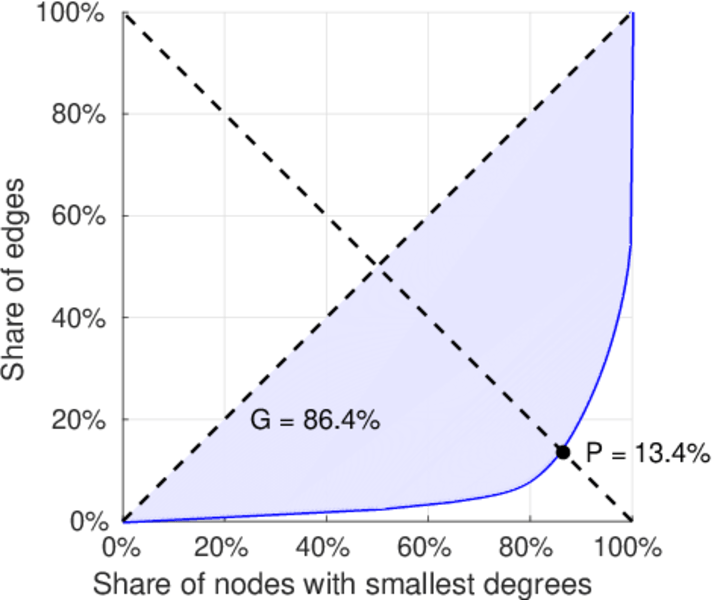
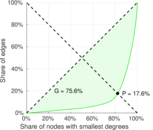
| Gini coefficient | G = | 0.863 823
|
| Balanced inequality ratio | P = | 0.141 364
|
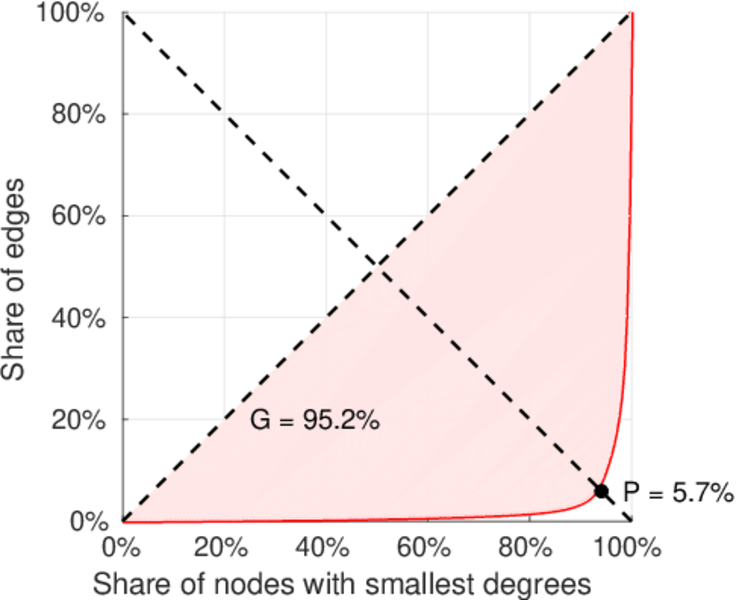
| Left balanced inequality ratio | P1 = | 0.057 433 3
|
| Right balanced inequality ratio | P2 = | 0.175 585
|
| Relative edge distribution entropy | Her = | 0.754 649
|
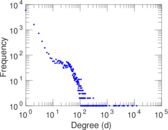
| Power law exponent | γ = | 2.309 95
|
| Tail power law exponent | γt = | 1.821 00
|
| Tail power law exponent with p | γ3 = | 1.821 00
|
| p-value | p = | 0.000 00
|
| Left tail power law exponent with p | γ3,1 = | 1.661 00
|
| Left p-value | p1 = | 0.000 00
|
| Right tail power law exponent with p | γ3,2 = | 8.911 00
|
| Right p-value | p2 = | 0.124 000
|
| Degree assortativity | ρ = | −0.212 250
|
| Degree assortativity p-value | pρ = | 0.000 00
|
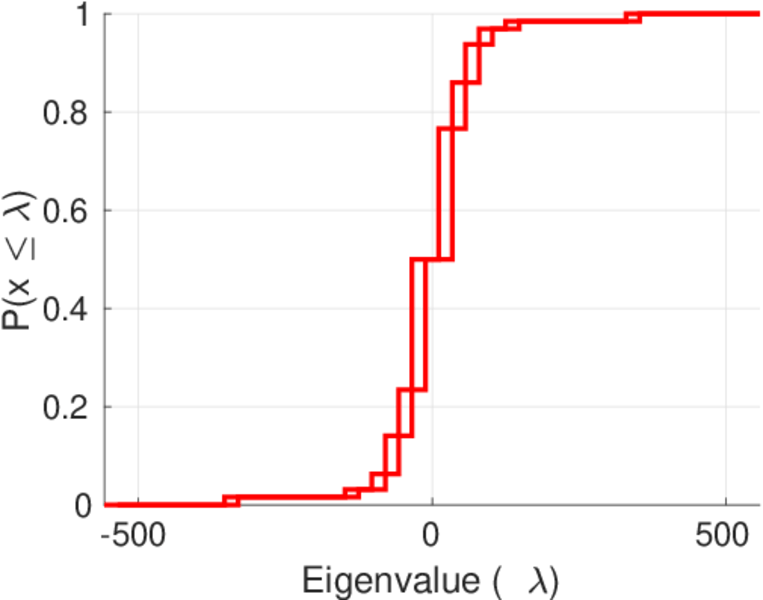
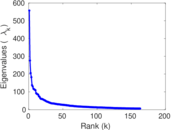
| Spectral norm | α = | 557.331
|
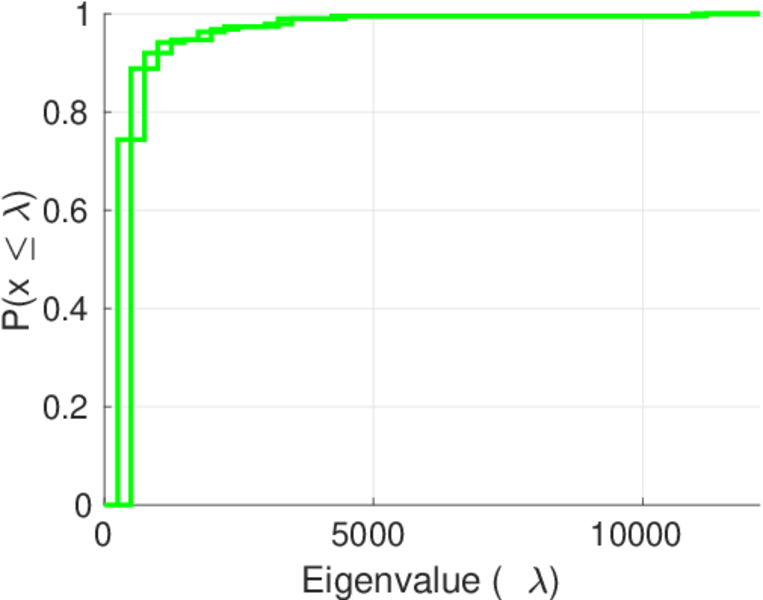
| Algebraic connectivity | a = | 0.005 644 07
|
| Spectral separation | |λ1[A] / λ2[A]| = | 2.017 54
|
| Controllability | C = | 9,755
|
| Relative controllability | Cr = | 0.824 668
|
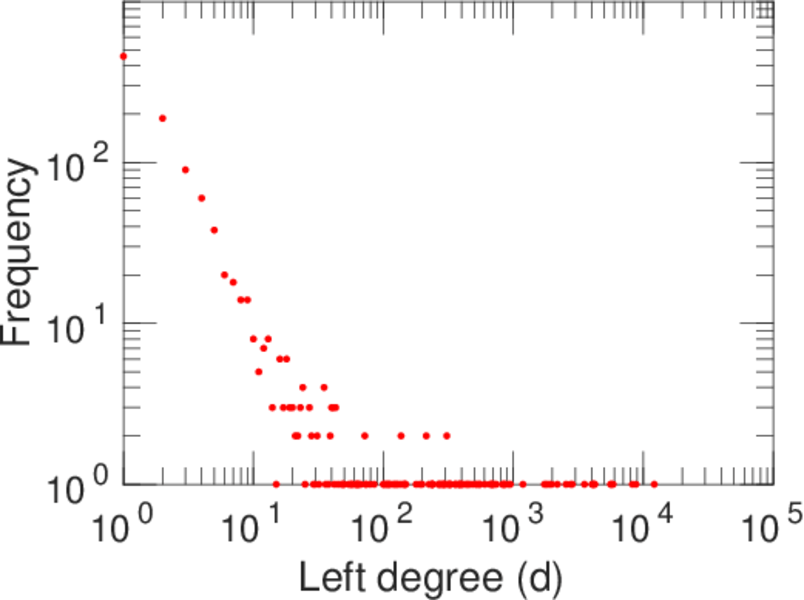
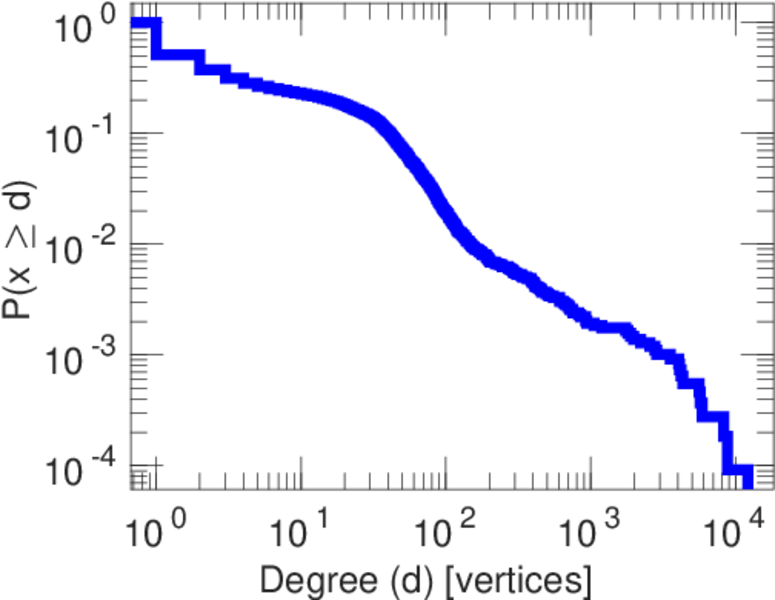
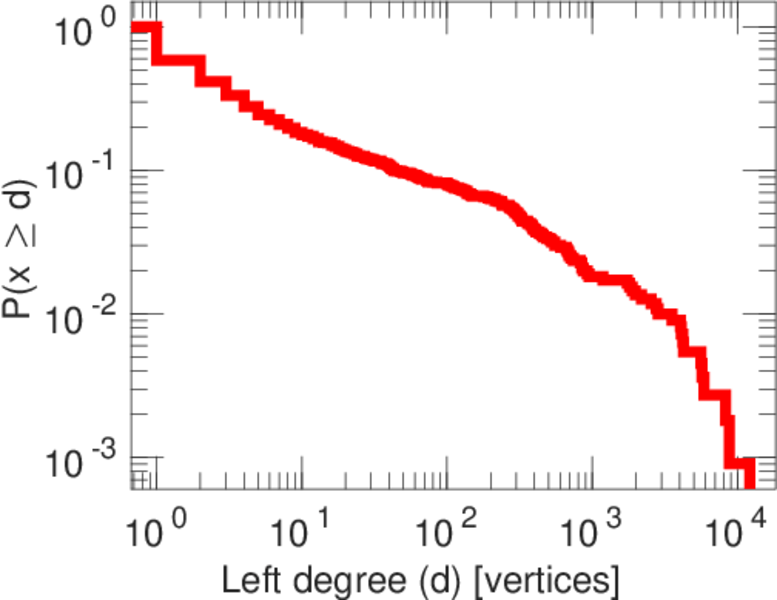
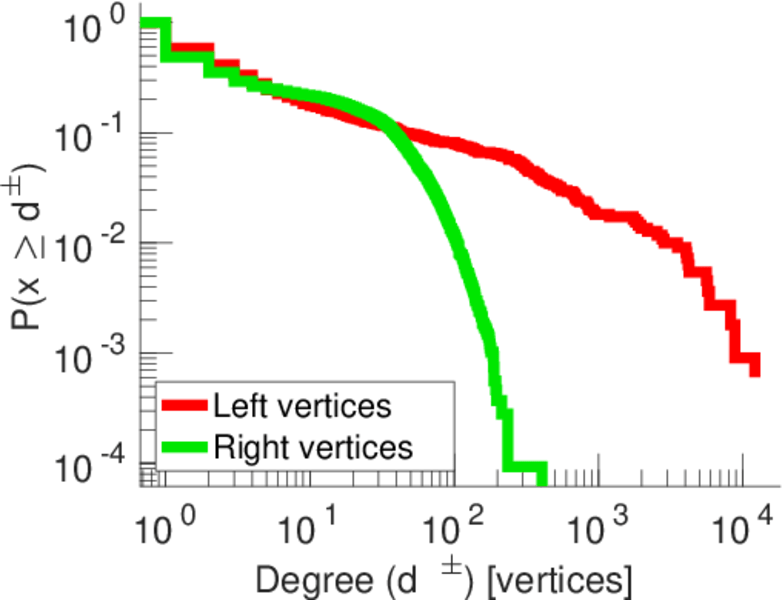
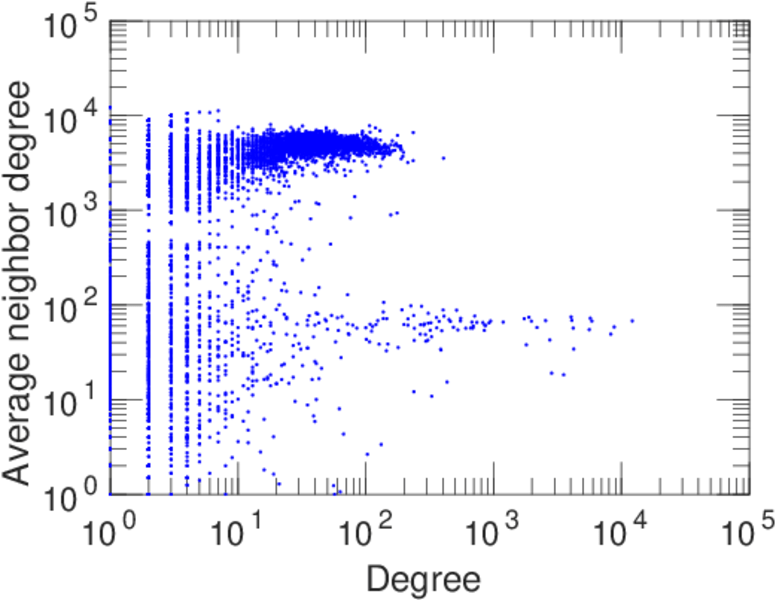
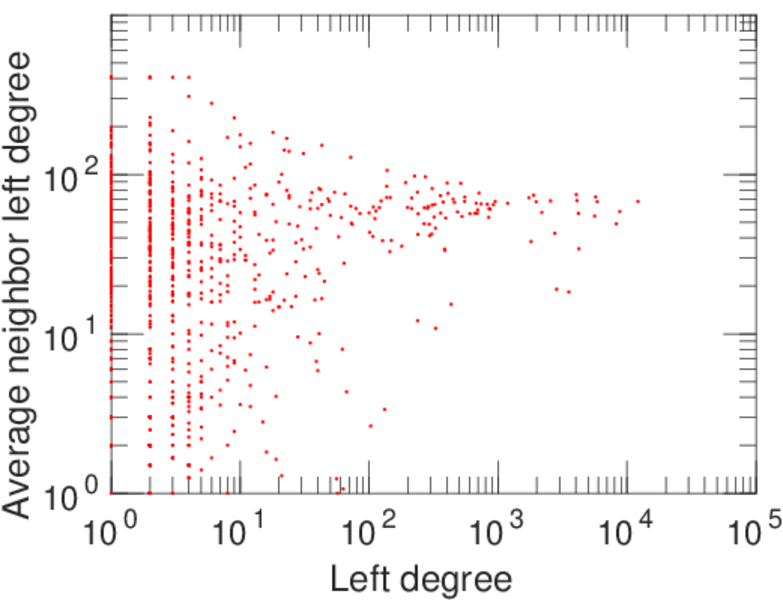
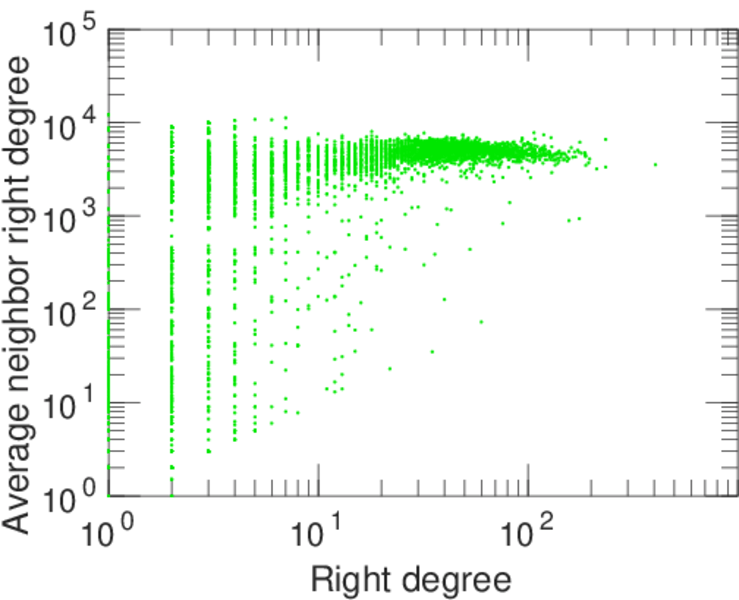
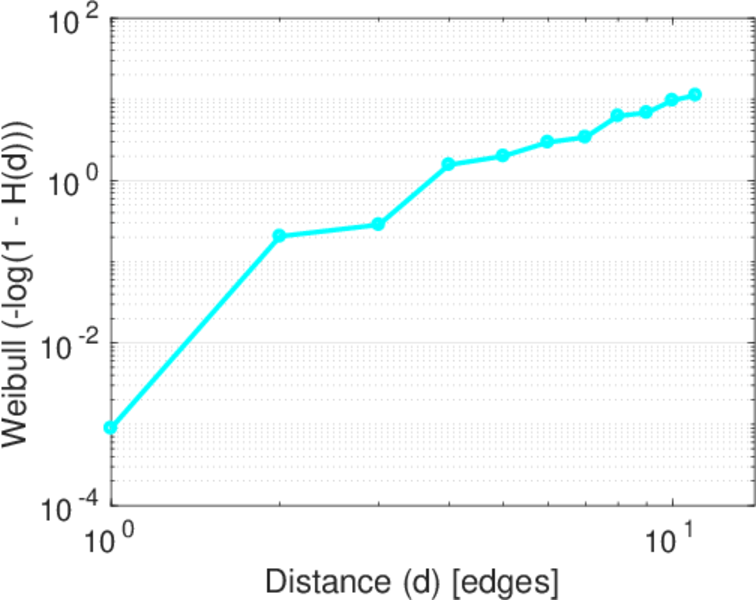
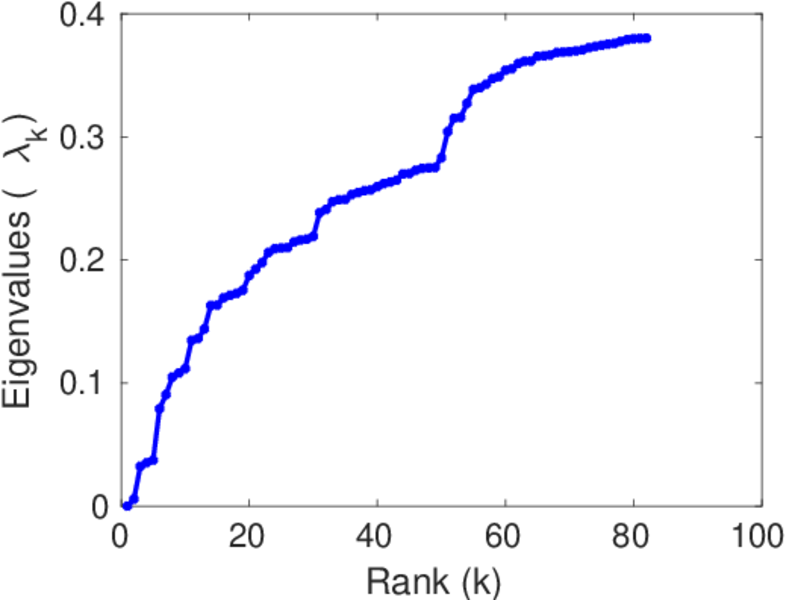
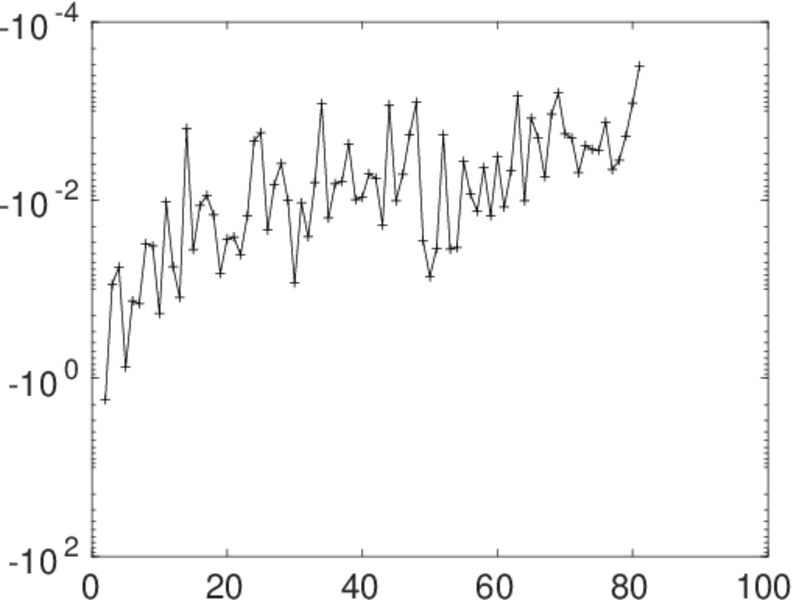
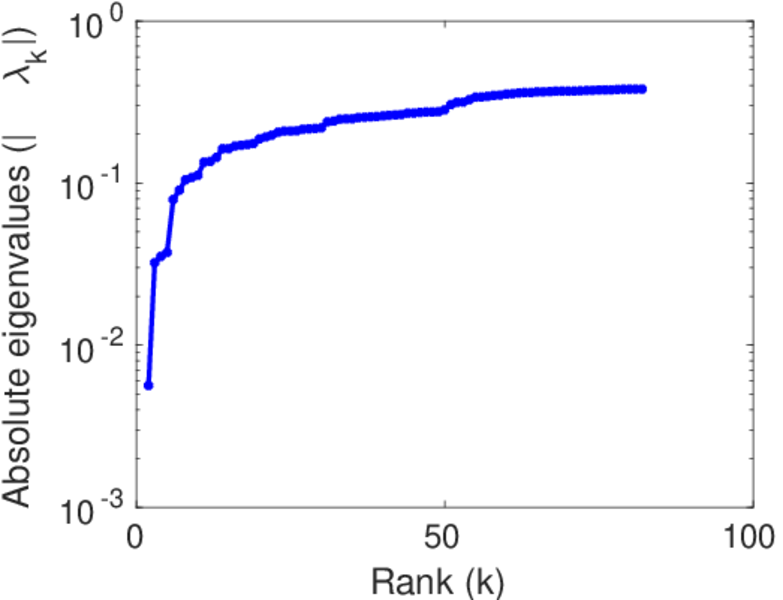
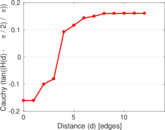
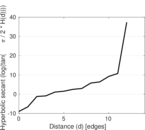
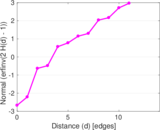
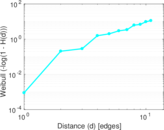
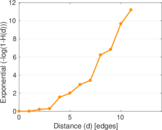
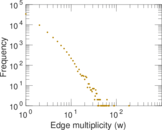
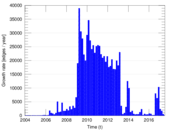
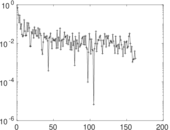
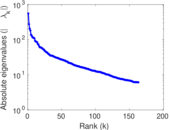
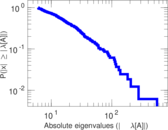
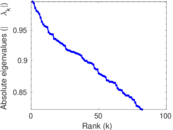
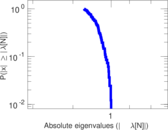
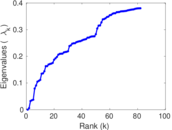
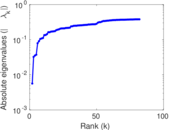
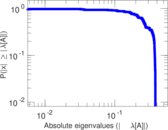
Plots


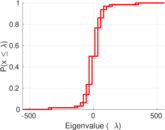
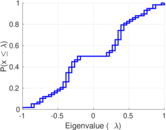

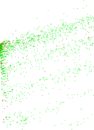
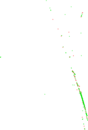


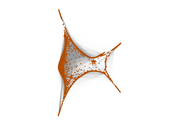


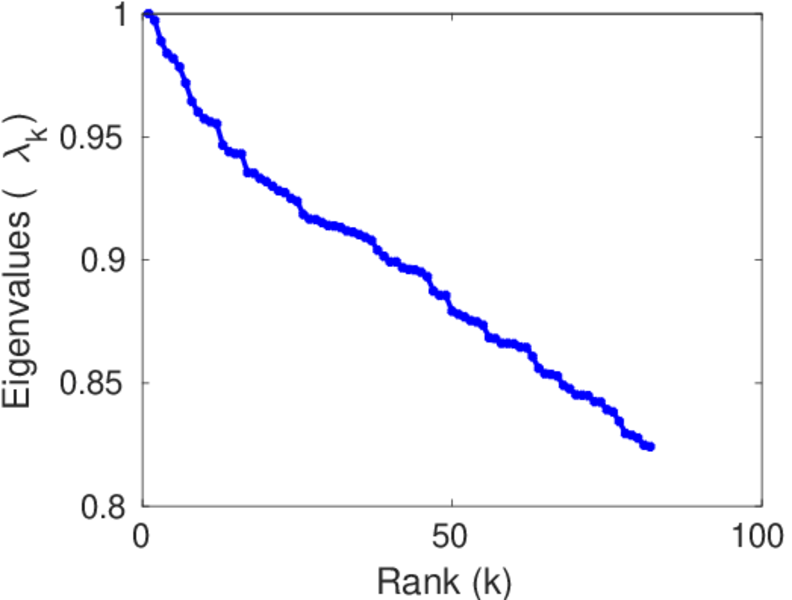
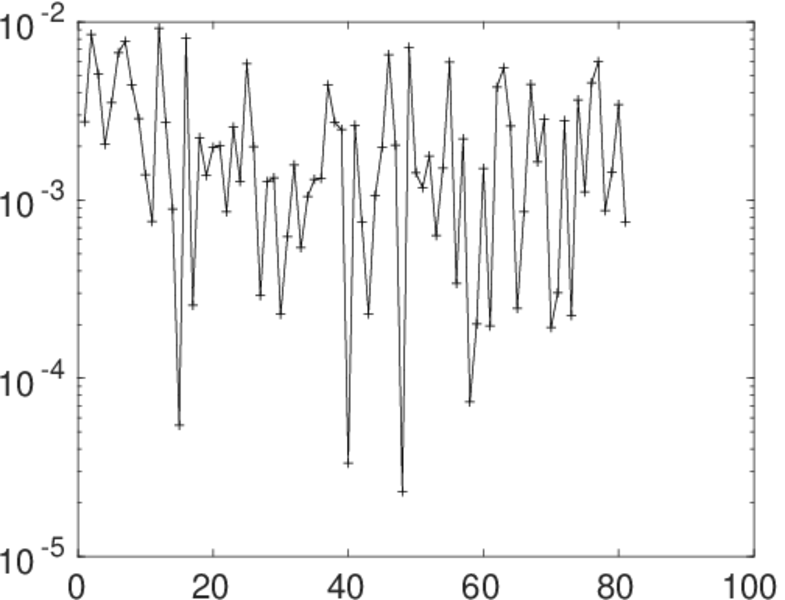
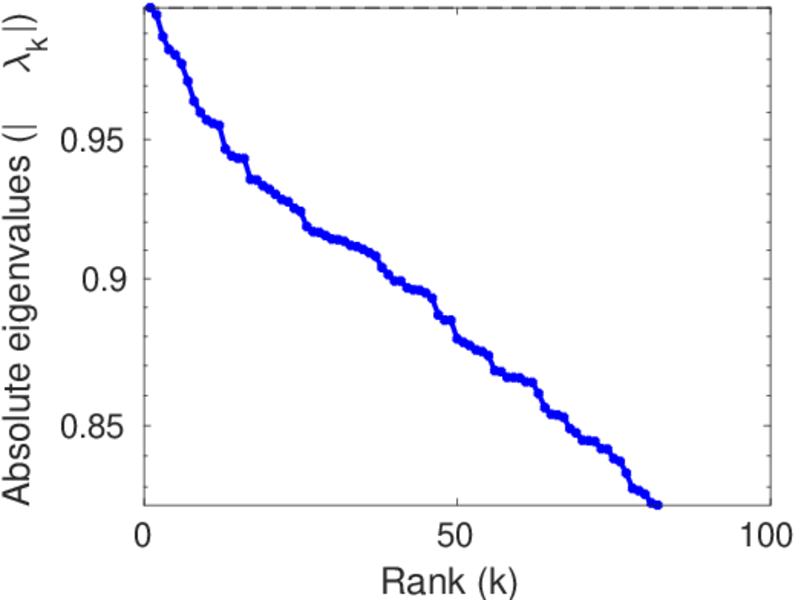
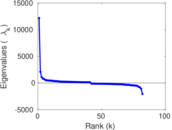
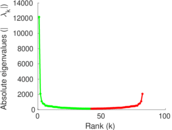
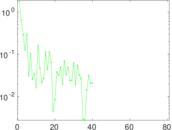
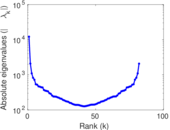
Matrix decompositions plots


Downloads
References
|
[1]
|
Jérôme Kunegis.
KONECT – The Koblenz Network Collection.
In Proc. Int. Conf. on World Wide Web Companion, pages
1343–1350, 2013.
[ http ]
|
|
[2]
|
Wikimedia Foundation.
Wikimedia downloads.
http://dumps.wikimedia.org/, January 2010.
|
 KONECT ‣ Networks ‣
Buy Me a Coffee
KONECT ‣ Networks ‣
Buy Me a Coffee