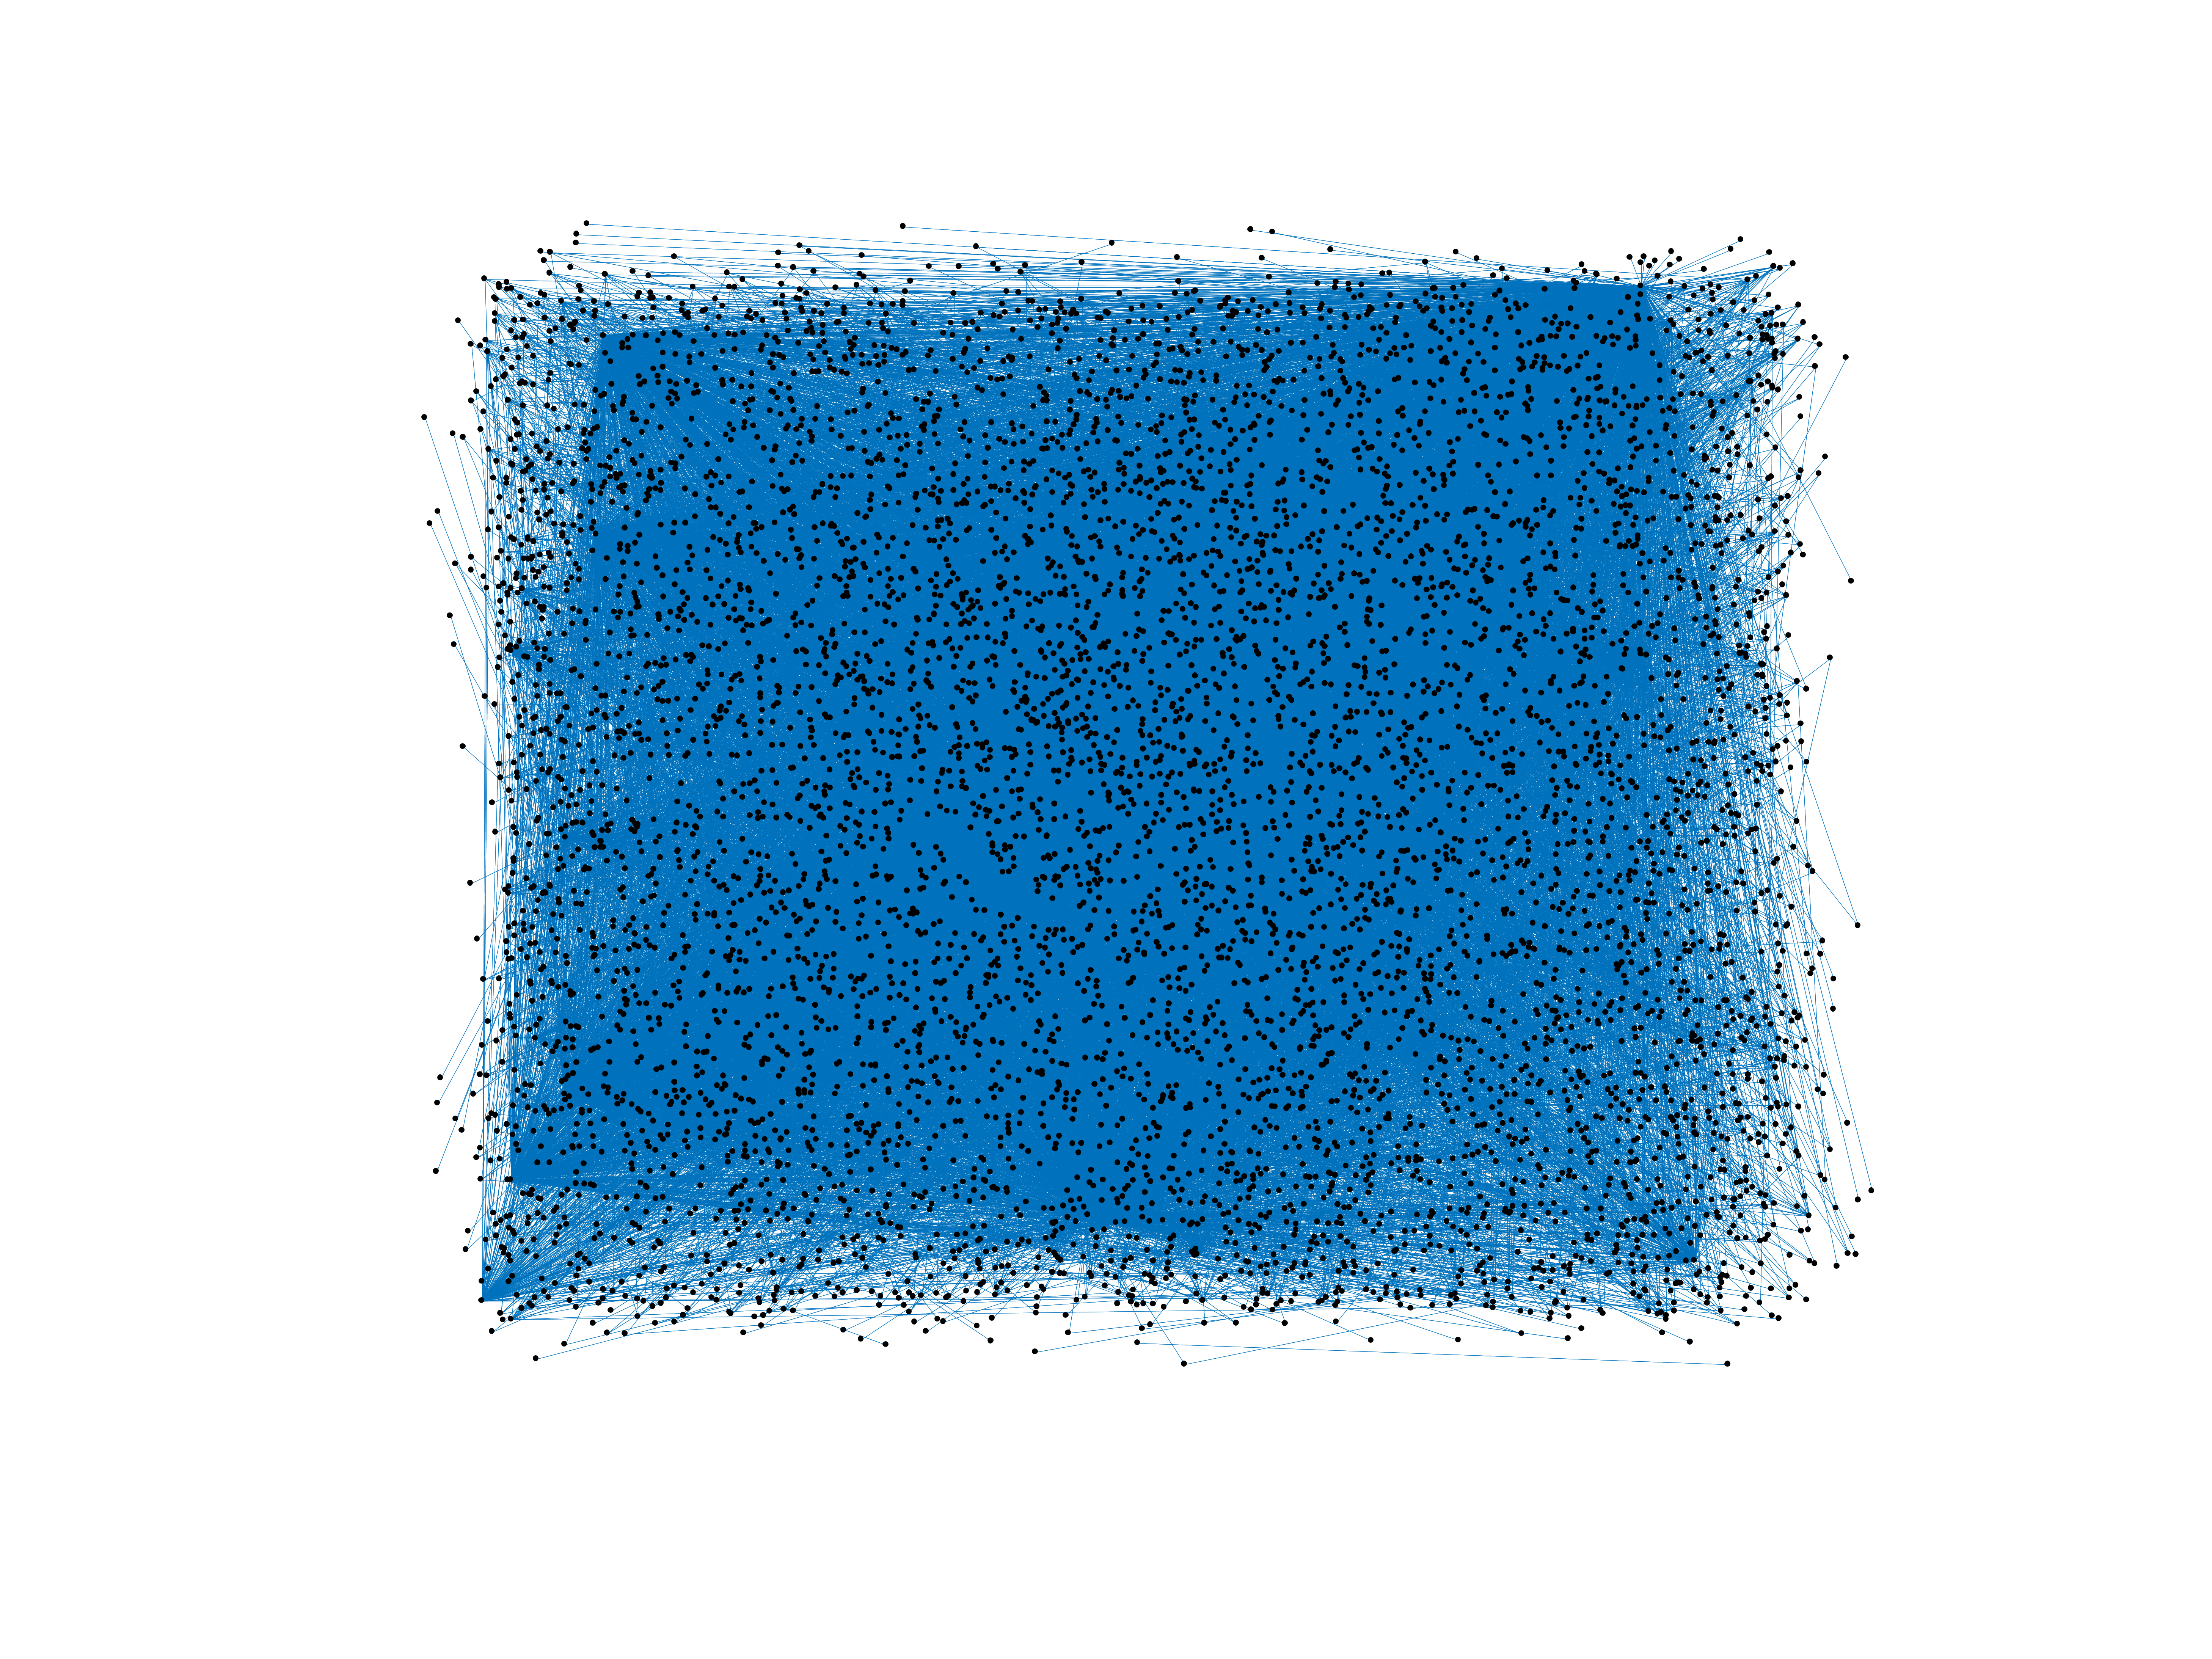
Wikinews edits (uk)
This is the bipartite edit network of the Ukrainian Wikinews. It contains users
and pages from the Ukrainian Wikinews, connected by edit events. Each edge
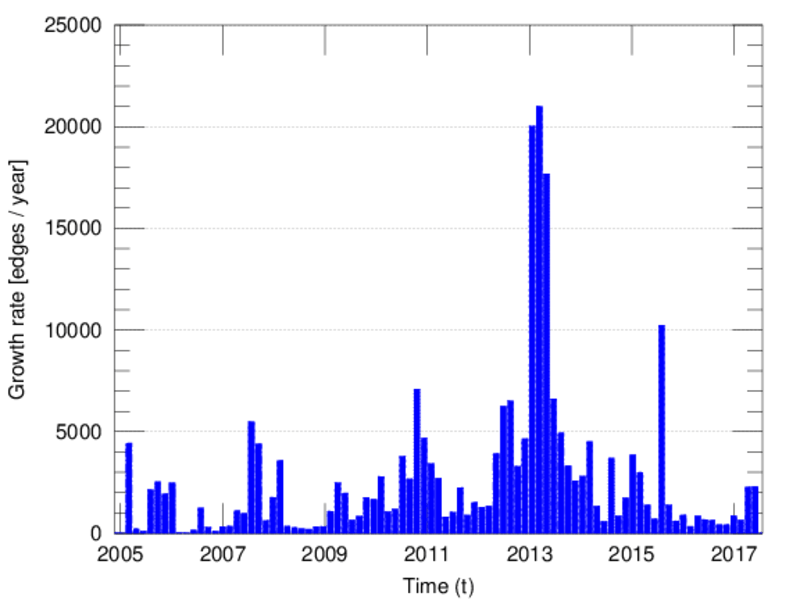
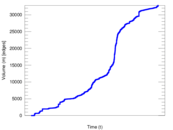
represents an edit. The dataset includes the timestamp of each edit.
Metadata
Statistics
| Size | n = | 6,964
|
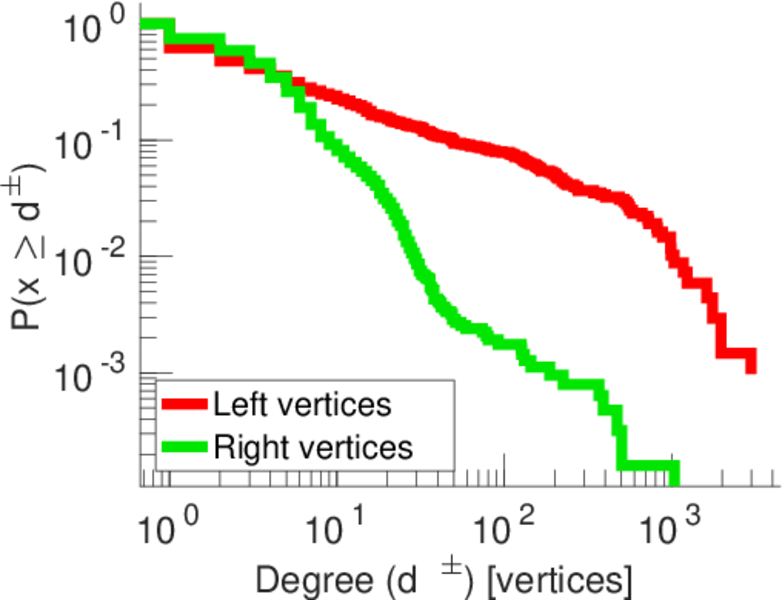
| Left size | n1 = | 680
|
| Right size | n2 = | 6,284
|
| Volume | m = | 32,800
|
| Unique edge count | m̿ = | 19,400
|
| Wedge count | s = | 5,701,828
|
| Claw count | z = | 1,965,887,009
|
| Cross count | x = | 661,341,201,264
|
| Square count | q = | 3,700,338
|
| 4-Tour count | T4 = | 52,456,052
|
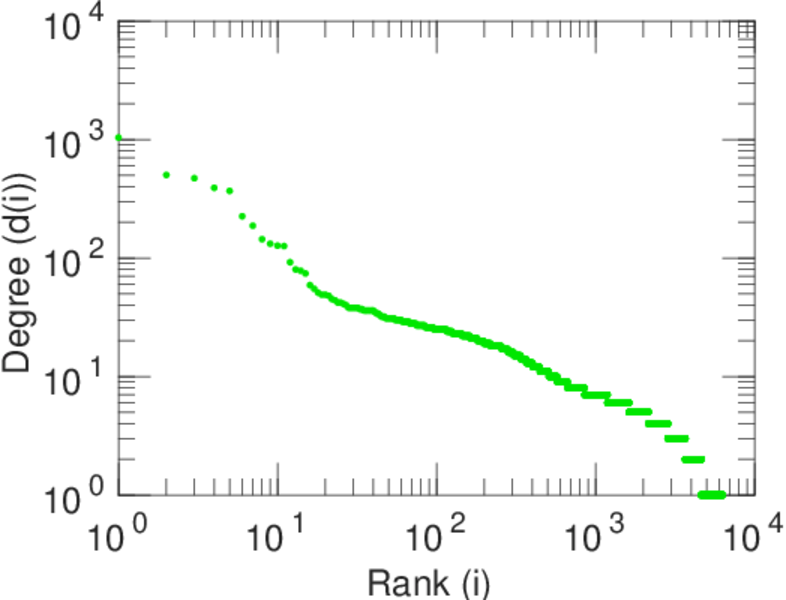
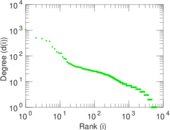
| Maximum degree | dmax = | 2,979
|
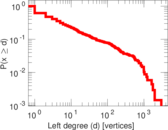
| Maximum left degree | d1max = | 2,979
|
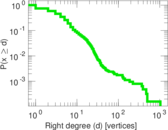
| Maximum right degree | d2max = | 1,038
|
| Average degree | d = | 9.419 87
|
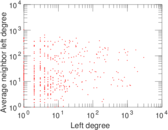
| Average left degree | d1 = | 48.235 3
|
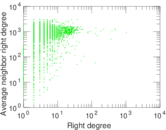
| Average right degree | d2 = | 5.219 61
|
| Fill | p = | 0.004 540 01
|
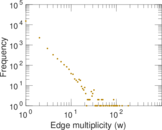
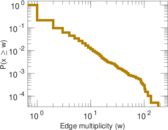
| Average edge multiplicity | m̃ = | 1.690 72
|
| Size of LCC | N = | 6,657
|
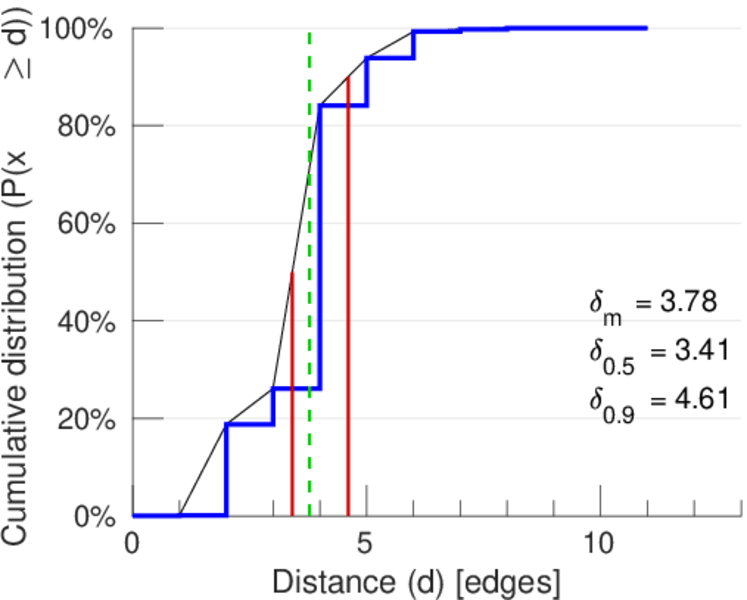
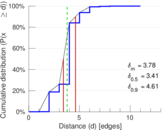
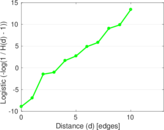
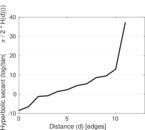
| Diameter | δ = | 11
|
| 50-Percentile effective diameter | δ0.5 = | 3.412 25
|
| 90-Percentile effective diameter | δ0.9 = | 4.607 04
|
| Median distance | δM = | 4
|
| Mean distance | δm = | 3.781 84
|
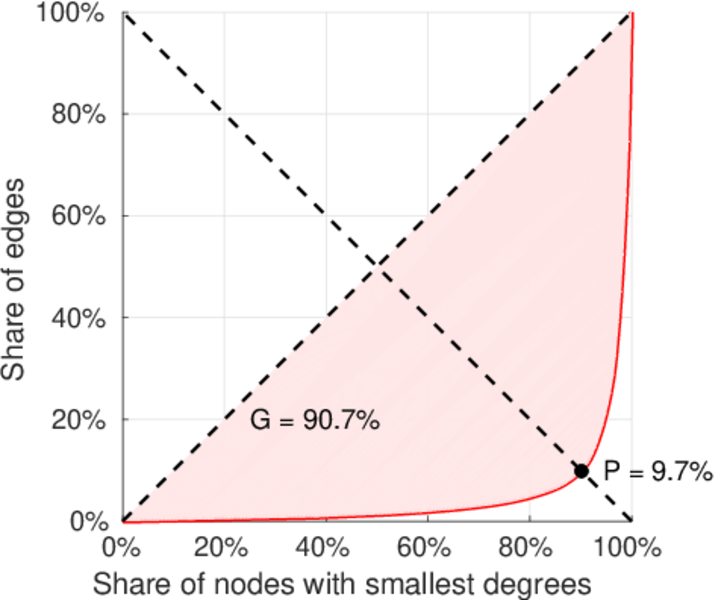
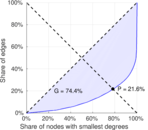
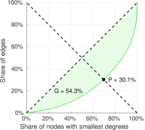
| Gini coefficient | G = | 0.746 256
|
| Balanced inequality ratio | P = | 0.214 802
|
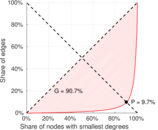
| Left balanced inequality ratio | P1 = | 0.096 981 7
|
| Right balanced inequality ratio | P2 = | 0.300 762
|
| Relative edge distribution entropy | Her = | 0.792 930
|
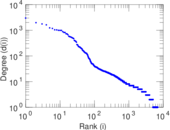
| Power law exponent | γ = | 2.162 85
|
| Tail power law exponent | γt = | 2.701 00
|
| Tail power law exponent with p | γ3 = | 2.701 00
|
| p-value | p = | 0.000 00
|
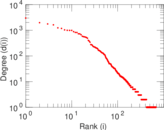
| Left tail power law exponent with p | γ3,1 = | 1.591 00
|
| Left p-value | p1 = | 0.082 000 0
|
| Right tail power law exponent with p | γ3,2 = | 4.111 00
|
| Right p-value | p2 = | 0.000 00
|
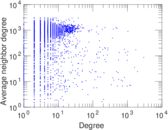
| Degree assortativity | ρ = | −0.130 894
|
| Degree assortativity p-value | pρ = | 7.000 65 × 10−75
|
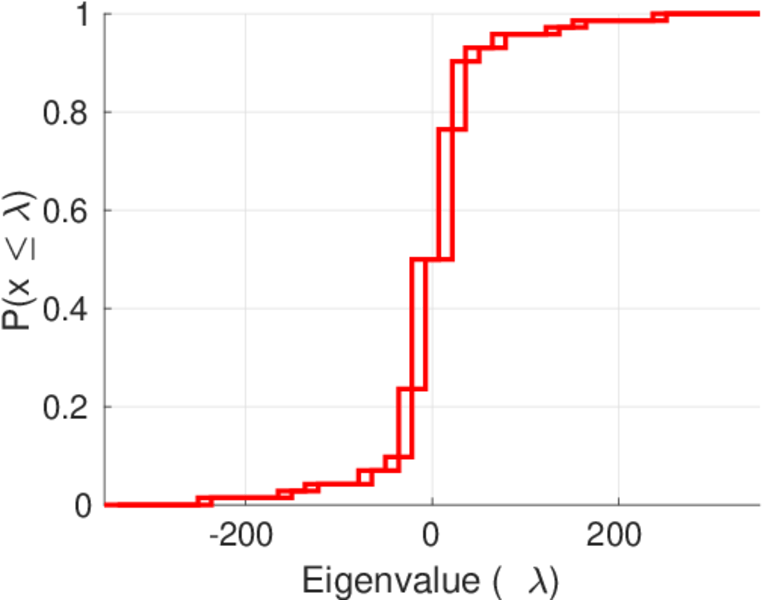
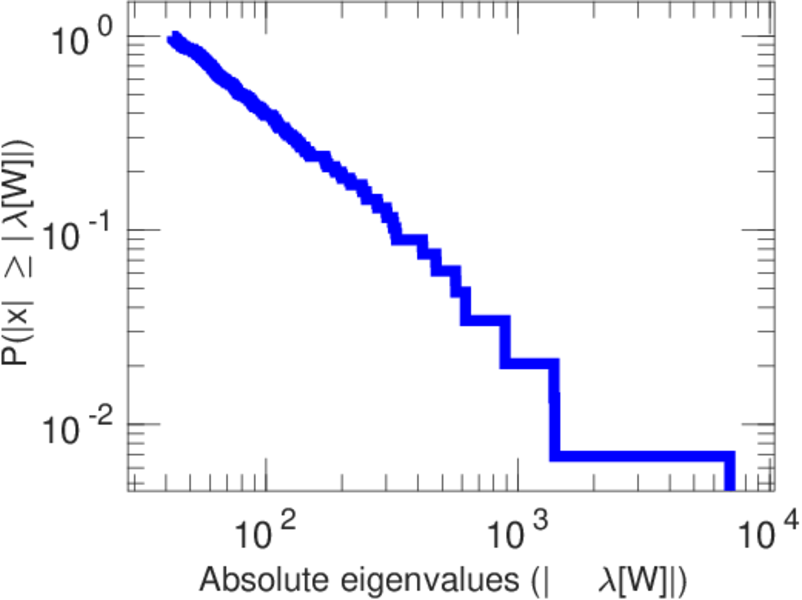
| Spectral norm | α = | 351.669
|
| Algebraic connectivity | a = | 0.035 605 6
|
| Spectral separation | |λ1[A] / λ2[A]| = | 1.580 43
|
| Controllability | C = | 5,812
|
| Relative controllability | Cr = | 0.837 947
|
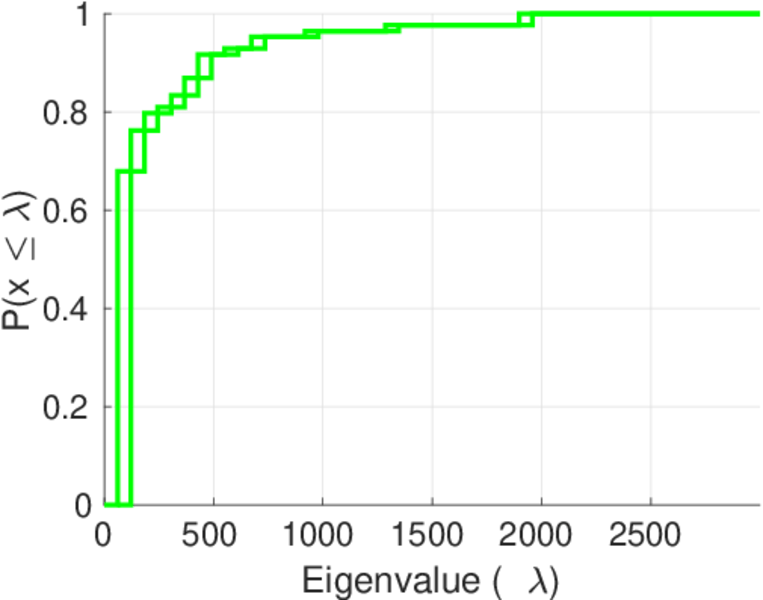
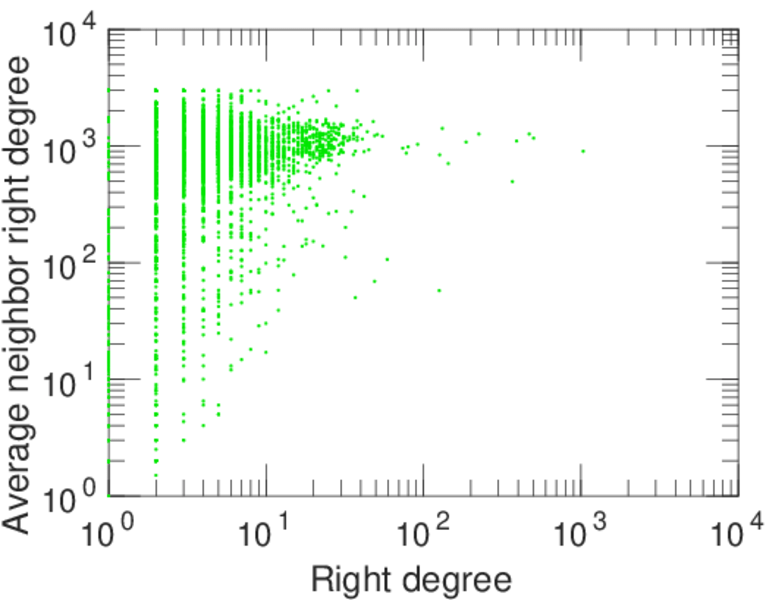
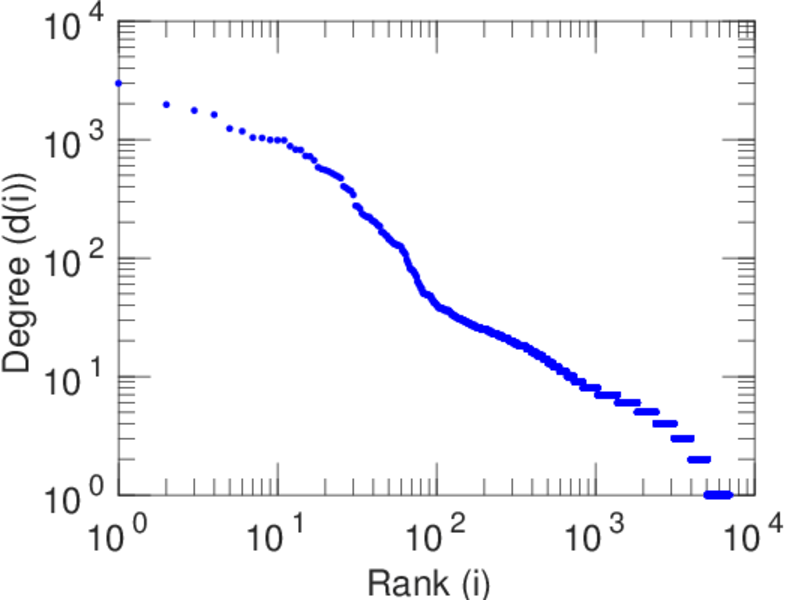
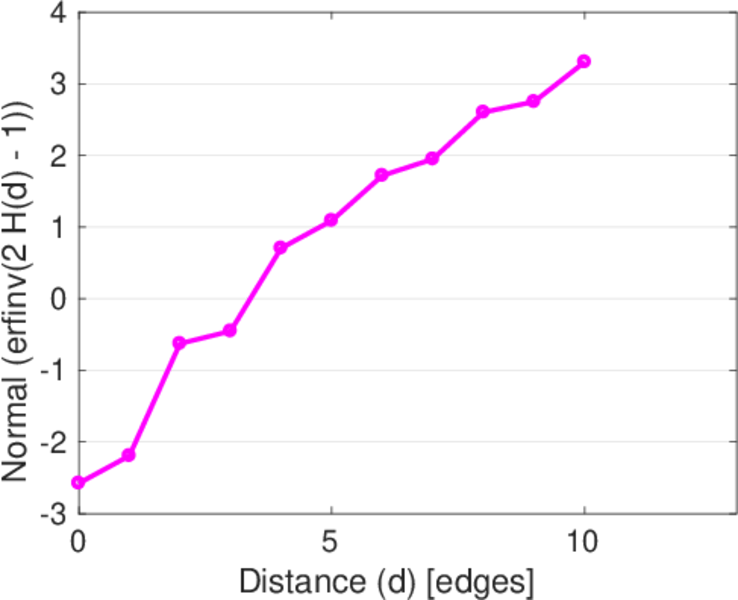
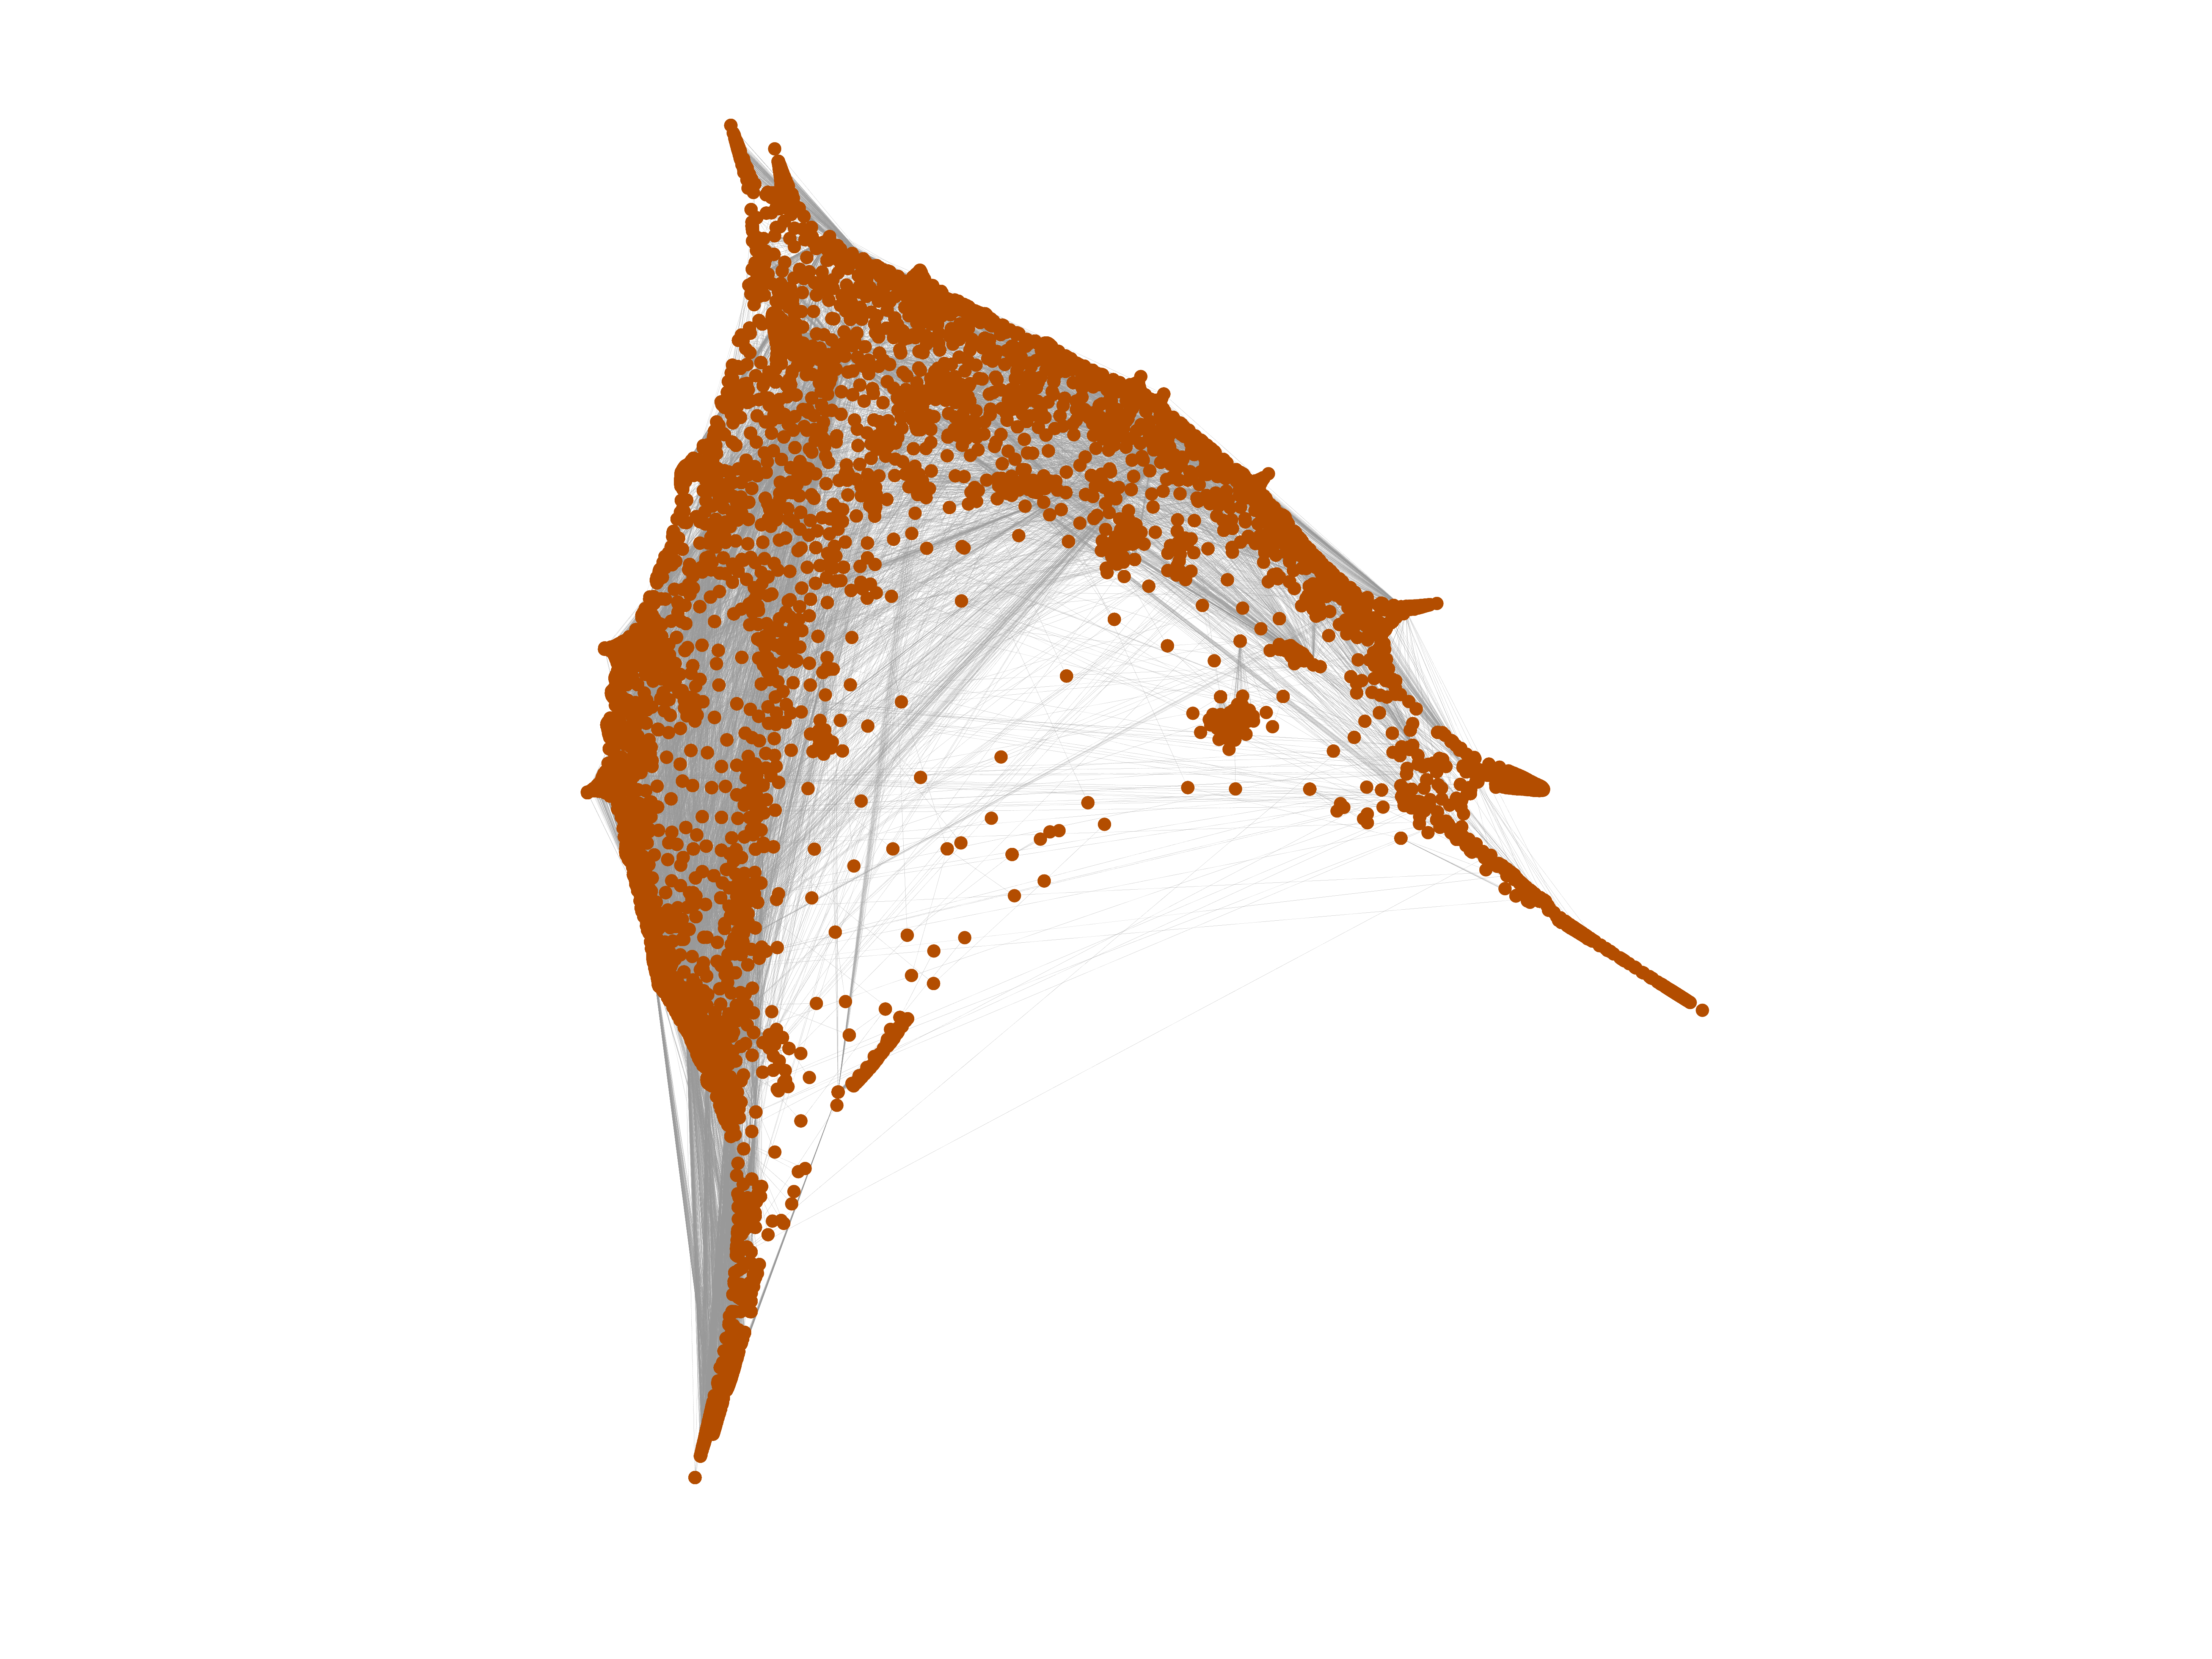
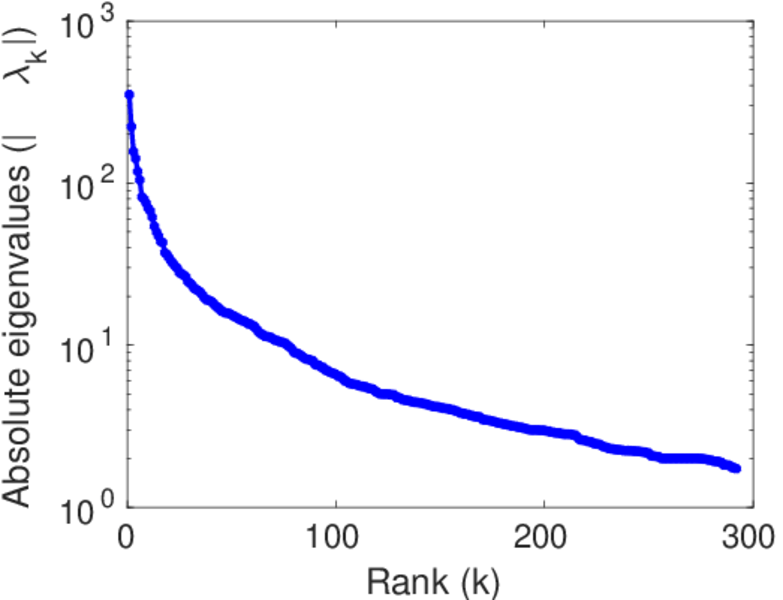
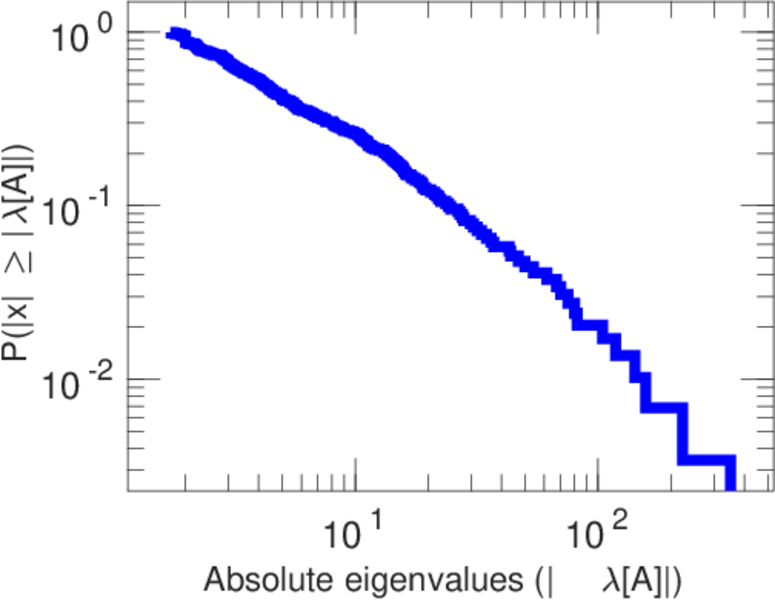
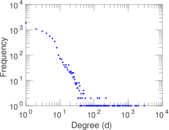
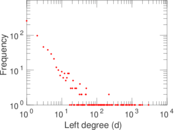
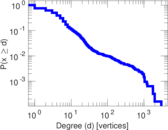
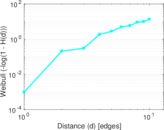
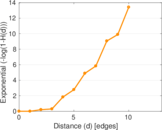
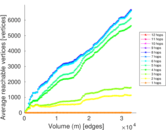
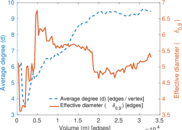
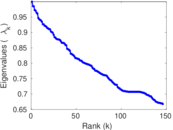
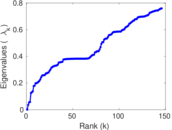
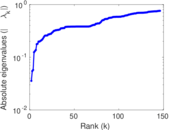
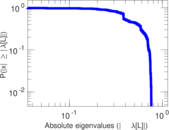
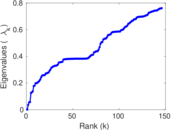
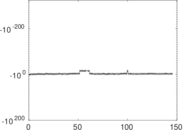
Plots


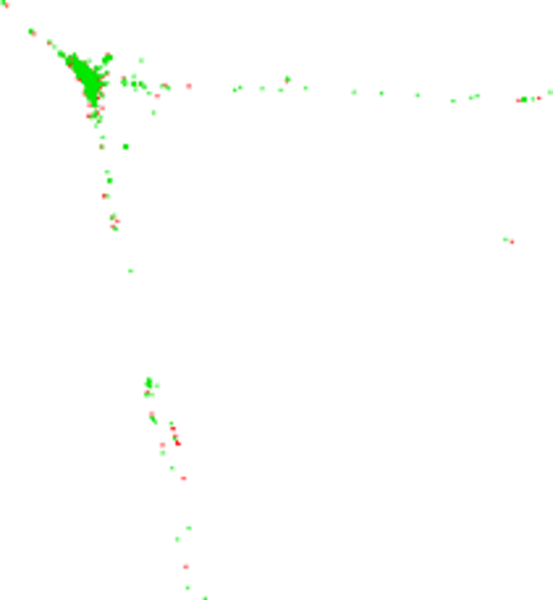
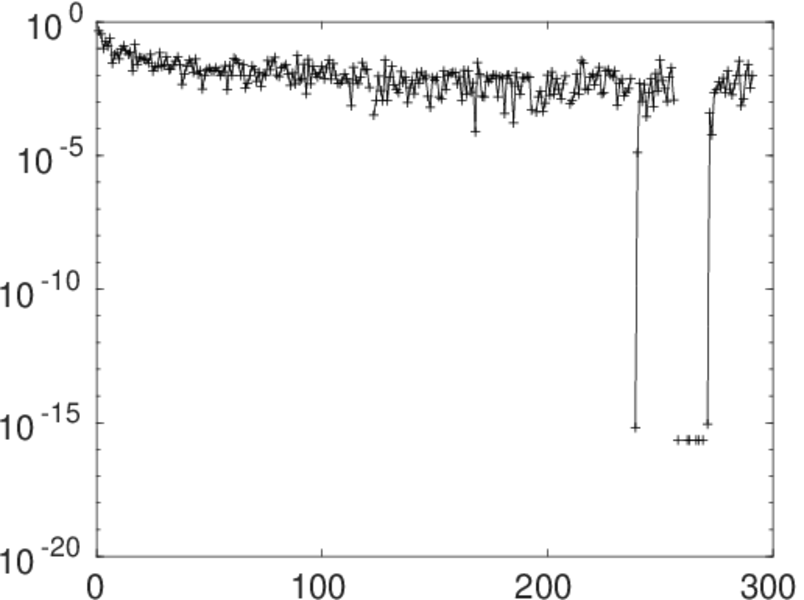
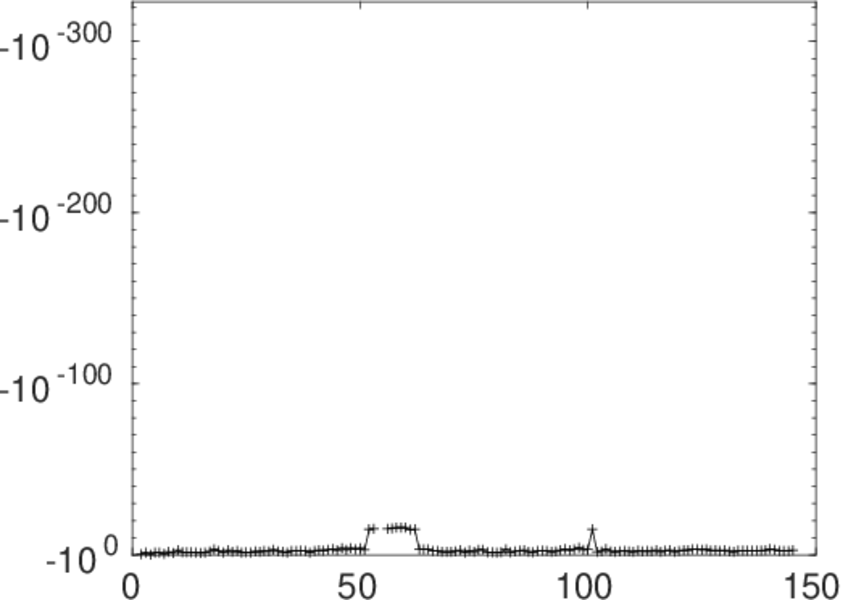
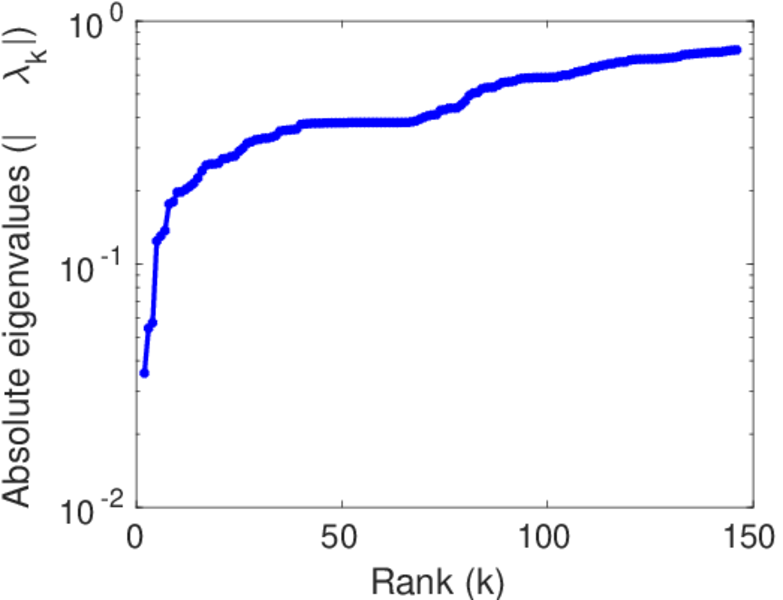
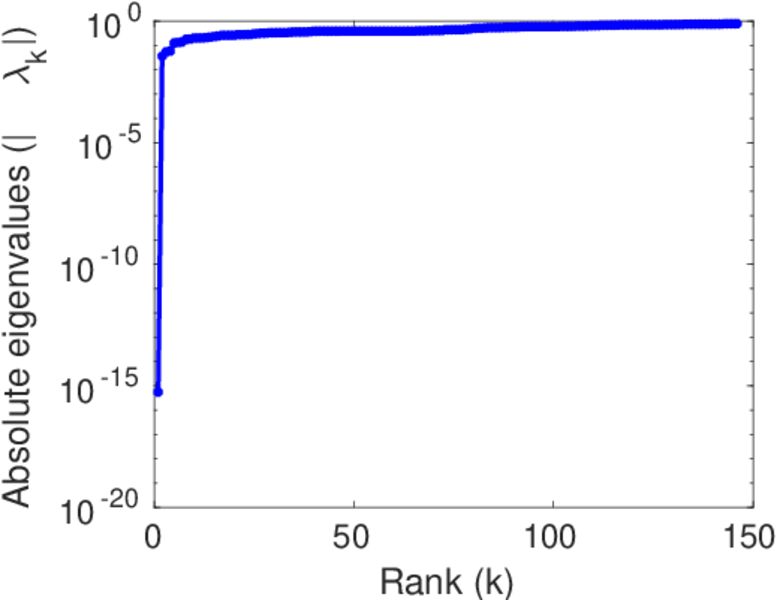
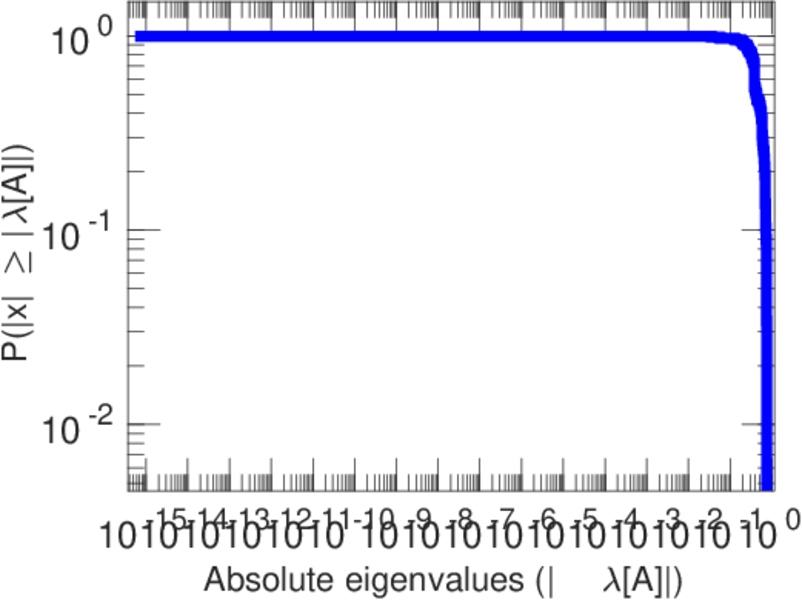
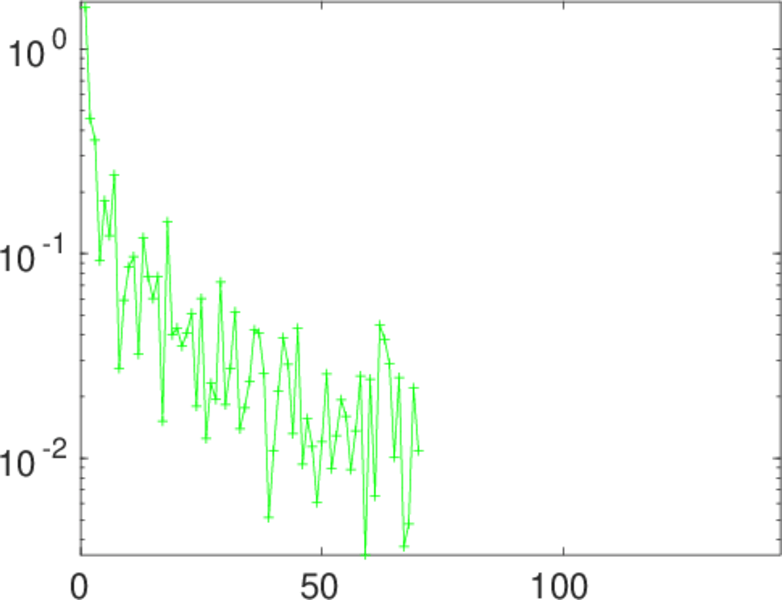
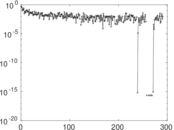
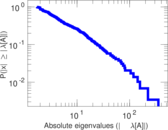
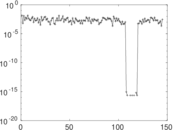
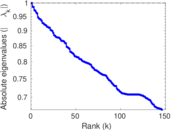
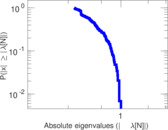
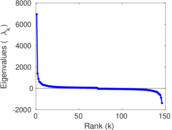
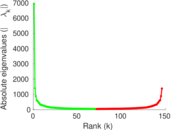
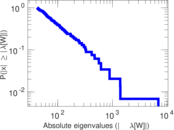
Matrix decompositions plots


Downloads
References
|
[1]
|
Jérôme Kunegis.
KONECT – The Koblenz Network Collection.
In Proc. Int. Conf. on World Wide Web Companion, pages
1343–1350, 2013.
[ http ]
|
|
[2]
|
Wikimedia Foundation.
Wikimedia downloads.
http://dumps.wikimedia.org/, January 2010.
|
 KONECT ‣ Networks ‣
Buy Me a Coffee
KONECT ‣ Networks ‣
Buy Me a Coffee