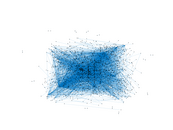
Wikivoyage edits (uk)
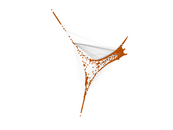
This is the bipartite edit network of the Ukrainian Wikivoyage. It contains
users and pages from the Ukrainian Wikivoyage, connected by edit events. Each
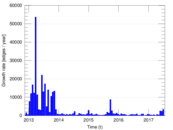
edge represents an edit. The dataset includes the timestamp of each edit.
Metadata
Statistics
| Size | n = | 2,003
|
| Left size | n1 = | 354
|
| Right size | n2 = | 1,649
|
| Volume | m = | 15,715
|
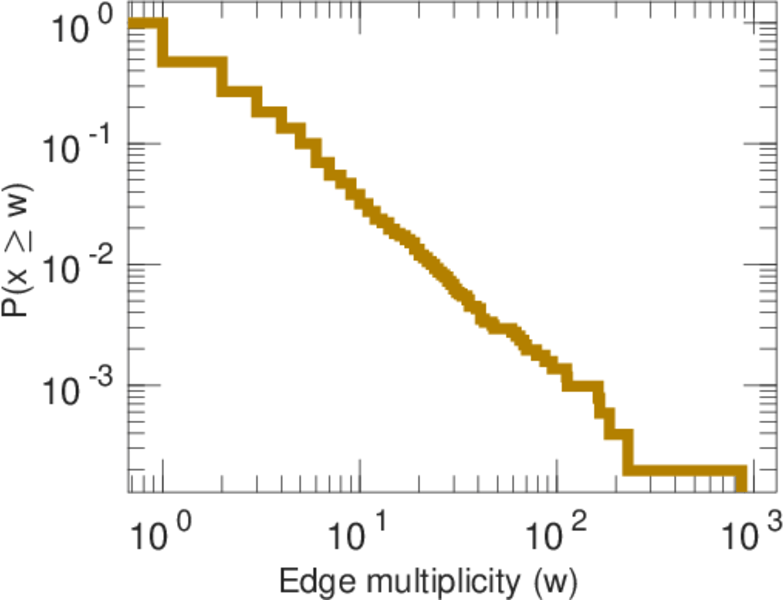
| Unique edge count | m̿ = | 5,101
|
| Wedge count | s = | 1,026,909
|
| Claw count | z = | 224,227,482
|
| Cross count | x = | 43,732,870,159
|
| Square count | q = | 778,190
|
| 4-Tour count | T4 = | 10,358,490
|
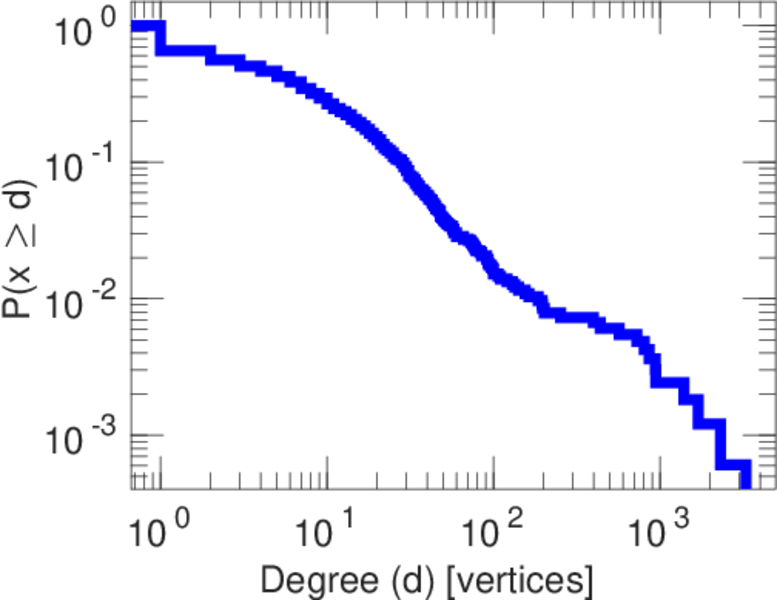
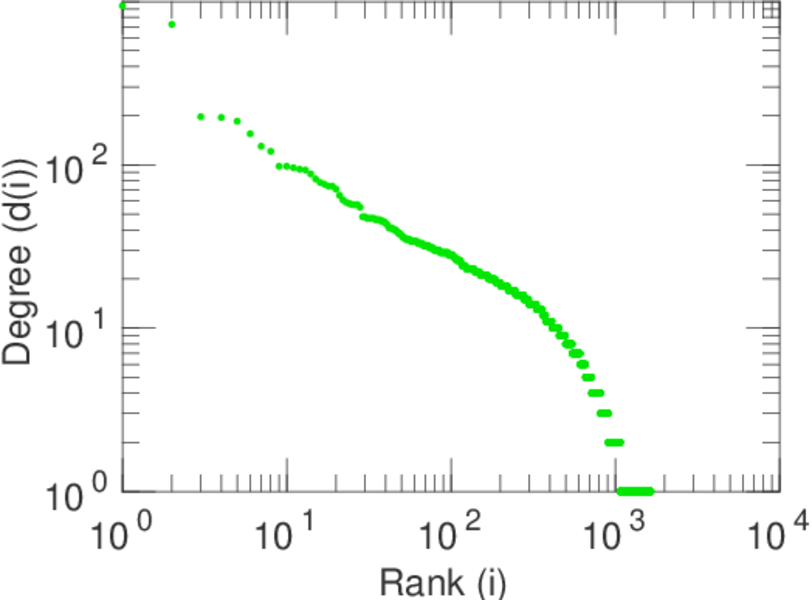
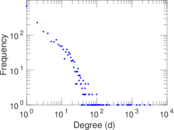
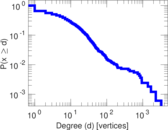
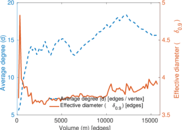
| Maximum degree | dmax = | 3,268
|
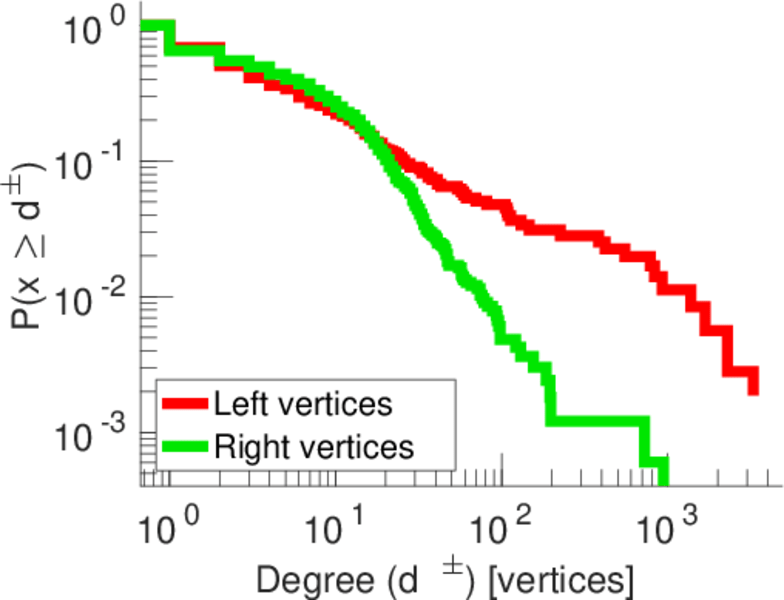
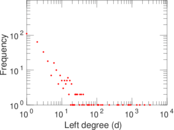
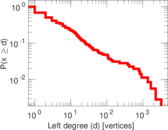
| Maximum left degree | d1max = | 3,268
|
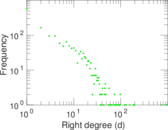
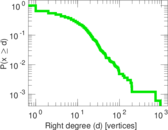
| Maximum right degree | d2max = | 941
|
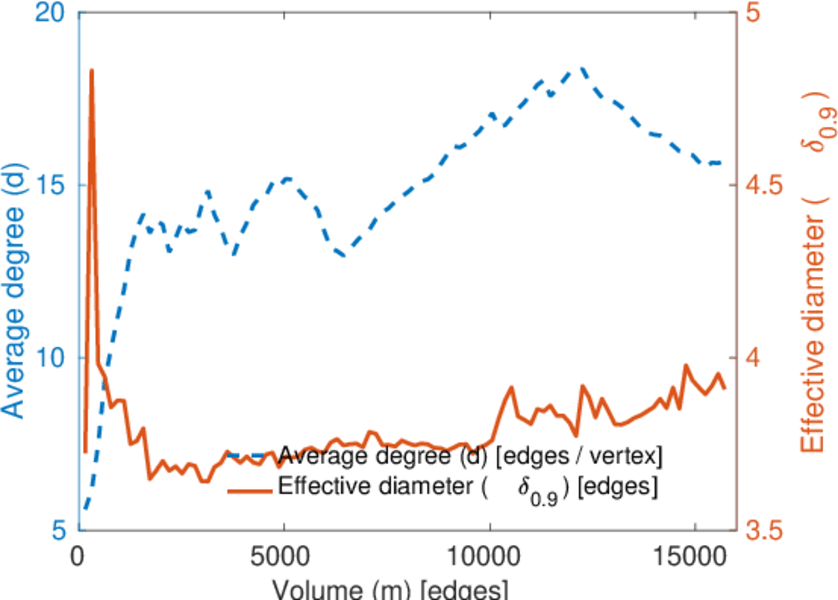
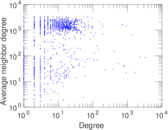
| Average degree | d = | 15.691 5
|
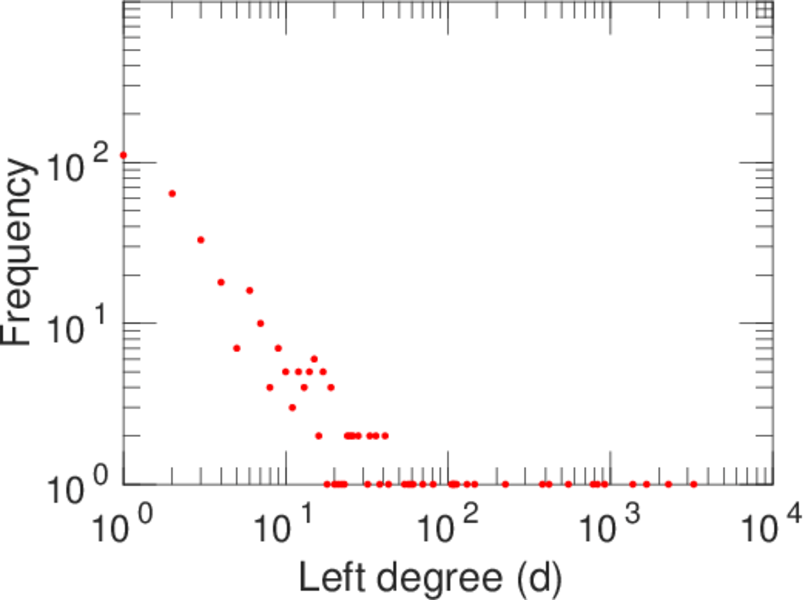
| Average left degree | d1 = | 44.392 7
|
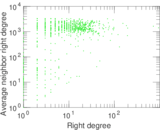
| Average right degree | d2 = | 9.530 02
|
| Fill | p = | 0.008 738 39
|
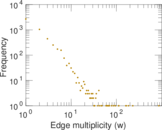
| Average edge multiplicity | m̃ = | 3.080 77
|
| Size of LCC | N = | 1,862
|
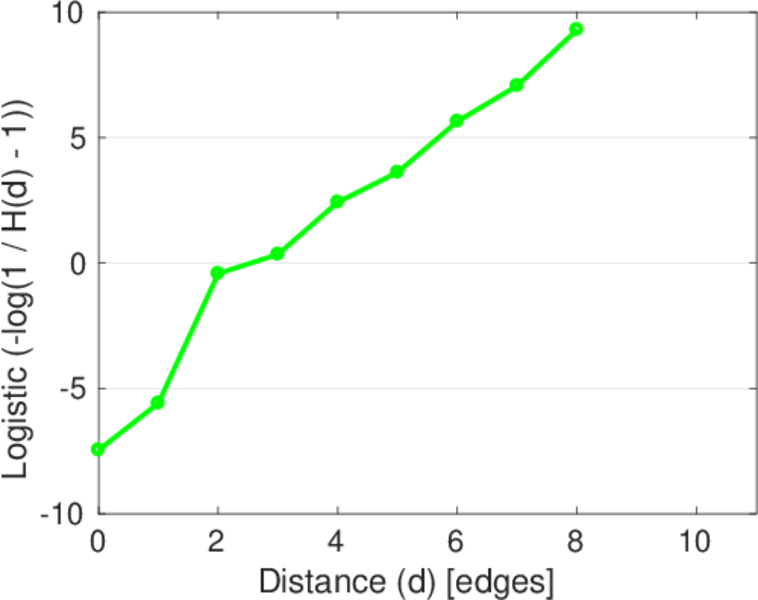
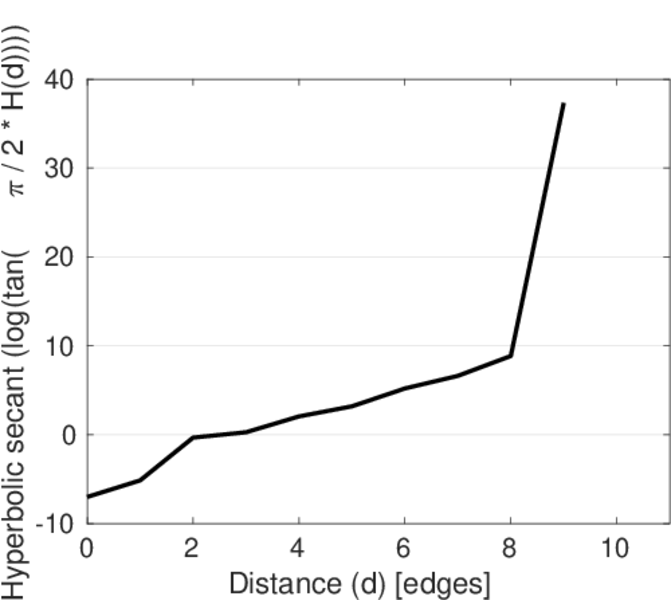
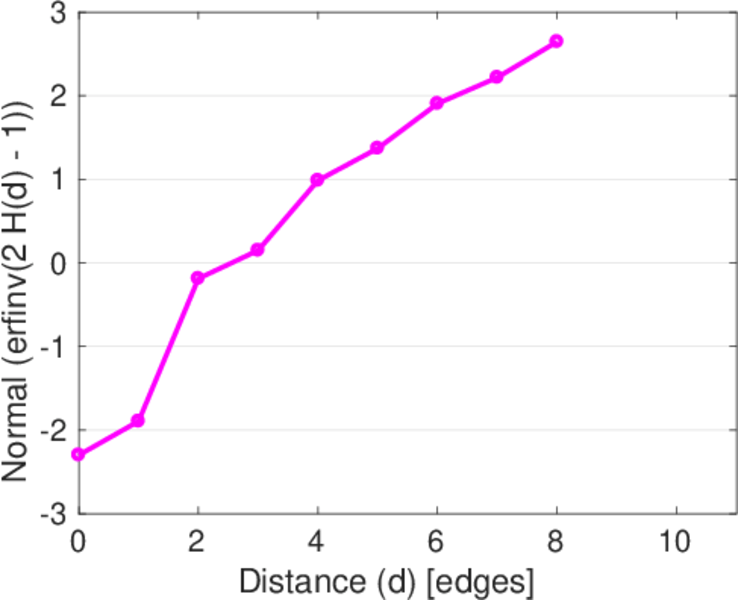
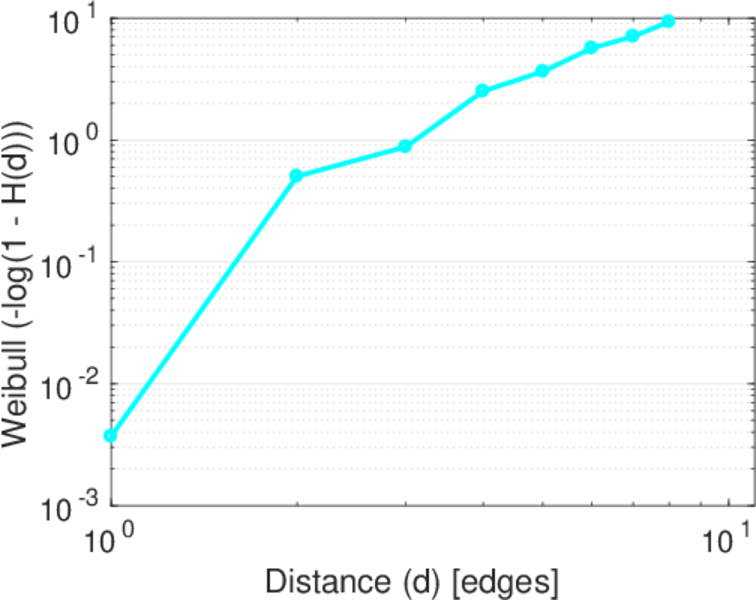
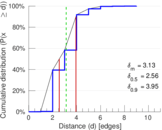
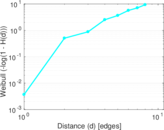
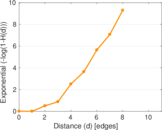
| Diameter | δ = | 10
|
| 50-Percentile effective diameter | δ0.5 = | 2.556 39
|
| 90-Percentile effective diameter | δ0.9 = | 3.945 26
|
| Median distance | δM = | 3
|
| Mean distance | δm = | 3.129 55
|
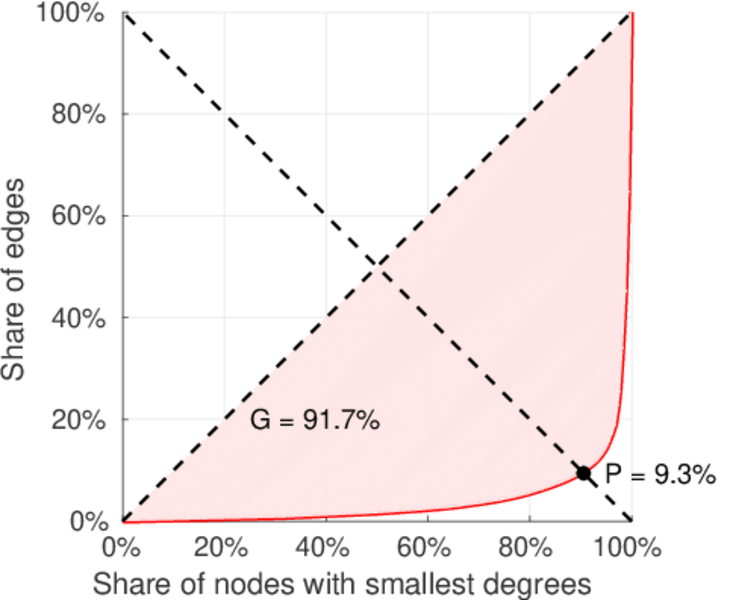
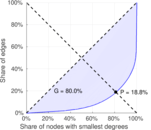
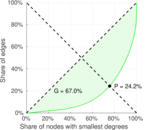
| Gini coefficient | G = | 0.813 039
|
| Balanced inequality ratio | P = | 0.176 169
|
| Left balanced inequality ratio | P1 = | 0.092 650 3
|
| Right balanced inequality ratio | P2 = | 0.242 189
|
| Relative edge distribution entropy | Her = | 0.777 050
|
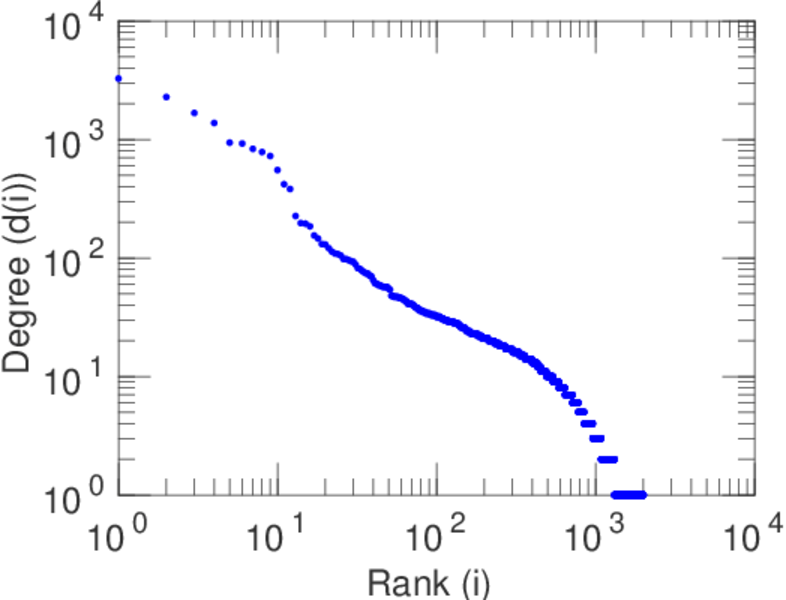
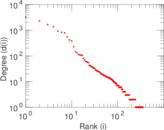
| Power law exponent | γ = | 2.306 74
|
| Tail power law exponent | γt = | 2.731 00
|
| Tail power law exponent with p | γ3 = | 2.731 00
|
| p-value | p = | 0.000 00
|
| Left tail power law exponent with p | γ3,1 = | 1.791 00
|
| Left p-value | p1 = | 0.260 000
|
| Right tail power law exponent with p | γ3,2 = | 4.371 00
|
| Right p-value | p2 = | 0.442 000
|
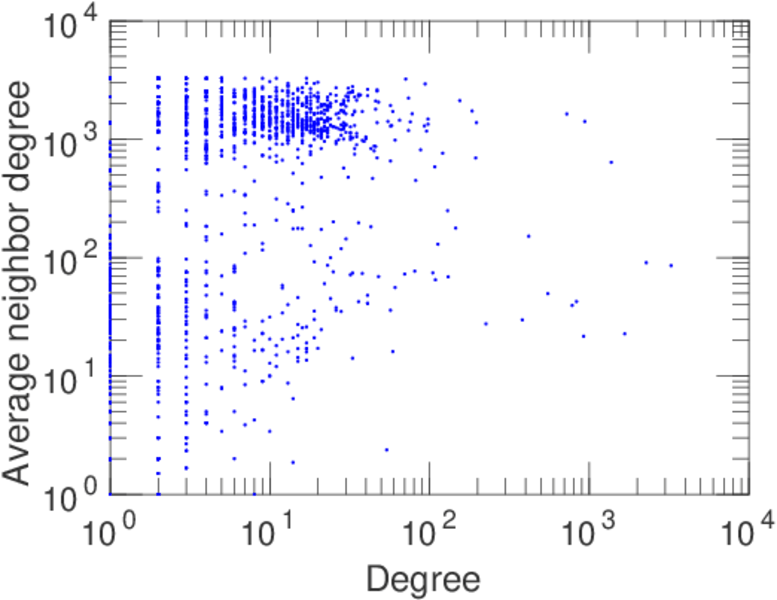
| Degree assortativity | ρ = | −0.232 633
|
| Degree assortativity p-value | pρ = | 1.192 12 × 10−63
|
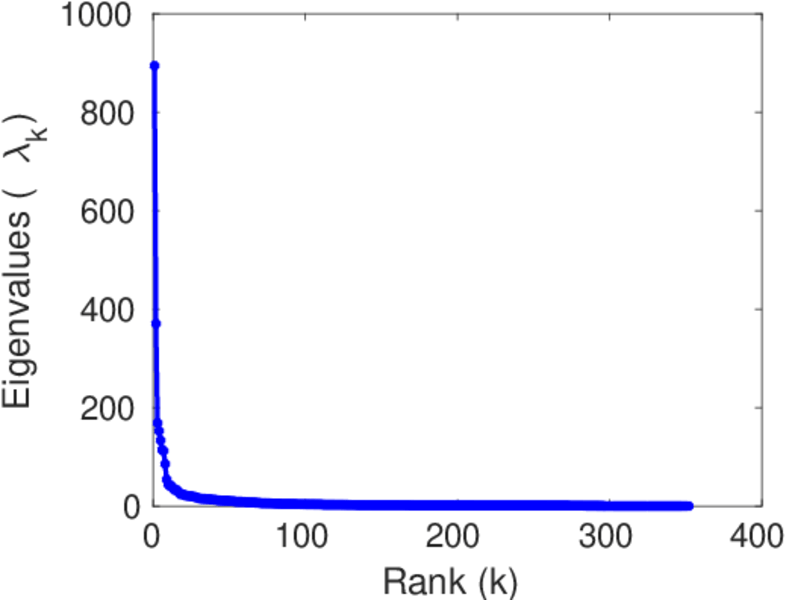
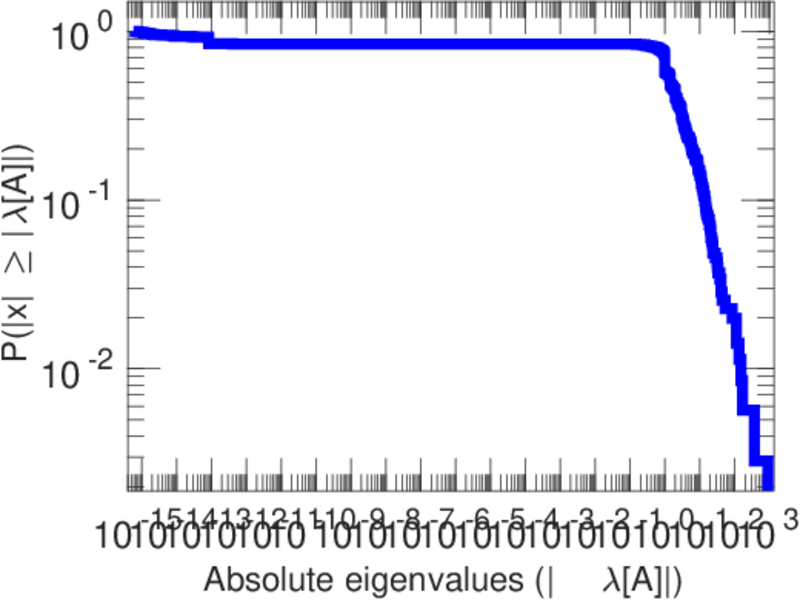
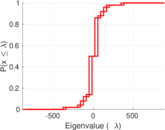
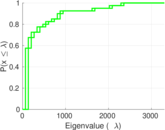
| Spectral norm | α = | 894.347
|
| Algebraic connectivity | a = | 0.073 012 0
|
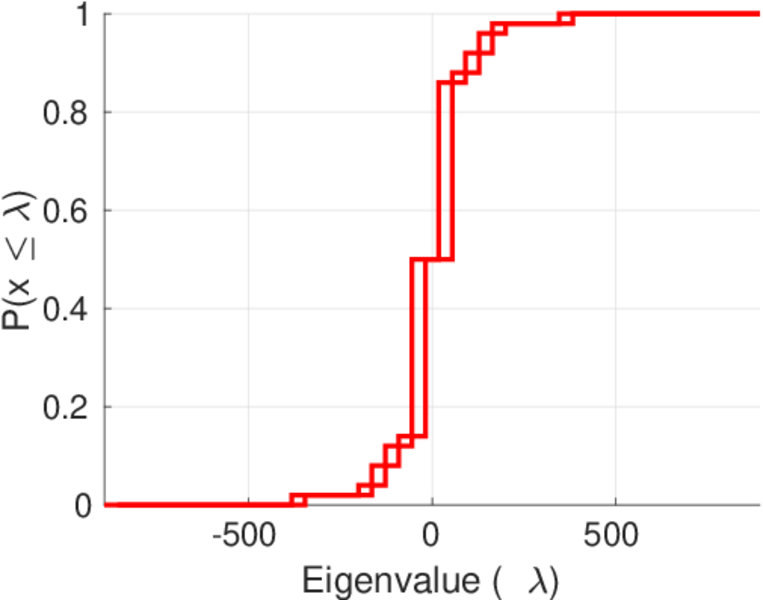
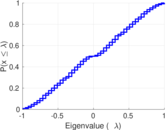
| Spectral separation | |λ1[A] / λ2[A]| = | 2.415 54
|
| Controllability | C = | 1,409
|
| Relative controllability | Cr = | 0.704 148
|
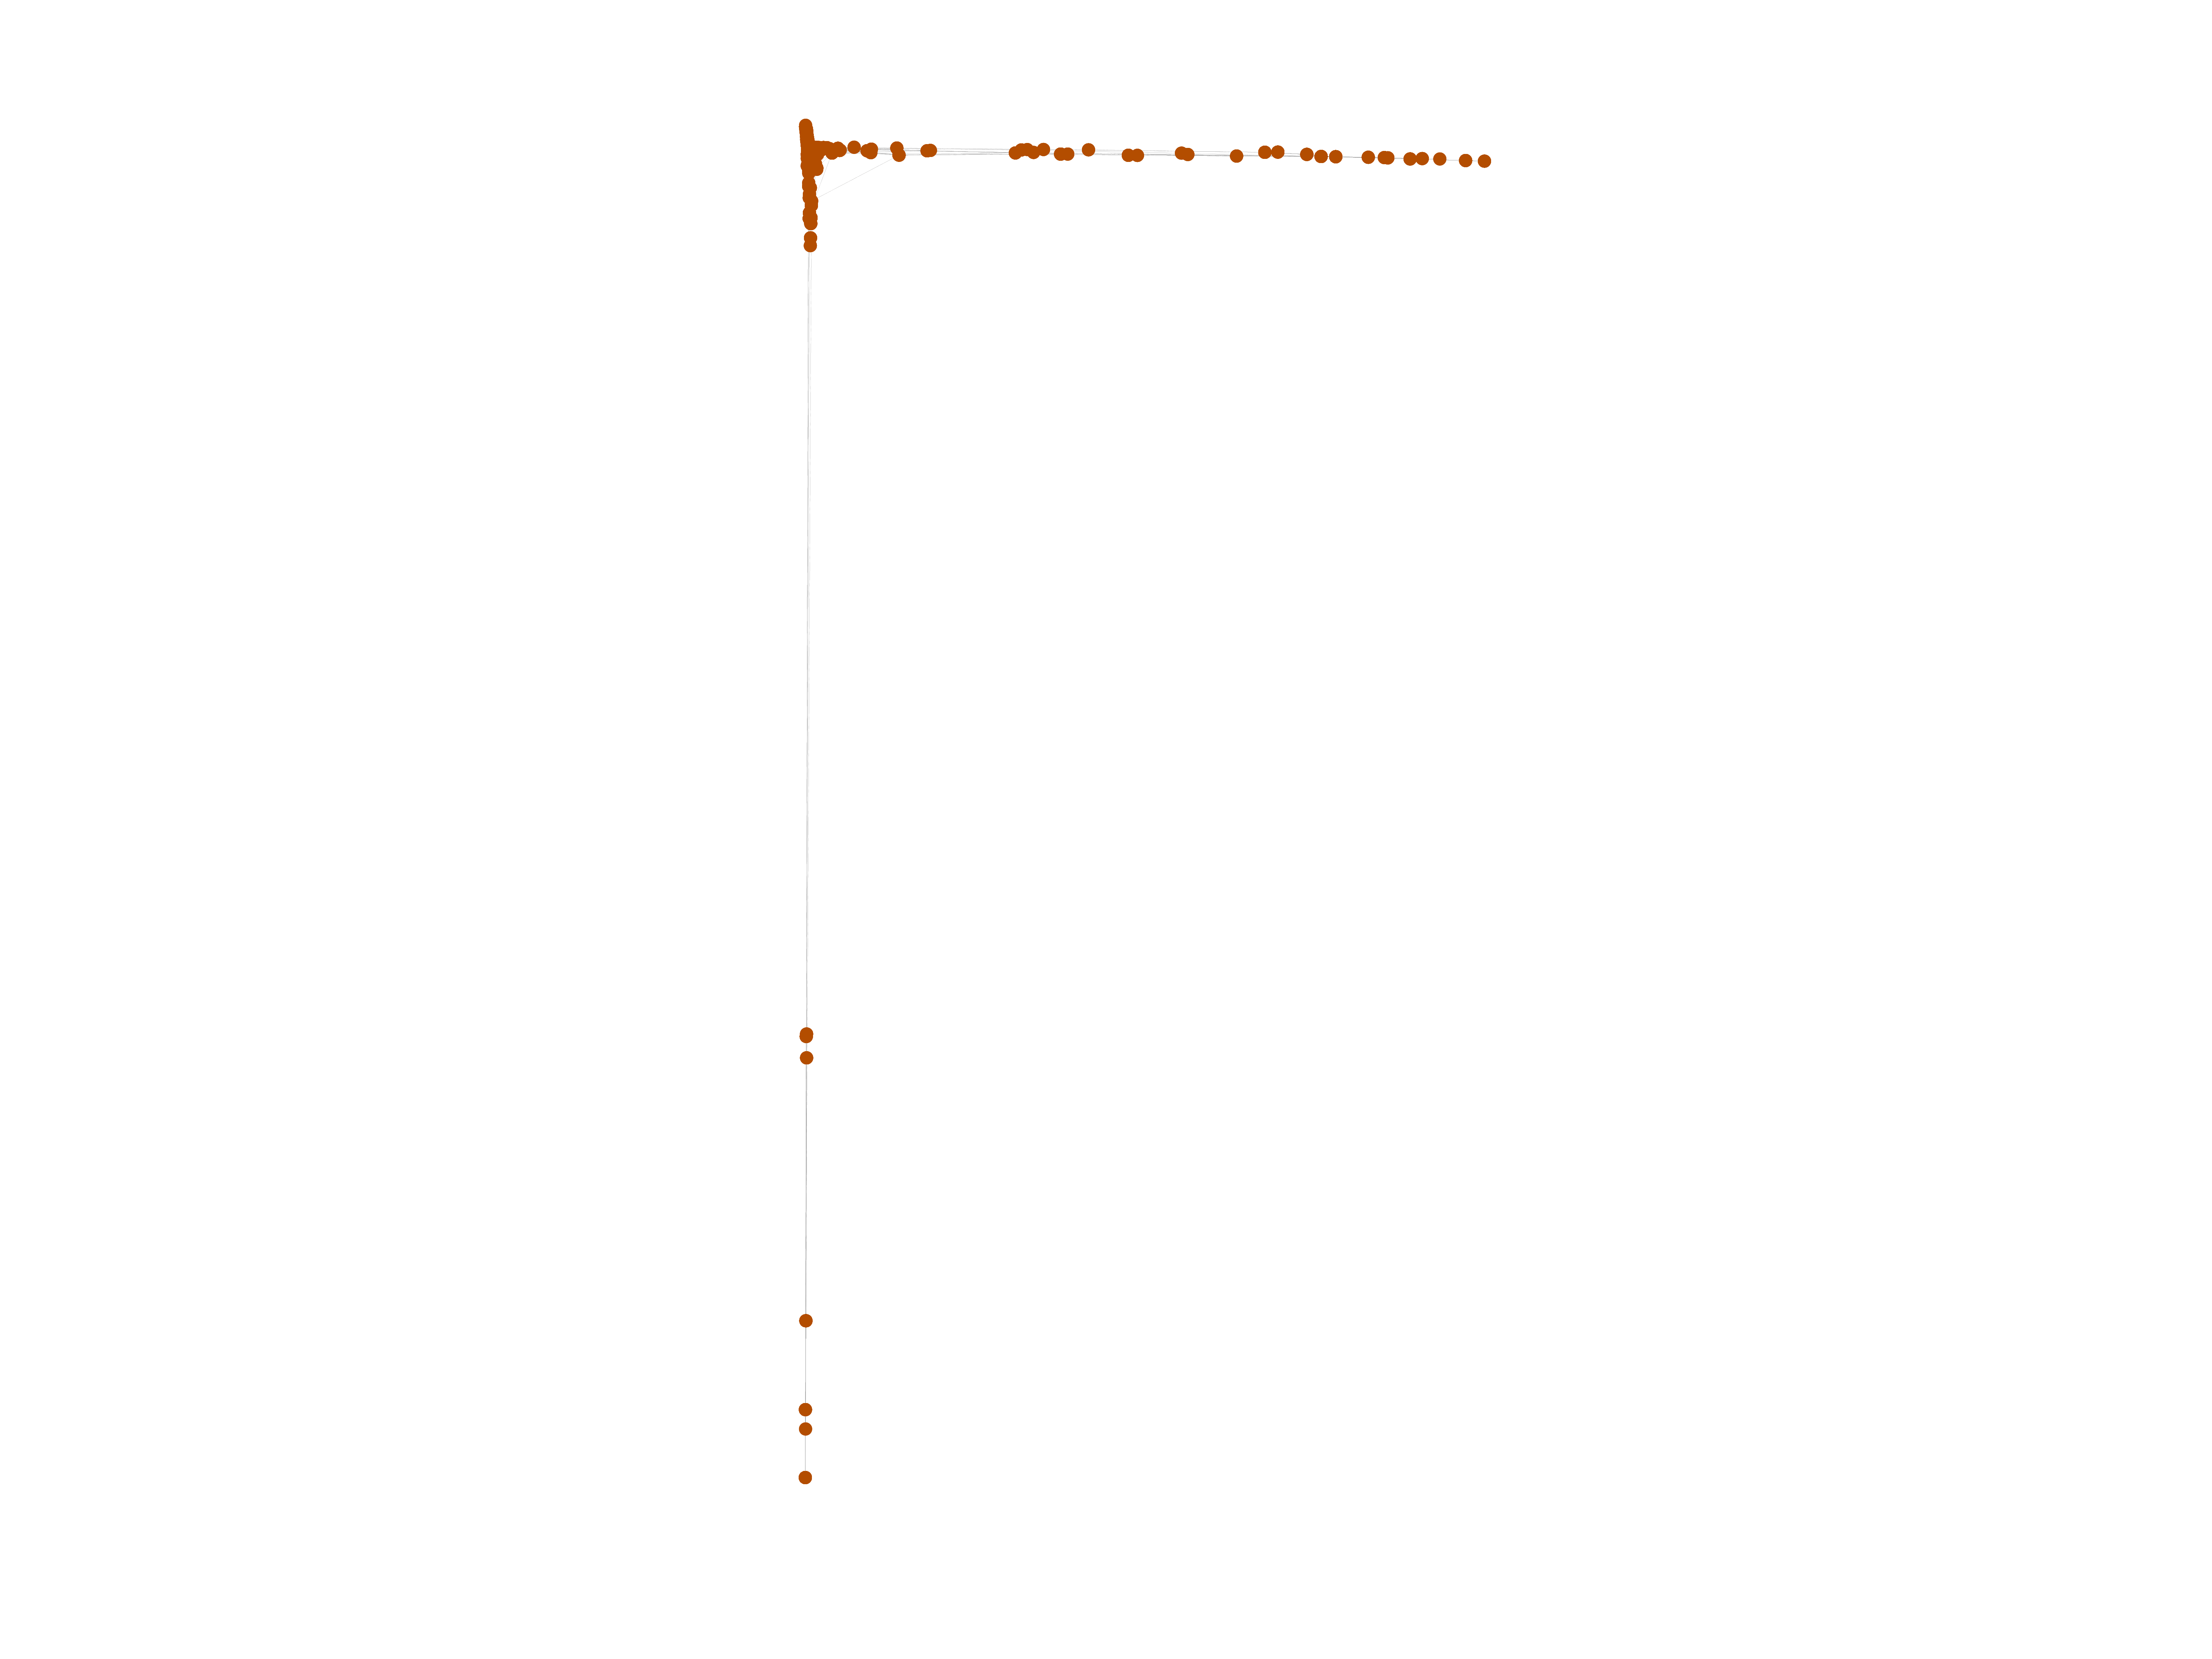
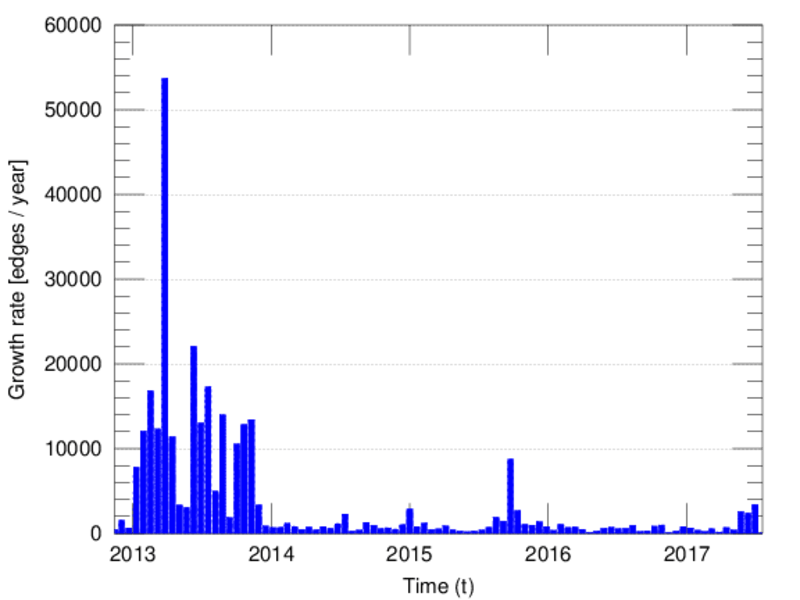
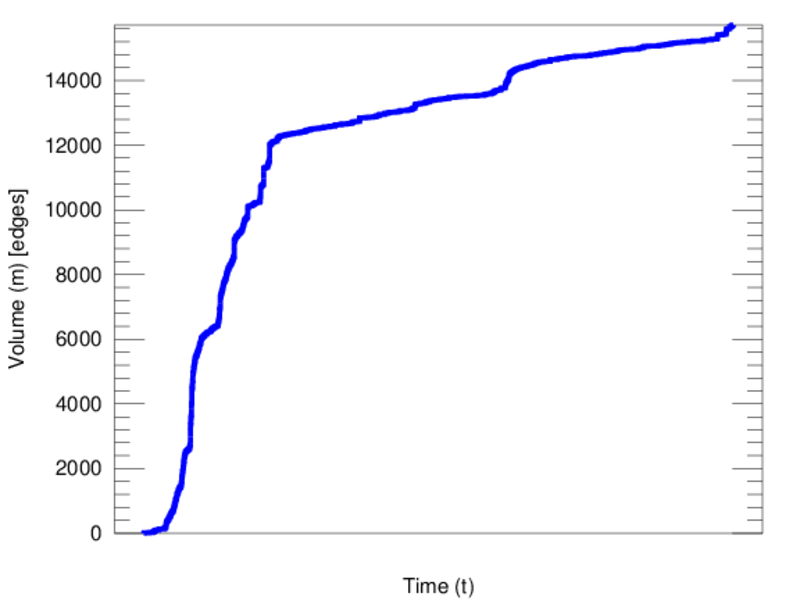
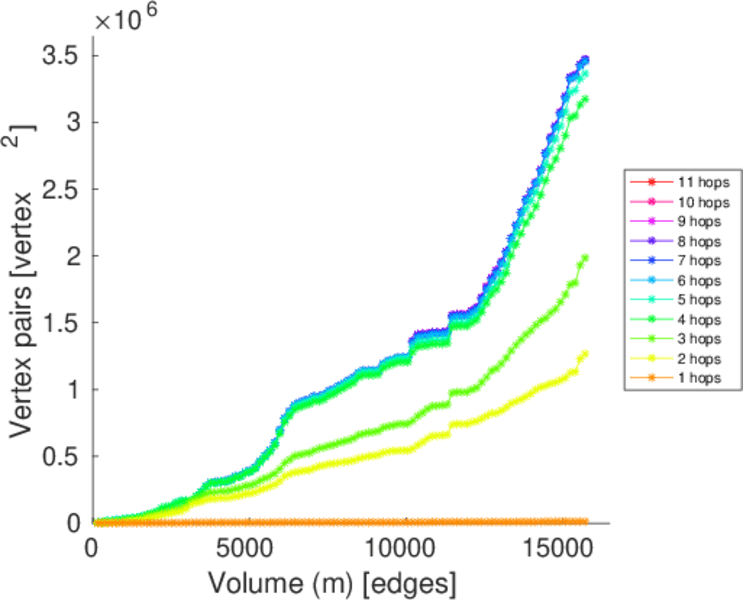
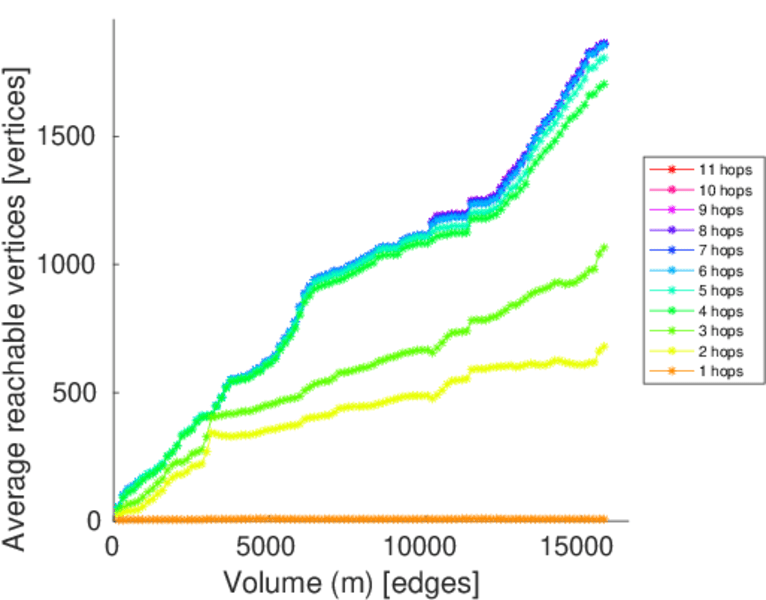
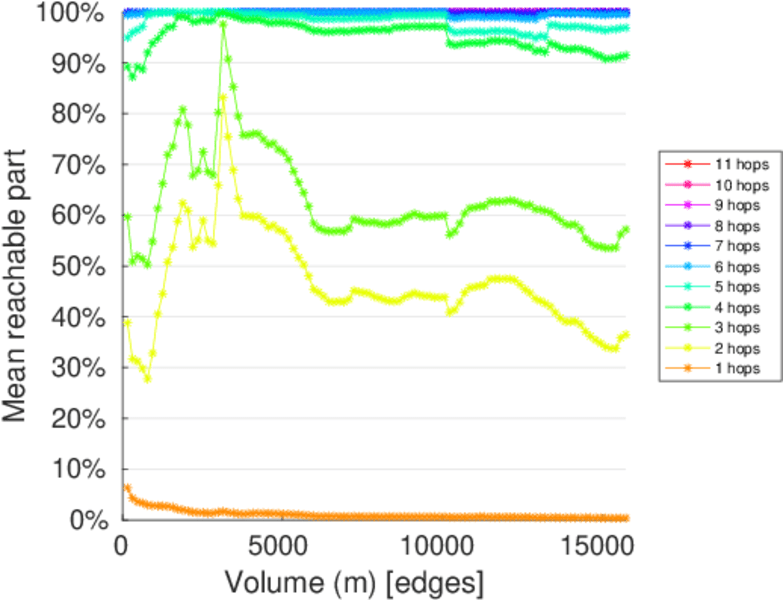
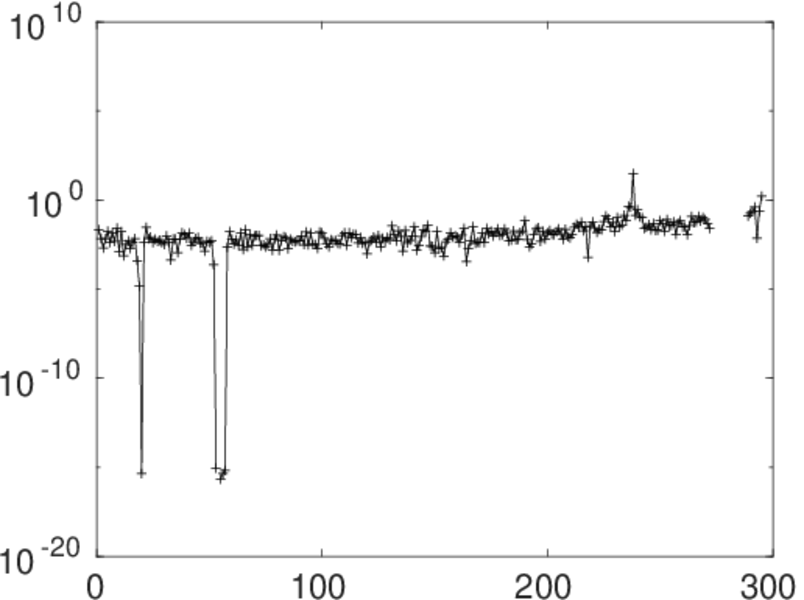
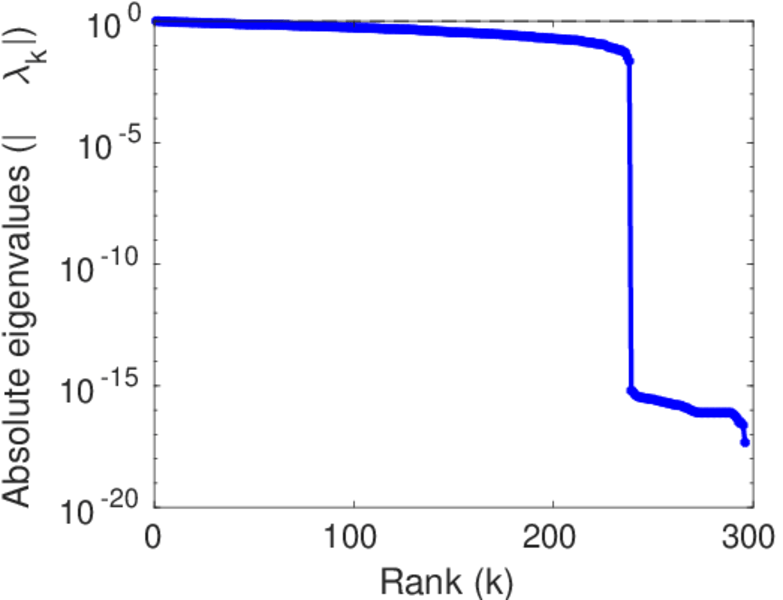
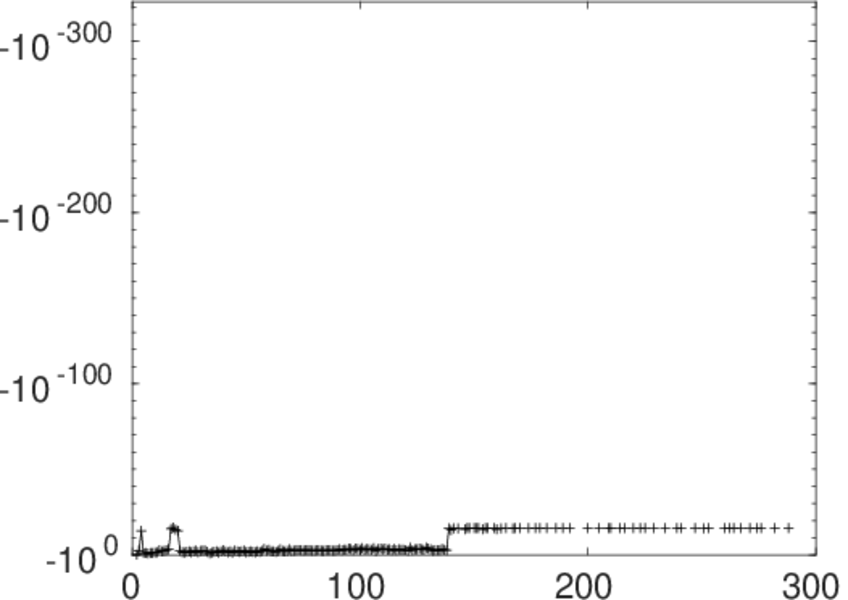
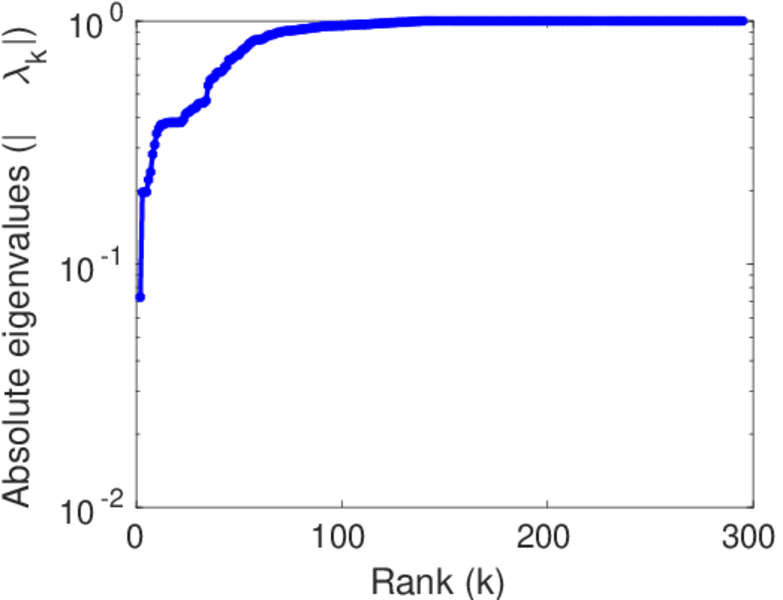
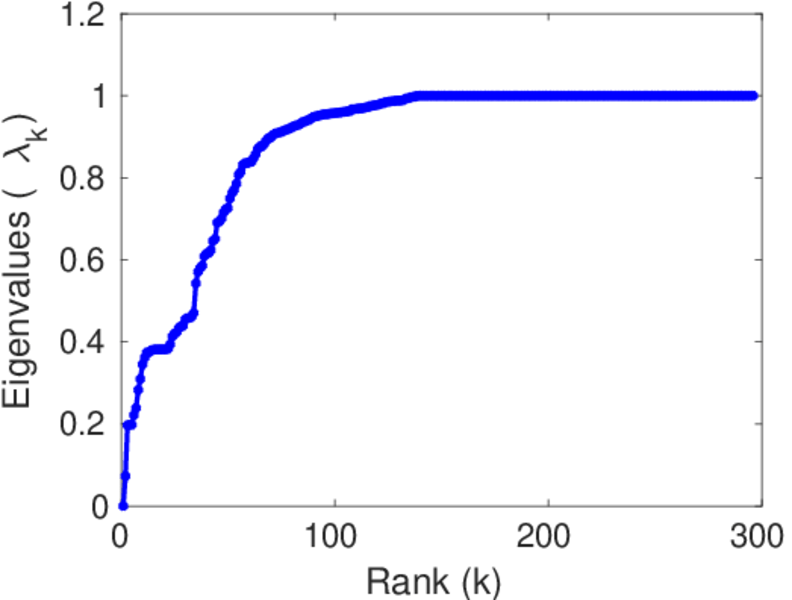
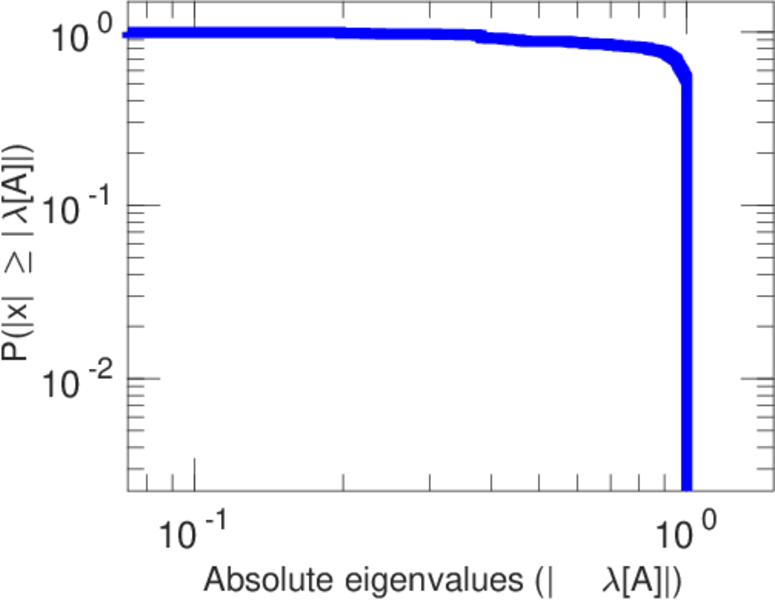
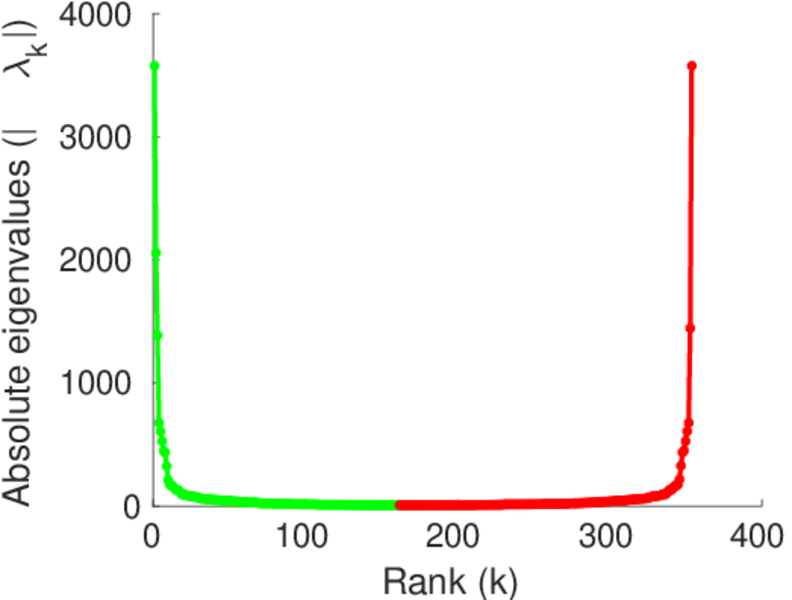
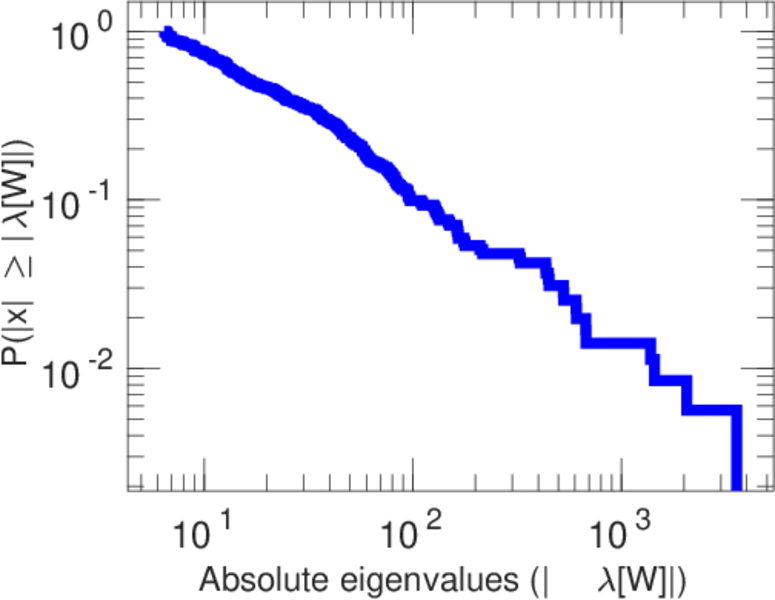
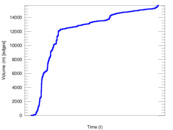
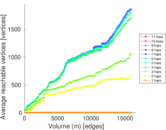
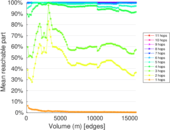
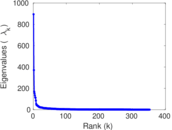
Plots


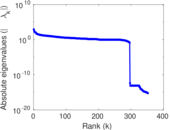
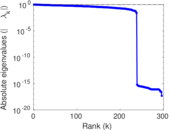
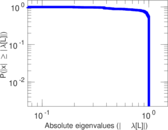
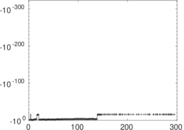
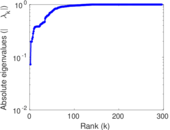
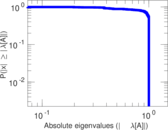
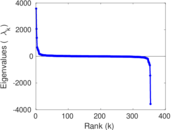
Matrix decompositions plots


Downloads
References
|
[1]
|
Jérôme Kunegis.
KONECT – The Koblenz Network Collection.
In Proc. Int. Conf. on World Wide Web Companion, pages
1343–1350, 2013.
[ http ]
|
|
[2]
|
Wikimedia Foundation.
Wikimedia downloads.
http://dumps.wikimedia.org/, January 2010.
|
 KONECT ‣ Networks ‣
Buy Me a Coffee
KONECT ‣ Networks ‣
Buy Me a Coffee