Wiktionary edits (uk)
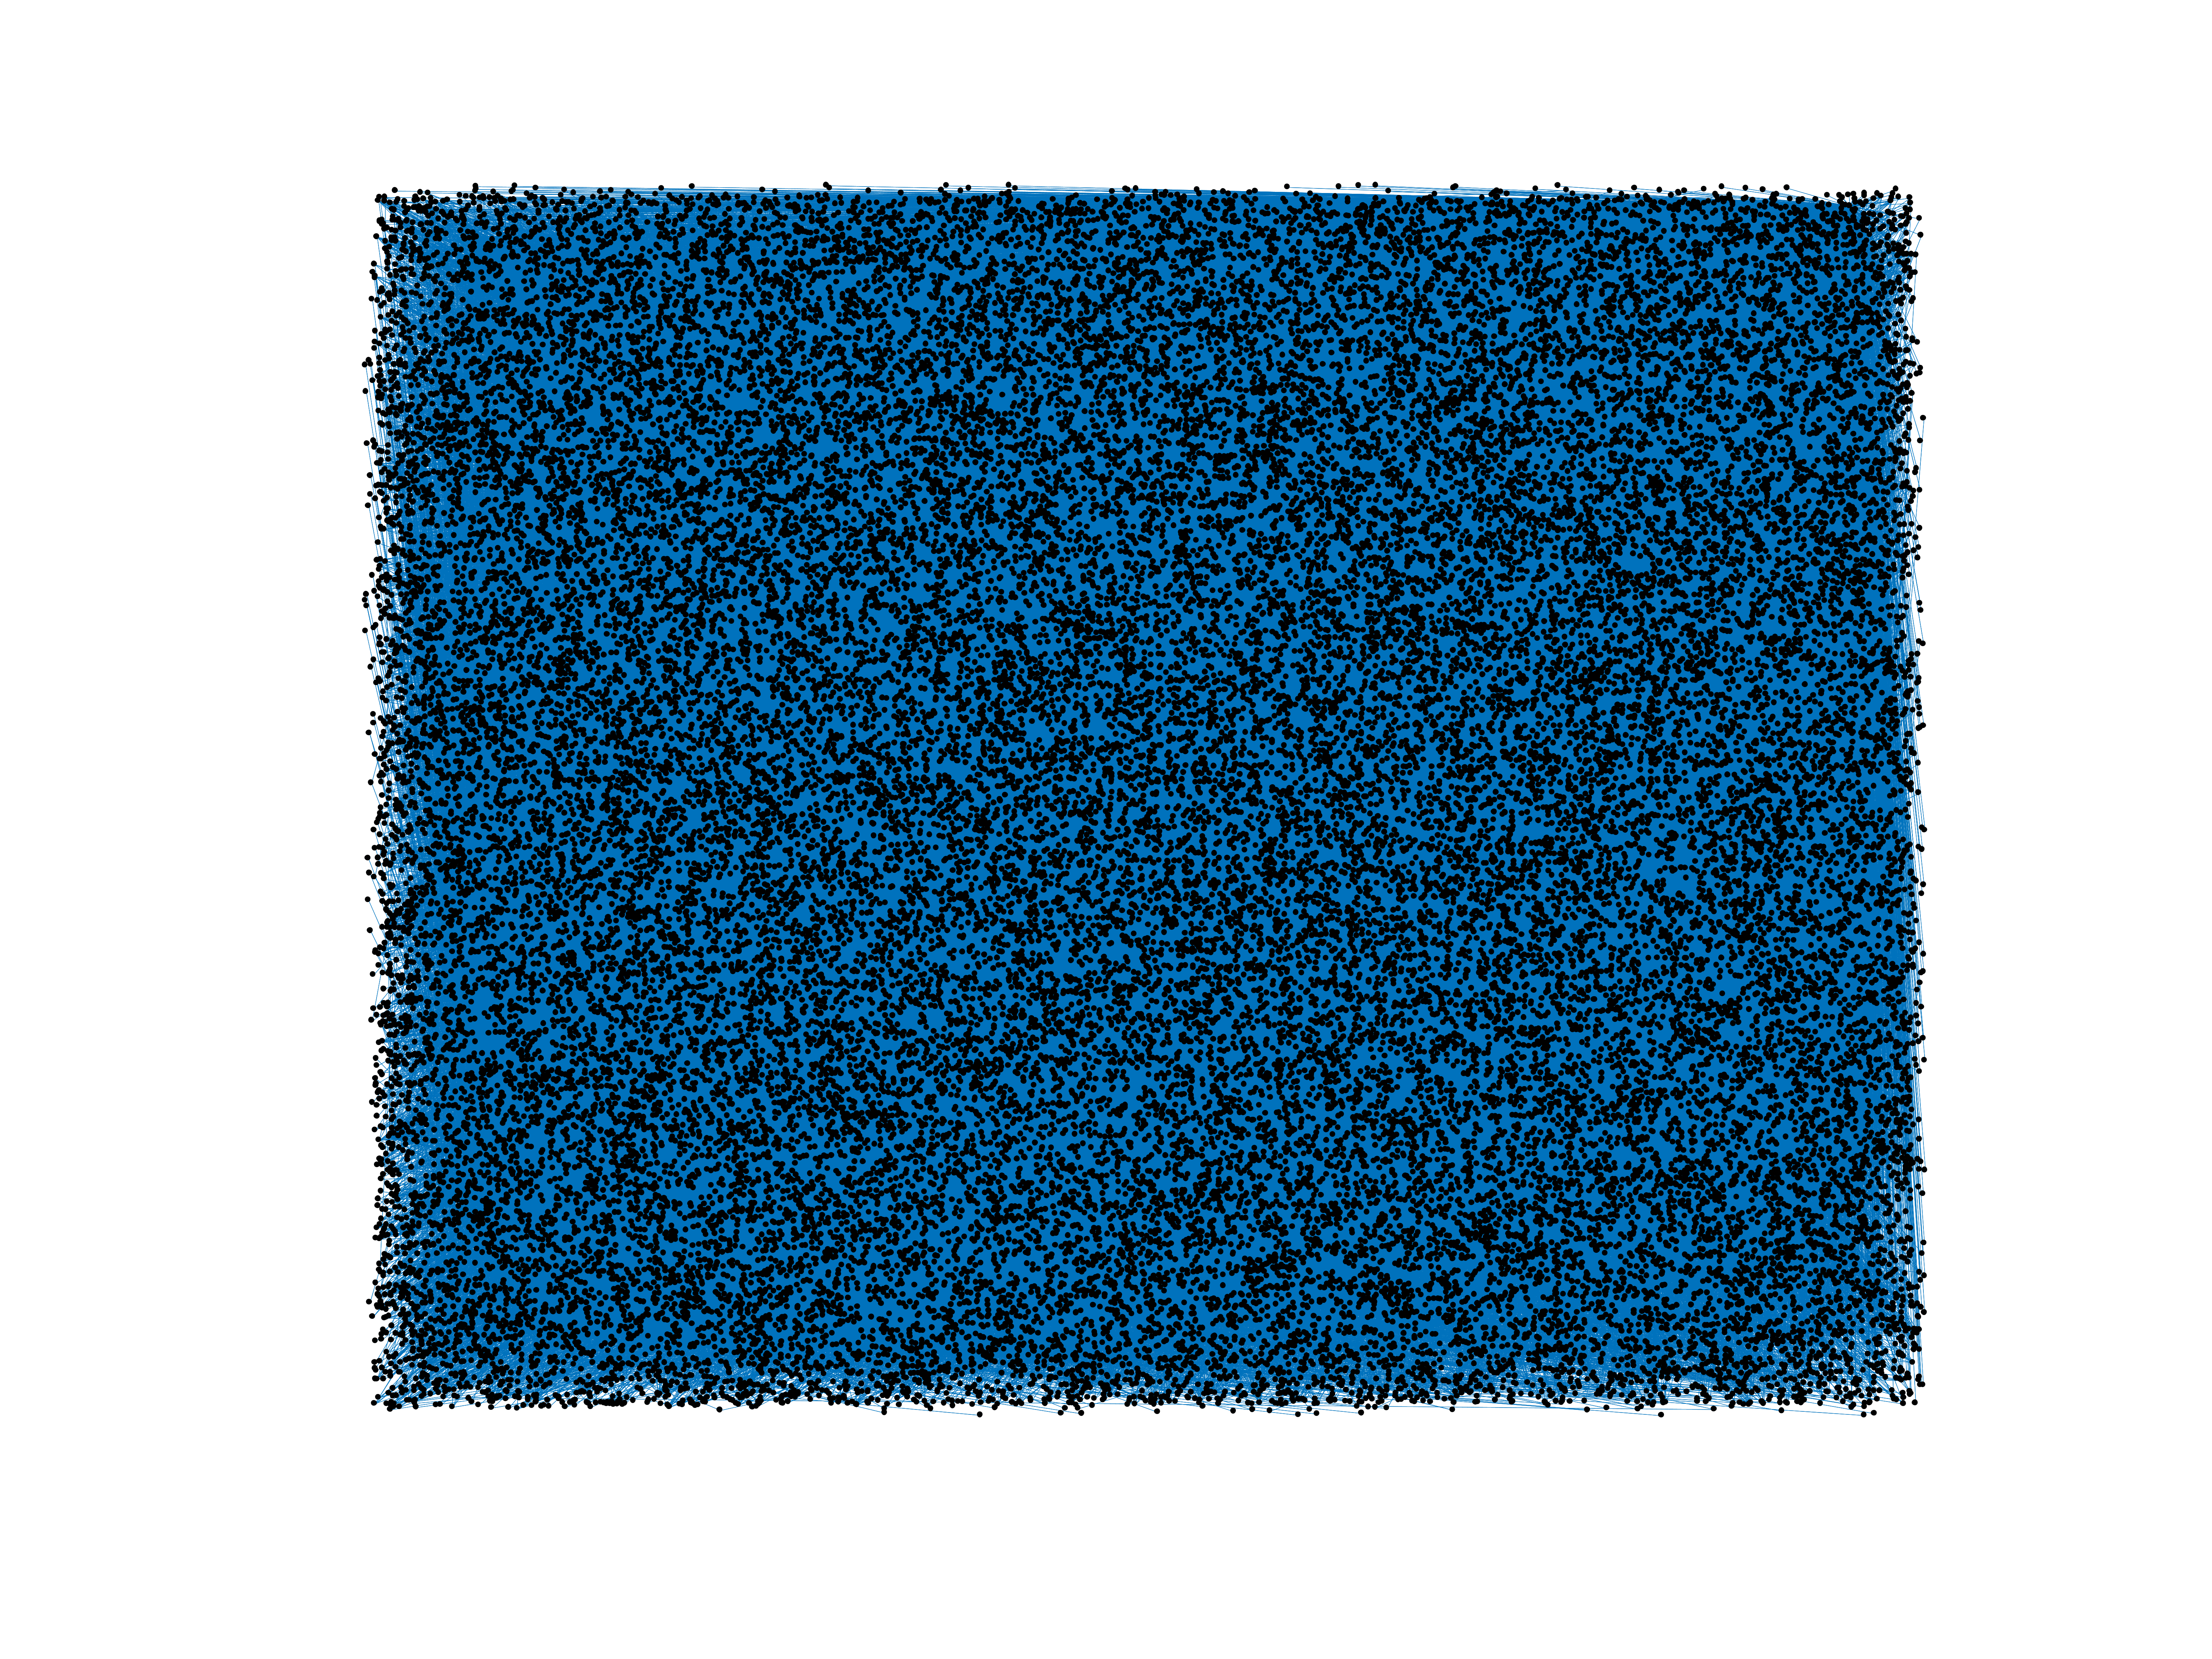
This is the bipartite edit network of the Ukrainian Wiktionary. It contains
users and pages from the Ukrainian Wiktionary, connected by edit events. Each
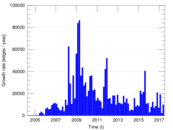
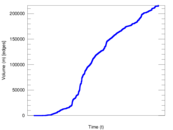
edge represents an edit. The dataset includes the timestamp of each edit.
Metadata
Statistics
| Size | n = | 45,588
|
| Left size | n1 = | 907
|
| Right size | n2 = | 44,681
|
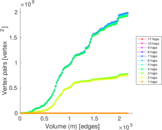
| Volume | m = | 216,084
|
| Unique edge count | m̿ = | 122,074
|
| Wedge count | s = | 505,243,920
|
| Claw count | z = | 2,461,370,019,695
|
| Cross count | x = | 11,025,600,071,842,706
|
| Square count | q = | 226,429,815
|
| 4-Tour count | T4 = | 3,832,842,196
|
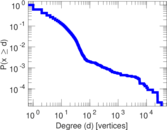
| Maximum degree | dmax = | 34,433
|
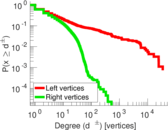
| Maximum left degree | d1max = | 34,433
|
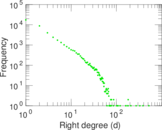
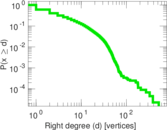
| Maximum right degree | d2max = | 522
|
| Average degree | d = | 9.479 86
|
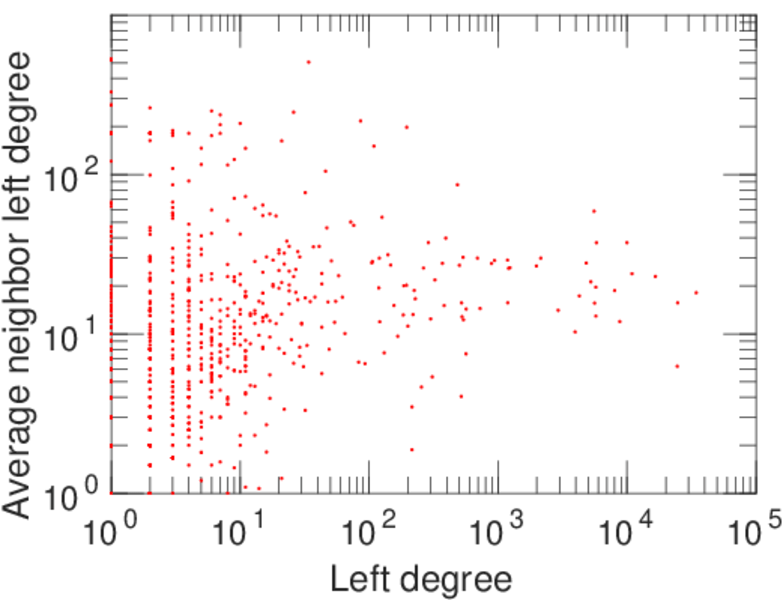
| Average left degree | d1 = | 238.240
|
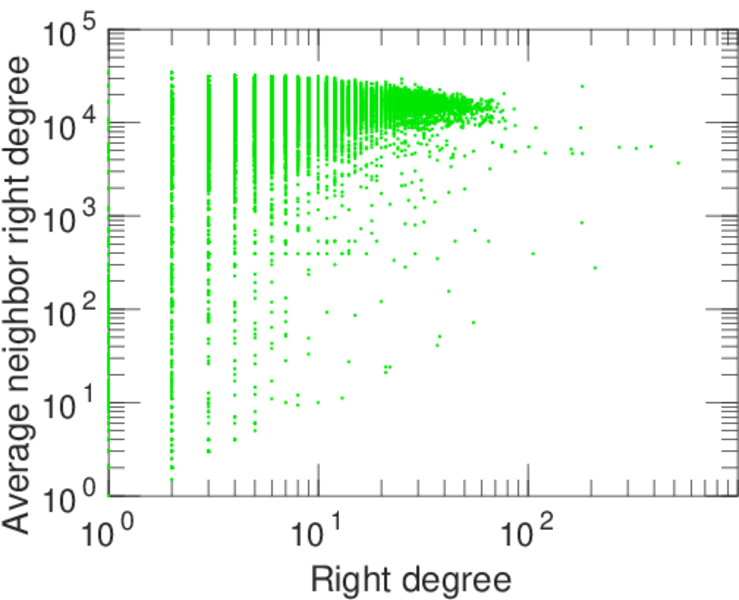
| Average right degree | d2 = | 4.836 15
|
| Fill | p = | 0.003 012 26
|
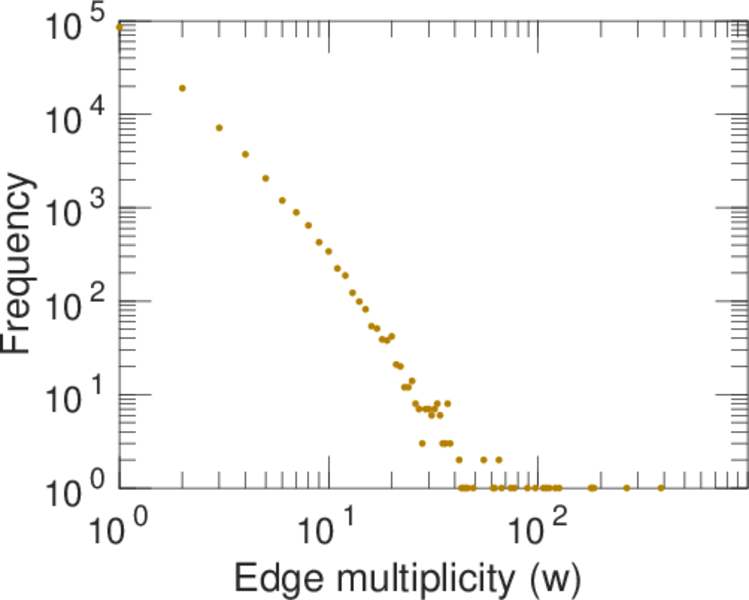
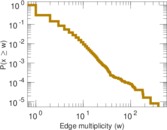
| Average edge multiplicity | m̃ = | 1.770 11
|
| Size of LCC | N = | 44,609
|
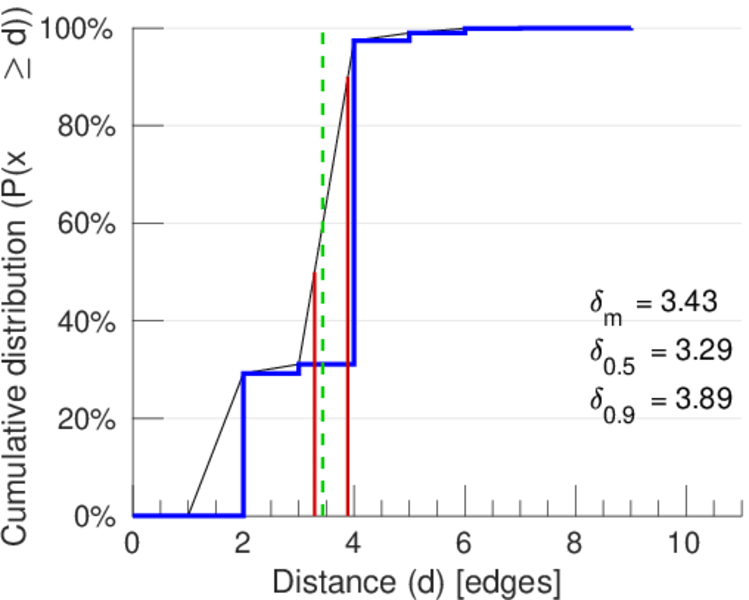
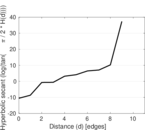
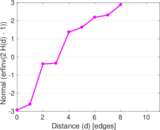
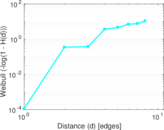
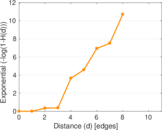
| Diameter | δ = | 11
|
| 50-Percentile effective diameter | δ0.5 = | 3.285 33
|
| 90-Percentile effective diameter | δ0.9 = | 3.888 41
|
| Median distance | δM = | 4
|
| Mean distance | δm = | 3.434 82
|
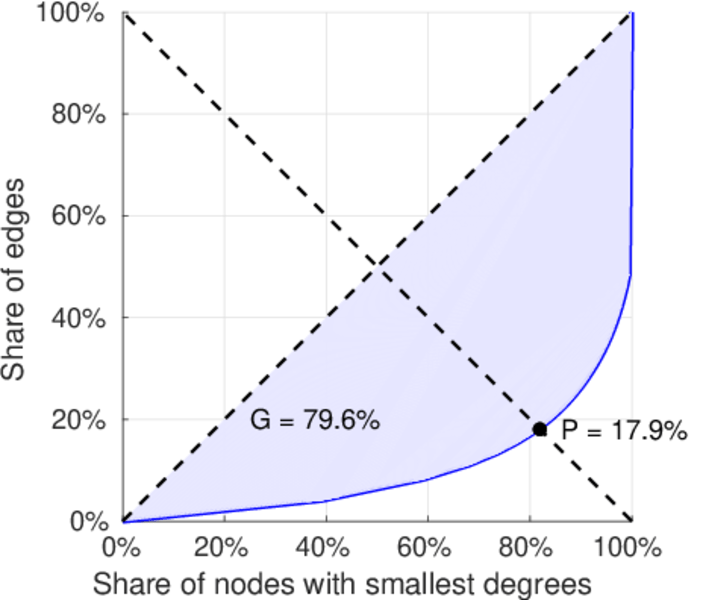
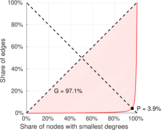
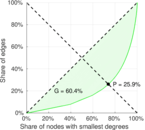
| Gini coefficient | G = | 0.798 532
|
| Balanced inequality ratio | P = | 0.177 503
|
| Left balanced inequality ratio | P1 = | 0.039 368 9
|
| Right balanced inequality ratio | P2 = | 0.259 334
|
| Relative edge distribution entropy | Her = | 0.702 027
|
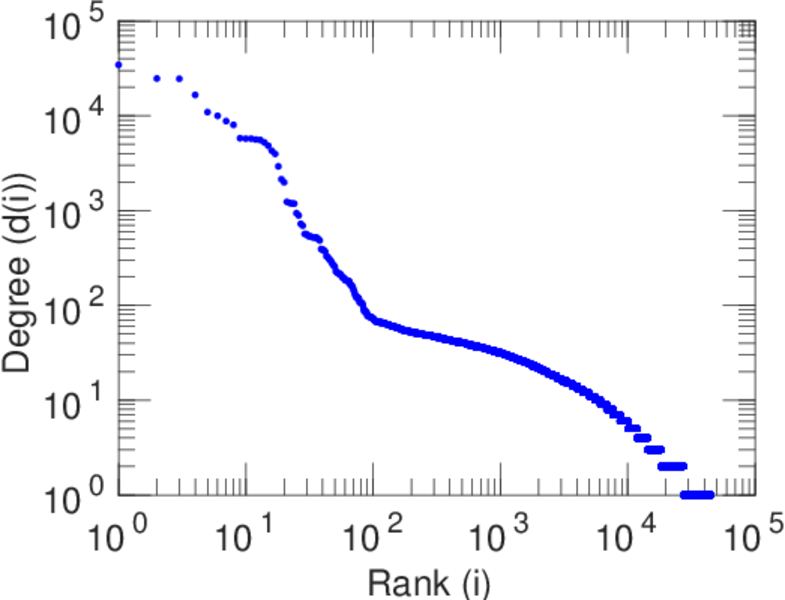
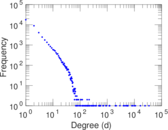
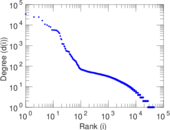
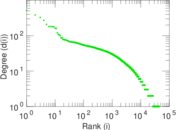
| Power law exponent | γ = | 2.466 60
|
| Tail power law exponent | γt = | 2.221 00
|
| Tail power law exponent with p | γ3 = | 2.221 00
|
| p-value | p = | 0.000 00
|
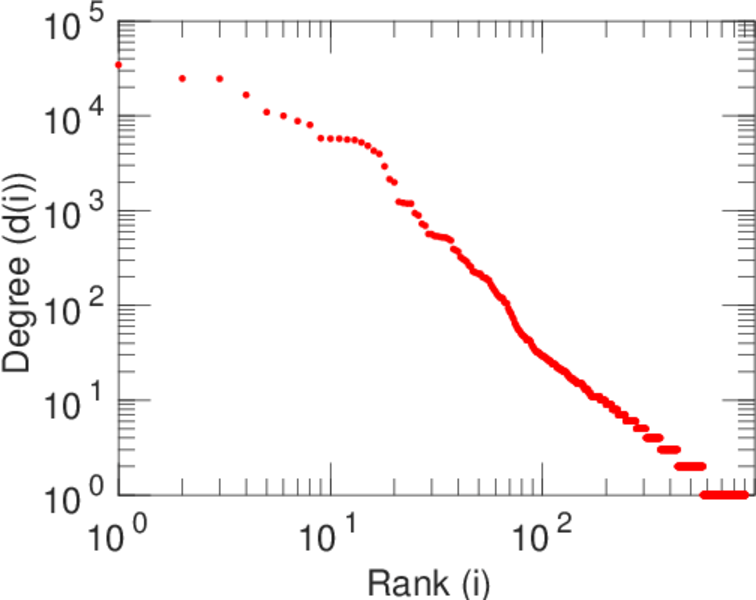
| Left tail power law exponent with p | γ3,1 = | 1.651 00
|
| Left p-value | p1 = | 0.000 00
|
| Right tail power law exponent with p | γ3,2 = | 8.981 00
|
| Right p-value | p2 = | 0.772 000
|
| Degree assortativity | ρ = | −0.364 172
|
| Degree assortativity p-value | pρ = | 0.000 00
|
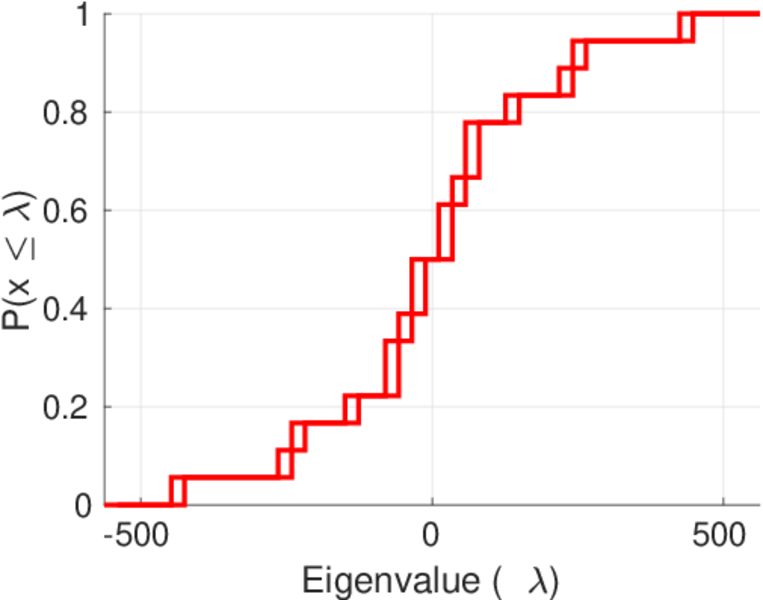
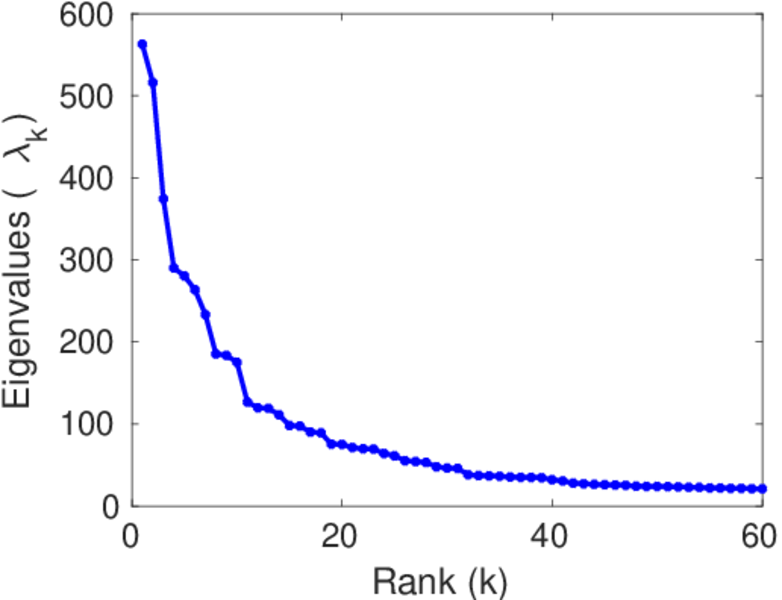
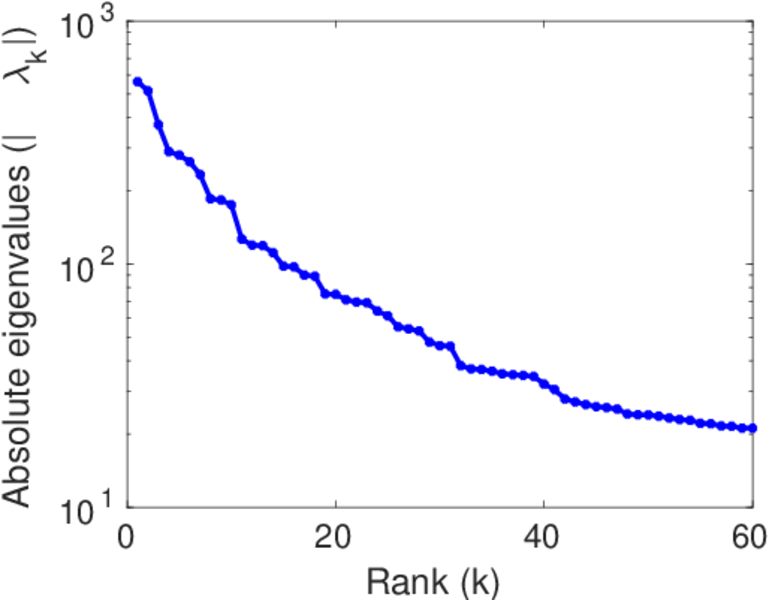
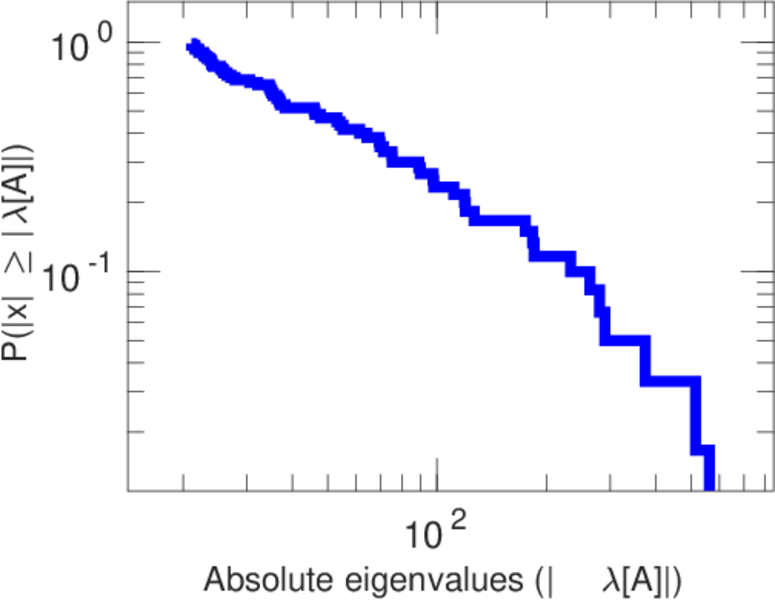
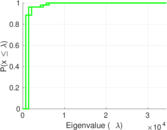
| Spectral norm | α = | 562.721
|
| Algebraic connectivity | a = | 0.025 390 5
|
| Spectral separation | |λ1[A] / λ2[A]| = | 1.090 70
|
| Controllability | C = | 43,288
|
| Relative controllability | Cr = | 0.961 485
|
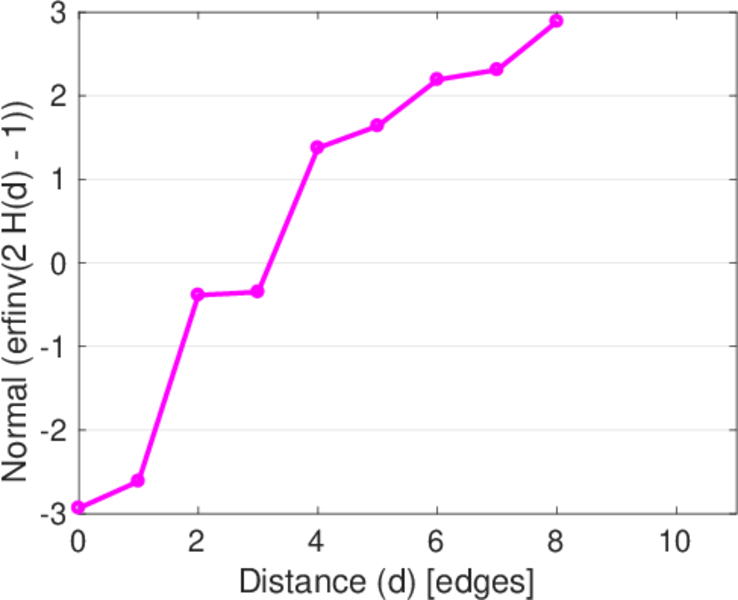
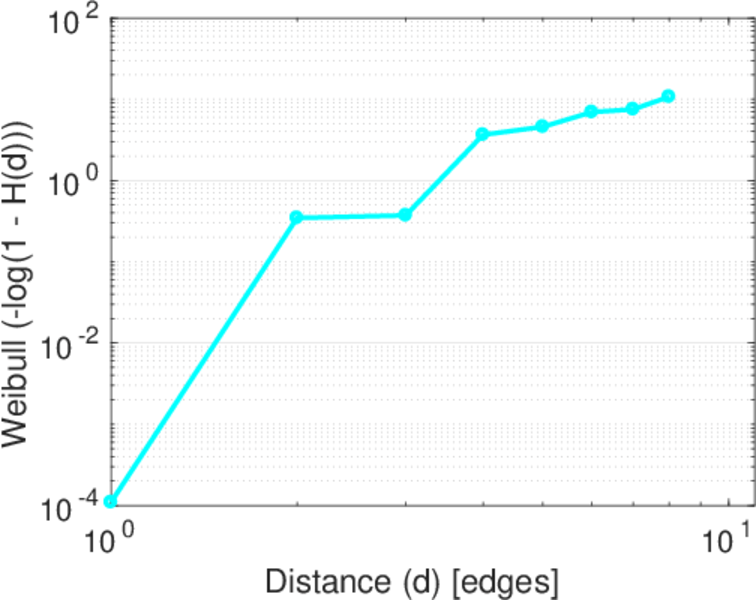
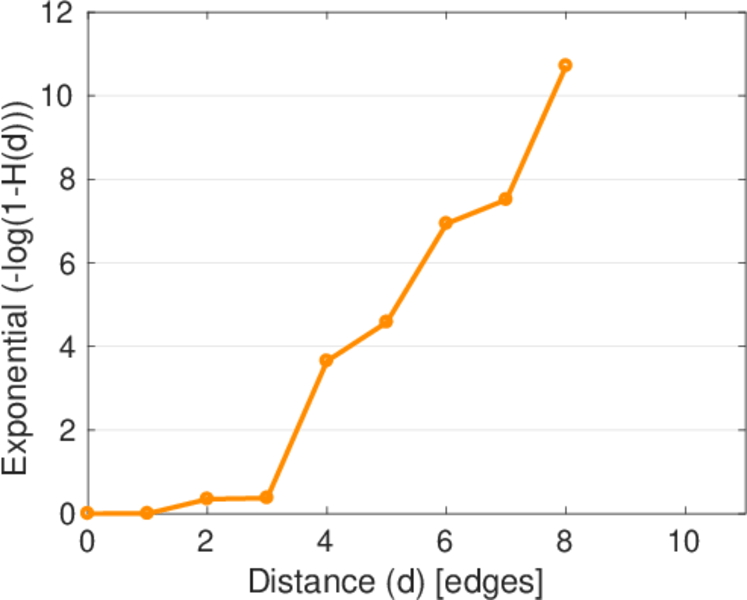
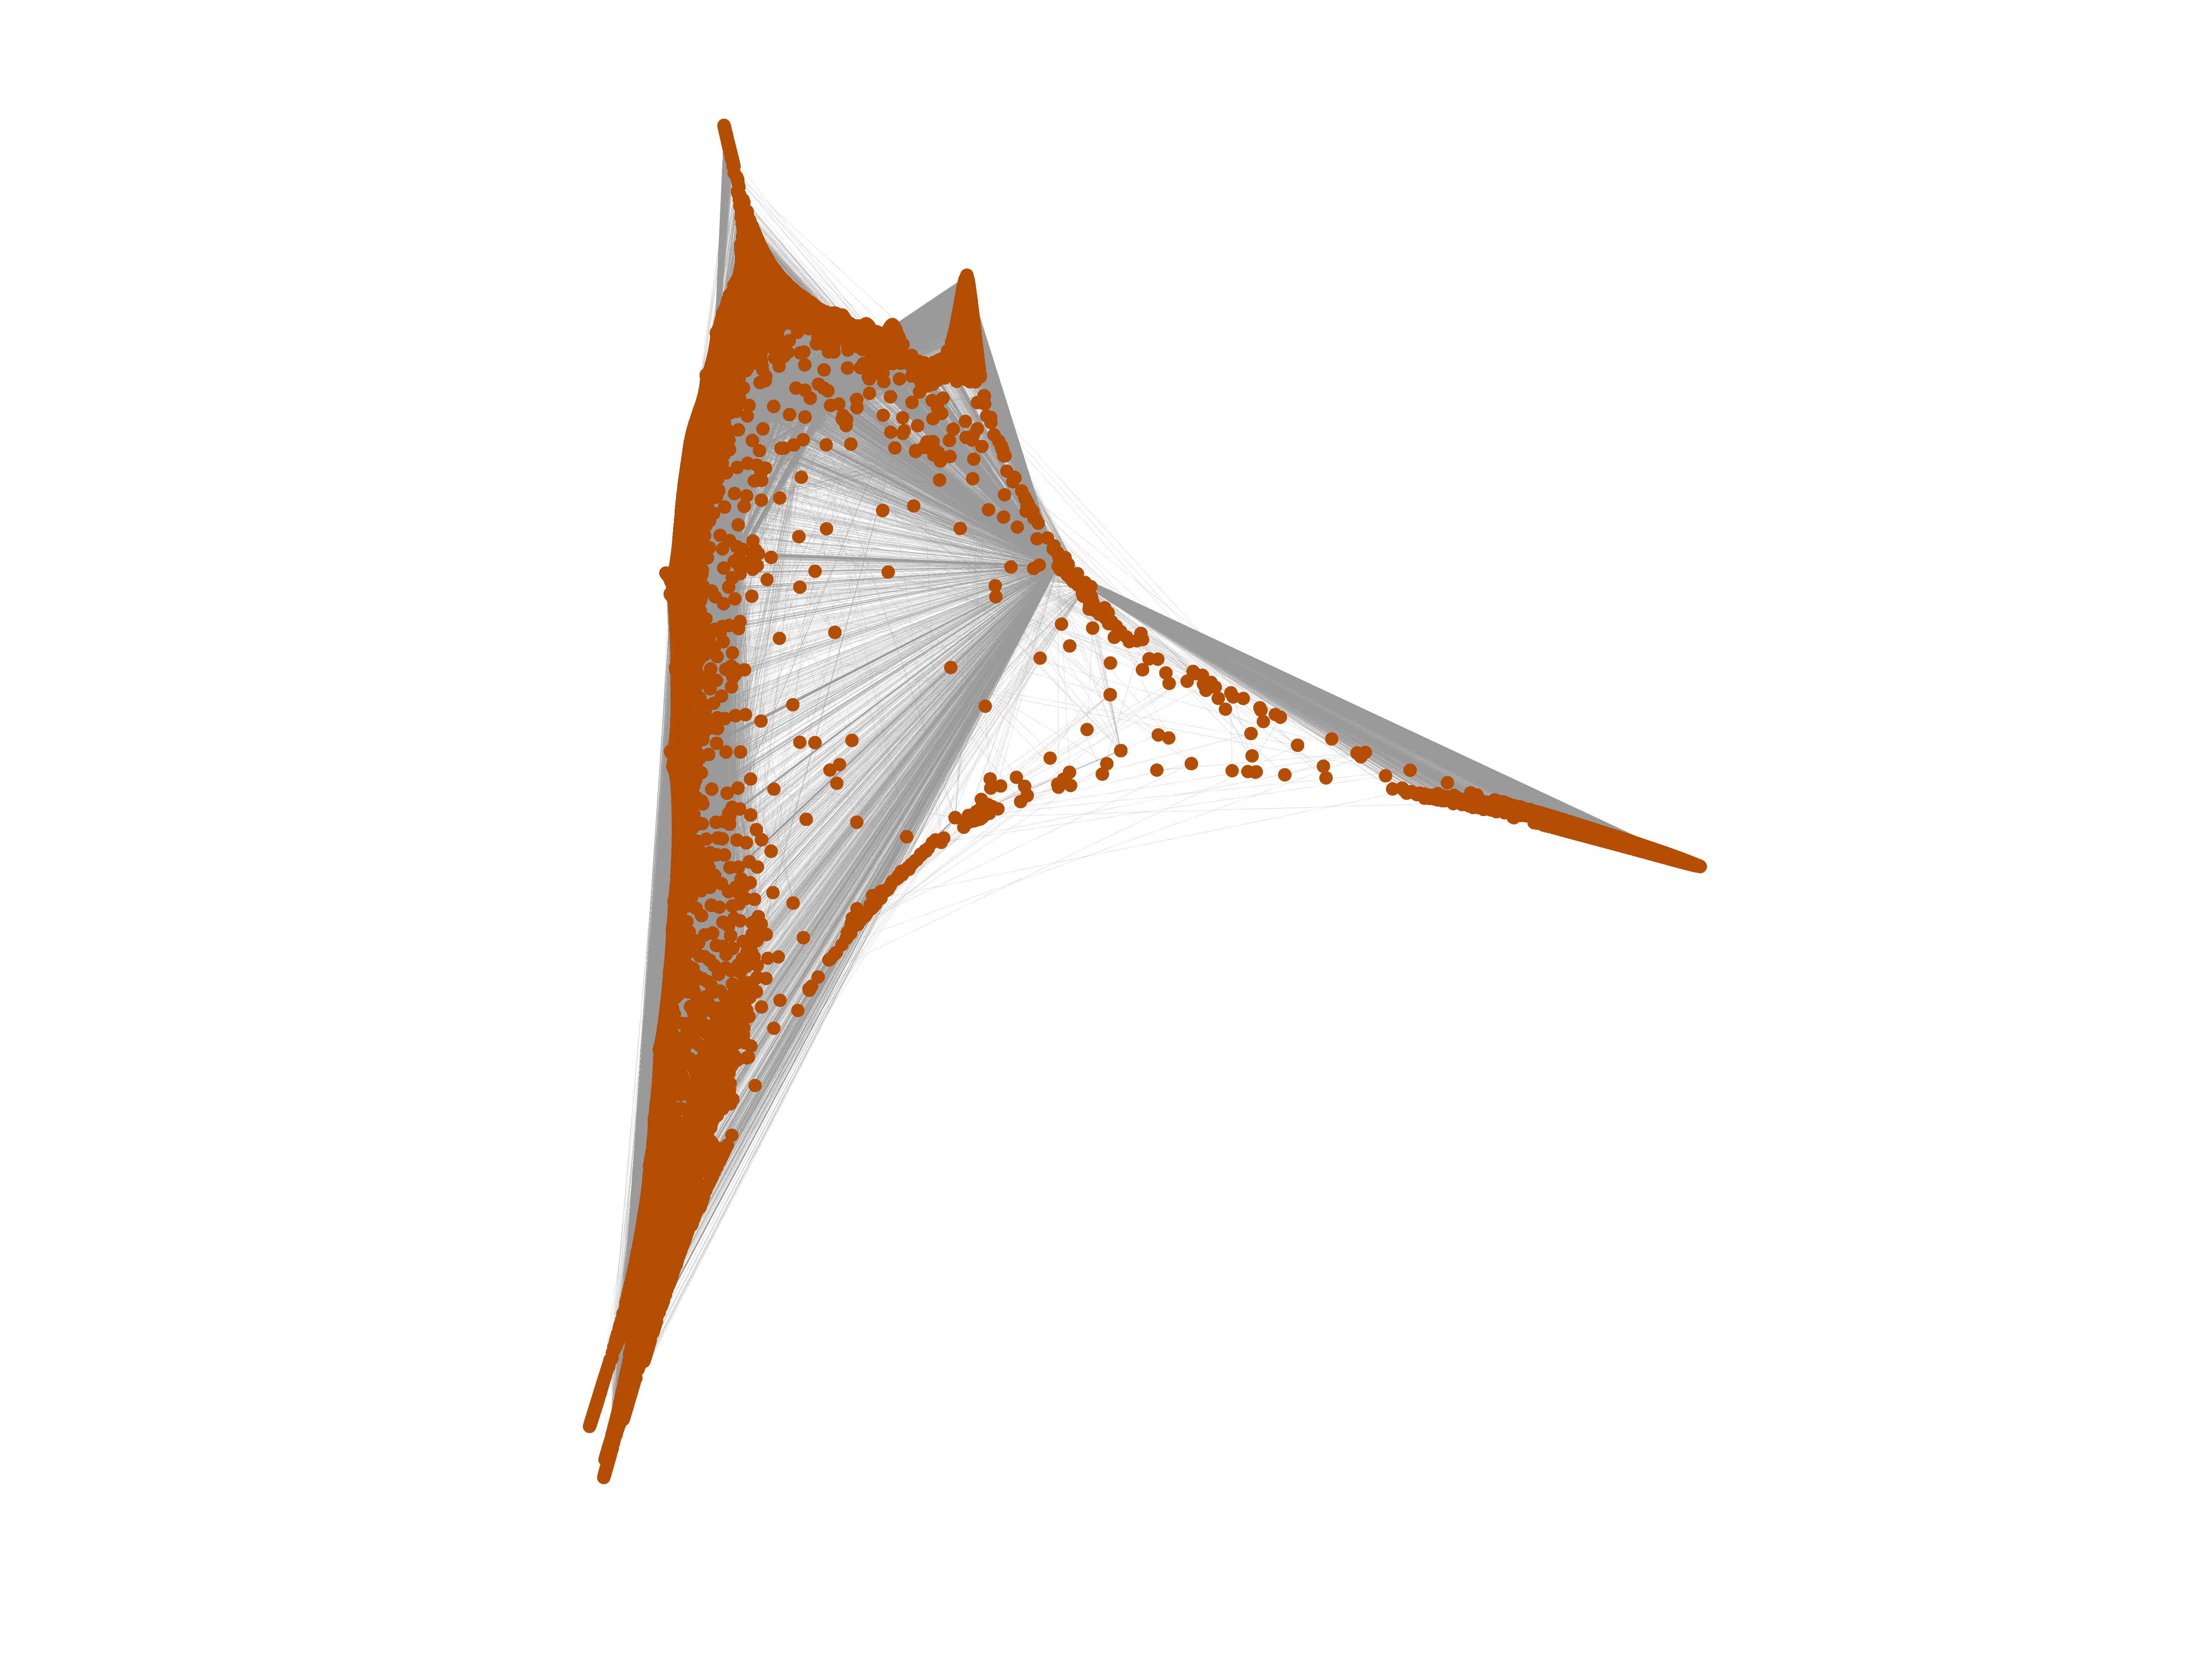
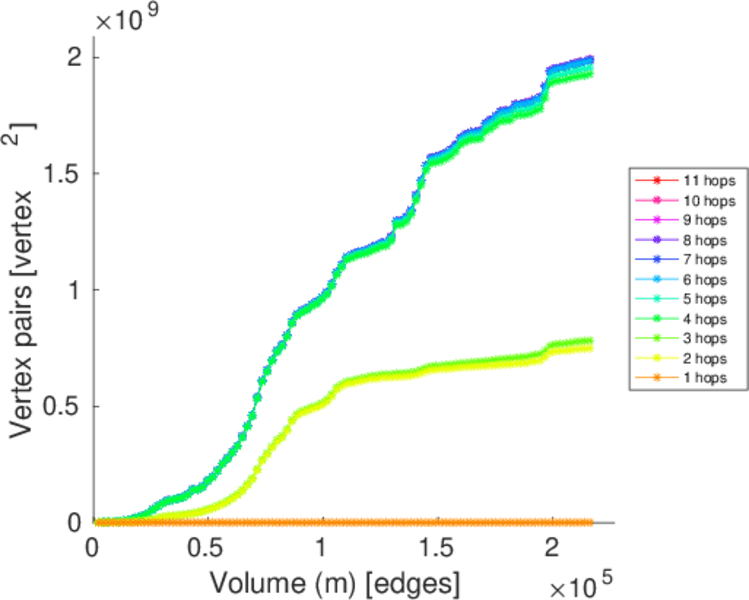
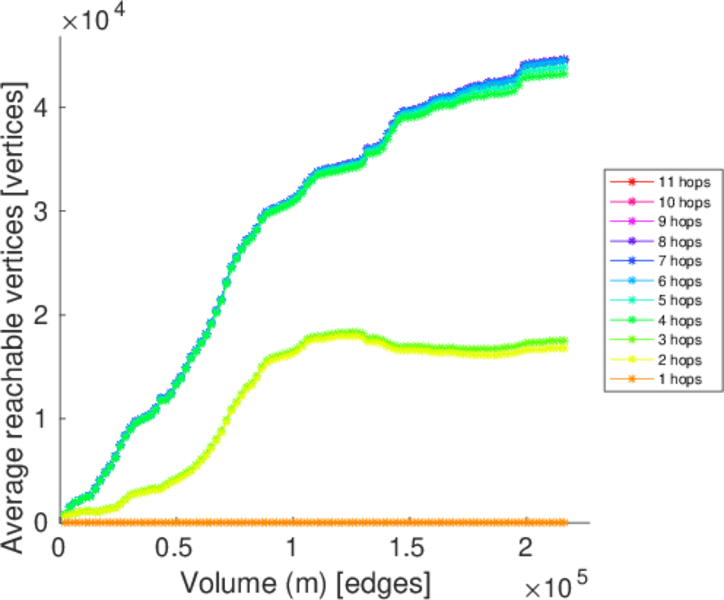
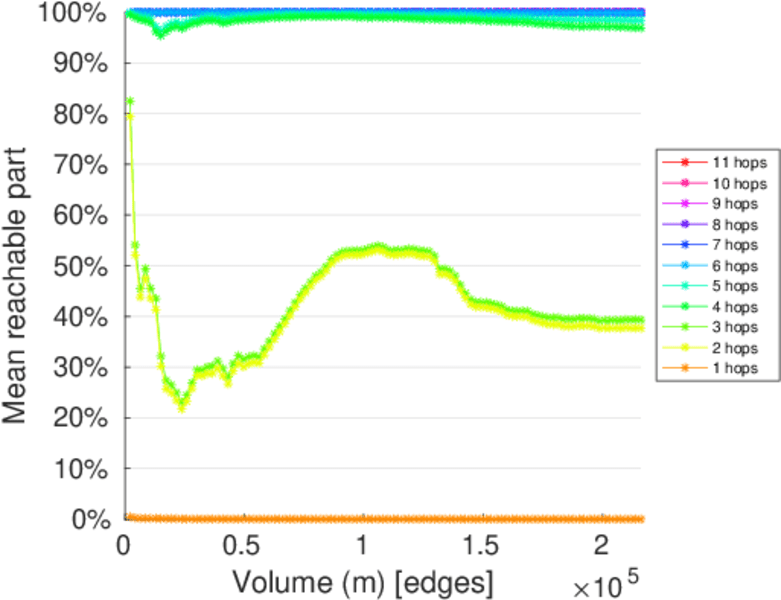
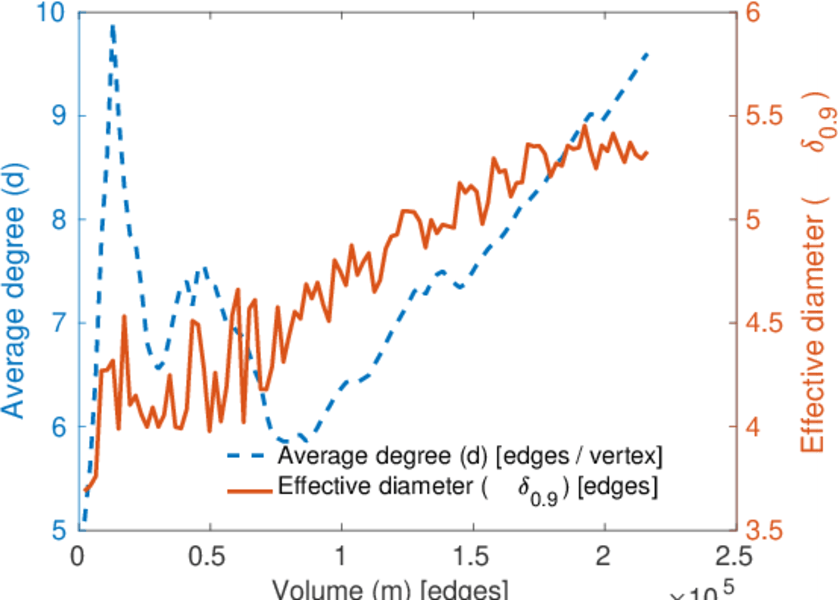
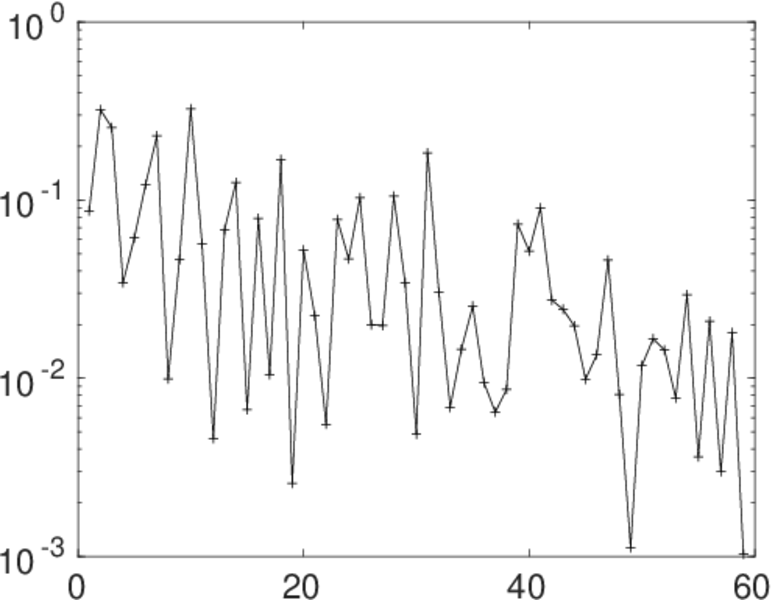
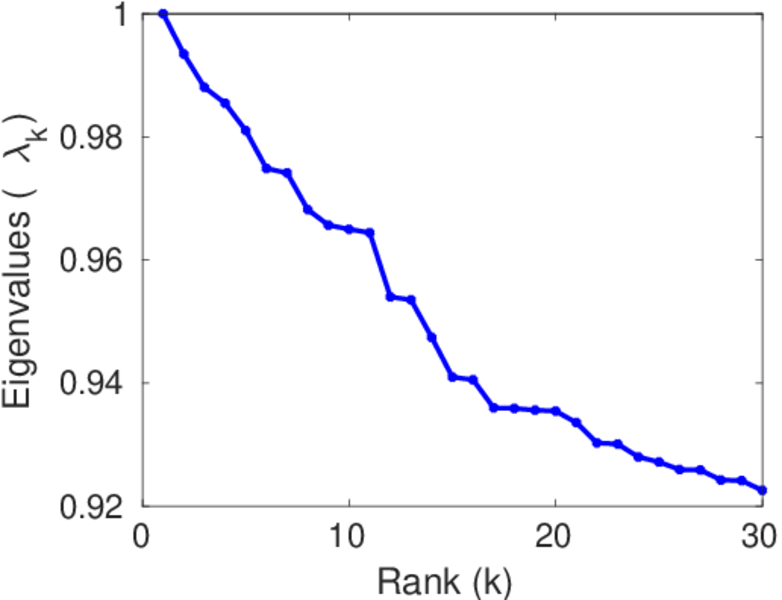
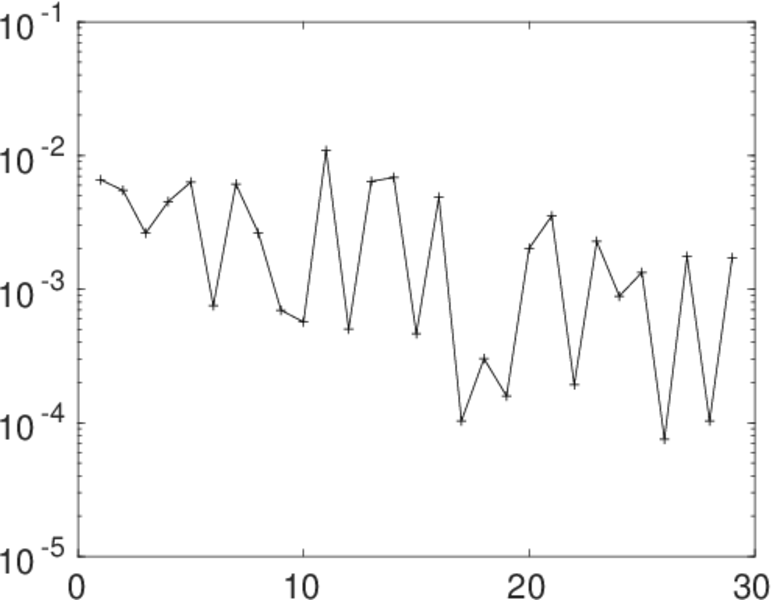
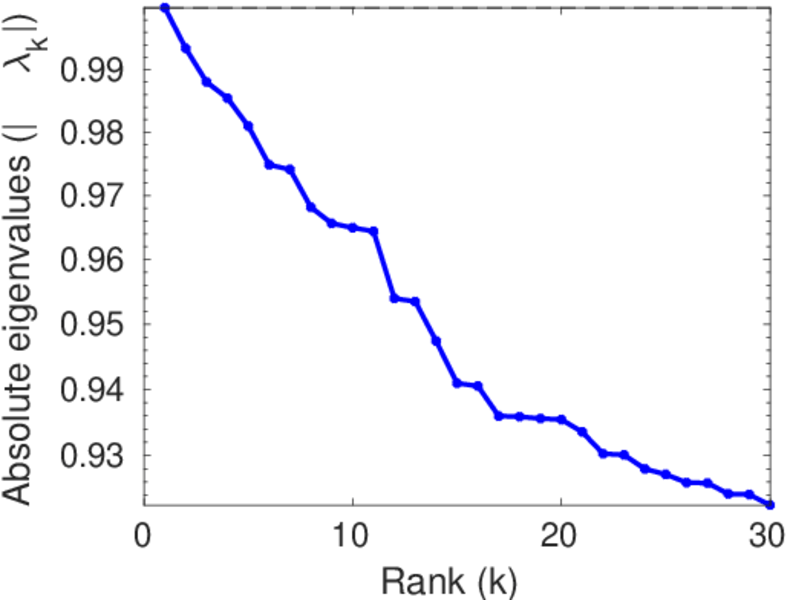
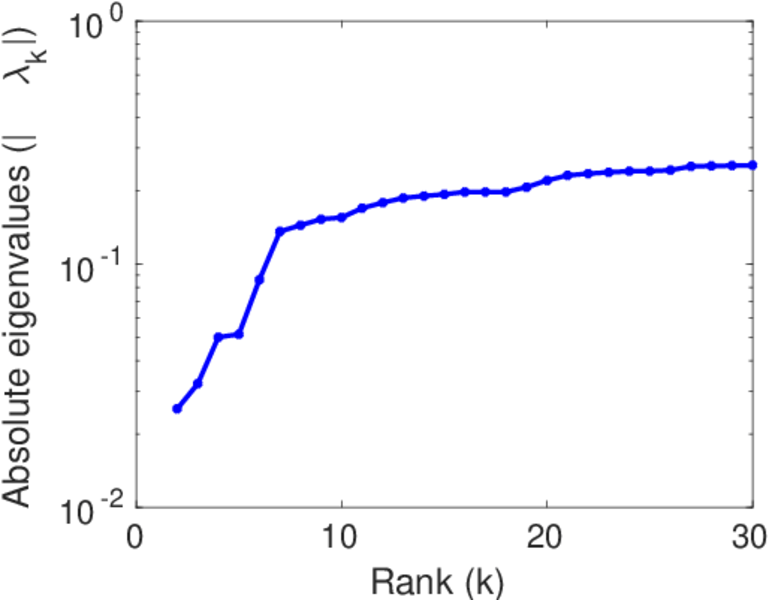
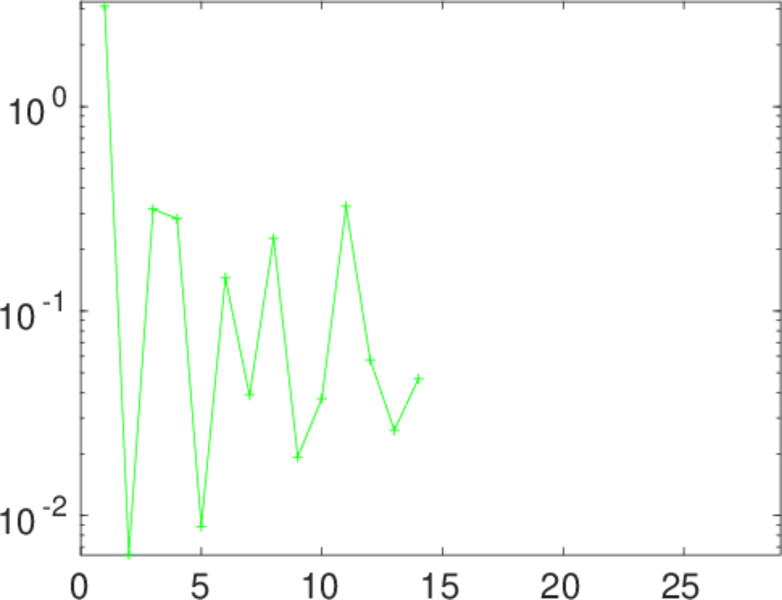
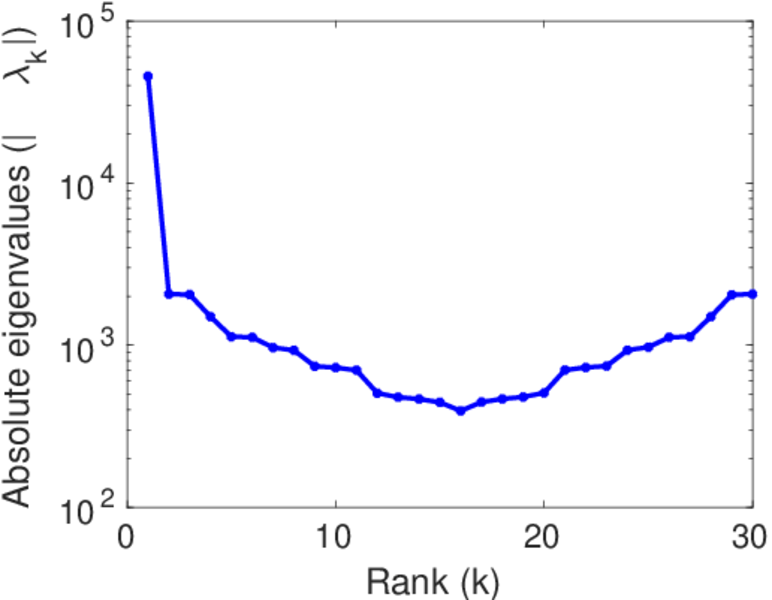
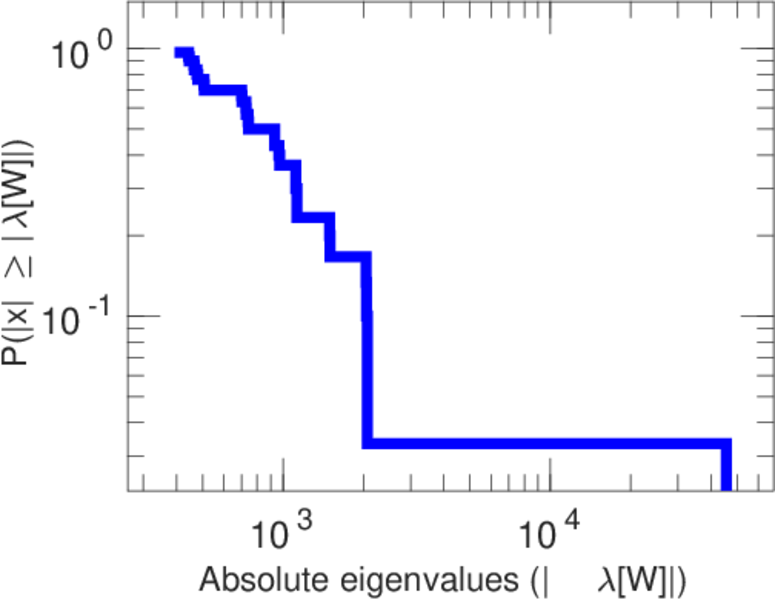
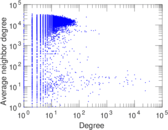
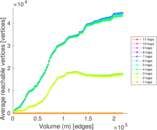
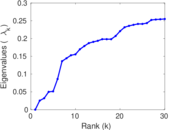
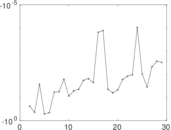
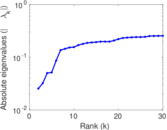
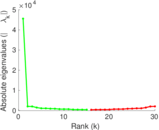
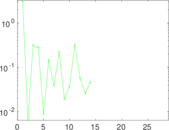
Plots


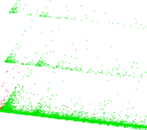
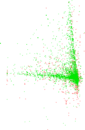


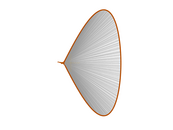


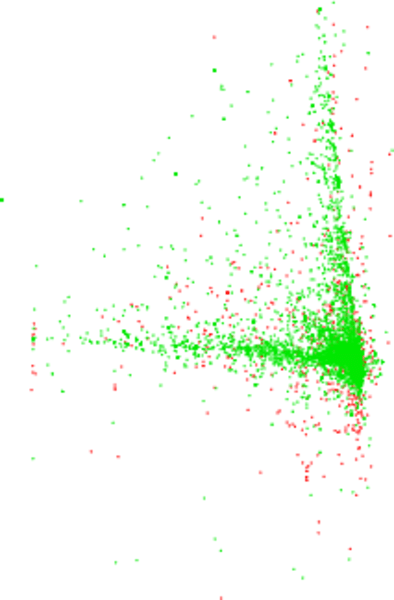
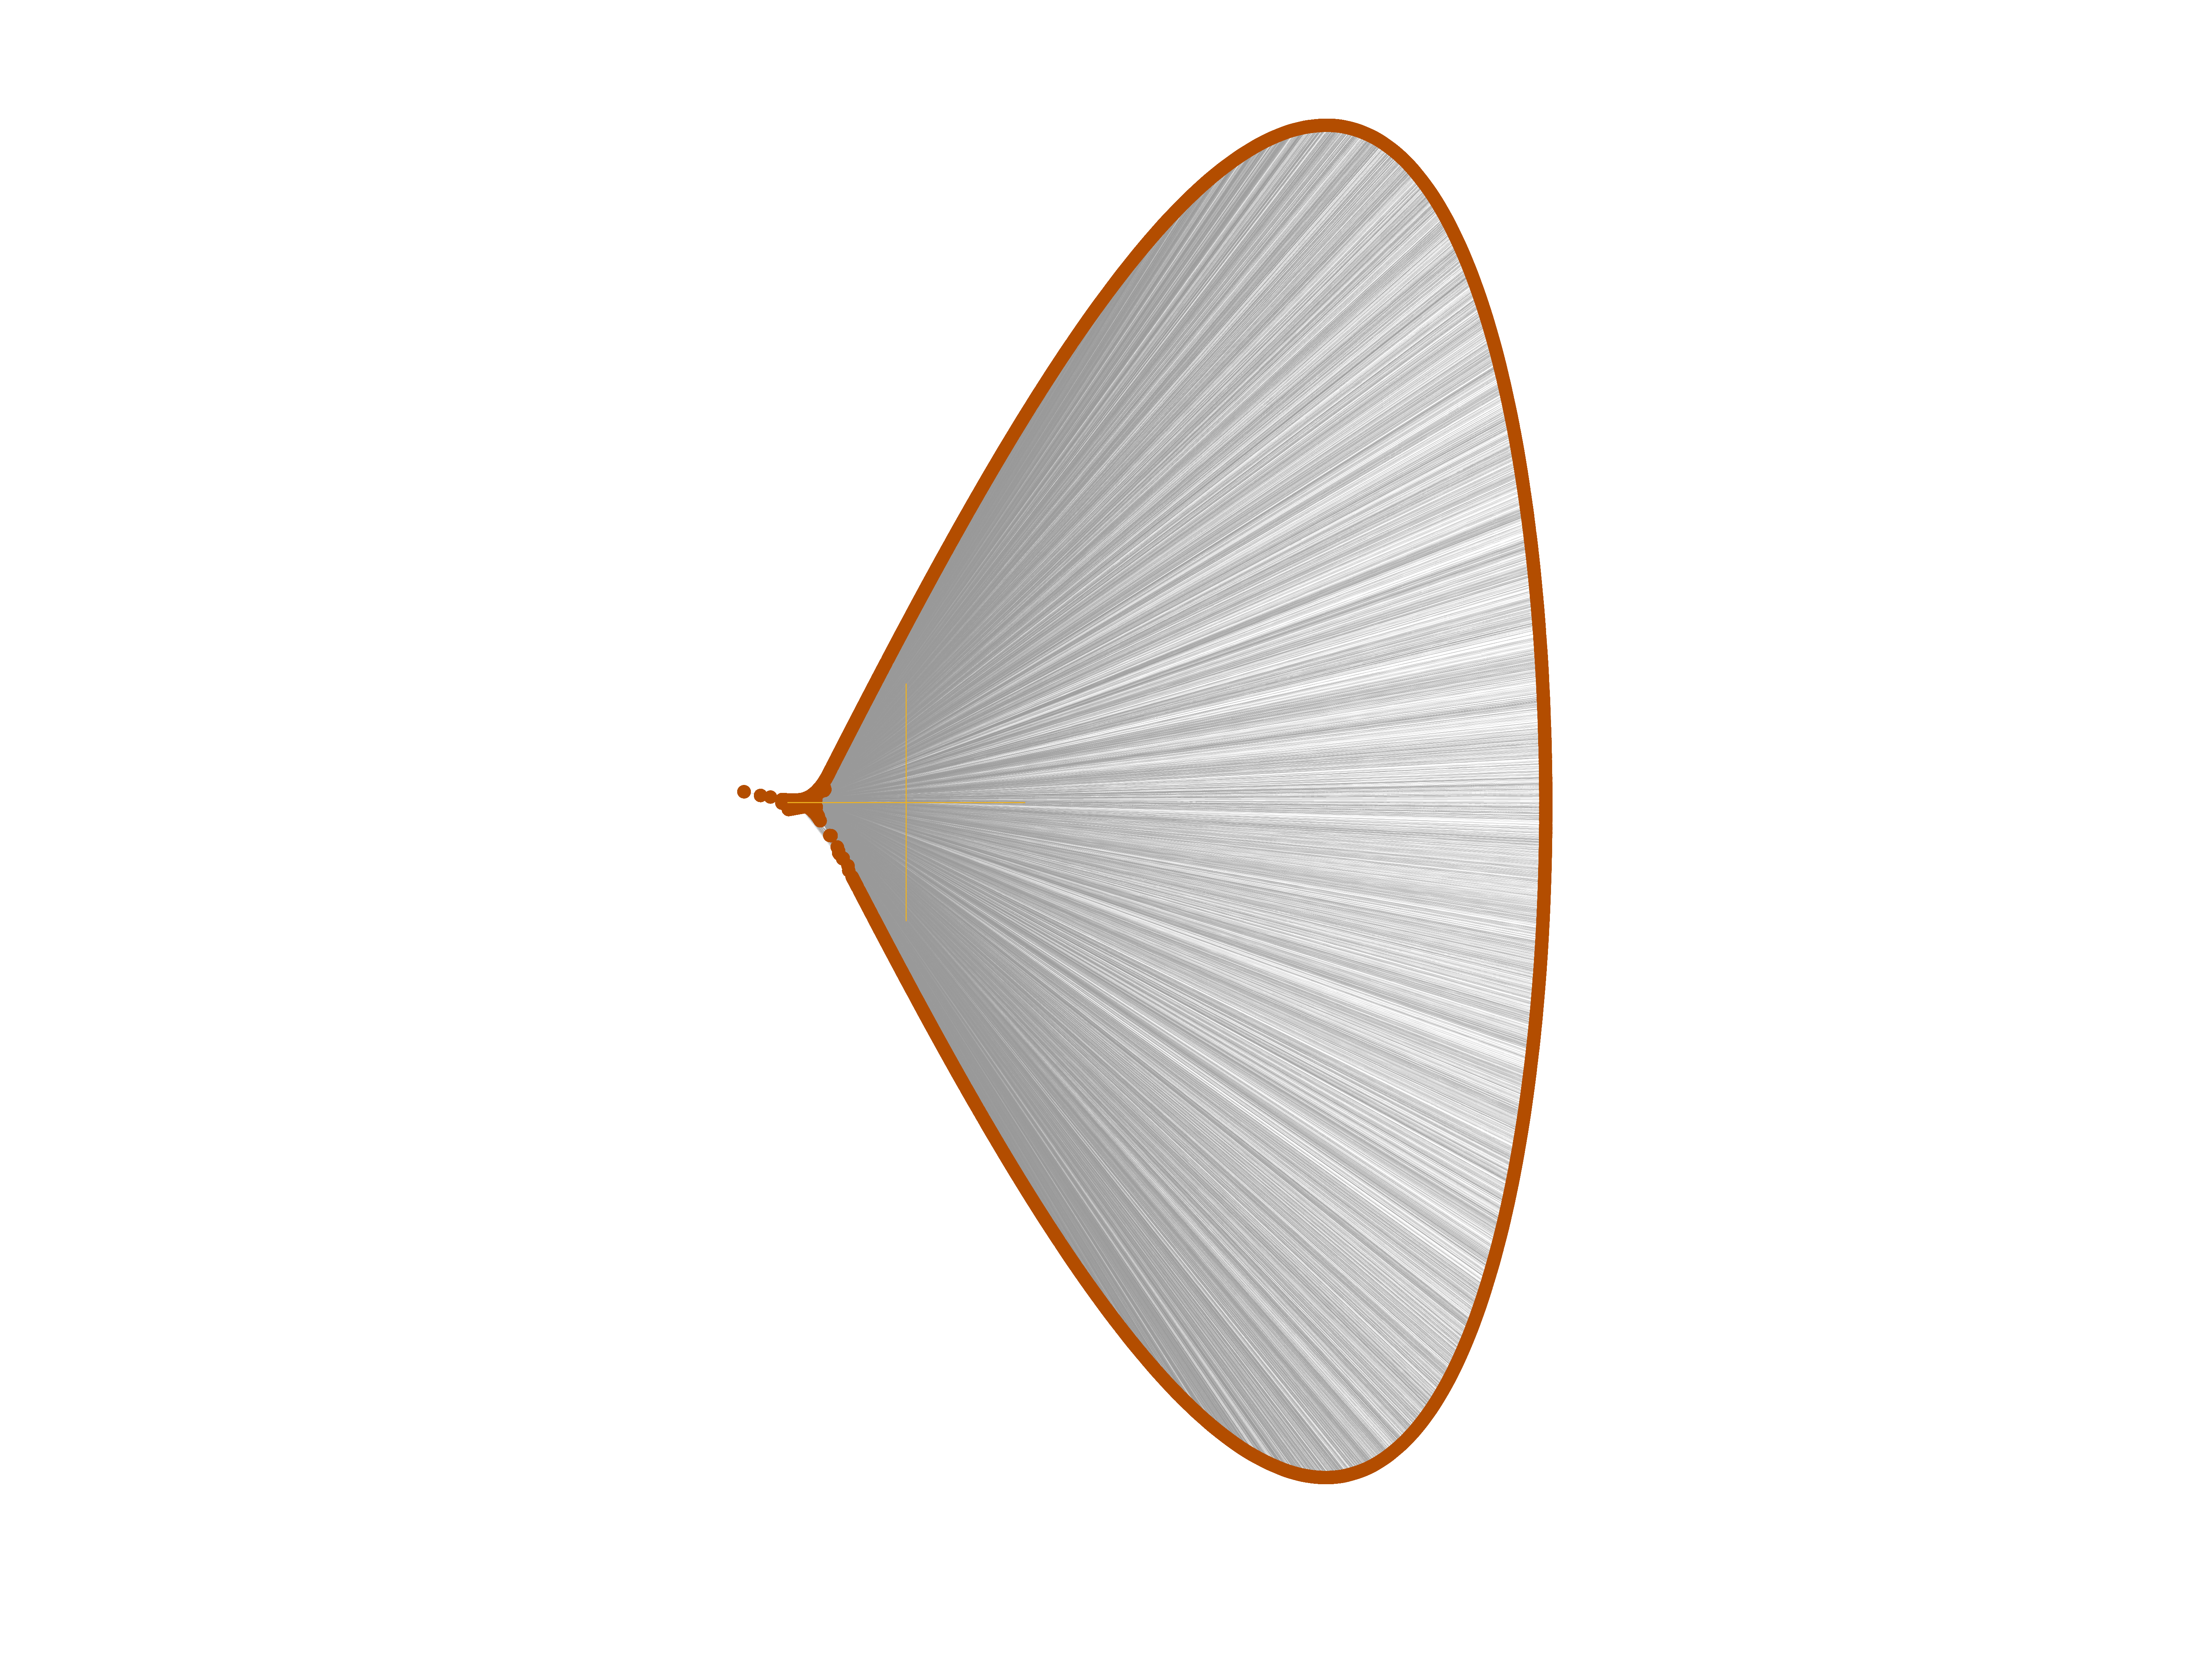
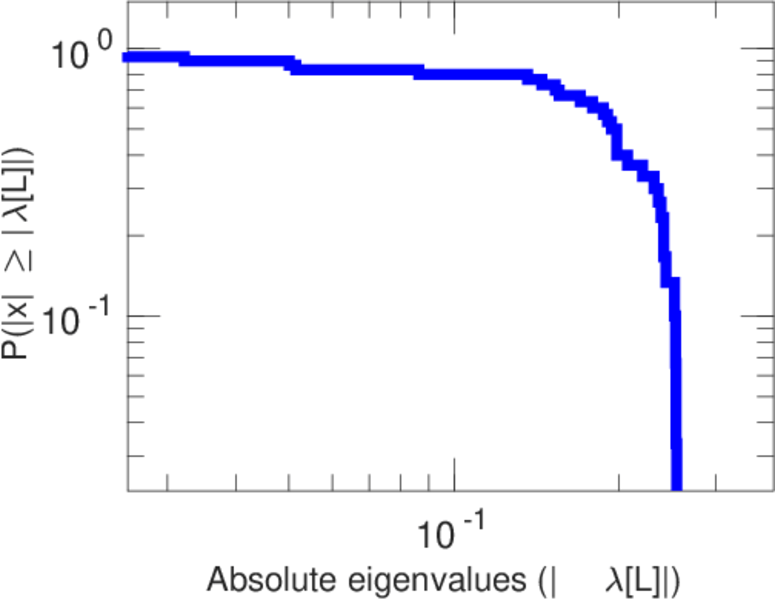
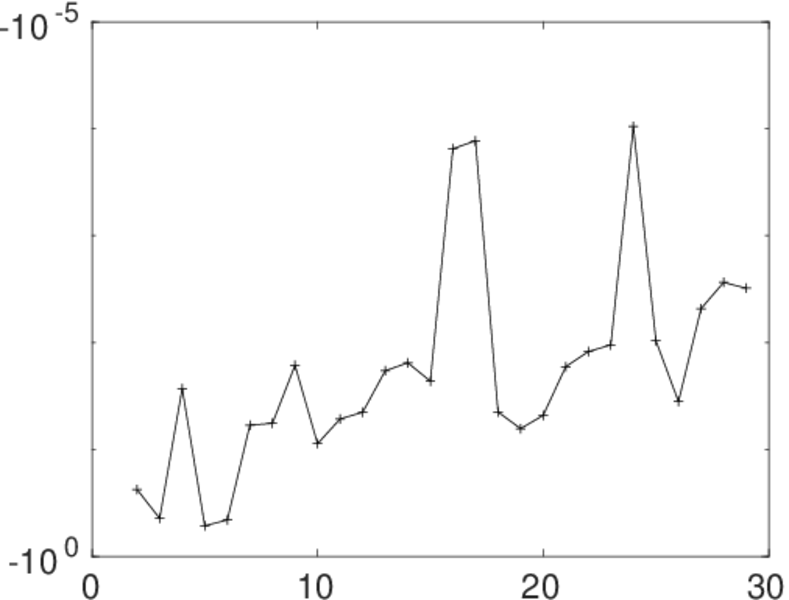
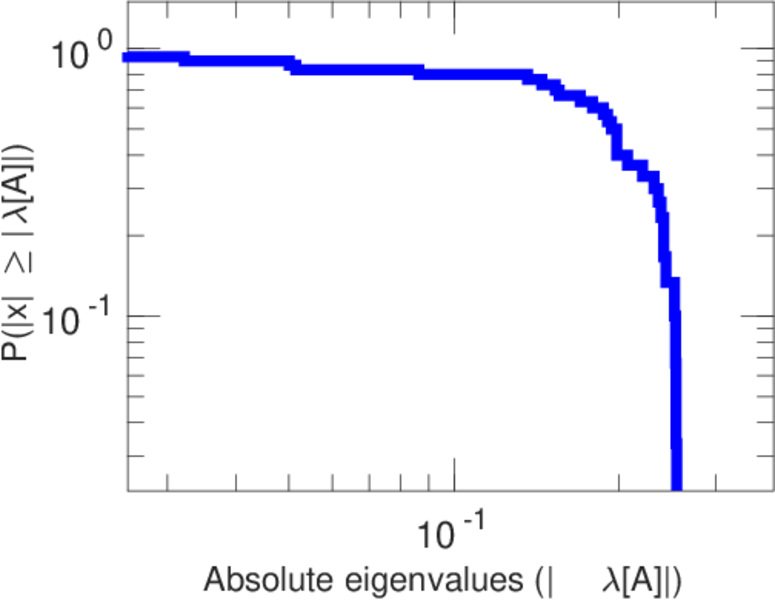
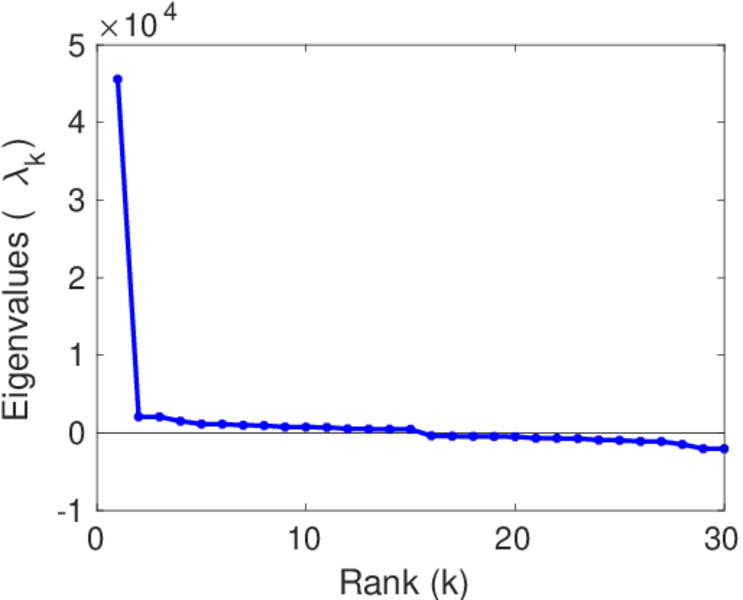
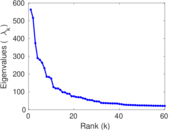
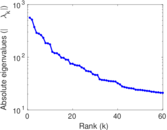
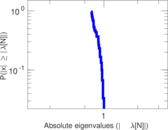
Matrix decompositions plots


Downloads
References
|
[1]
|
Jérôme Kunegis.
KONECT – The Koblenz Network Collection.
In Proc. Int. Conf. on World Wide Web Companion, pages
1343–1350, 2013.
[ http ]
|
|
[2]
|
Wikimedia Foundation.
Wikimedia downloads.
http://dumps.wikimedia.org/, January 2010.
|
 KONECT ‣ Networks ‣
Buy Me a Coffee
KONECT ‣ Networks ‣
Buy Me a Coffee