Wikipedia edits (ur)
This is the bipartite edit network of the Urdu Wikipedia. It contains users and
pages from the Urdu Wikipedia, connected by edit events. Each edge represents
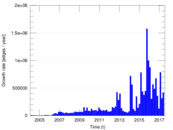
an edit. The dataset includes the timestamp of each edit.
Metadata
Statistics
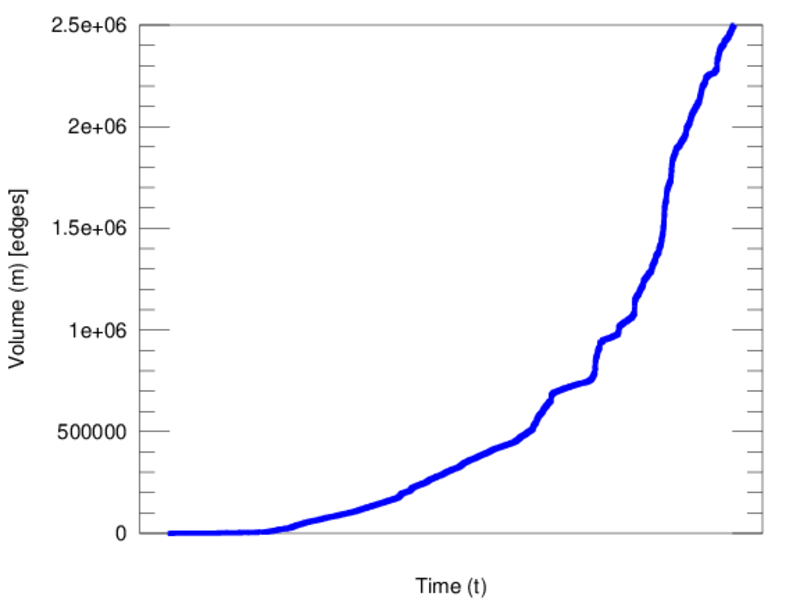
| Size | n = | 678,976
|
| Left size | n1 = | 6,883
|
| Right size | n2 = | 672,093
|
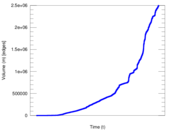
| Volume | m = | 2,499,640
|
| Unique edge count | m̿ = | 1,611,787
|
| Wedge count | s = | 103,717,371,960
|
| Claw count | z = | 7,269,247,564,440,648
|
| Cross count | x = | 4.251 99 × 1020
|
| Square count | q = | 33,187,012,734
|
| 4-Tour count | T4 = | 680,368,882,314
|
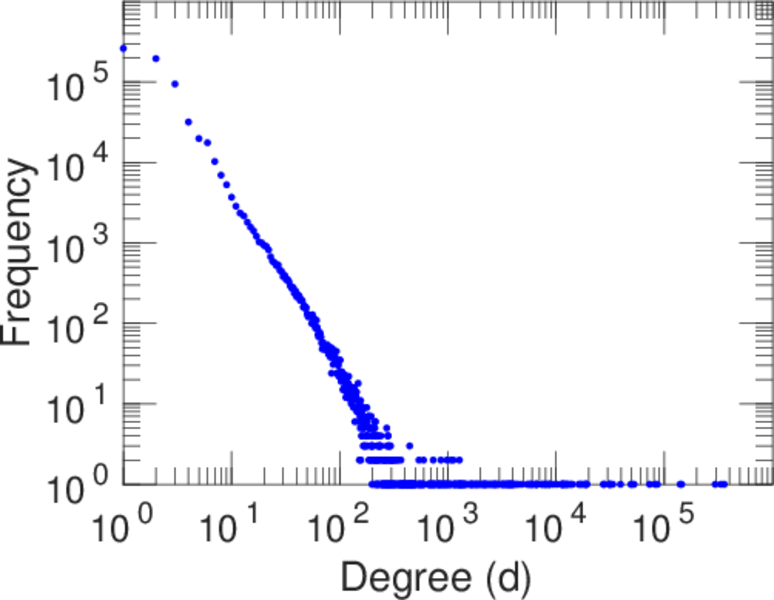
| Maximum degree | dmax = | 358,252
|
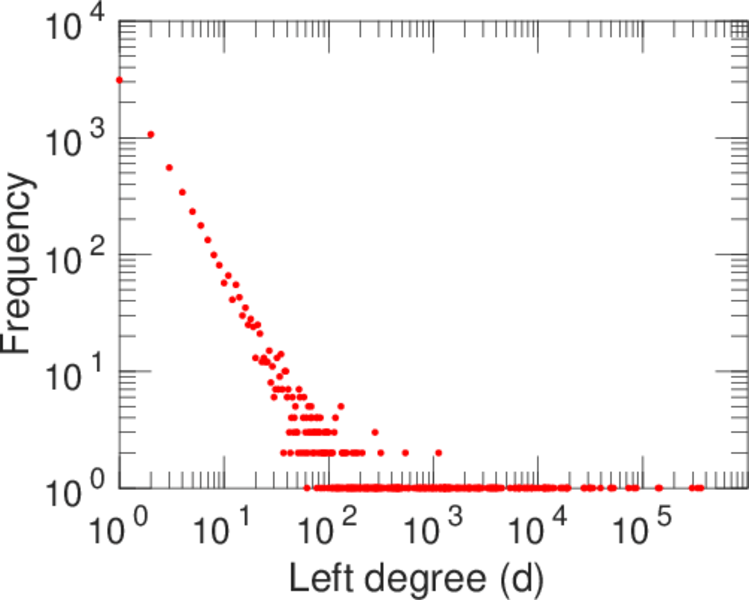
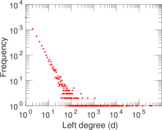
| Maximum left degree | d1max = | 358,252
|
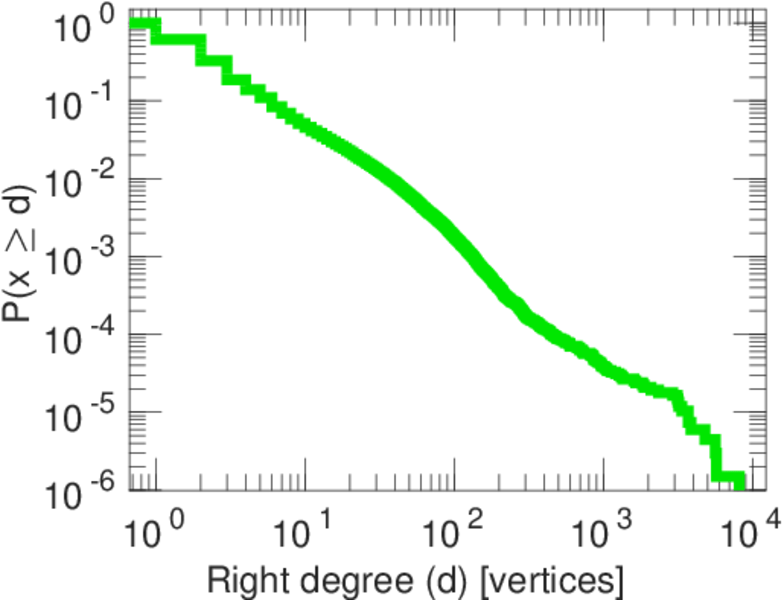
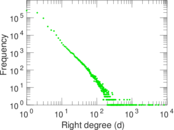
| Maximum right degree | d2max = | 8,182
|
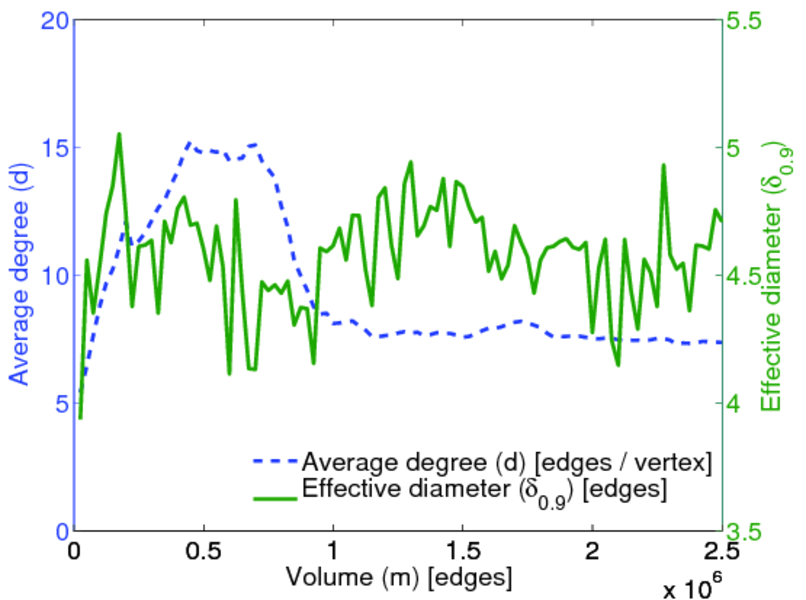
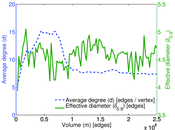
| Average degree | d = | 7.362 97
|
| Average left degree | d1 = | 363.161
|
| Average right degree | d2 = | 3.719 19
|
| Fill | p = | 0.000 348 418
|
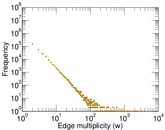
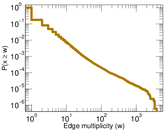
| Average edge multiplicity | m̃ = | 1.550 85
|
| Size of LCC | N = | 675,236
|
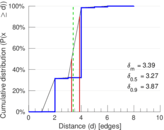
| Diameter | δ = | 10
|
| 50-Percentile effective diameter | δ0.5 = | 3.267 66
|
| 90-Percentile effective diameter | δ0.9 = | 3.872 14
|
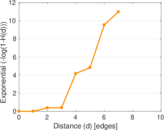
| Median distance | δM = | 4
|
| Mean distance | δm = | 3.385 88
|
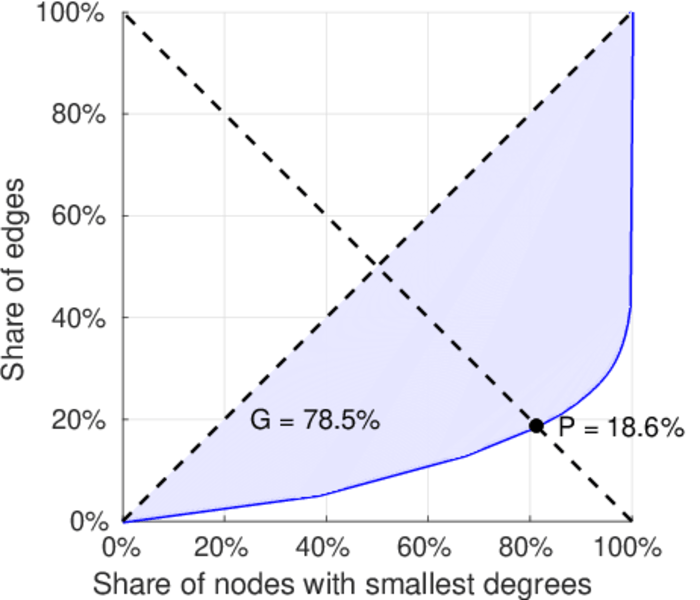
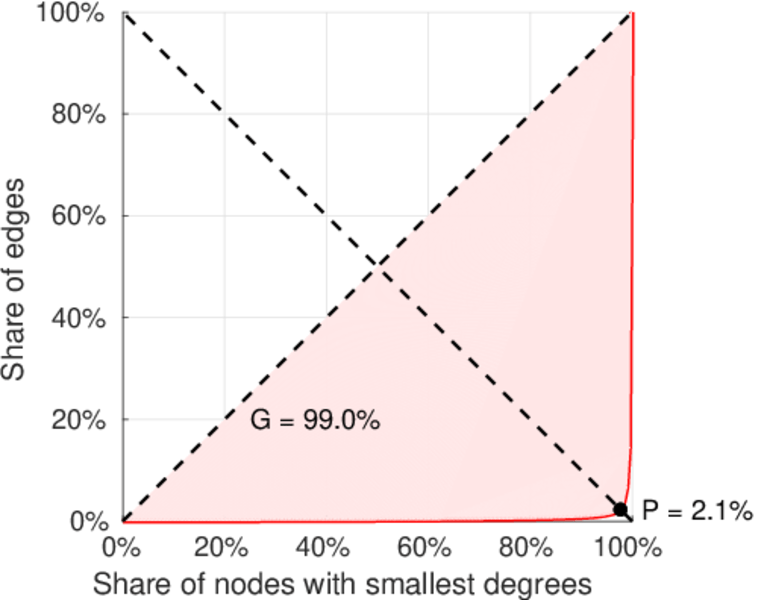
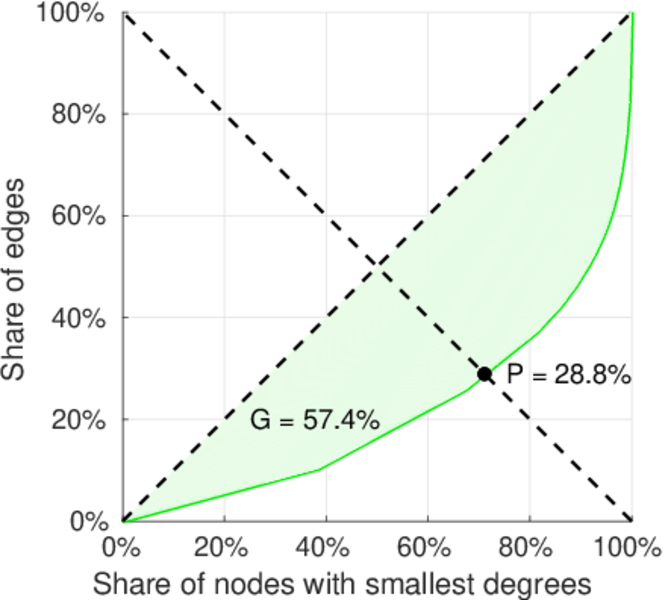
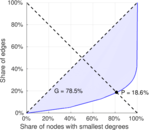
| Gini coefficient | G = | 0.785 983
|
| Balanced inequality ratio | P = | 0.184 780
|
| Left balanced inequality ratio | P1 = | 0.021 393 5
|
| Right balanced inequality ratio | P2 = | 0.287 644
|
| Relative edge distribution entropy | Her = | 0.663 143
|
| Power law exponent | γ = | 2.650 03
|
| Tail power law exponent | γt = | 2.791 00
|
| Tail power law exponent with p | γ3 = | 2.791 00
|
| p-value | p = | 0.000 00
|
| Left tail power law exponent with p | γ3,1 = | 1.841 00
|
| Left p-value | p1 = | 0.000 00
|
| Right tail power law exponent with p | γ3,2 = | 6.701 00
|
| Right p-value | p2 = | 0.337 000
|
| Degree assortativity | ρ = | −0.379 048
|
| Degree assortativity p-value | pρ = | 0.000 00
|
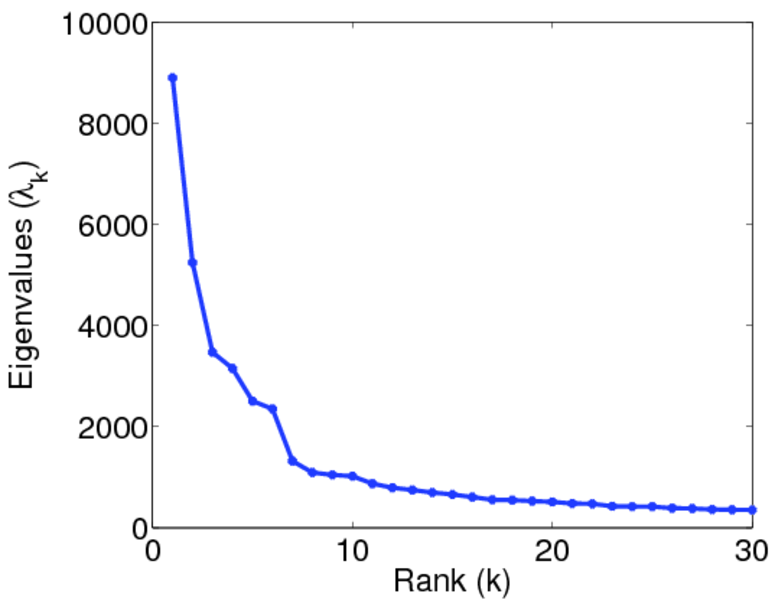
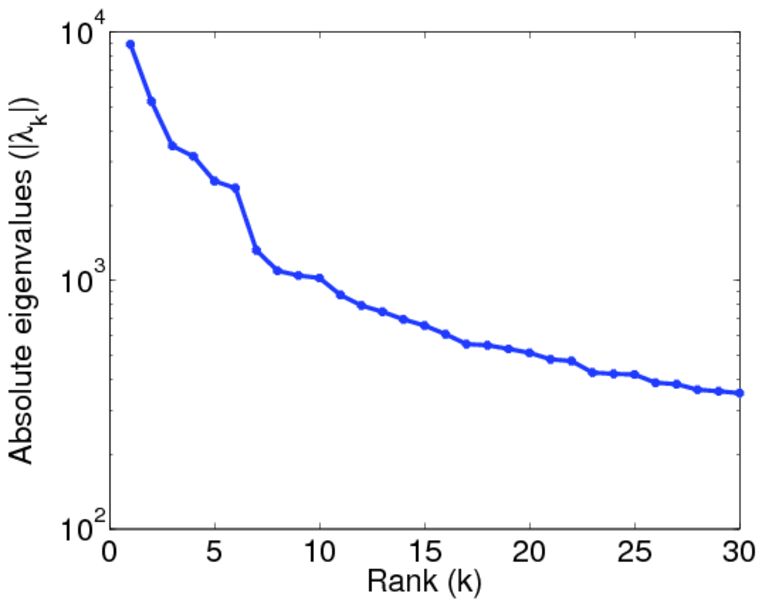
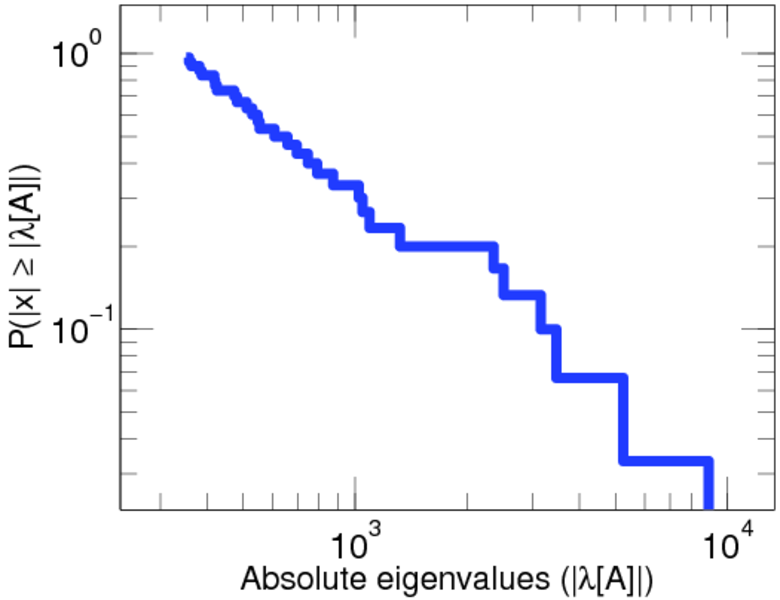
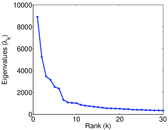
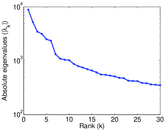
| Spectral norm | α = | 8,900.82
|
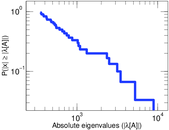
| Spectral separation | |λ1[A] / λ2[A]| = | 1.696 83
|
| Controllability | C = | 665,317
|
| Relative controllability | Cr = | 0.981 117
|
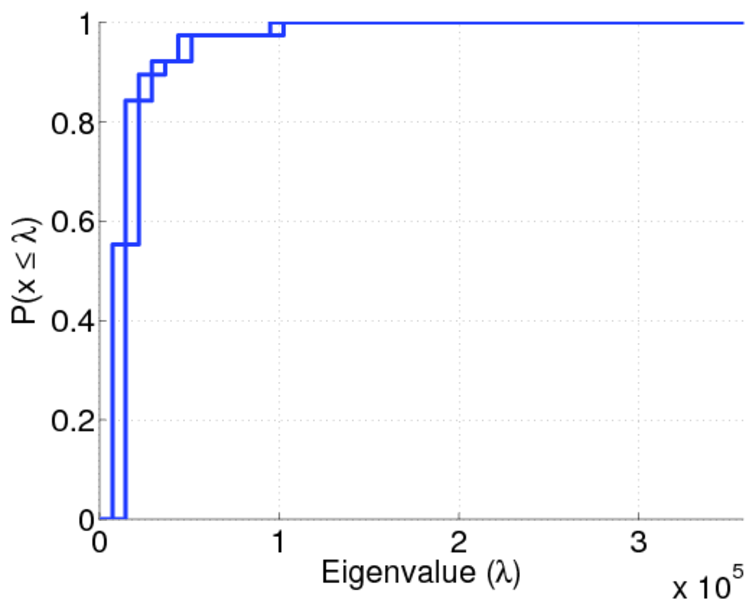
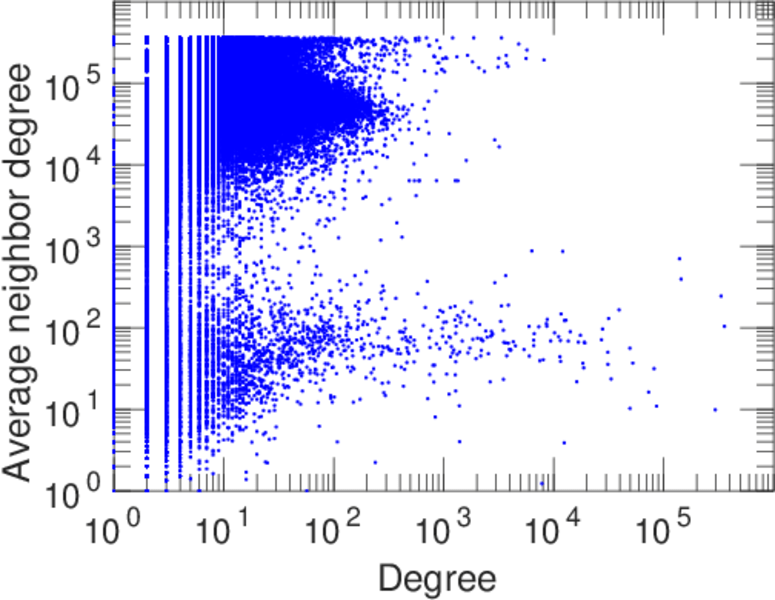
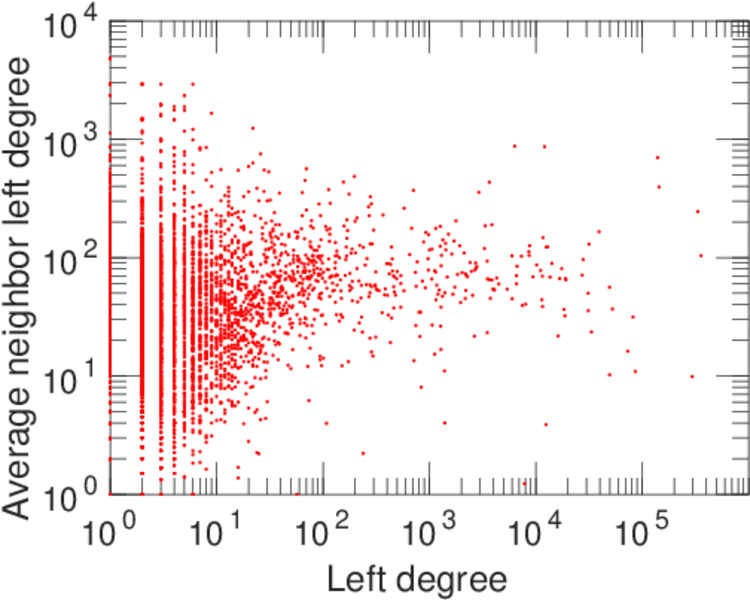
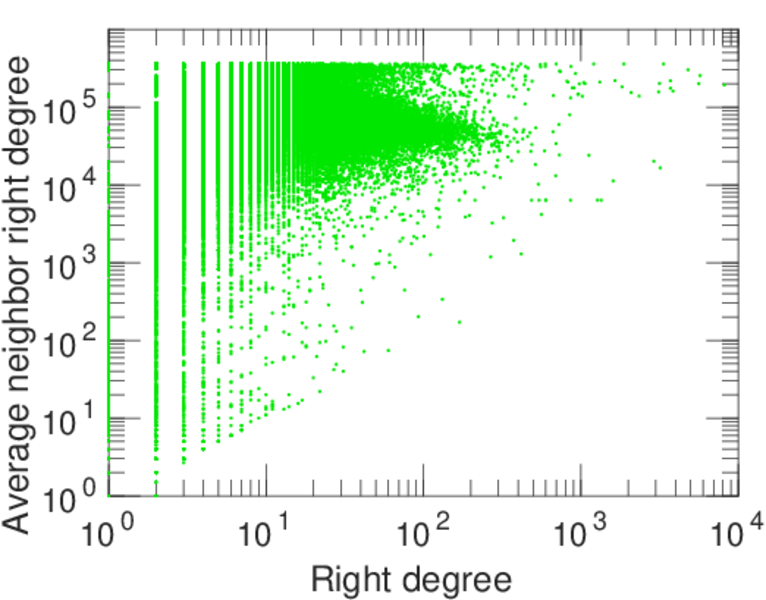
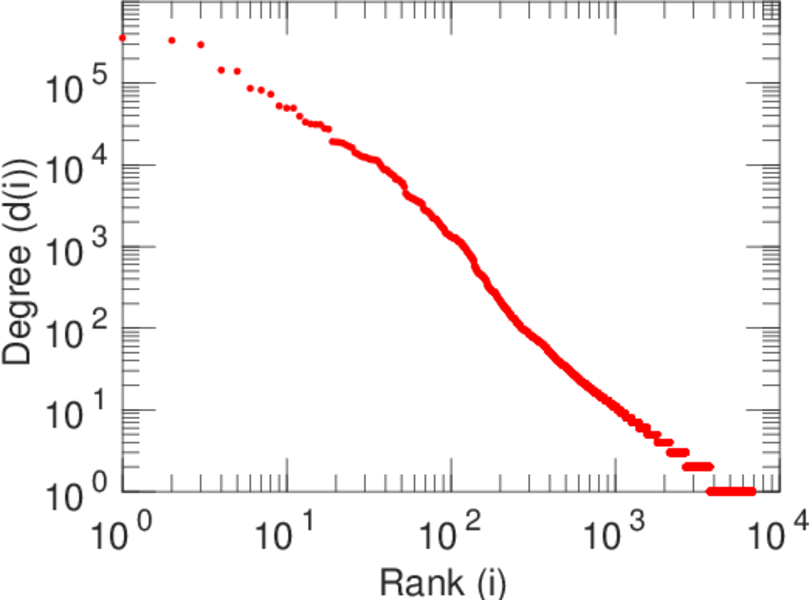
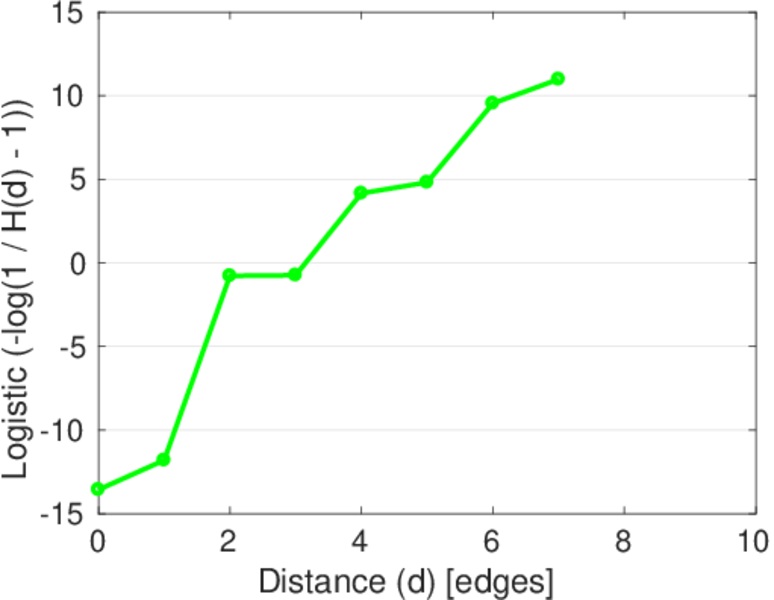
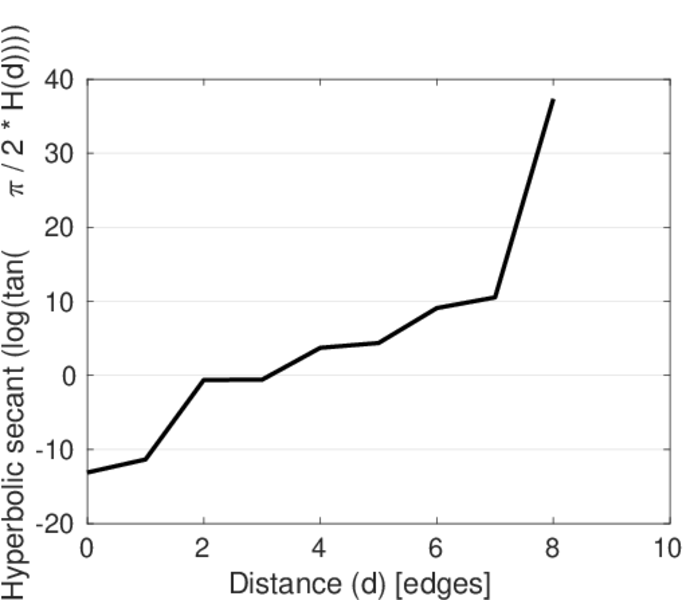
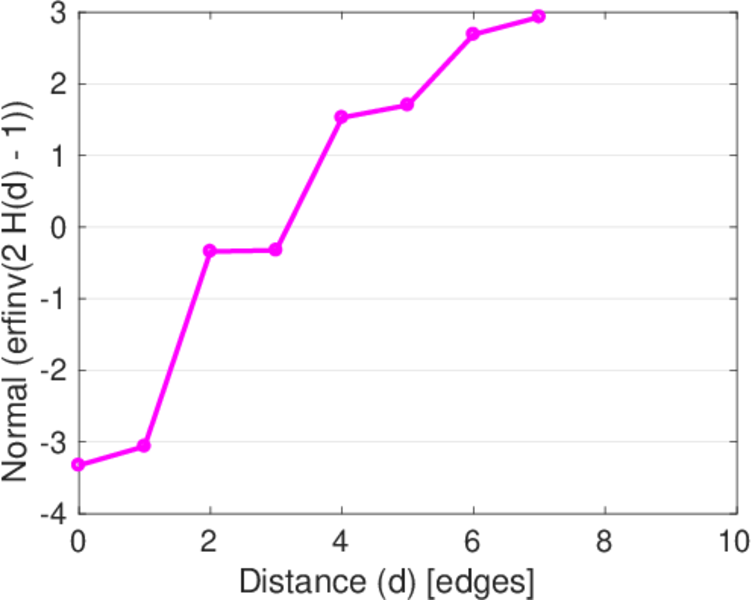
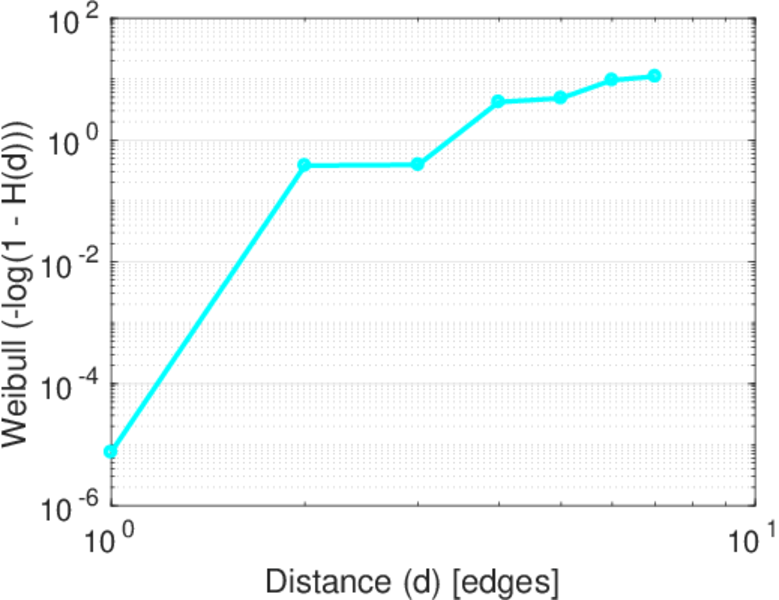
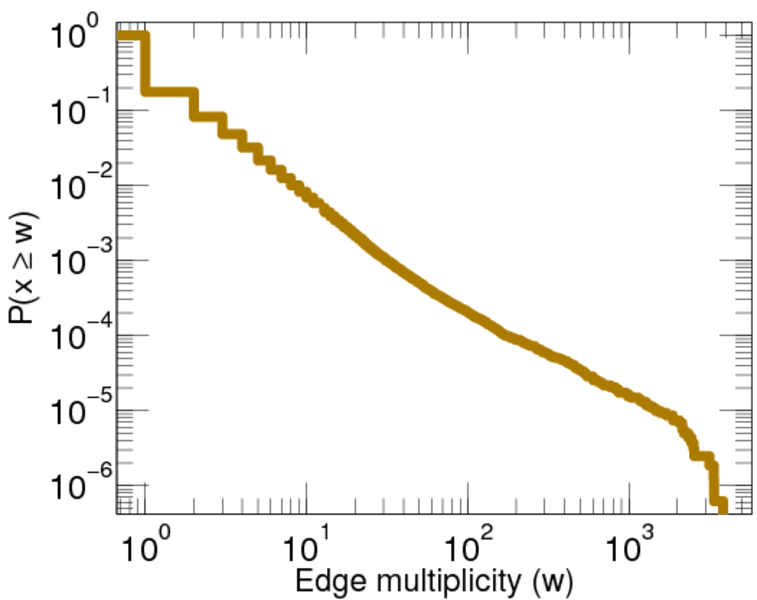
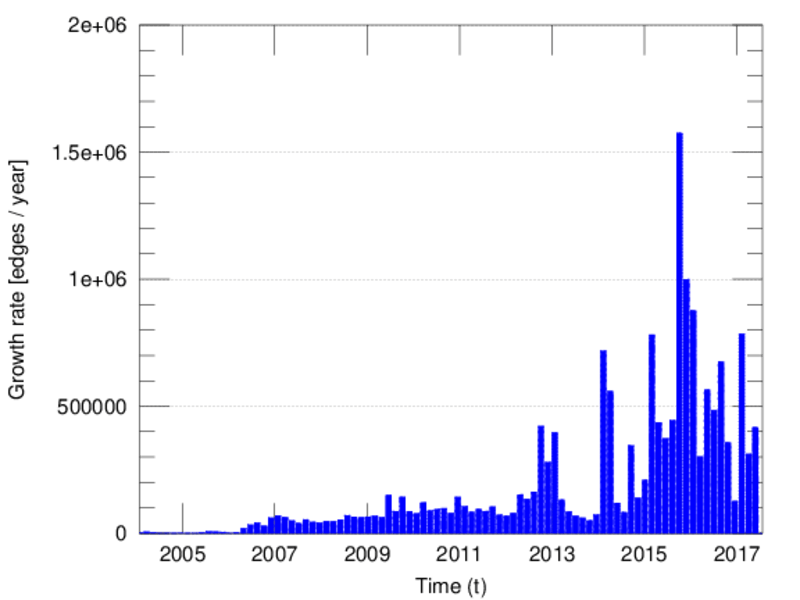
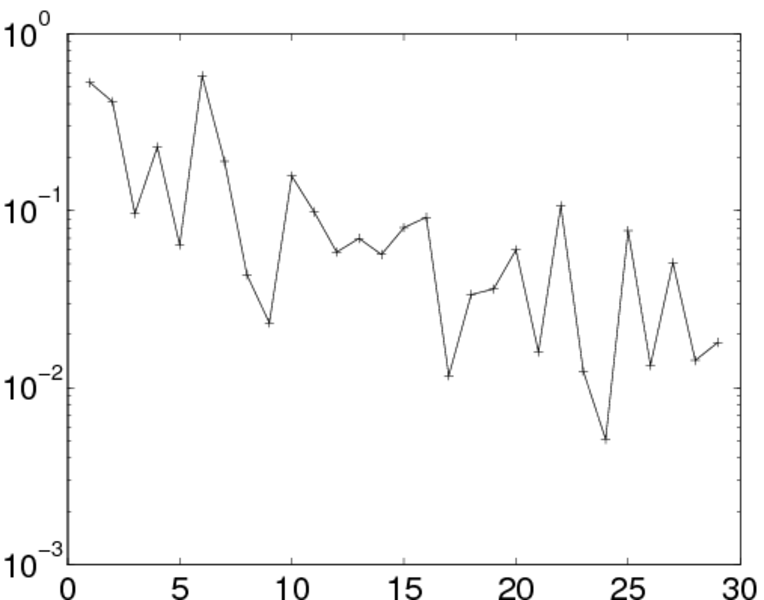
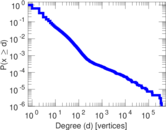
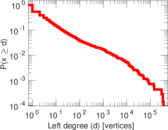
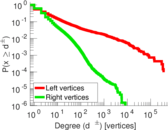
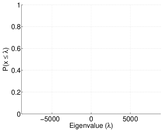
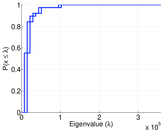
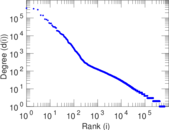
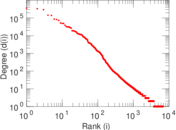
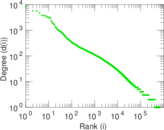
Plots


Matrix decompositions plots

Downloads
References
|
[1]
|
Jérôme Kunegis.
KONECT – The Koblenz Network Collection.
In Proc. Int. Conf. on World Wide Web Companion, pages
1343–1350, 2013.
[ http ]
|
|
[2]
|
Wikimedia Foundation.
Wikimedia downloads.
http://dumps.wikimedia.org/, January 2010.
|
 KONECT ‣ Networks ‣
Buy Me a Coffee
KONECT ‣ Networks ‣
Buy Me a Coffee