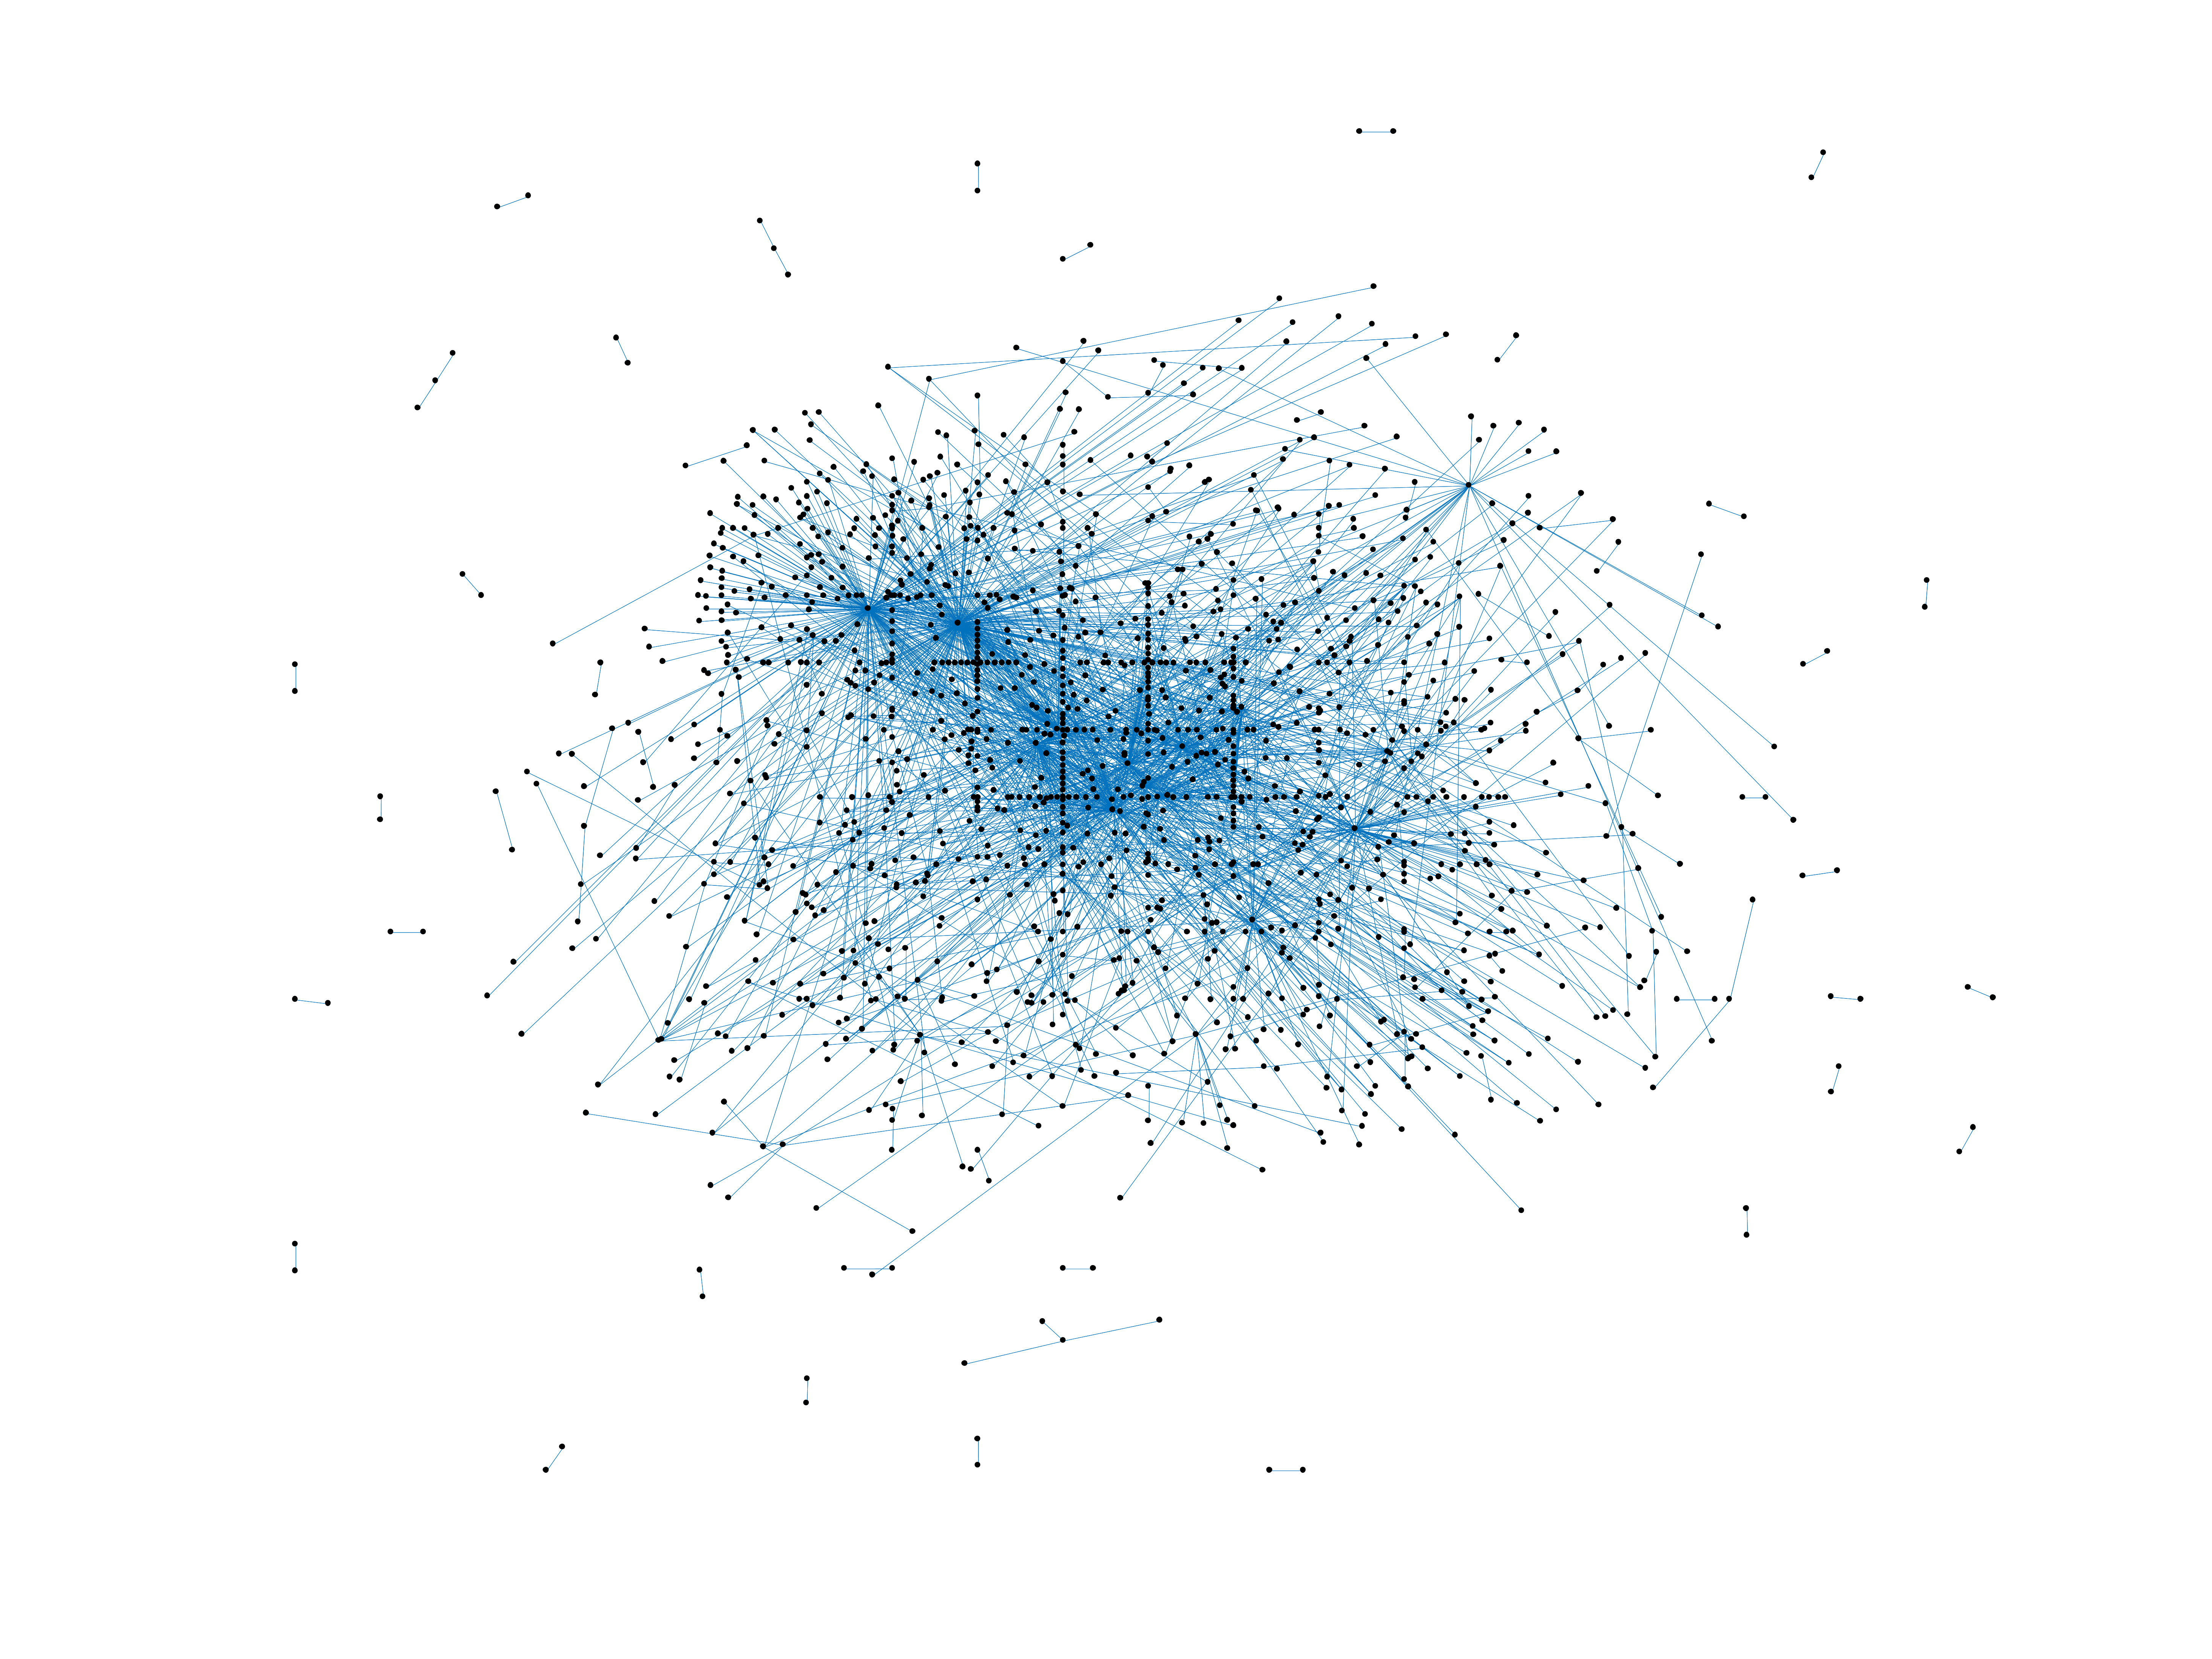
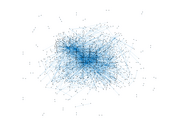
Wikibooks edits (ur)
This is the bipartite edit network of the Urdu Wikibooks. It contains users and
pages from the Urdu Wikibooks, connected by edit events. Each edge represents
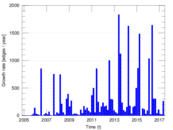
an edit. The dataset includes the timestamp of each edit.
Metadata
Statistics
| Size | n = | 1,584
|
| Left size | n1 = | 243
|
| Right size | n2 = | 1,341
|
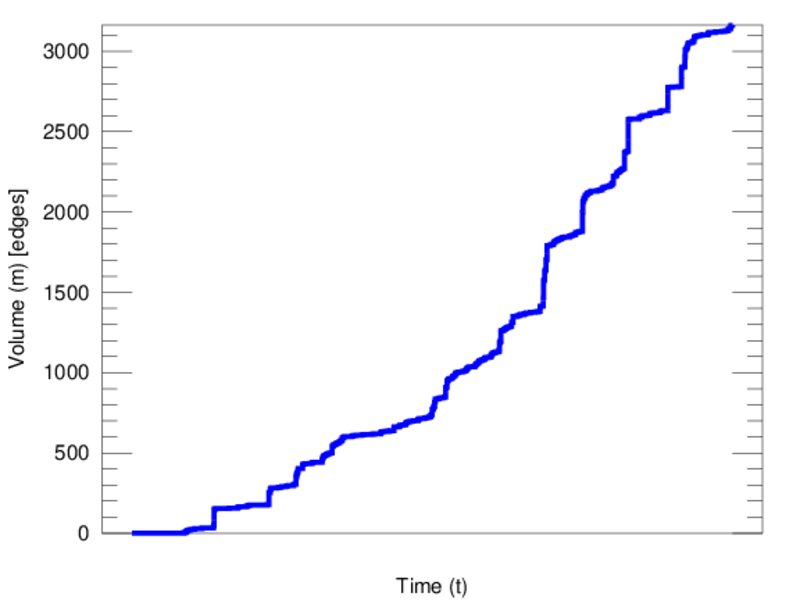
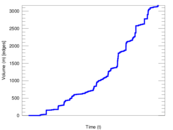
| Volume | m = | 3,164
|
| Unique edge count | m̿ = | 1,748
|
| Wedge count | s = | 69,754
|
| Claw count | z = | 3,441,284
|
| Cross count | x = | 155,116,341
|
| Square count | q = | 9,480
|
| 4-Tour count | T4 = | 358,464
|
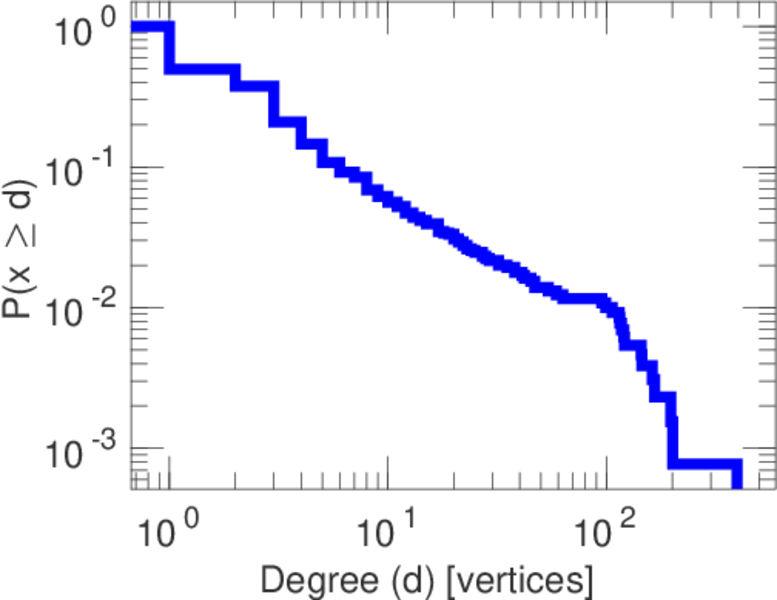
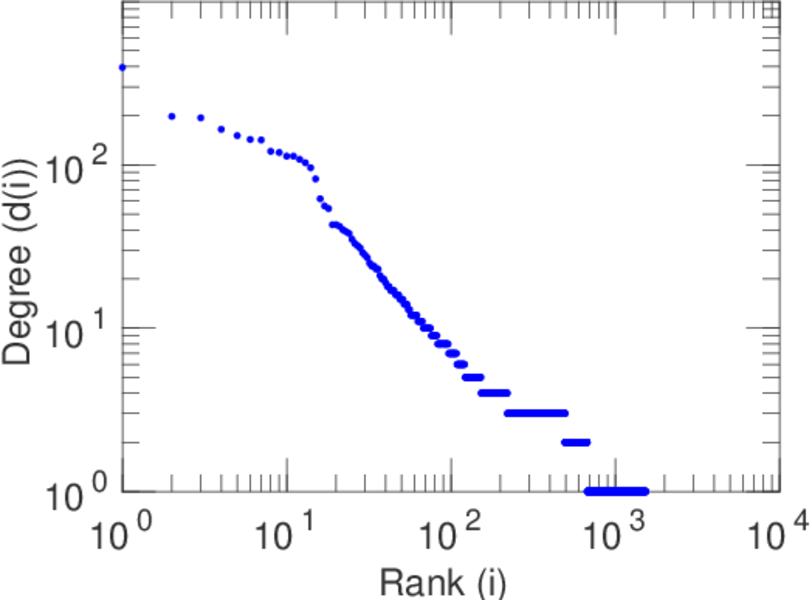
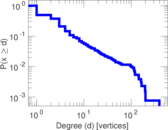
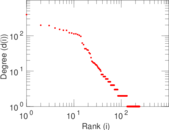
| Maximum degree | dmax = | 395
|
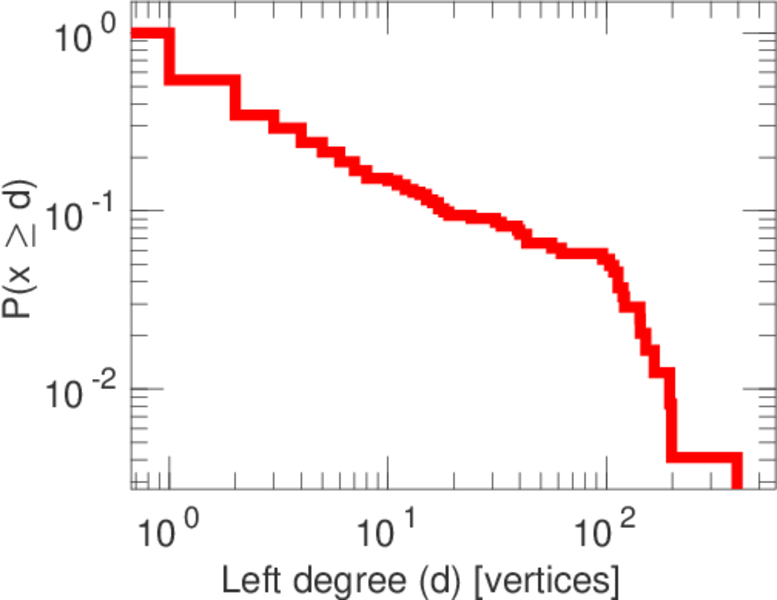
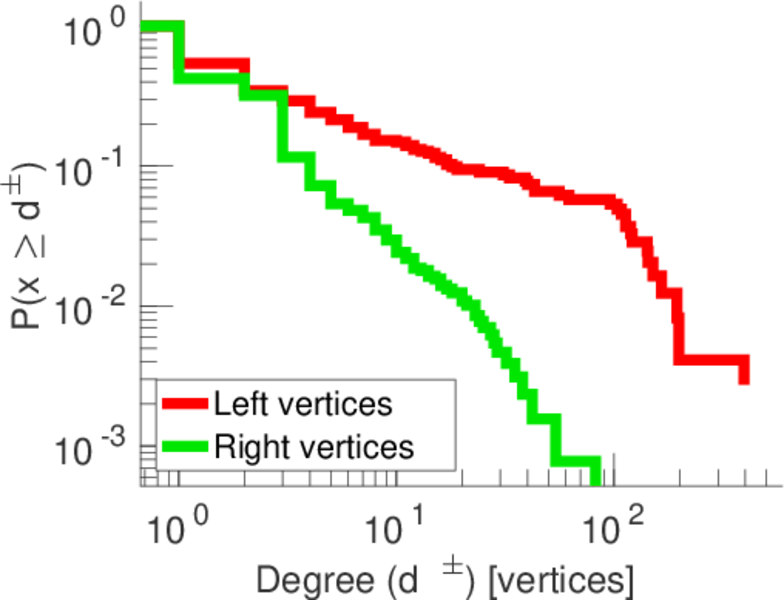
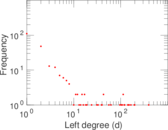
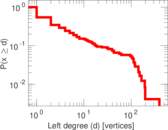
| Maximum left degree | d1max = | 395
|
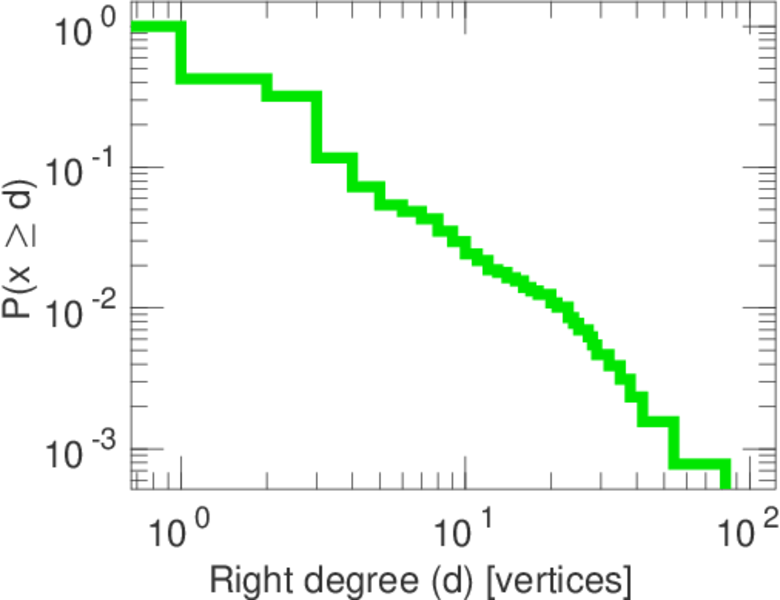
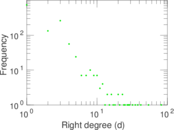
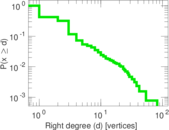
| Maximum right degree | d2max = | 82
|
| Average degree | d = | 3.994 95
|
| Average left degree | d1 = | 13.020 6
|
| Average right degree | d2 = | 2.359 43
|
| Fill | p = | 0.005 364 22
|
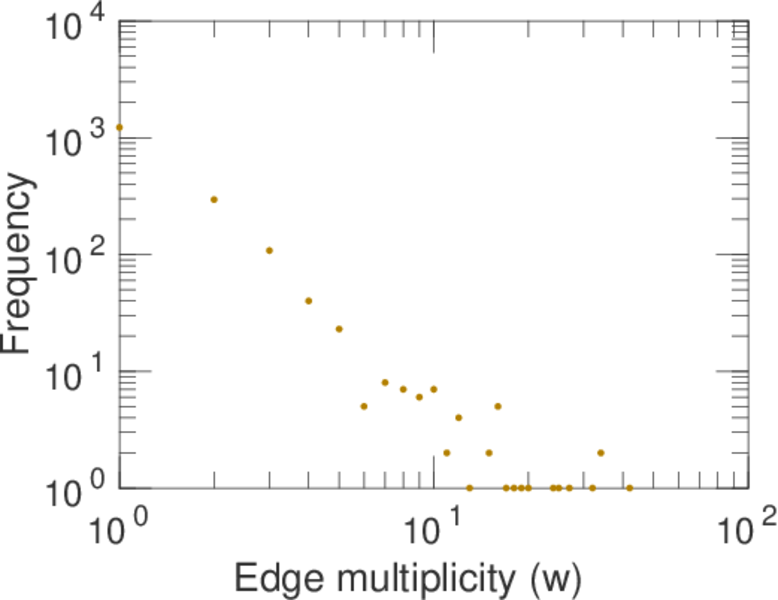
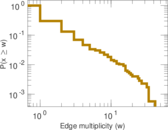
| Average edge multiplicity | m̃ = | 1.810 07
|
| Size of LCC | N = | 1,205
|
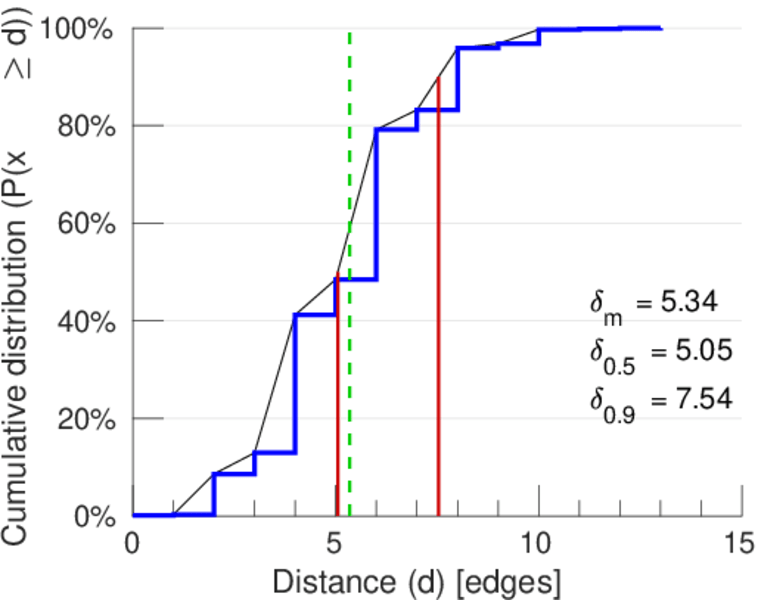
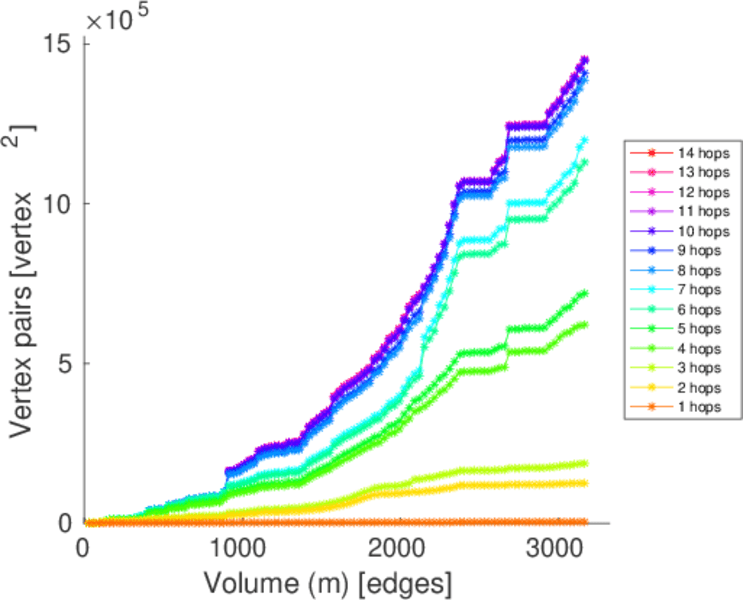
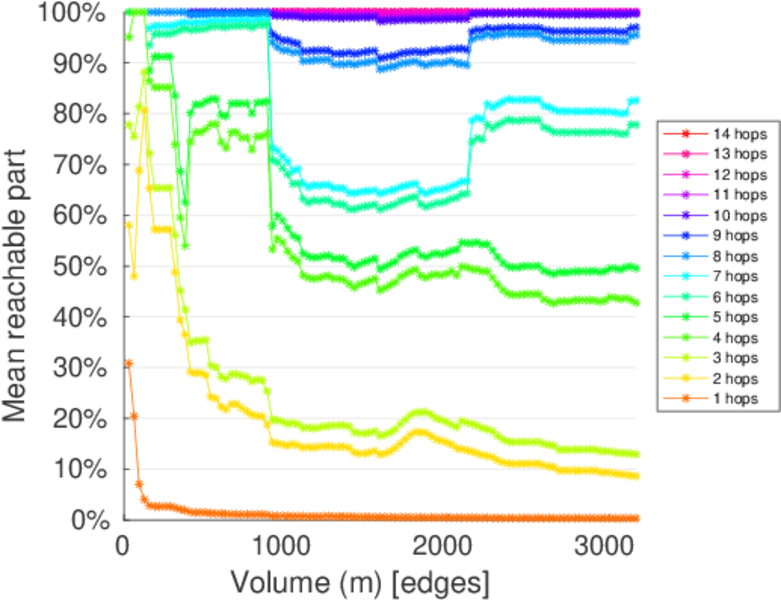
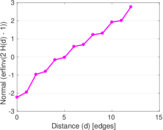
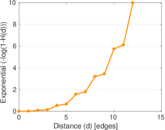
| Diameter | δ = | 13
|
| 50-Percentile effective diameter | δ0.5 = | 5.049 62
|
| 90-Percentile effective diameter | δ0.9 = | 7.535 41
|
| Median distance | δM = | 6
|
| Mean distance | δm = | 5.339 31
|
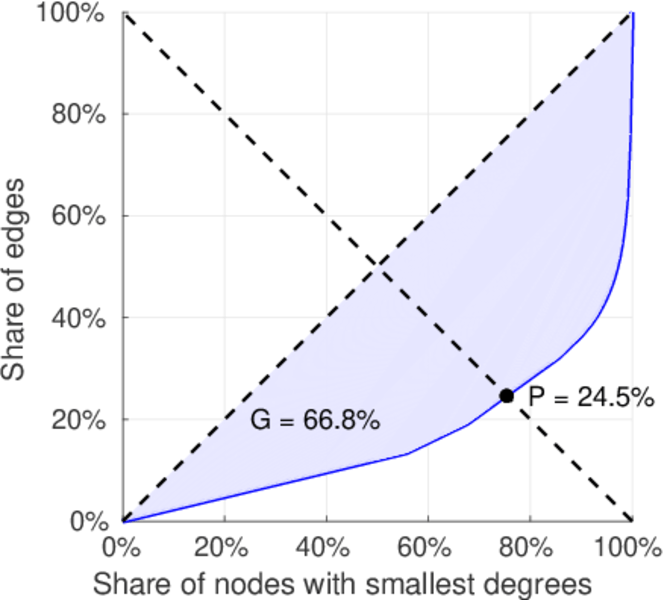
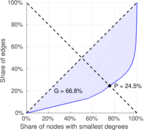
| Gini coefficient | G = | 0.687 233
|
| Balanced inequality ratio | P = | 0.234 987
|
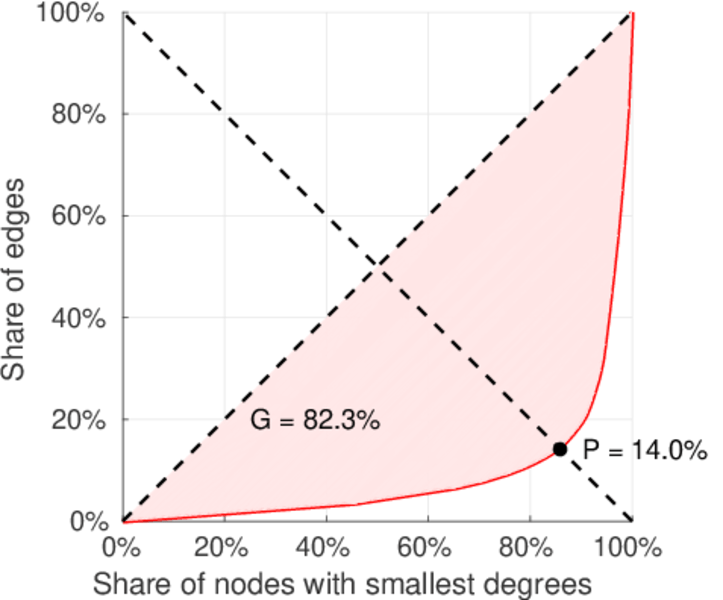
| Left balanced inequality ratio | P1 = | 0.139 697
|
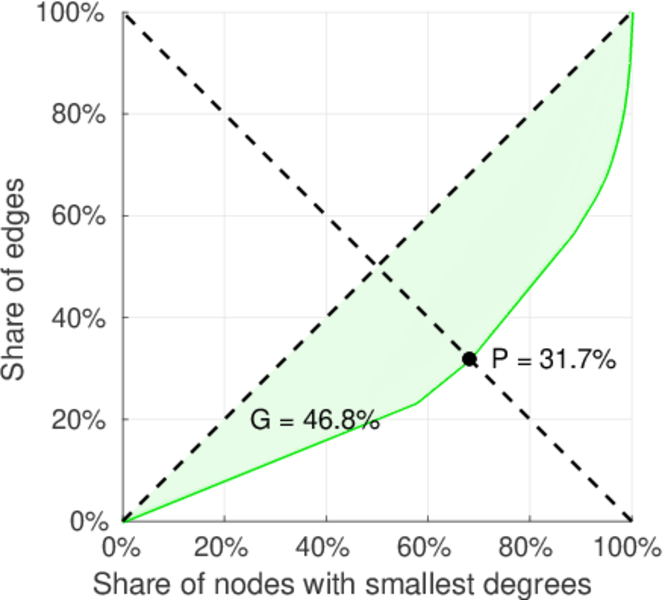
| Right balanced inequality ratio | P2 = | 0.317 320
|
| Relative edge distribution entropy | Her = | 0.841 210
|
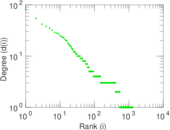
| Power law exponent | γ = | 4.443 44
|
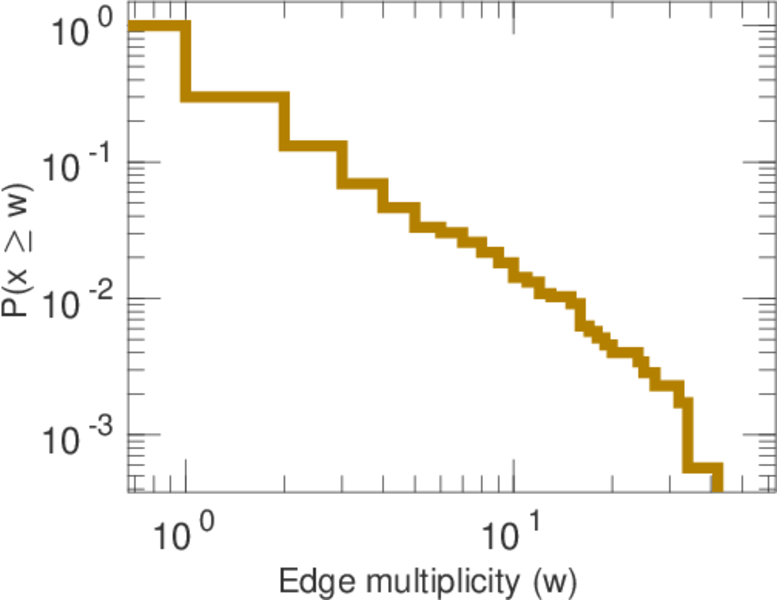
| Tail power law exponent | γt = | 2.491 00
|
| Tail power law exponent with p | γ3 = | 2.491 00
|
| p-value | p = | 0.000 00
|
| Left tail power law exponent with p | γ3,1 = | 1.841 00
|
| Left p-value | p1 = | 0.270 000
|
| Right tail power law exponent with p | γ3,2 = | 4.291 00
|
| Right p-value | p2 = | 0.073 000 0
|
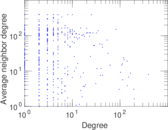
| Degree assortativity | ρ = | −0.161 293
|
| Degree assortativity p-value | pρ = | 1.175 78 × 10−11
|
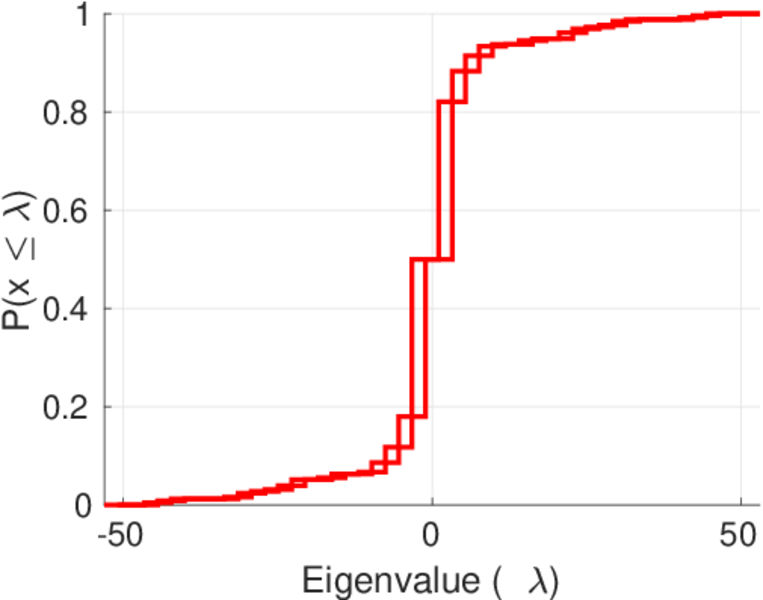
| Spectral norm | α = | 53.094 5
|
| Algebraic connectivity | a = | 0.011 646 9
|
| Spectral separation | |λ1[A] / λ2[A]| = | 1.145 06
|
| Controllability | C = | 1,094
|
| Relative controllability | Cr = | 0.716 907
|
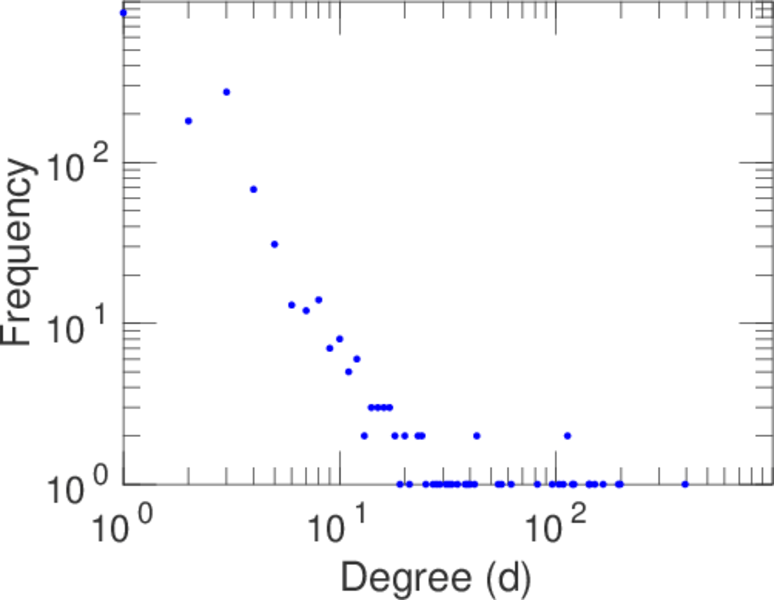
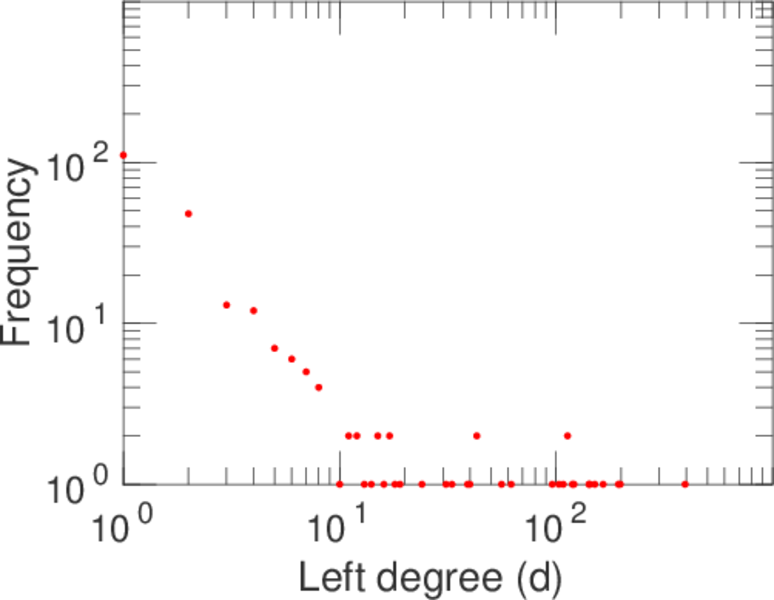
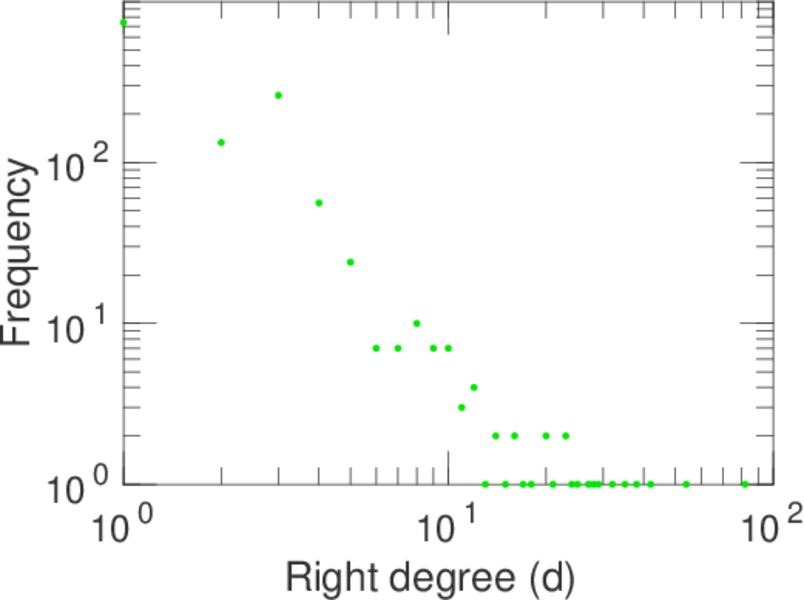
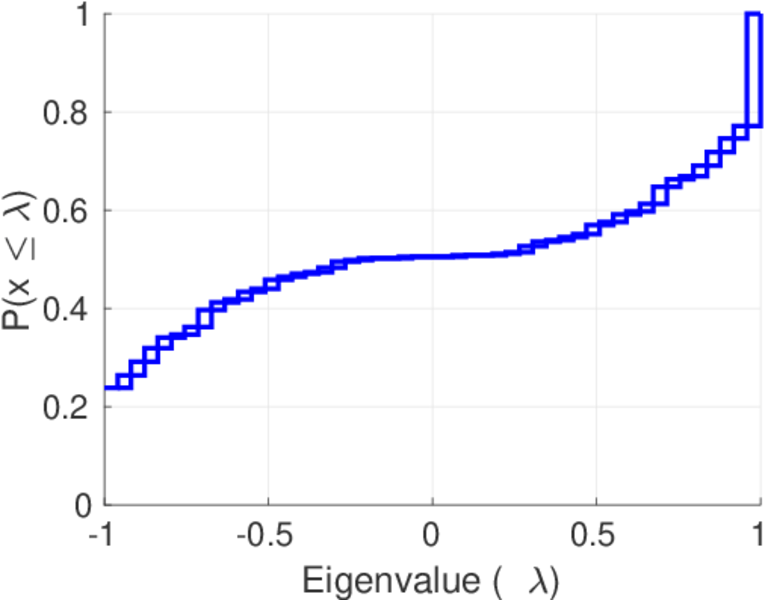
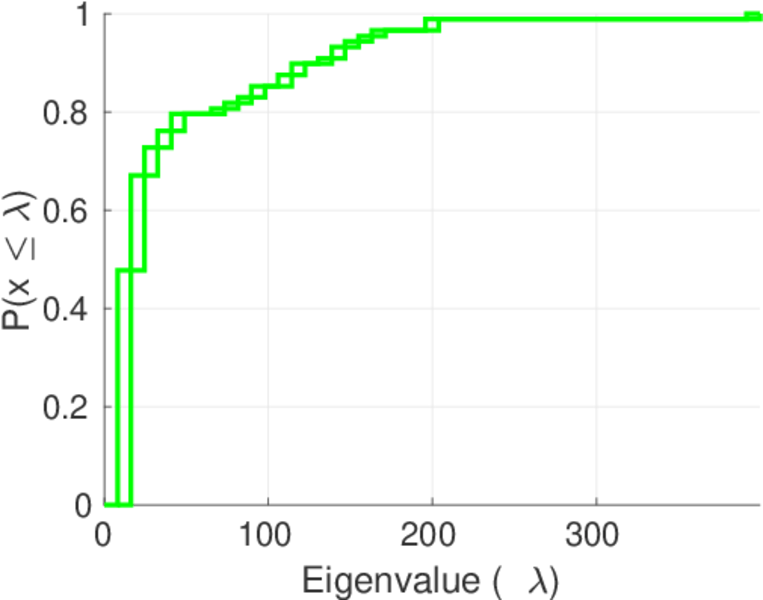
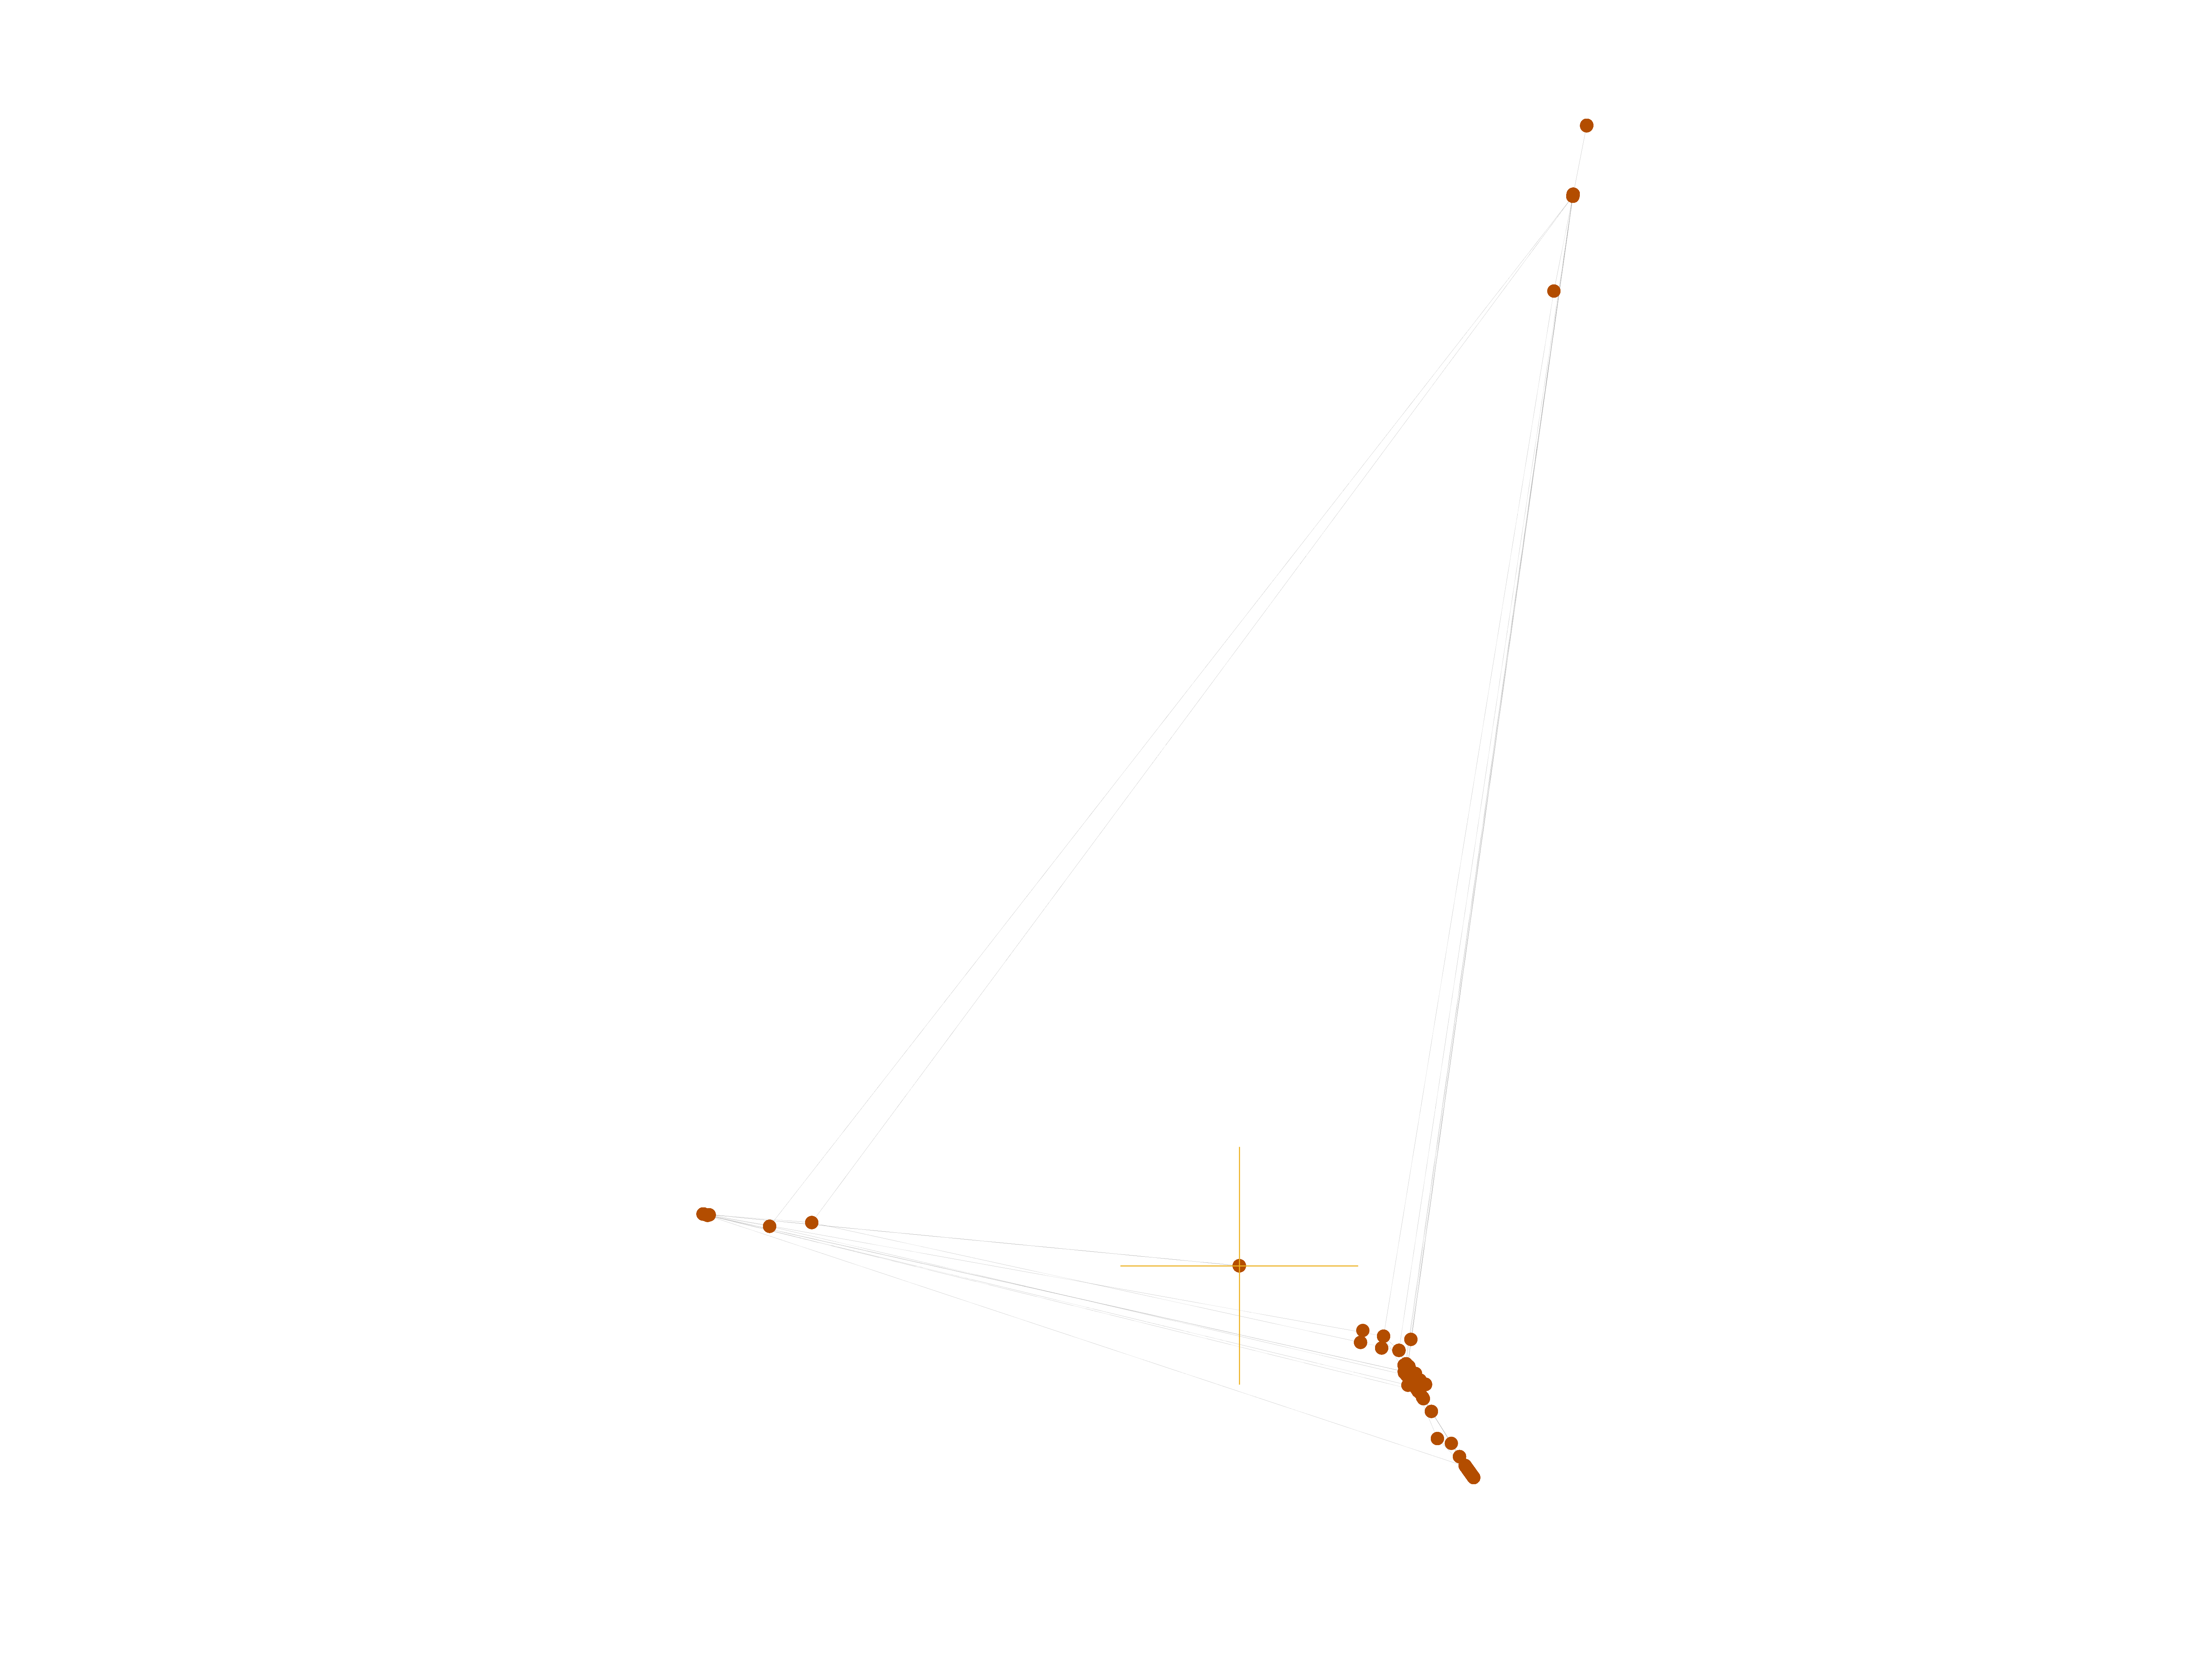
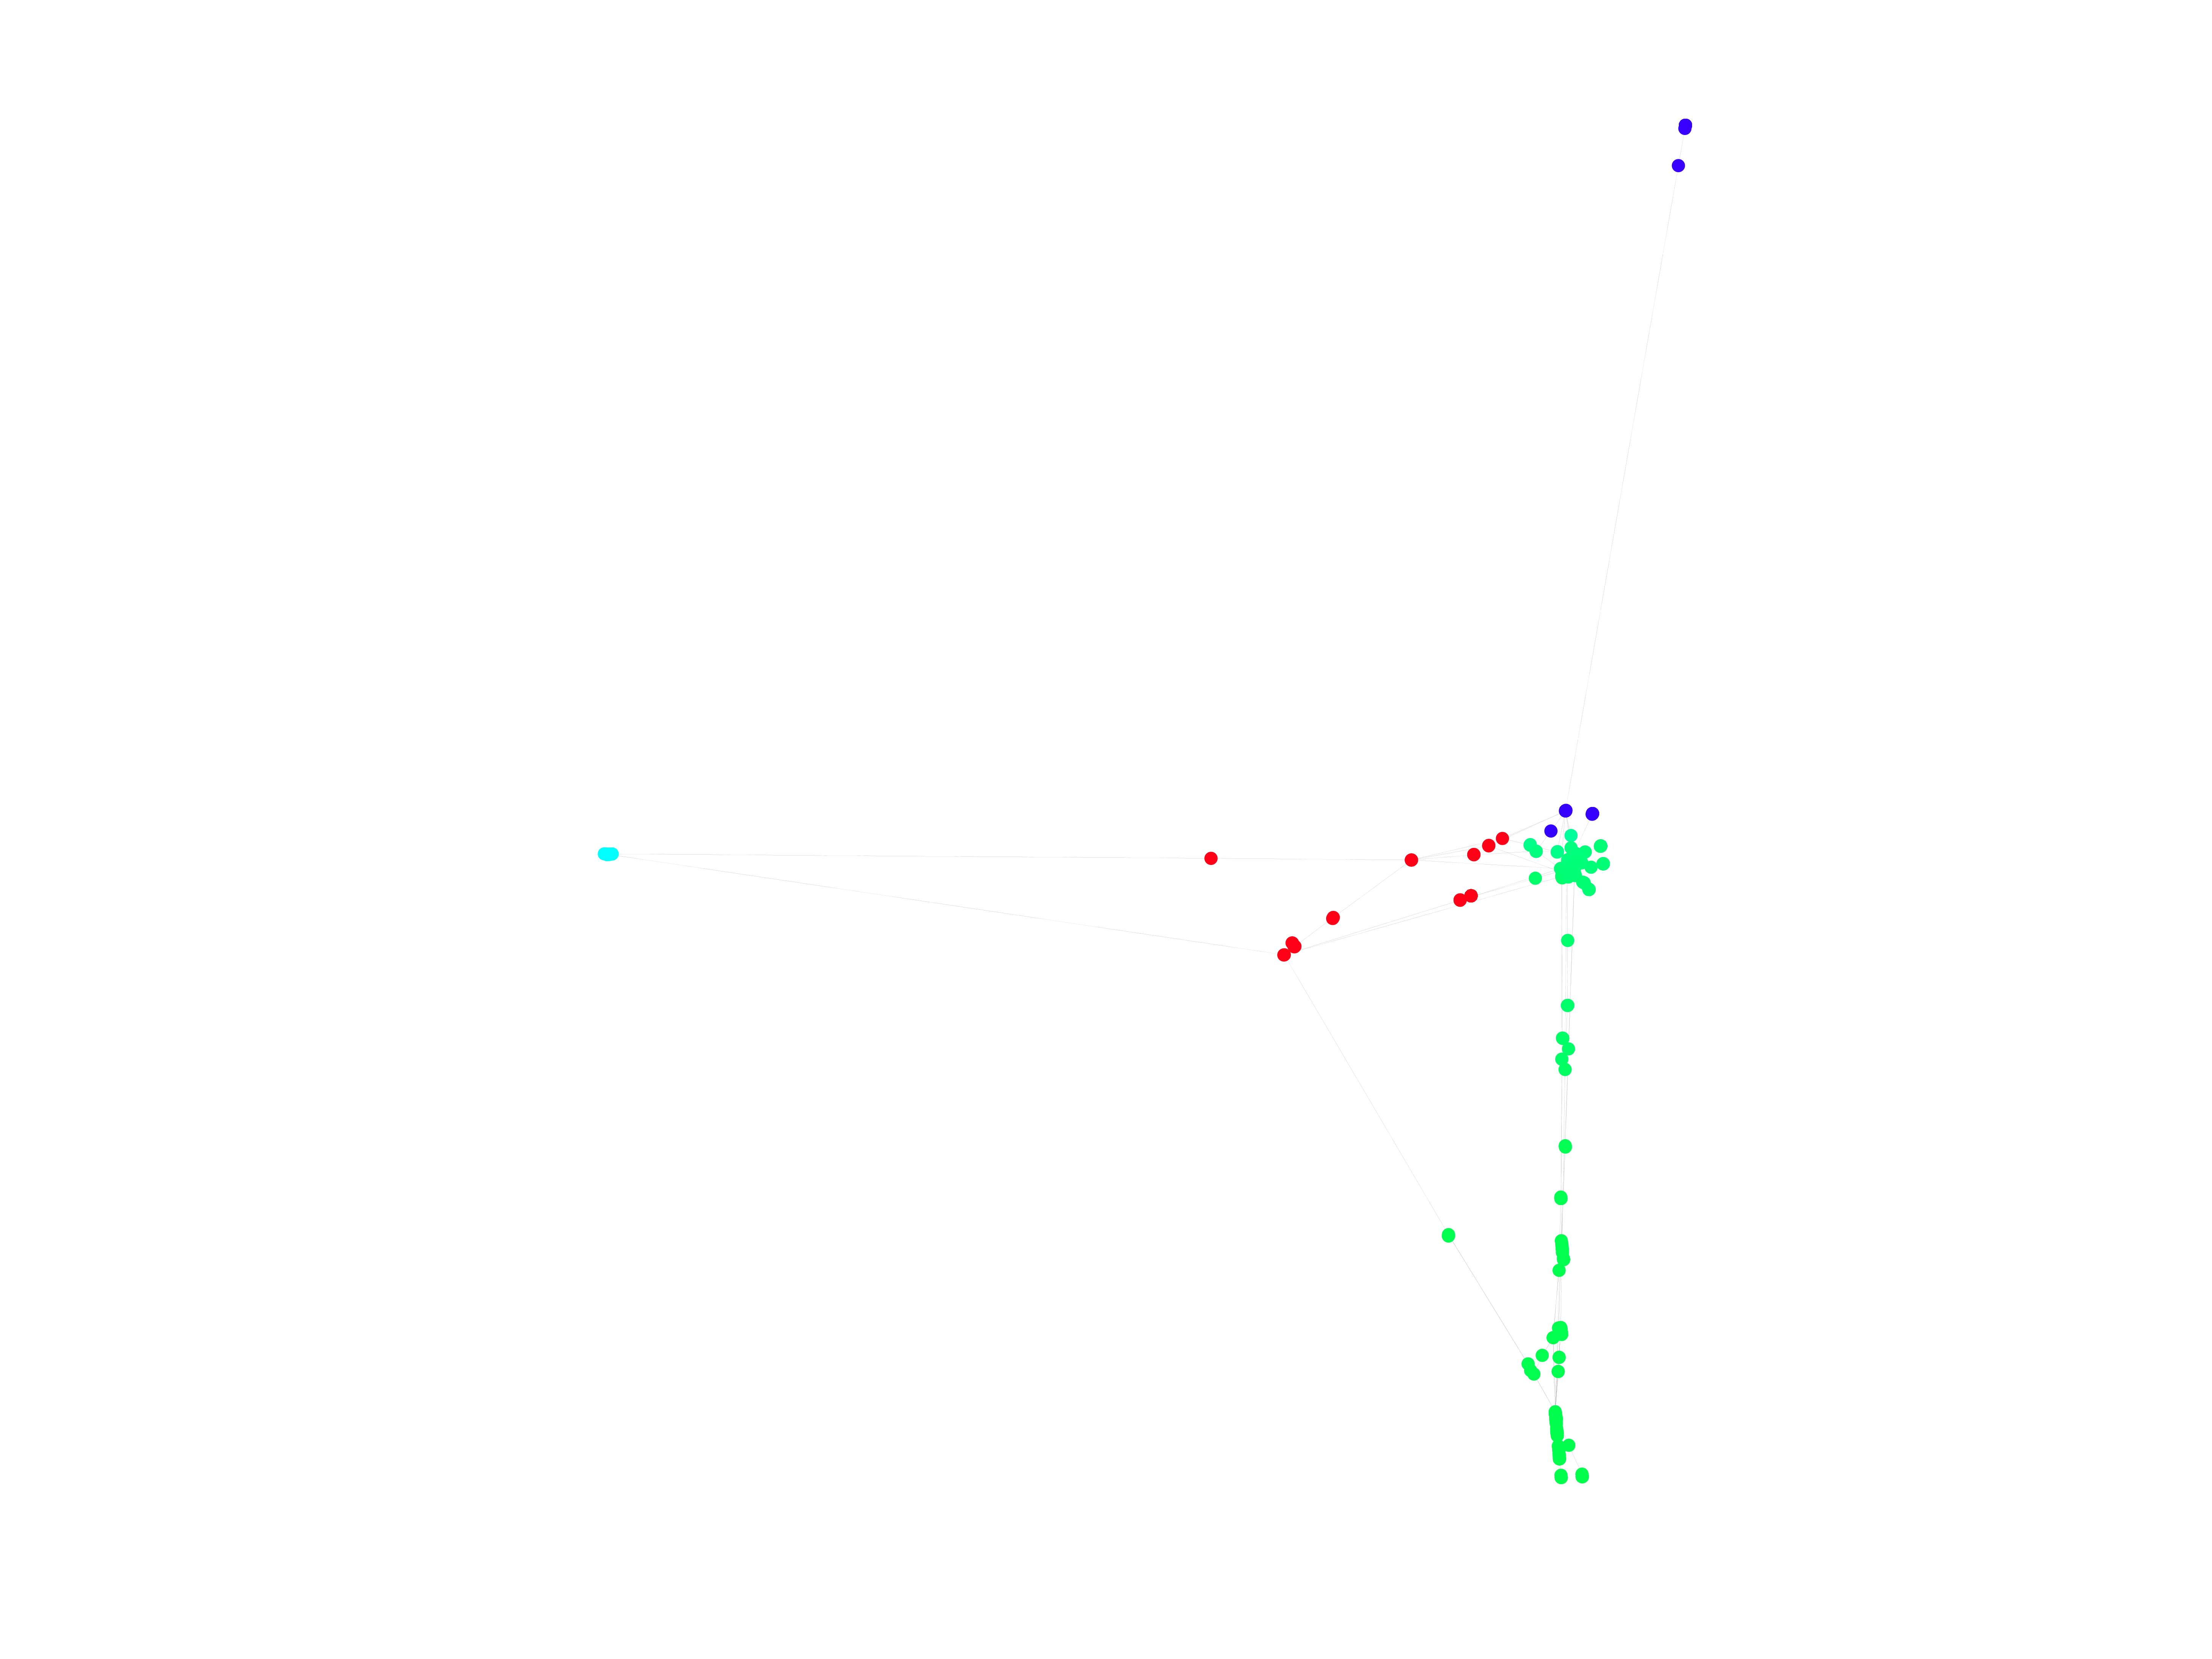
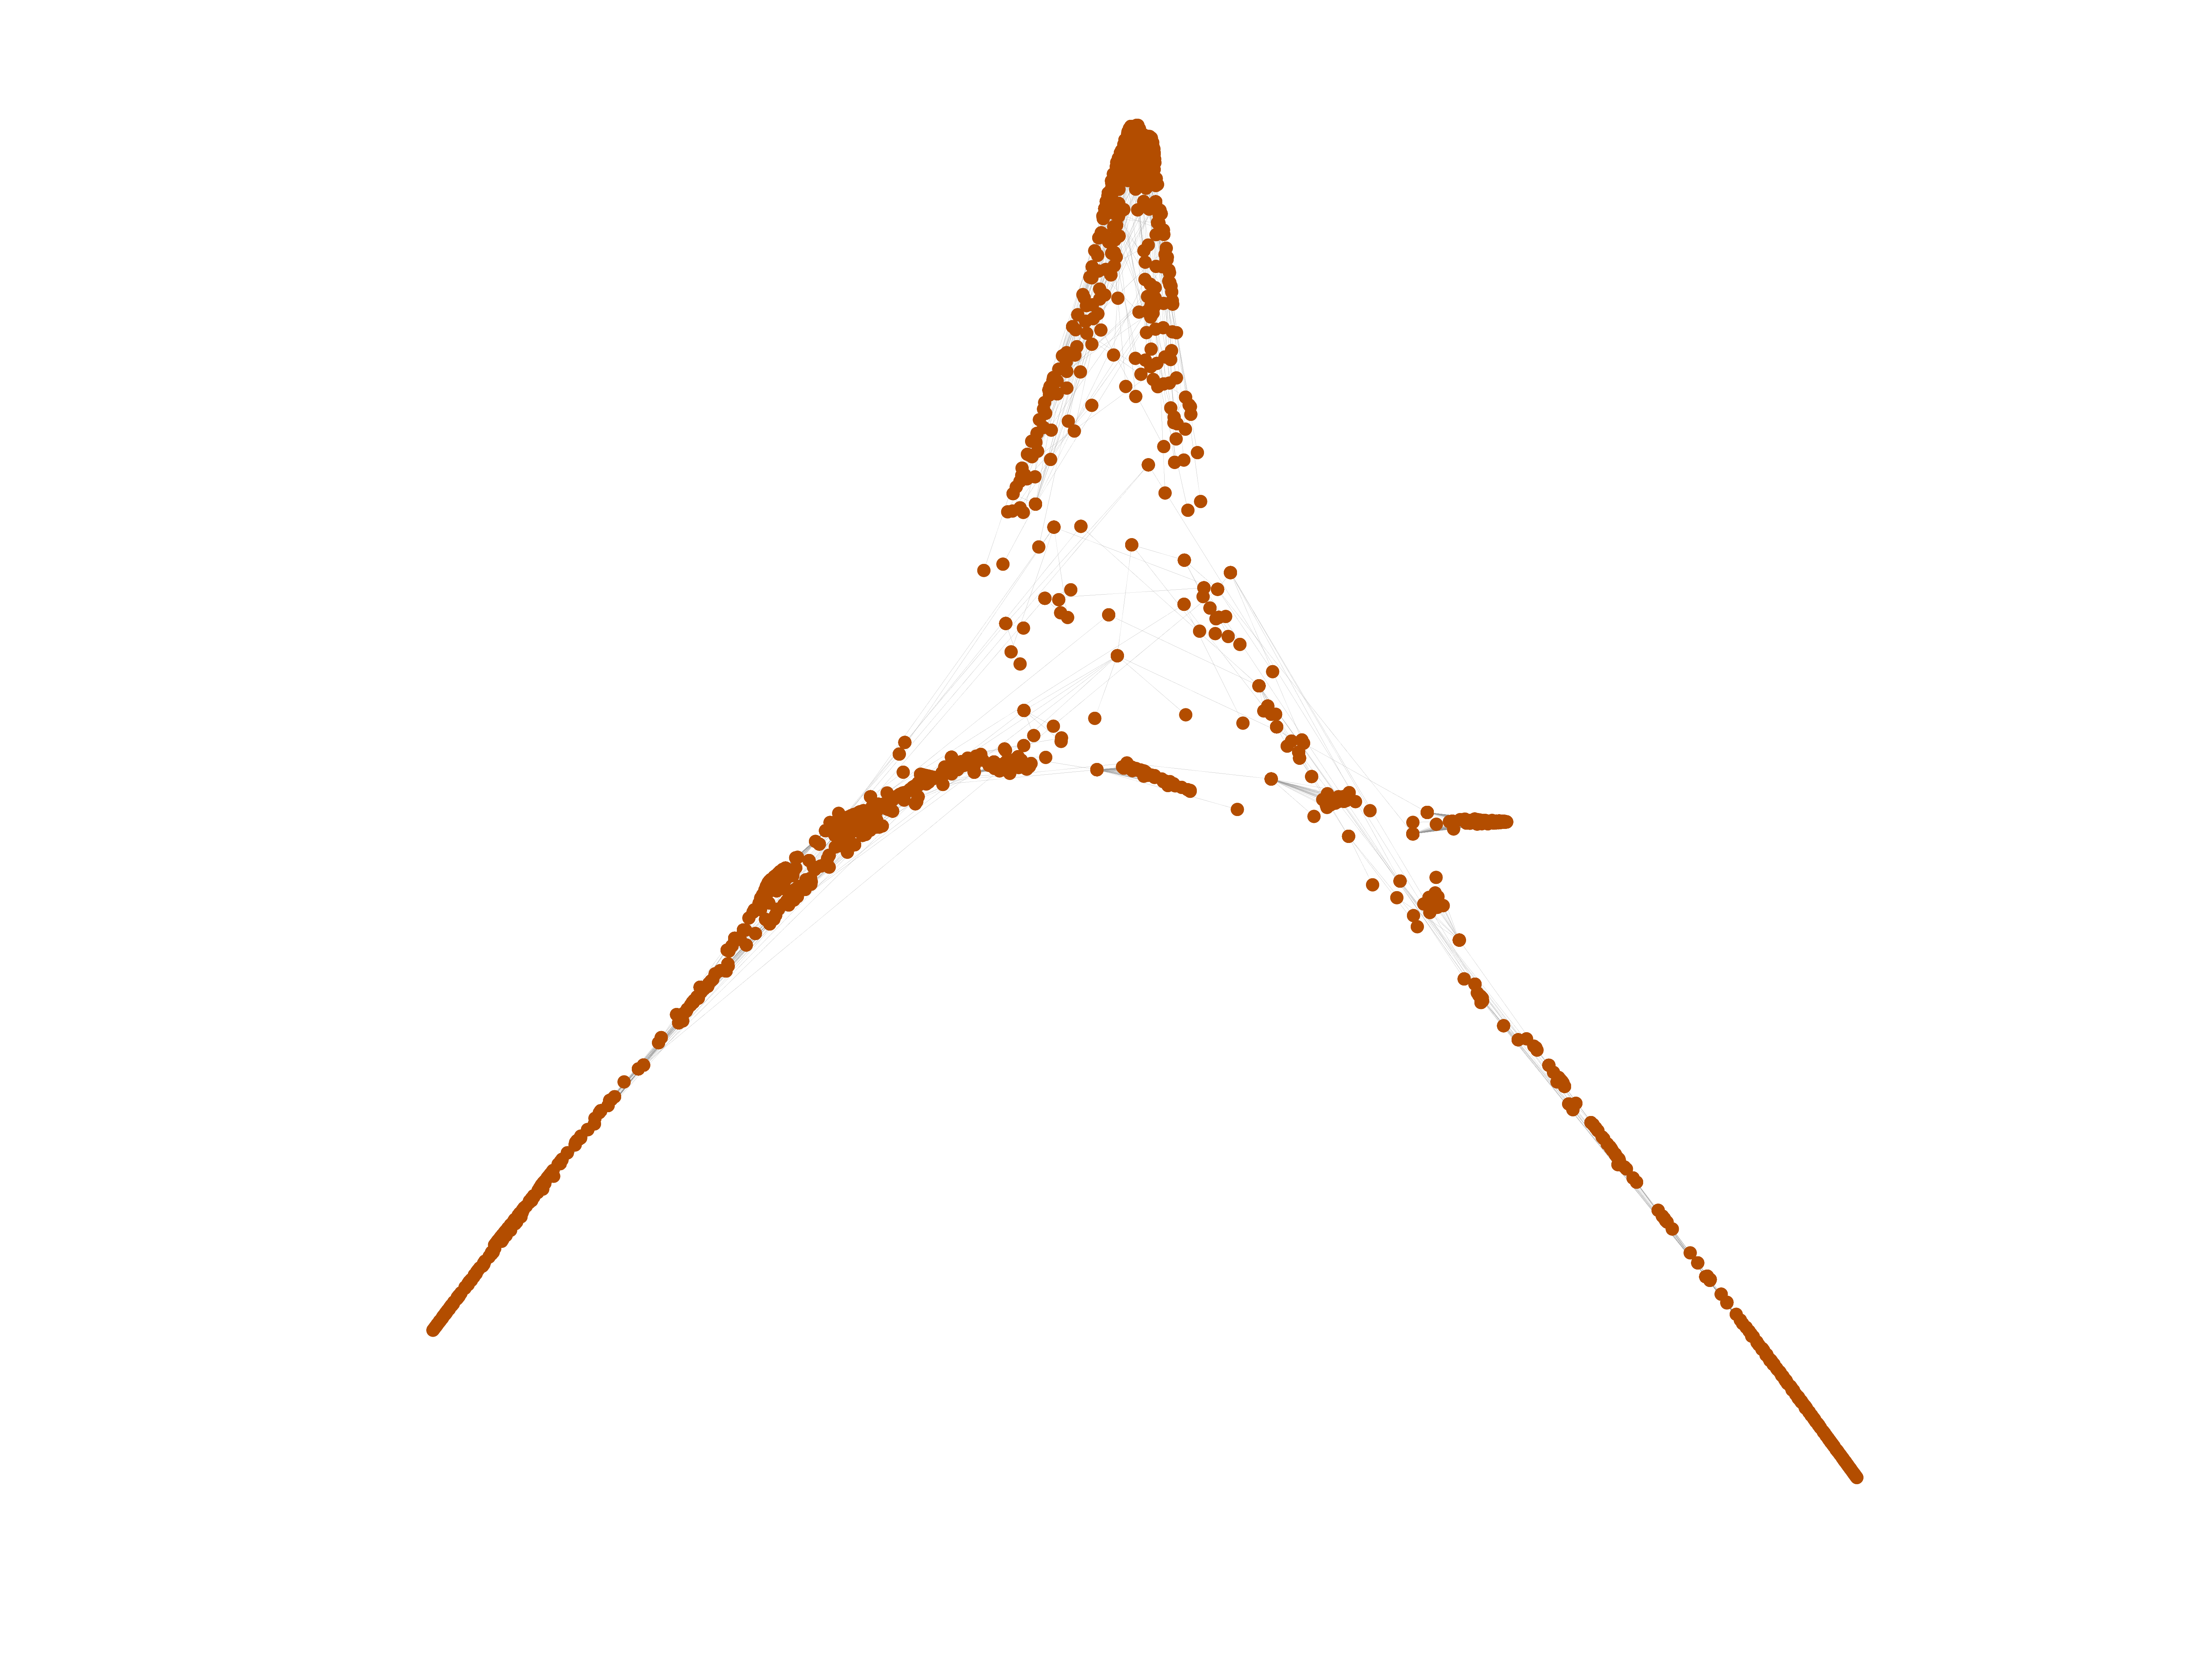
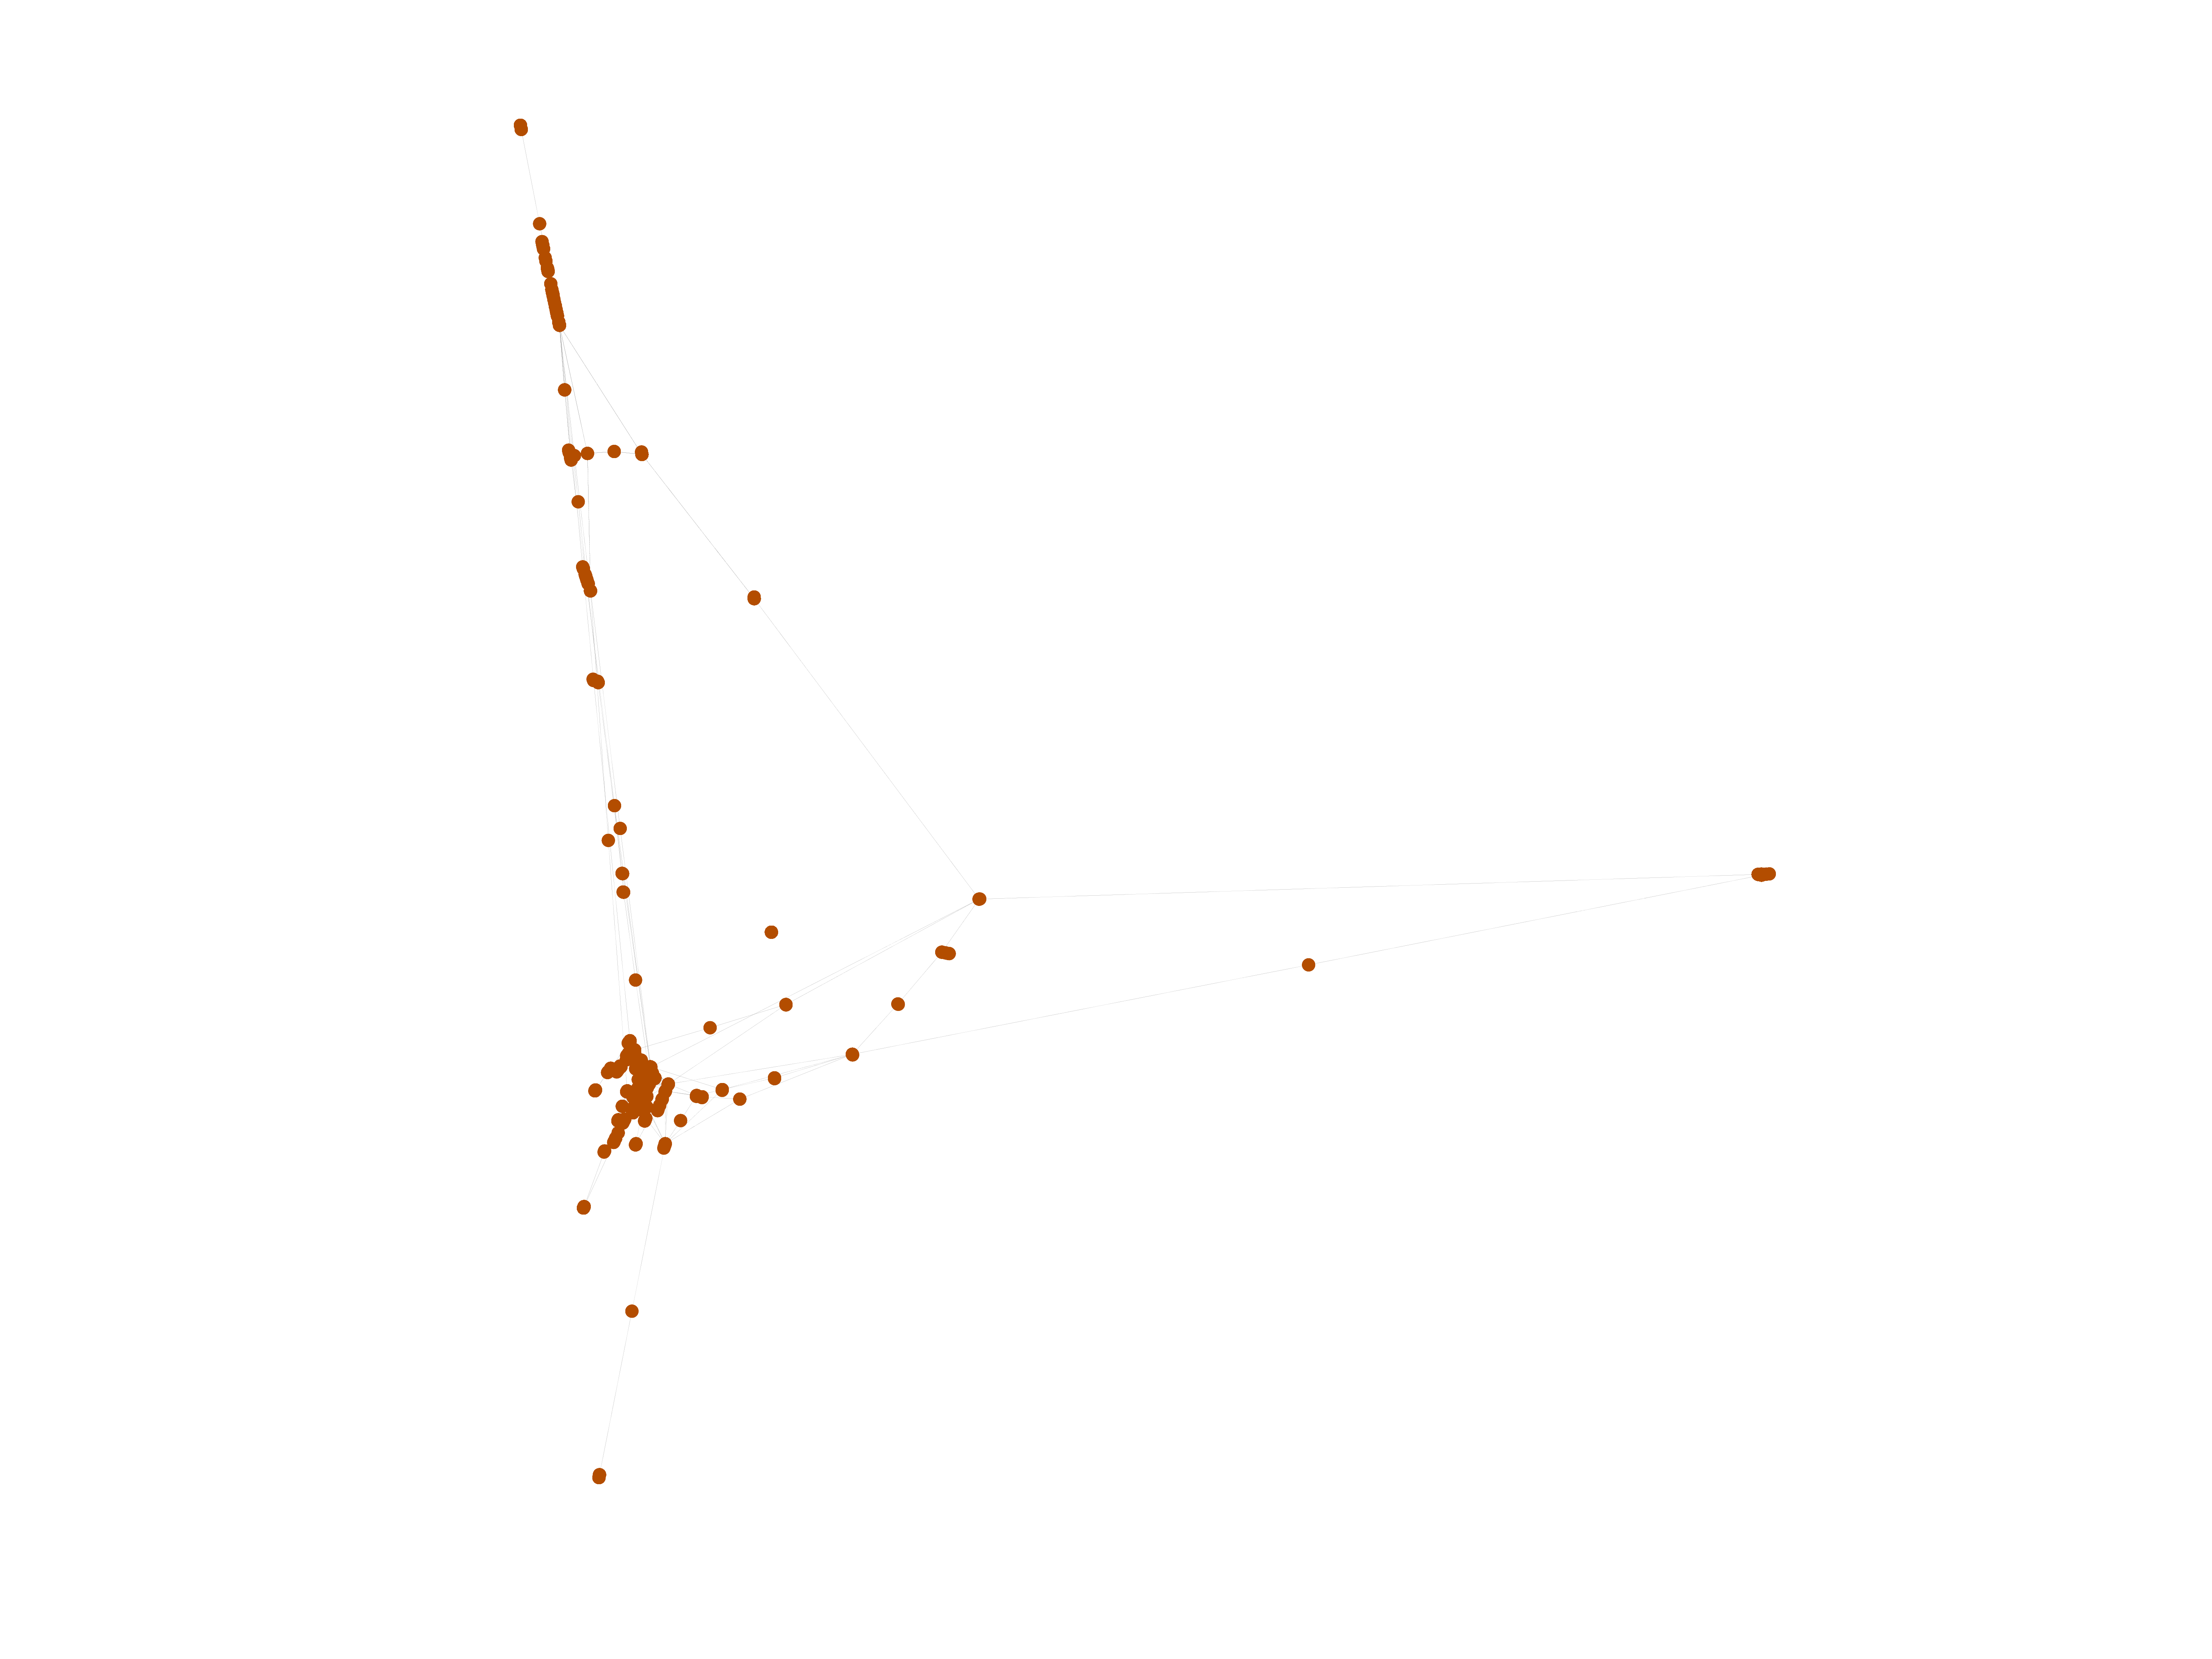
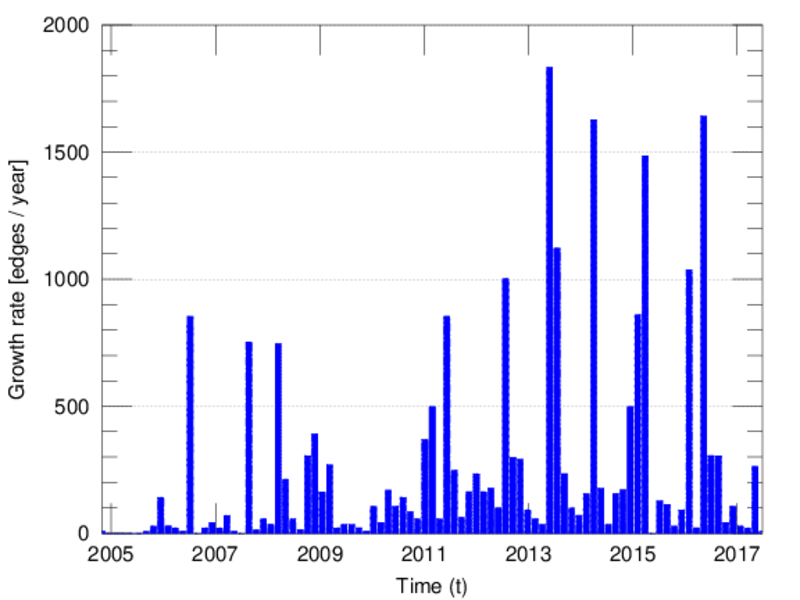
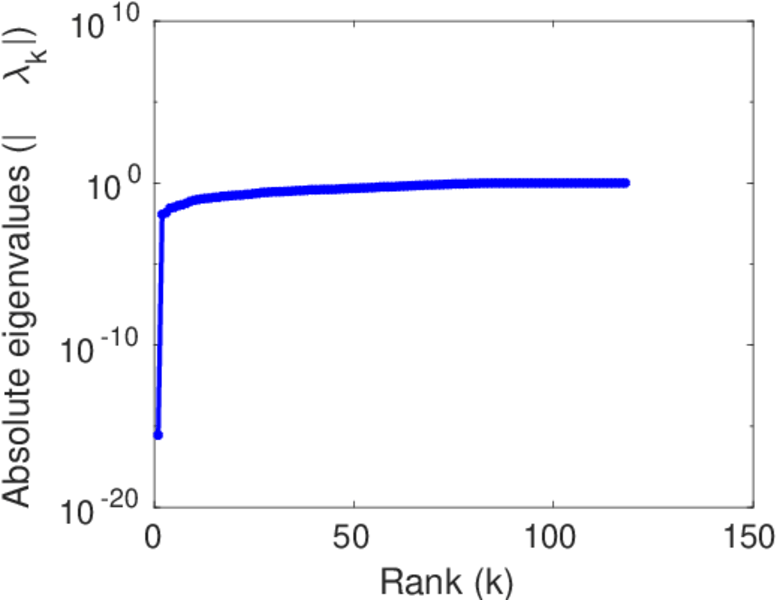
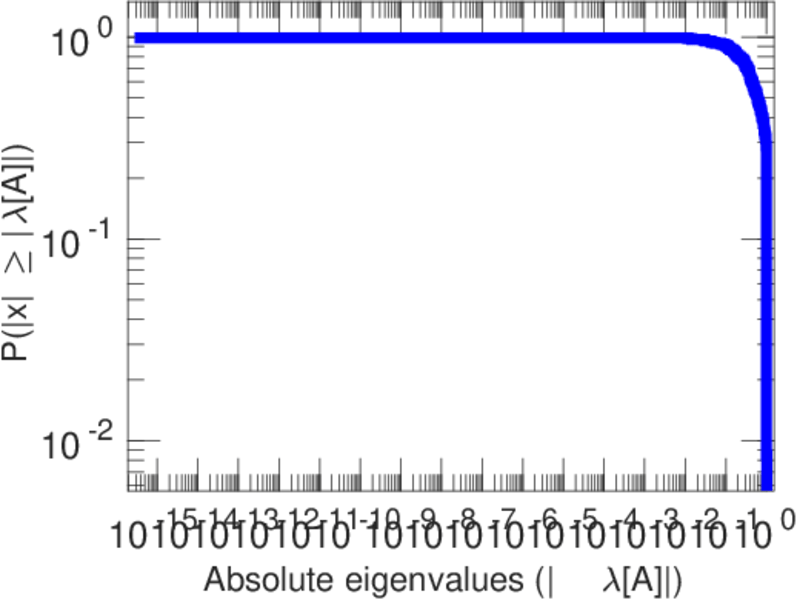
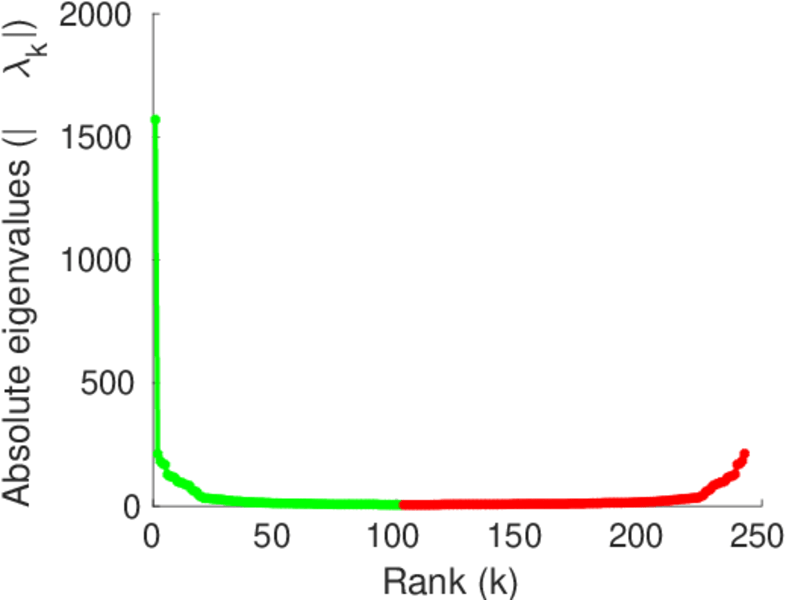
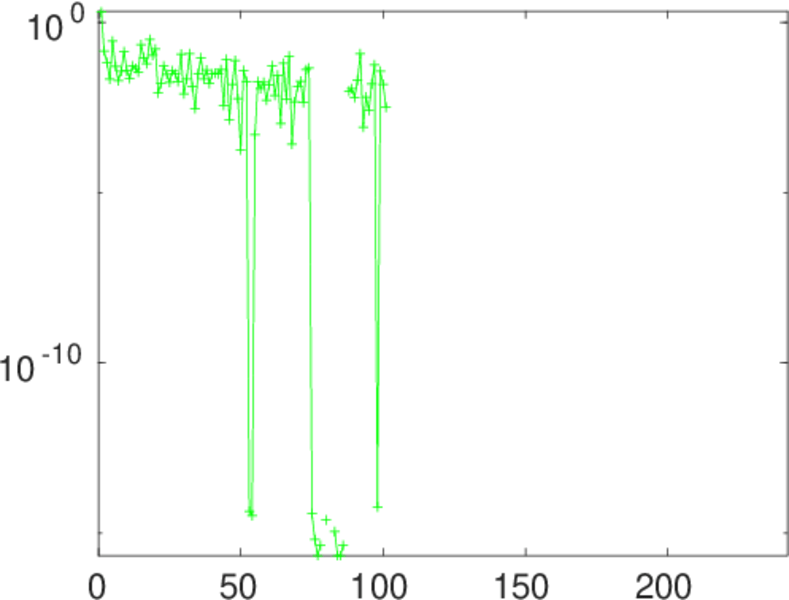
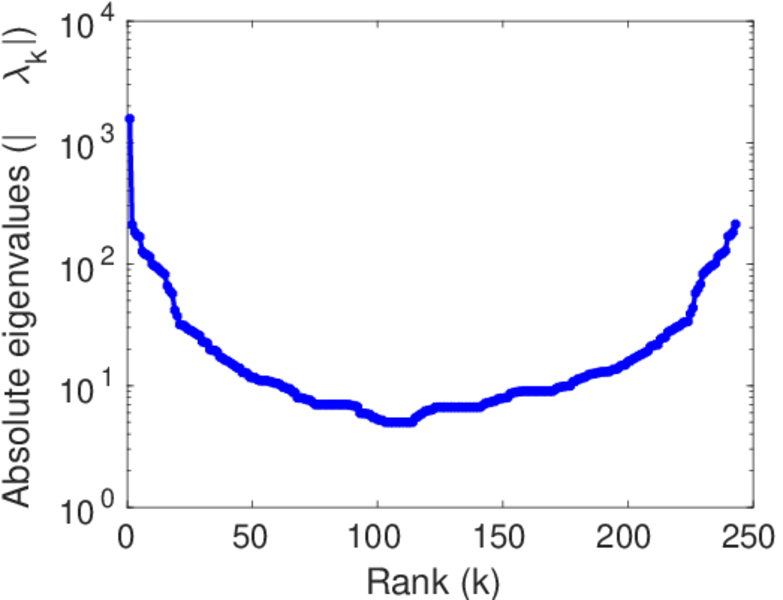
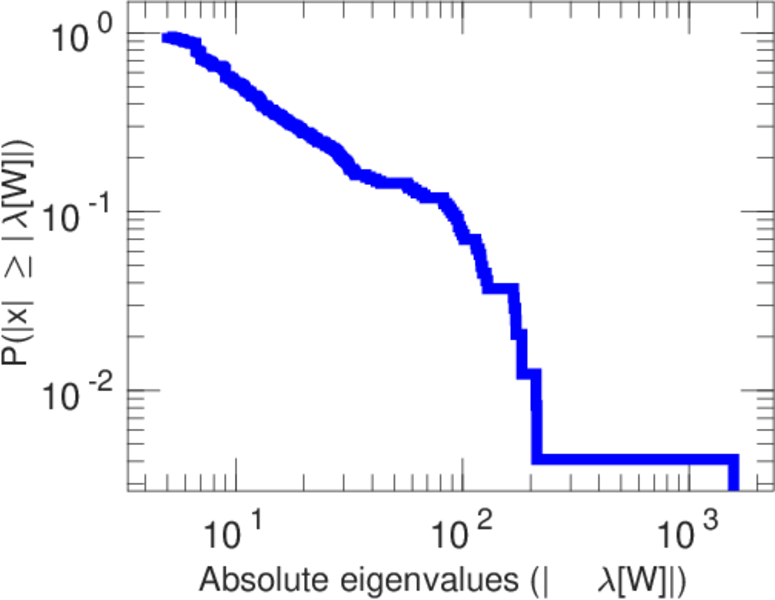
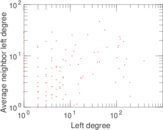
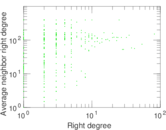
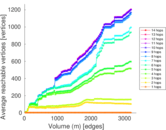
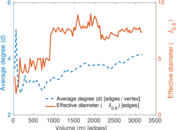
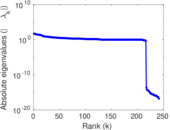
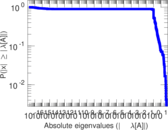
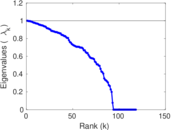
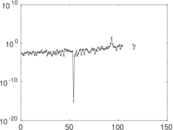
Plots


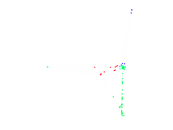

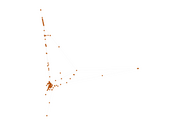


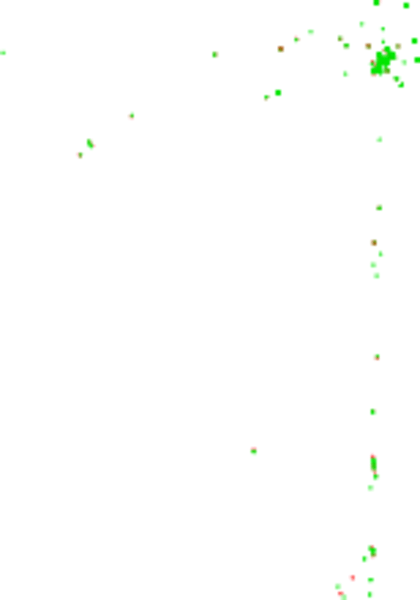
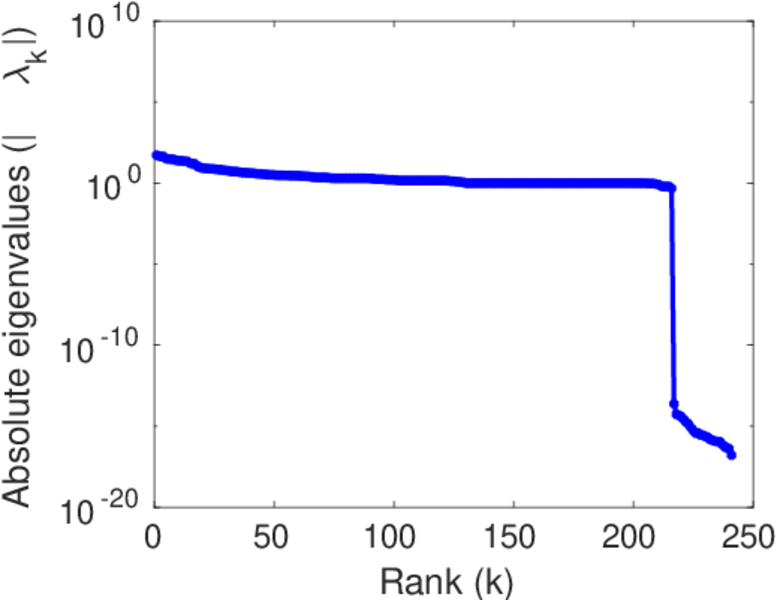
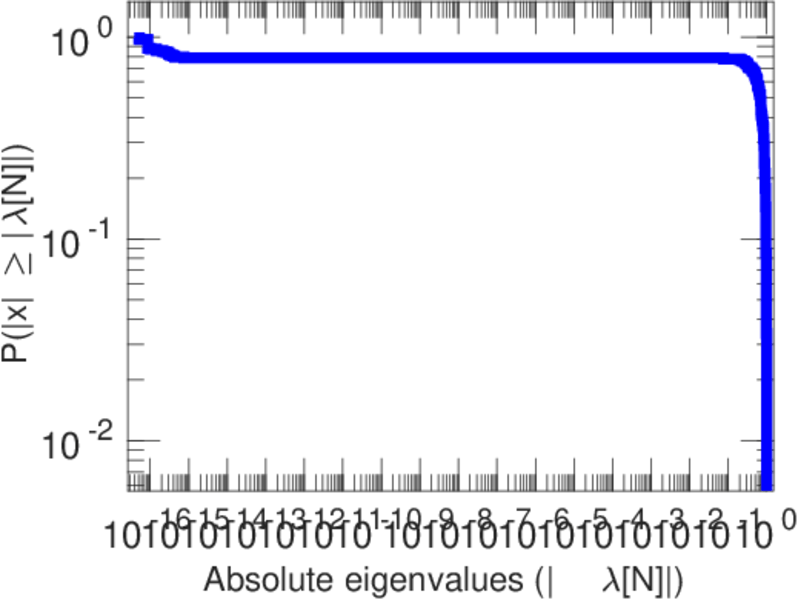
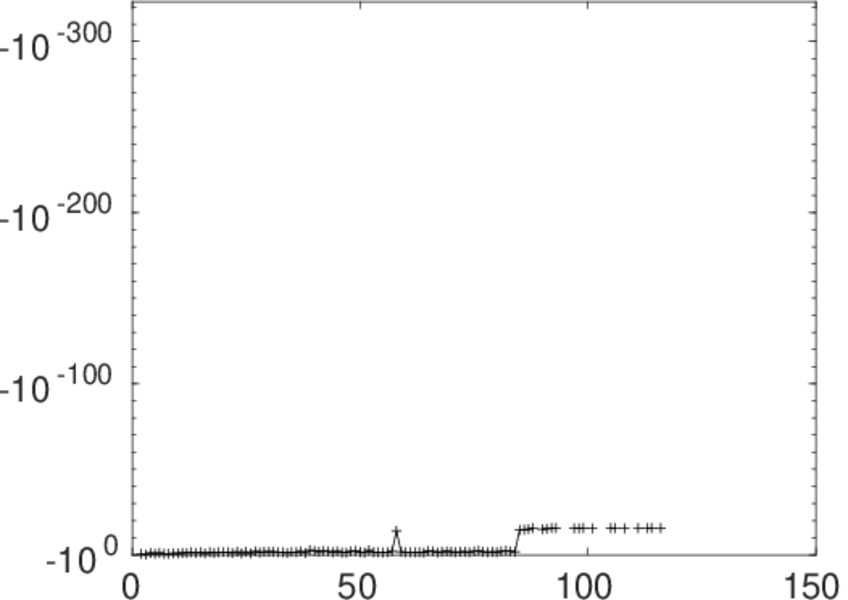
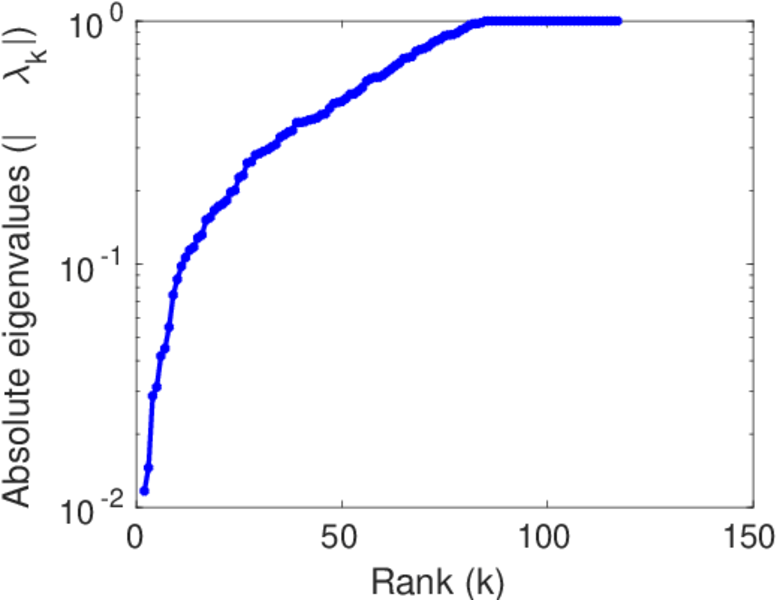
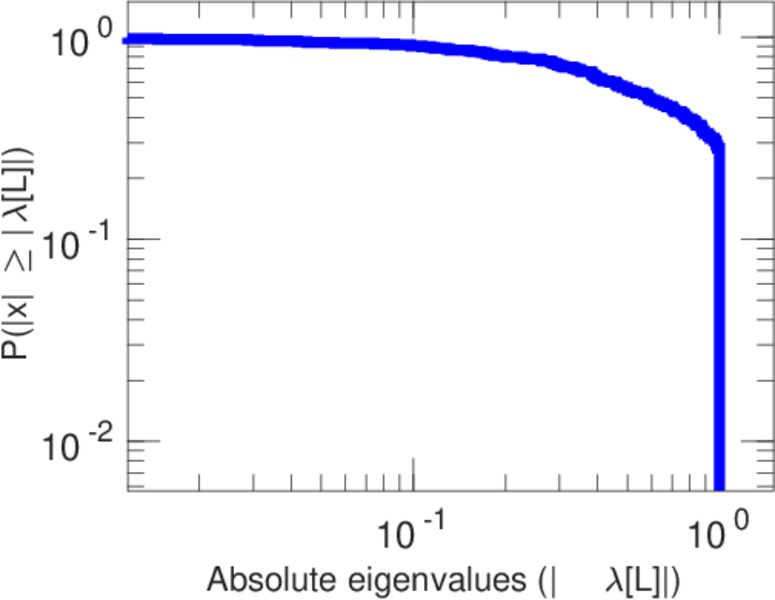
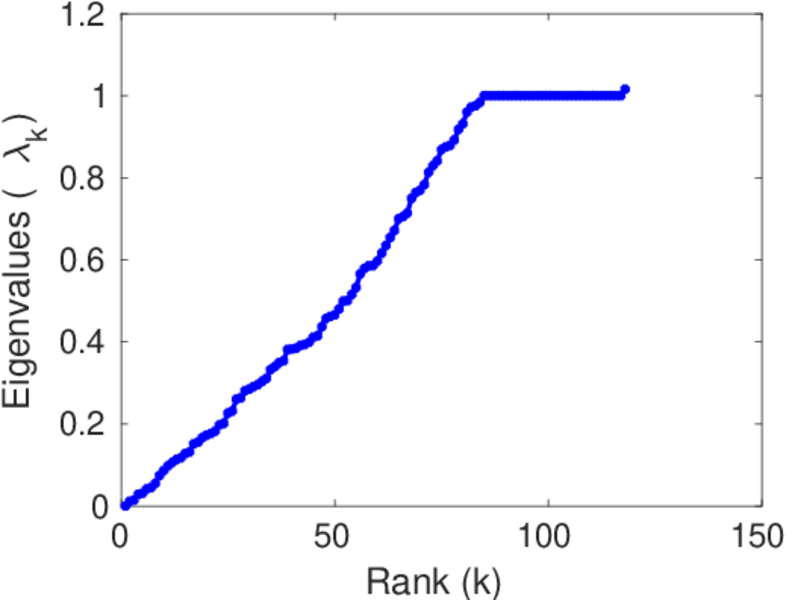
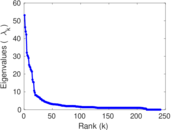
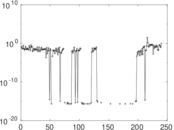
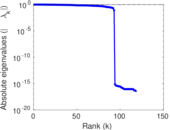
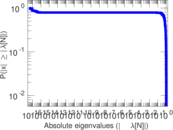
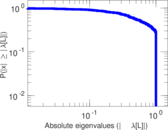
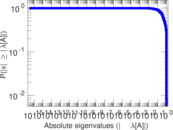
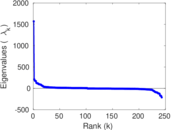
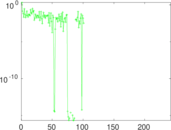
Matrix decompositions plots


Downloads
References
|
[1]
|
Jérôme Kunegis.
KONECT – The Koblenz Network Collection.
In Proc. Int. Conf. on World Wide Web Companion, pages
1343–1350, 2013.
[ http ]
|
|
[2]
|
Wikimedia Foundation.
Wikimedia downloads.
http://dumps.wikimedia.org/, January 2010.
|
 KONECT ‣ Networks ‣
Buy Me a Coffee
KONECT ‣ Networks ‣
Buy Me a Coffee