Wikiquote edits (ur)
This is the bipartite edit network of the Urdu Wikiquote. It contains users and
pages from the Urdu Wikiquote, connected by edit events. Each edge represents
an edit. The dataset includes the timestamp of each edit.
Metadata
Statistics
| Size | n = | 2,169
|
| Left size | n1 = | 221
|
| Right size | n2 = | 1,948
|
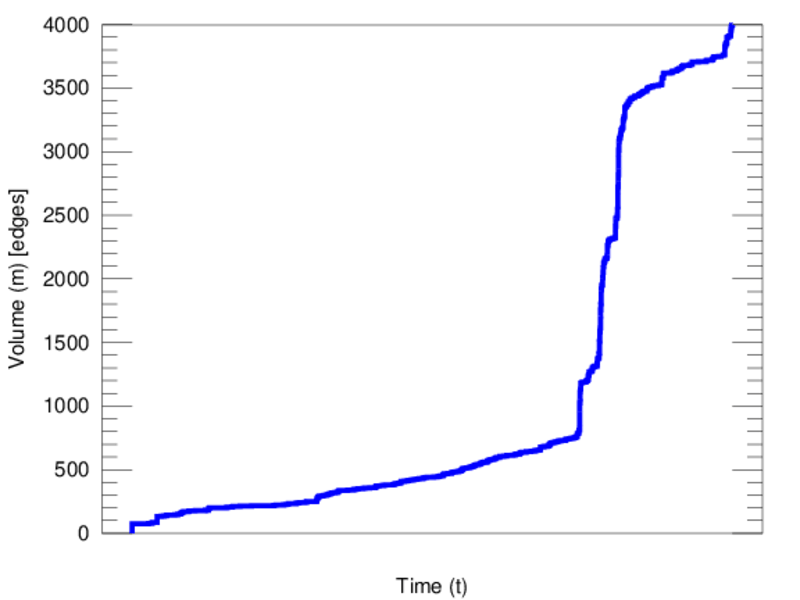
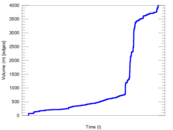
| Volume | m = | 3,995
|
| Unique edge count | m̿ = | 2,455
|
| Wedge count | s = | 836,069
|
| Claw count | z = | 335,377,861
|
| Cross count | x = | 104,934,267,562
|
| Square count | q = | 6,530
|
| 4-Tour count | T4 = | 3,401,650
|
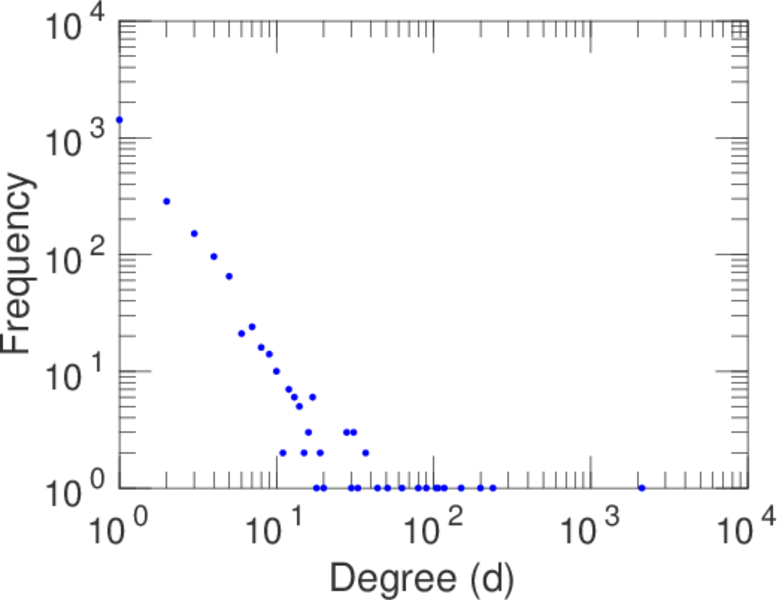
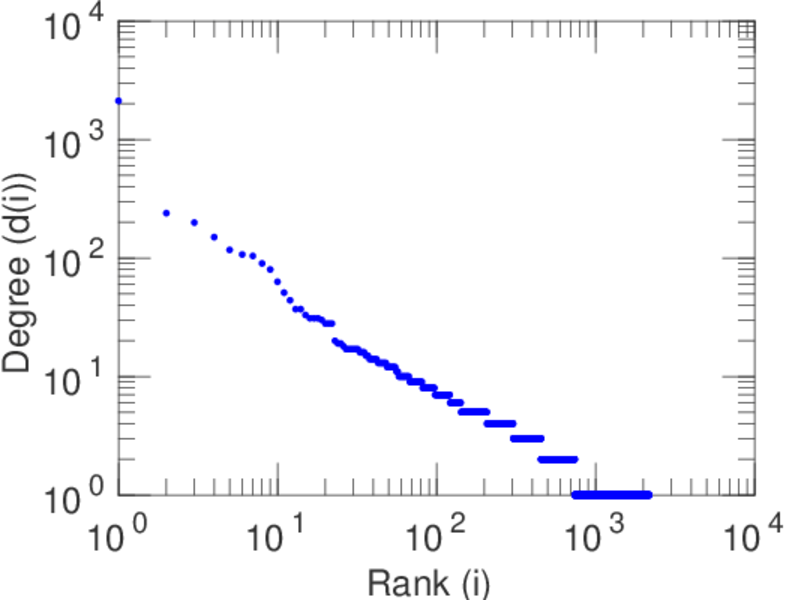
| Maximum degree | dmax = | 2,121
|
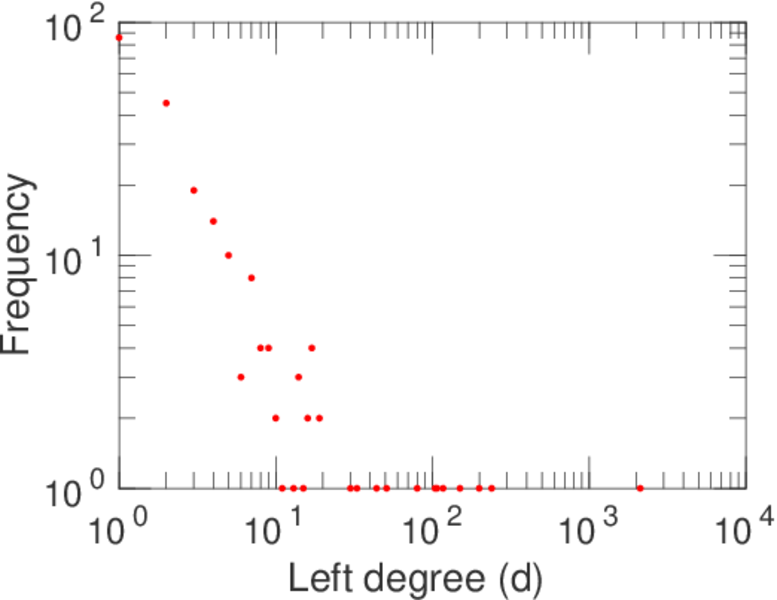
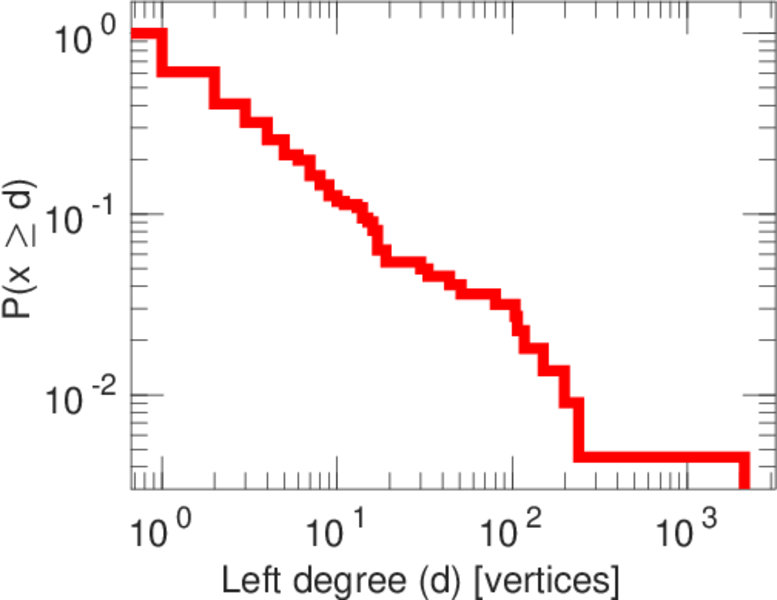
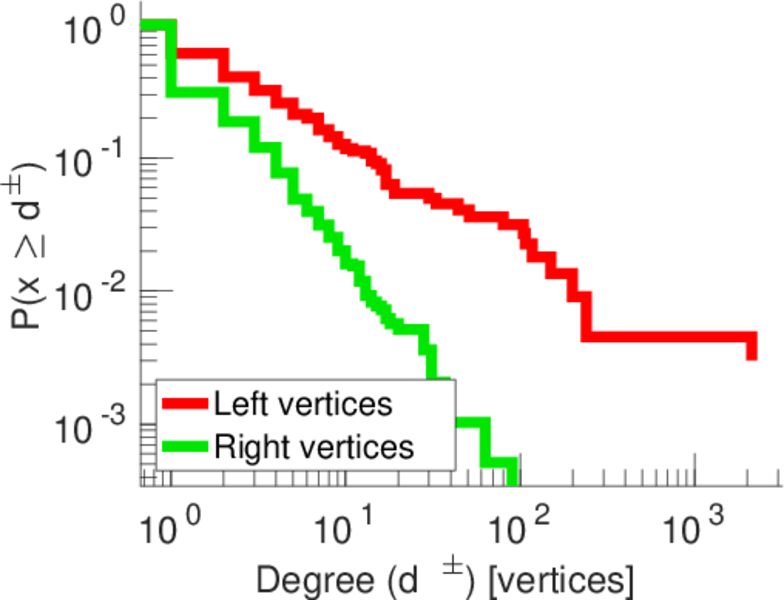
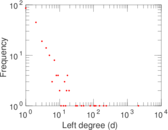
| Maximum left degree | d1max = | 2,121
|
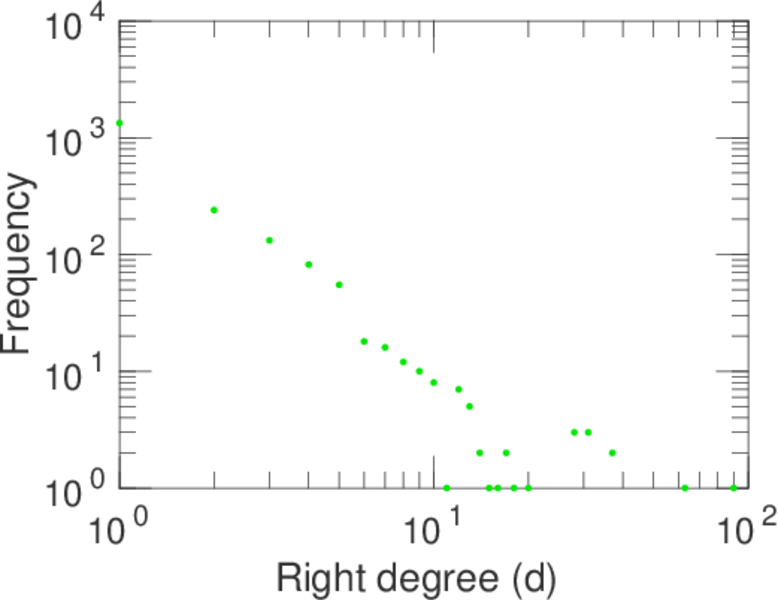
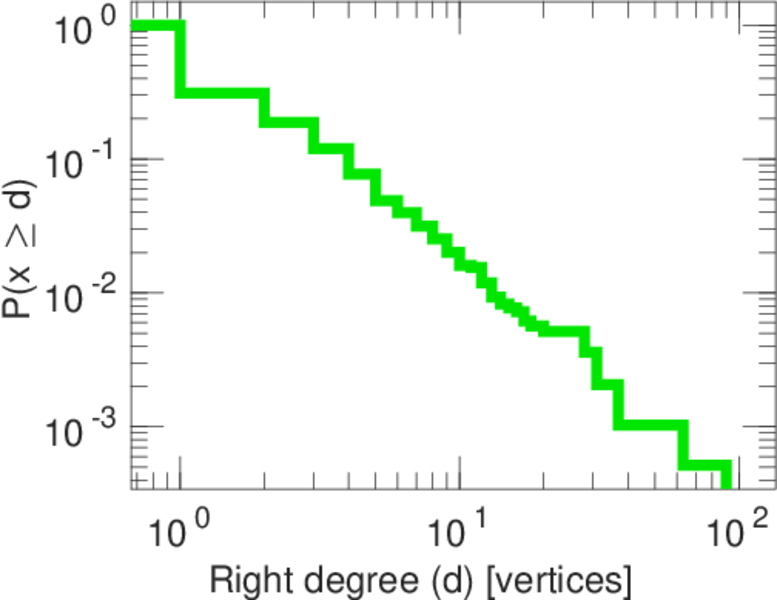
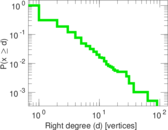
| Maximum right degree | d2max = | 90
|
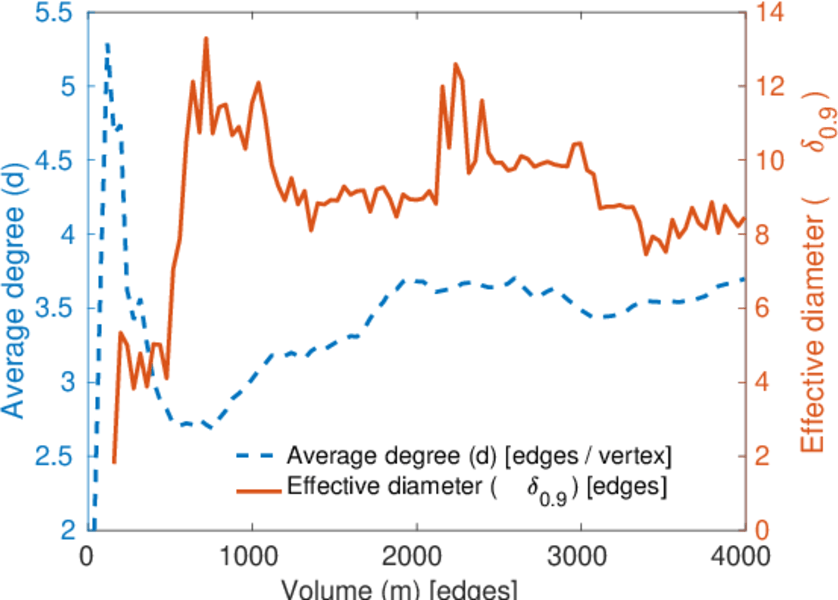
| Average degree | d = | 3.683 73
|
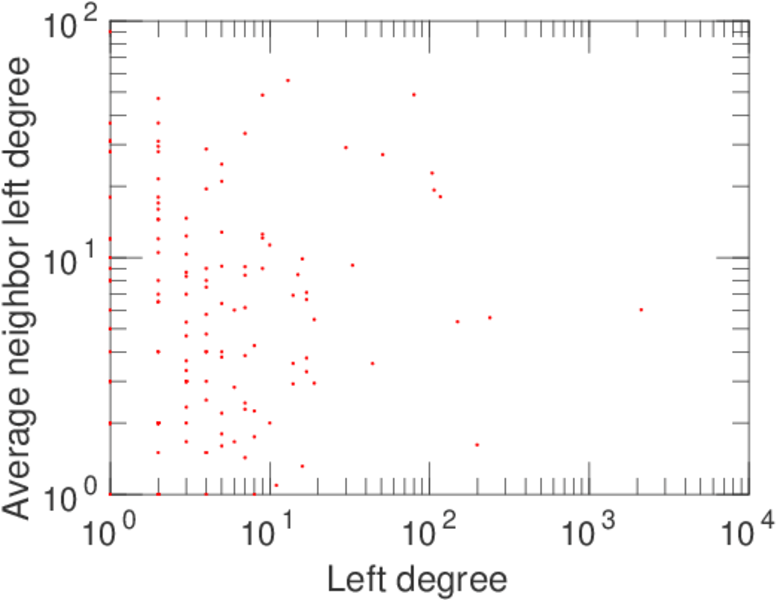
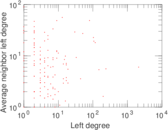
| Average left degree | d1 = | 18.076 9
|
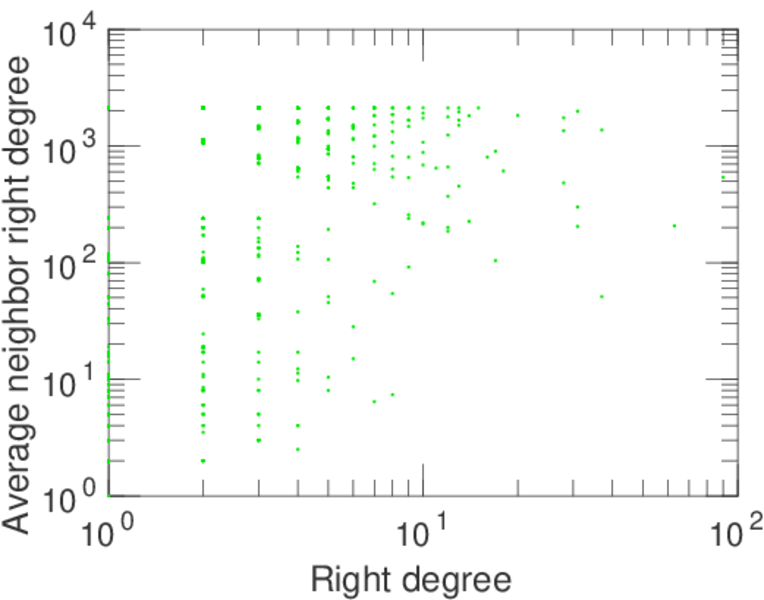
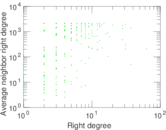
| Average right degree | d2 = | 2.050 82
|
| Fill | p = | 0.005 702 57
|
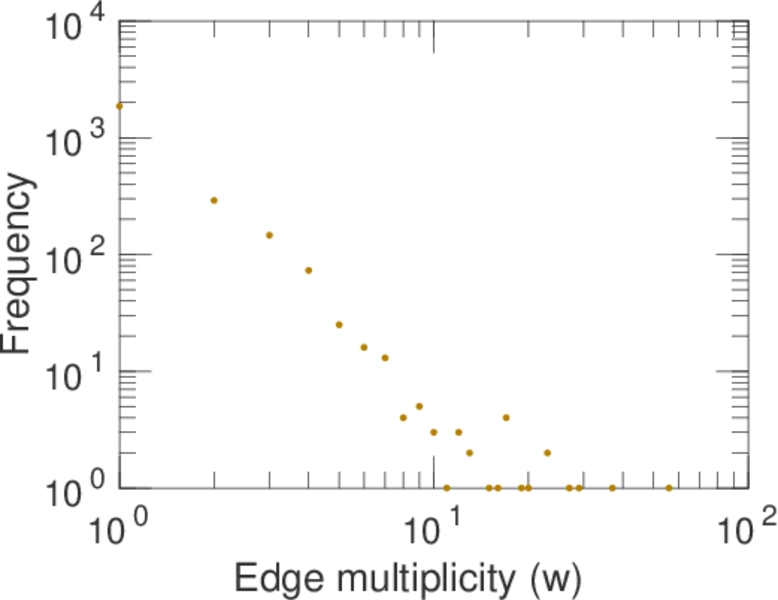
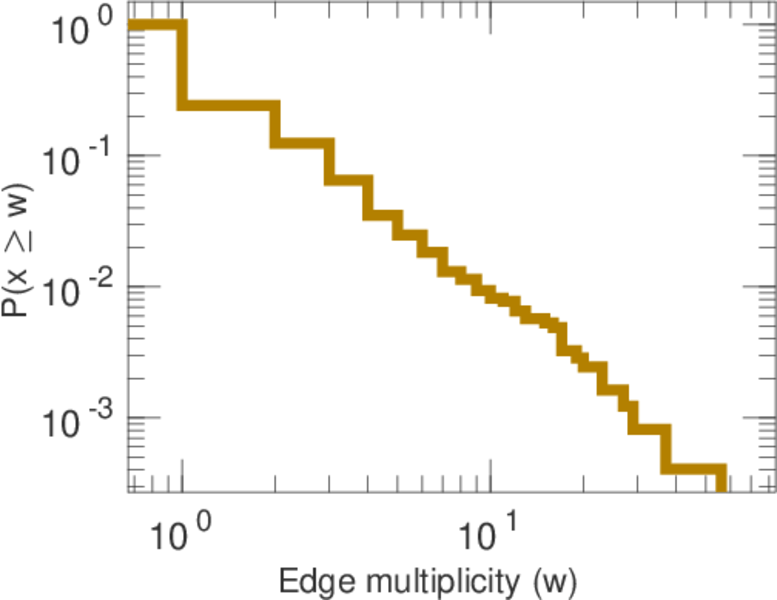
| Average edge multiplicity | m̃ = | 1.627 29
|
| Size of LCC | N = | 1,932
|
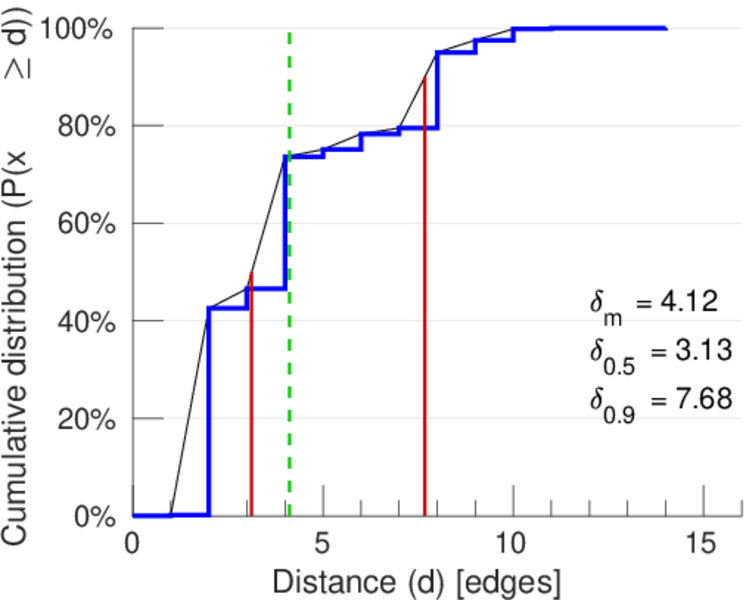
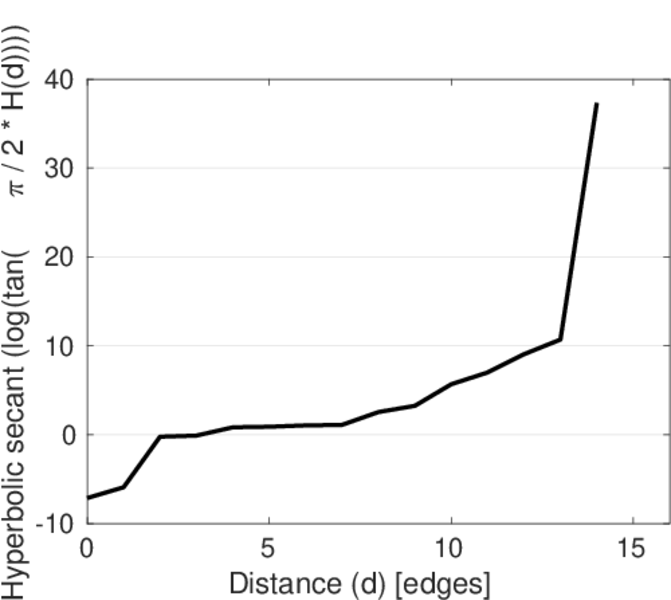
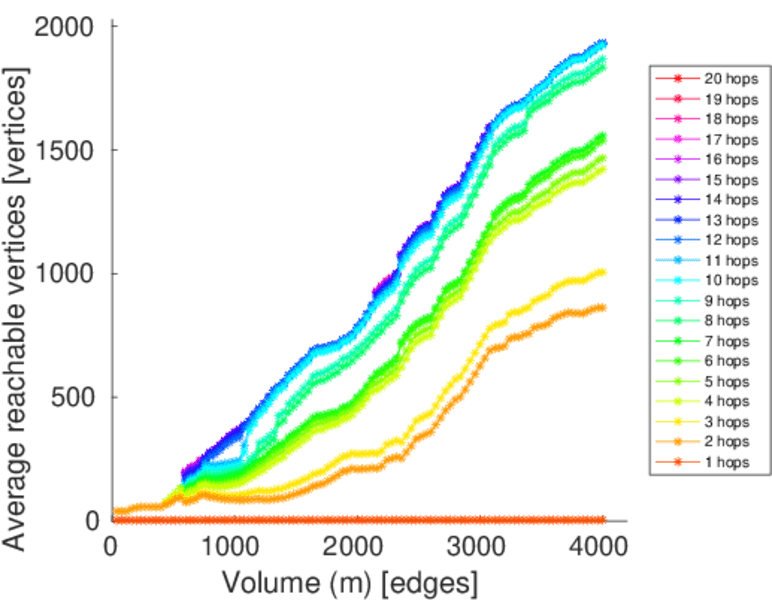
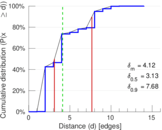
| Diameter | δ = | 15
|
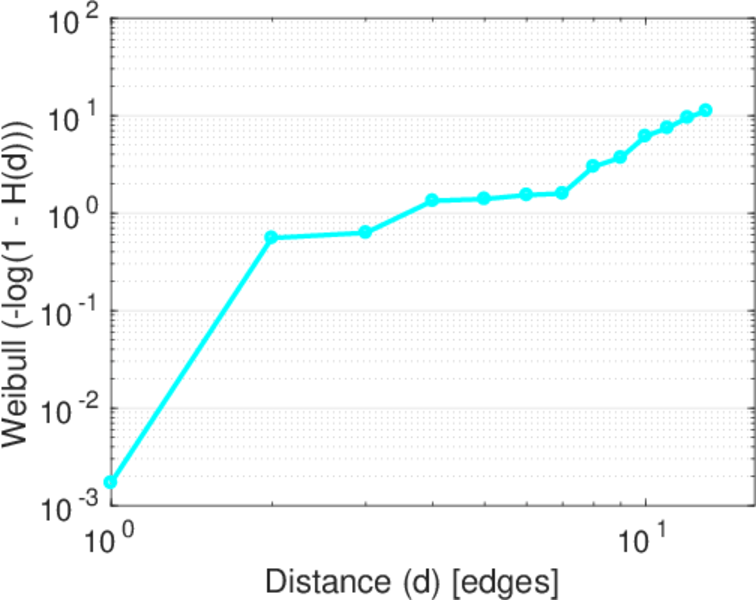
| 50-Percentile effective diameter | δ0.5 = | 3.127 21
|
| 90-Percentile effective diameter | δ0.9 = | 7.678 45
|
| Median distance | δM = | 4
|
| Mean distance | δm = | 4.120 16
|
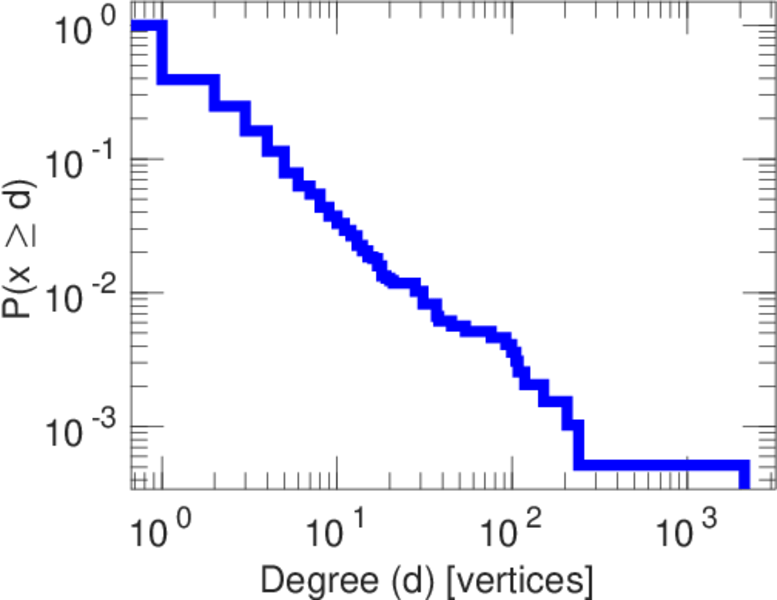
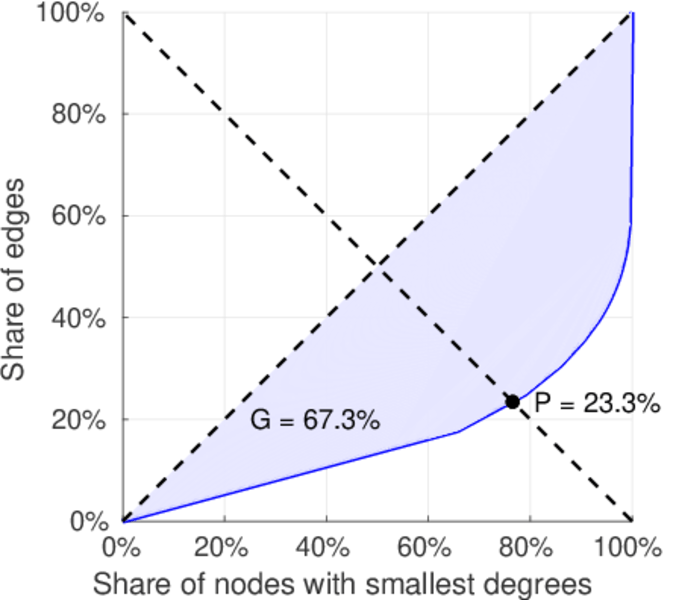
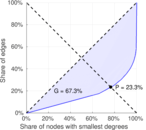
| Gini coefficient | G = | 0.688 368
|
| Balanced inequality ratio | P = | 0.227 159
|
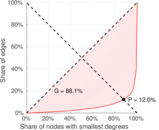
| Left balanced inequality ratio | P1 = | 0.120 401
|
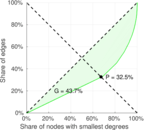
| Right balanced inequality ratio | P2 = | 0.325 156
|
| Relative edge distribution entropy | Her = | 0.745 336
|
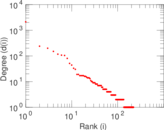
| Power law exponent | γ = | 5.781 56
|
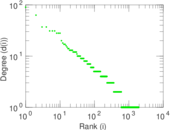
| Tail power law exponent | γt = | 2.781 00
|
| Tail power law exponent with p | γ3 = | 2.781 00
|
| p-value | p = | 0.000 00
|
| Left tail power law exponent with p | γ3,1 = | 1.941 00
|
| Left p-value | p1 = | 0.535 000
|
| Right tail power law exponent with p | γ3,2 = | 3.121 00
|
| Right p-value | p2 = | 0.000 00
|
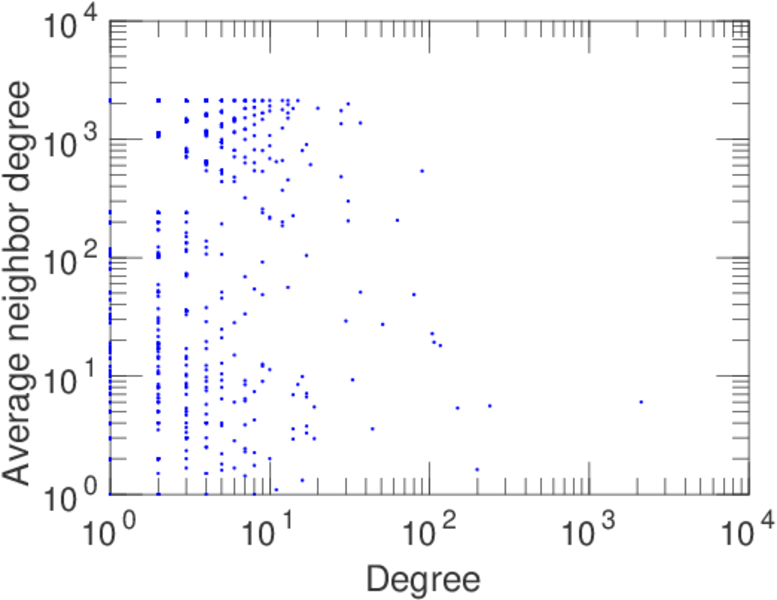
| Degree assortativity | ρ = | −0.263 893
|
| Degree assortativity p-value | pρ = | 2.157 92 × 10−40
|
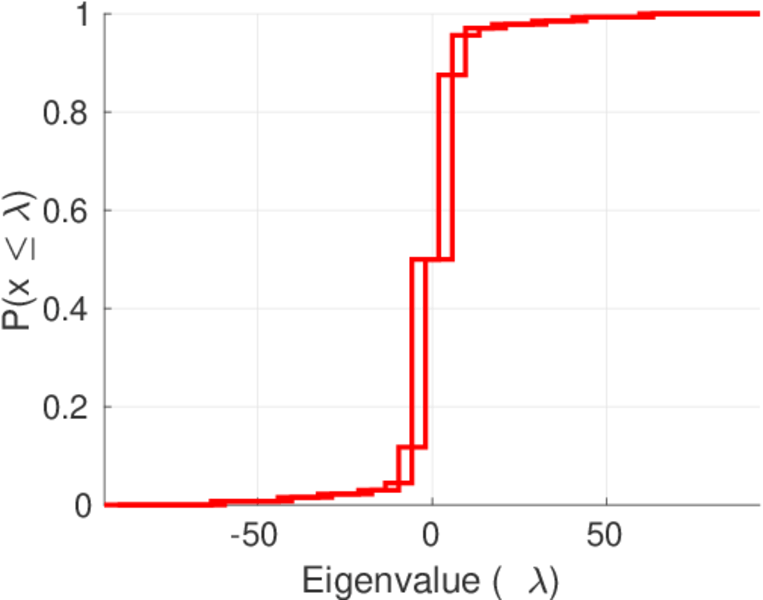
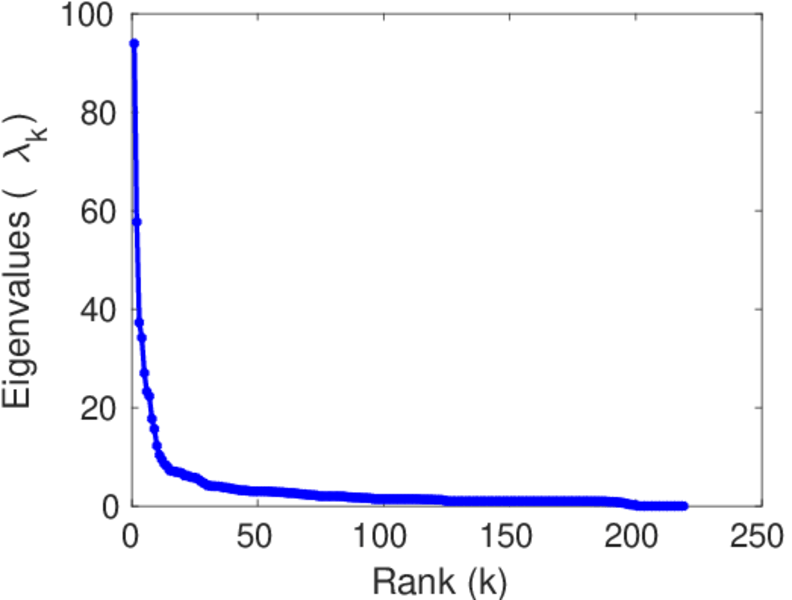
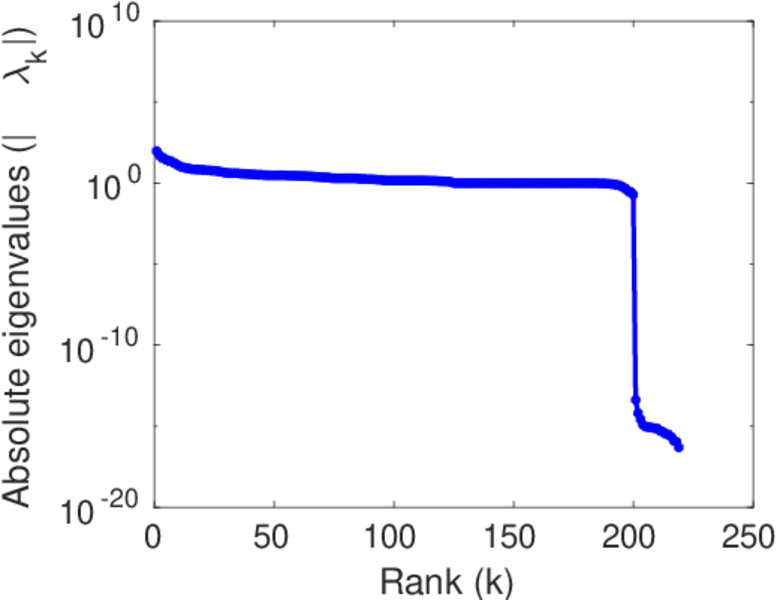
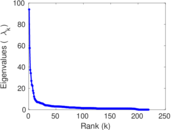
| Spectral norm | α = | 93.935 2
|
| Algebraic connectivity | a = | 0.004 614 54
|
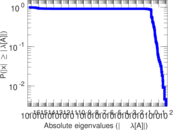
| Spectral separation | |λ1[A] / λ2[A]| = | 1.628 09
|
| Controllability | C = | 1,760
|
| Relative controllability | Cr = | 0.814 815
|
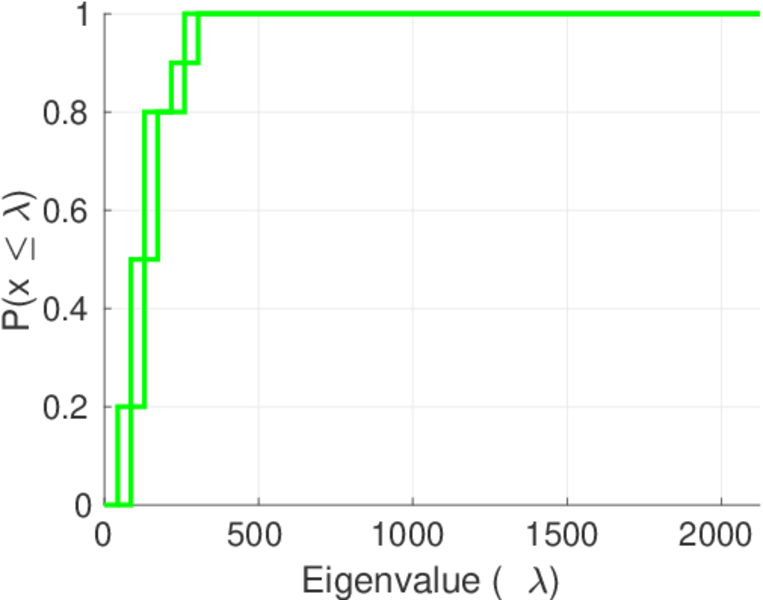
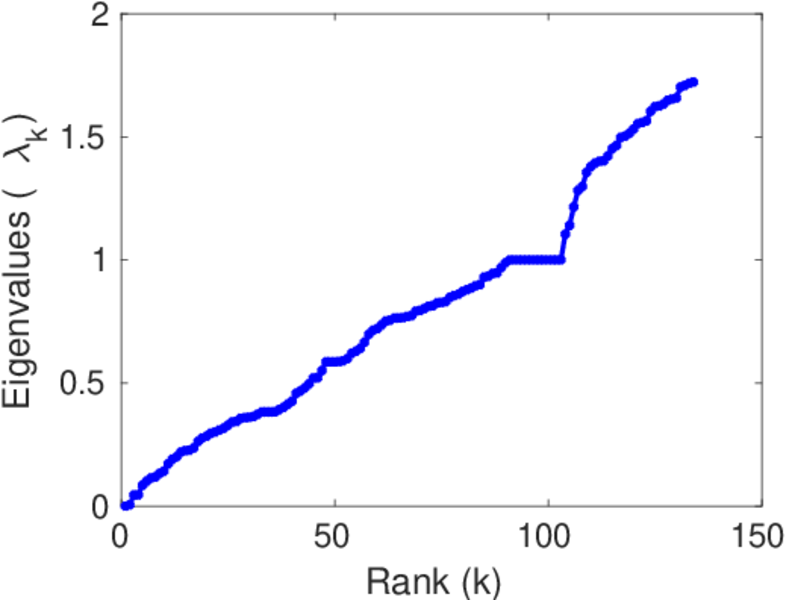
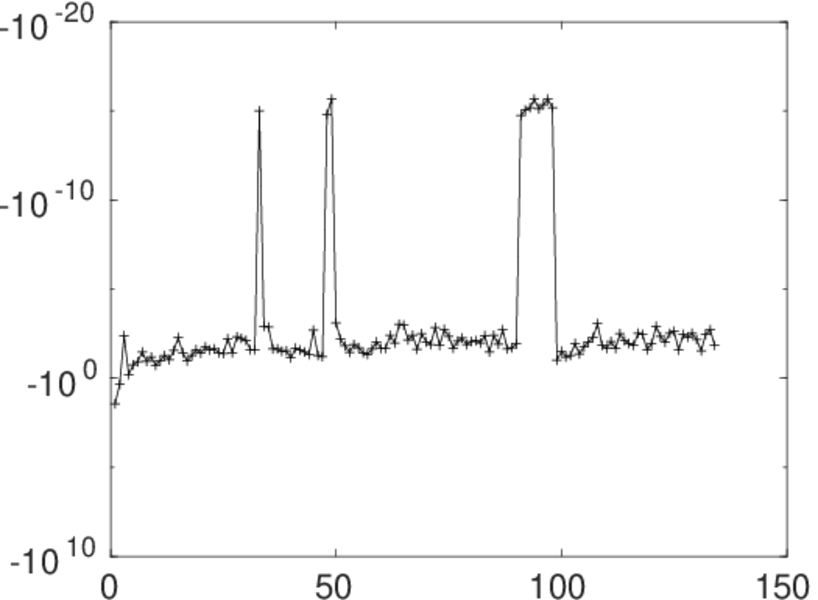
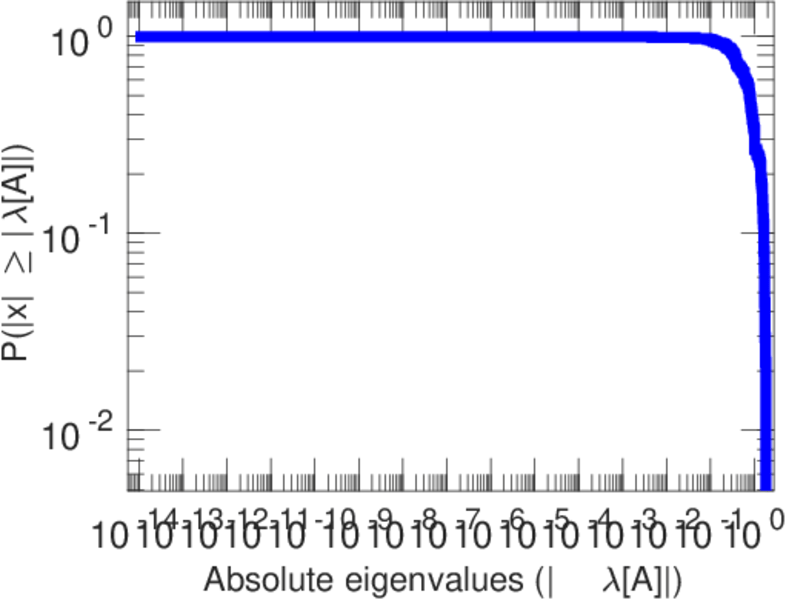
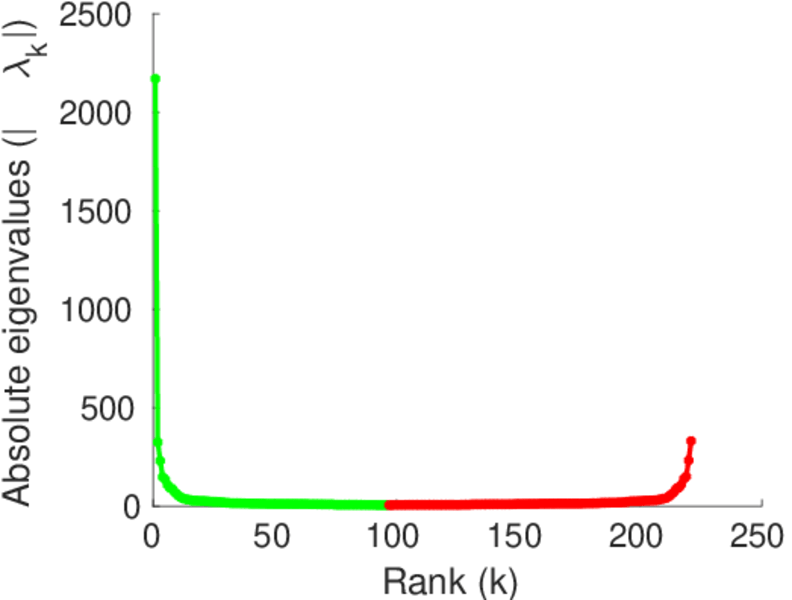
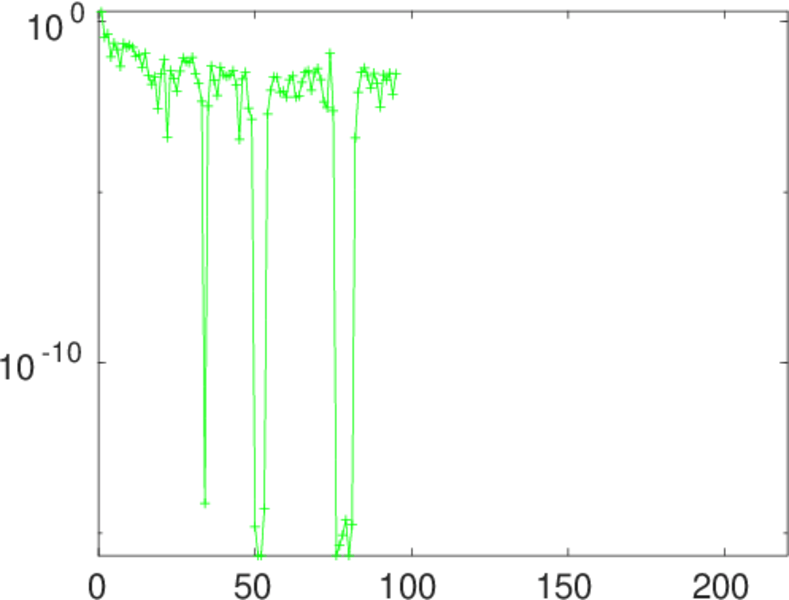
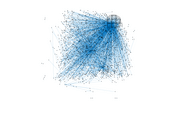
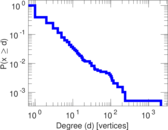
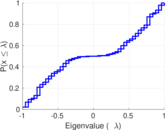
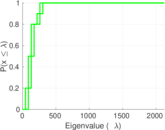
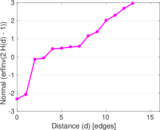
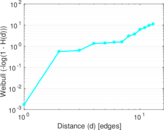
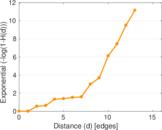
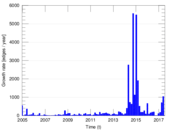
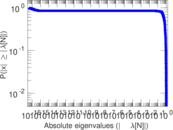
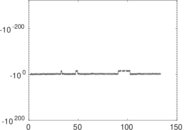
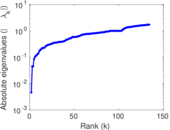
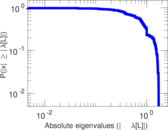
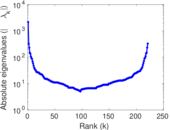
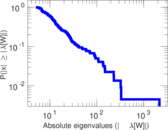
Plots


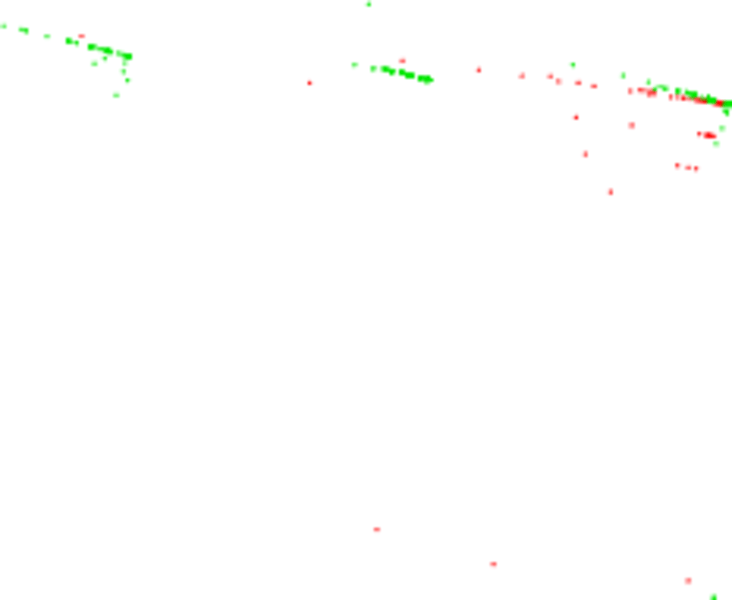
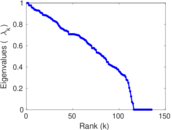
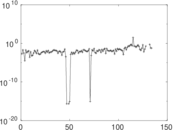
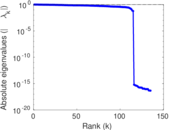
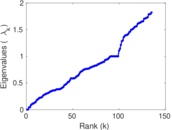
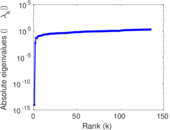
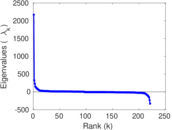
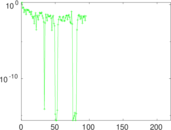
Matrix decompositions plots


Downloads
References
|
[1]
|
Jérôme Kunegis.
KONECT – The Koblenz Network Collection.
In Proc. Int. Conf. on World Wide Web Companion, pages
1343–1350, 2013.
[ http ]
|
|
[2]
|
Wikimedia Foundation.
Wikimedia downloads.
http://dumps.wikimedia.org/, January 2010.
|
 KONECT ‣ Networks ‣
Buy Me a Coffee
KONECT ‣ Networks ‣
Buy Me a Coffee