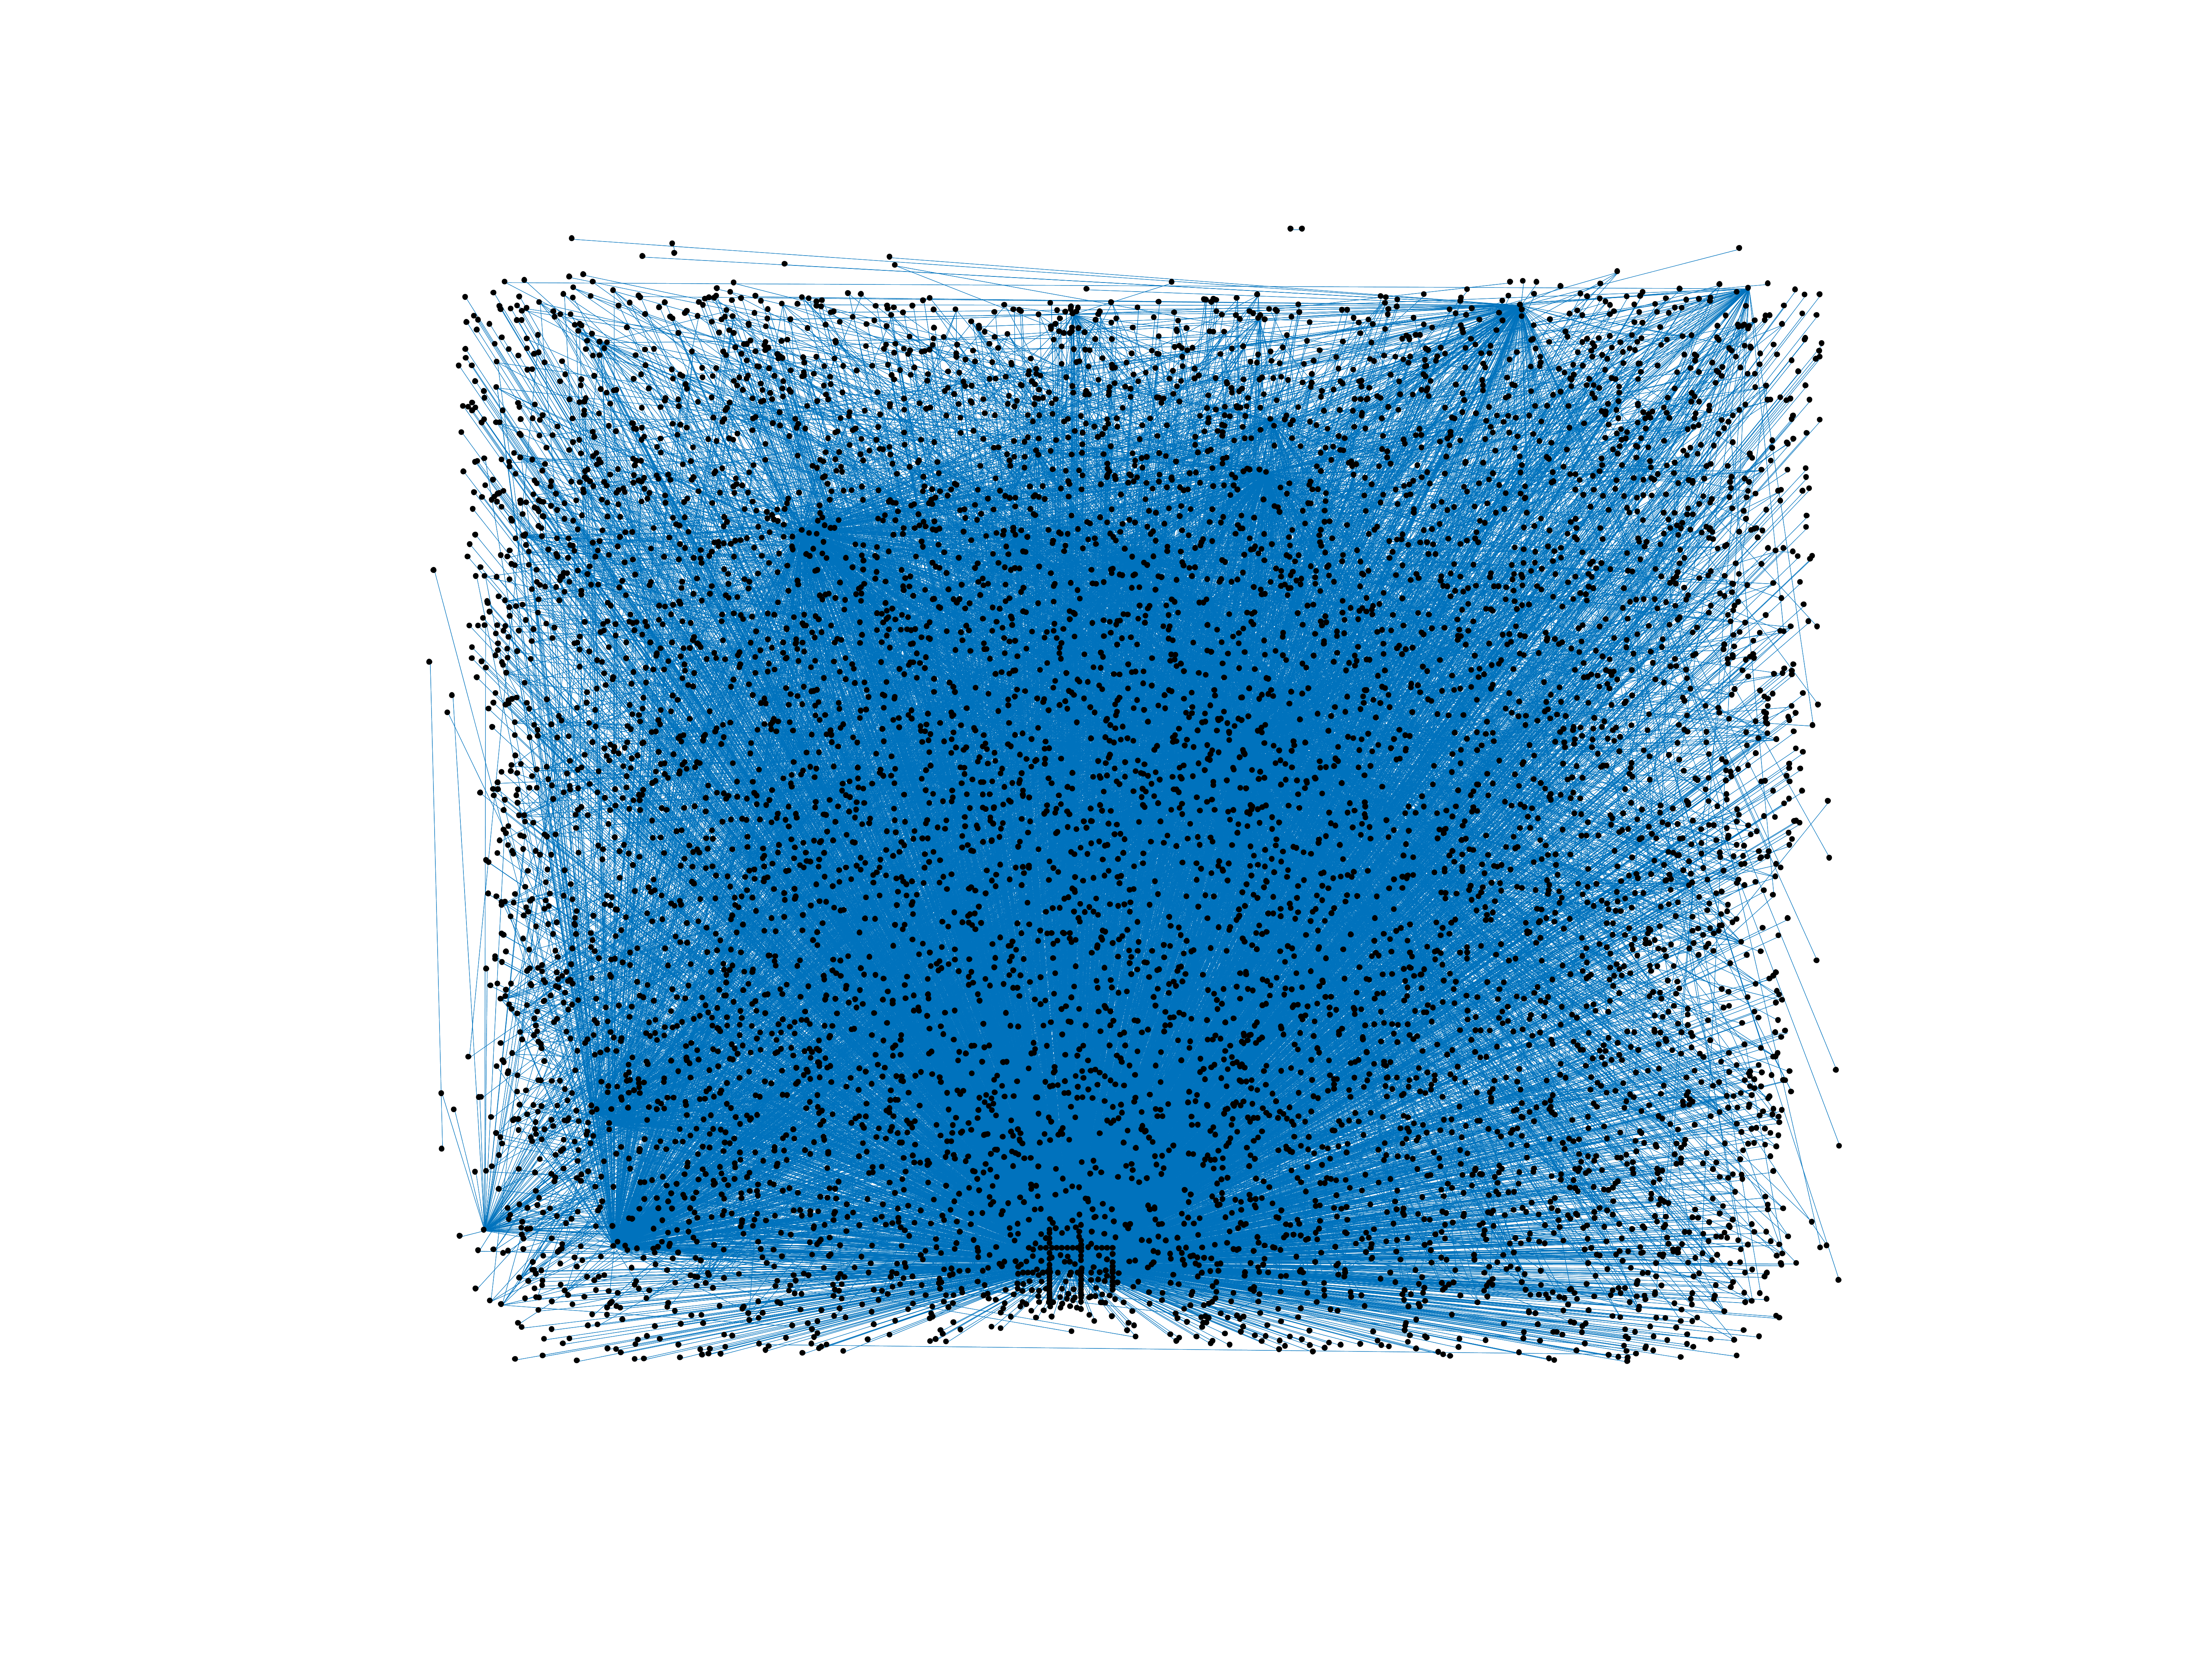
Wiktionary edits (ur)
This is the bipartite edit network of the Urdu Wiktionary. It contains users
and pages from the Urdu Wiktionary, connected by edit events. Each edge
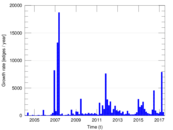
represents an edit. The dataset includes the timestamp of each edit.
Metadata
Statistics
| Size | n = | 8,456
|
| Left size | n1 = | 298
|
| Right size | n2 = | 8,158
|
| Volume | m = | 16,967
|
| Unique edge count | m̿ = | 10,893
|
| Wedge count | s = | 13,616,889
|
| Claw count | z = | 20,861,387,620
|
| Cross count | x = | 25,616,513,415,791
|
| Square count | q = | 701,535
|
| 4-Tour count | T4 = | 60,101,954
|
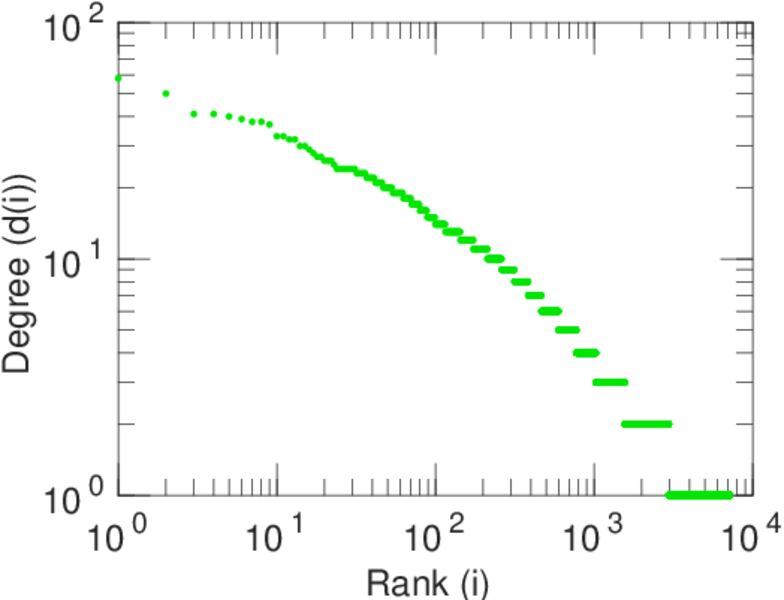
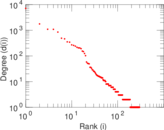
| Maximum degree | dmax = | 7,082
|
| Maximum left degree | d1max = | 7,082
|
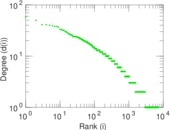
| Maximum right degree | d2max = | 58
|
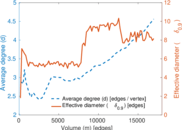
| Average degree | d = | 4.013 01
|
| Average left degree | d1 = | 56.936 2
|
| Average right degree | d2 = | 2.079 80
|
| Fill | p = | 0.004 480 72
|
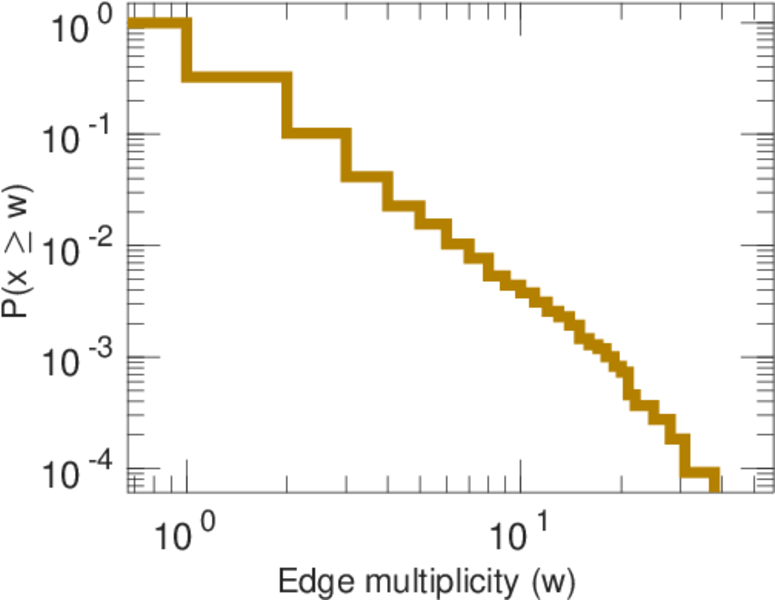
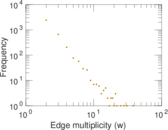
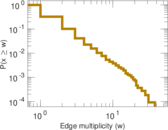
| Average edge multiplicity | m̃ = | 1.557 61
|
| Size of LCC | N = | 7,158
|
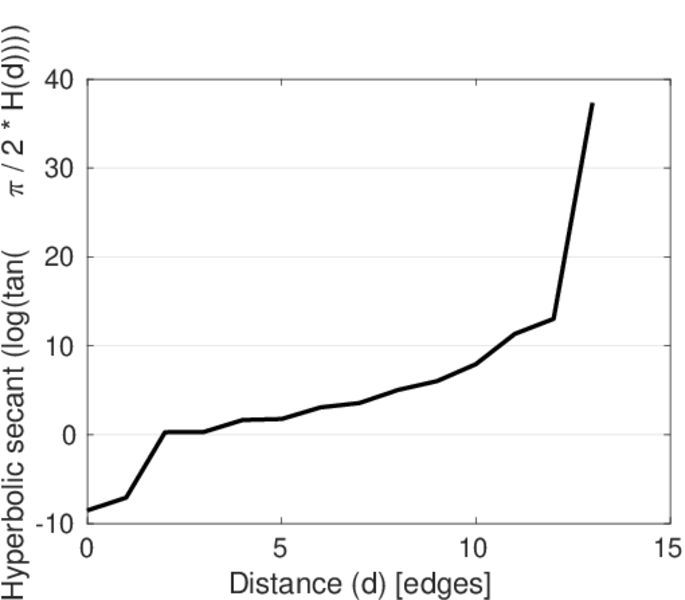
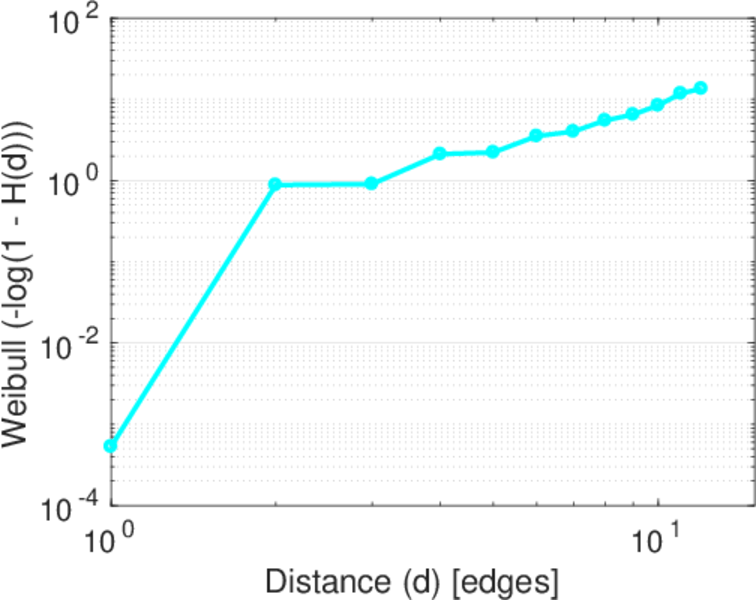
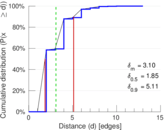
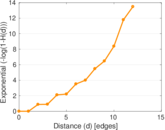
| Diameter | δ = | 17
|
| 50-Percentile effective diameter | δ0.5 = | 1.854 77
|
| 90-Percentile effective diameter | δ0.9 = | 5.113 24
|
| Median distance | δM = | 2
|
| Mean distance | δm = | 3.103 85
|
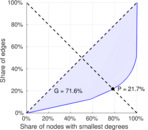
| Gini coefficient | G = | 0.721 424
|
| Balanced inequality ratio | P = | 0.213 915
|
| Left balanced inequality ratio | P1 = | 0.070 018 3
|
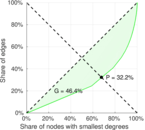
| Right balanced inequality ratio | P2 = | 0.321 565
|
| Relative edge distribution entropy | Her = | 0.705 868
|
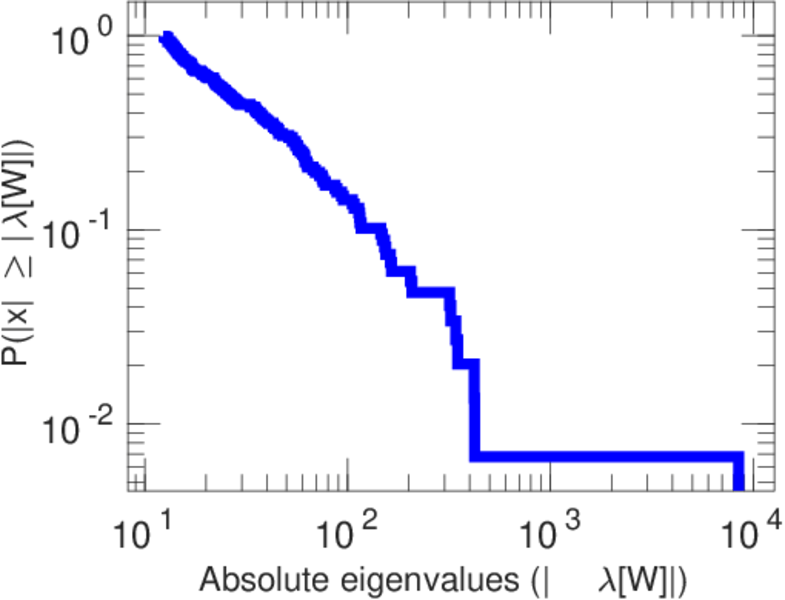
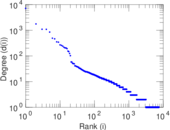
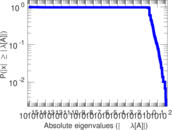
| Power law exponent | γ = | 4.730 08
|
| Tail power law exponent | γt = | 2.561 00
|
| Tail power law exponent with p | γ3 = | 2.561 00
|
| p-value | p = | 0.000 00
|
| Left tail power law exponent with p | γ3,1 = | 1.671 00
|
| Left p-value | p1 = | 0.118 000
|
| Right tail power law exponent with p | γ3,2 = | 6.181 00
|
| Right p-value | p2 = | 0.845 000
|
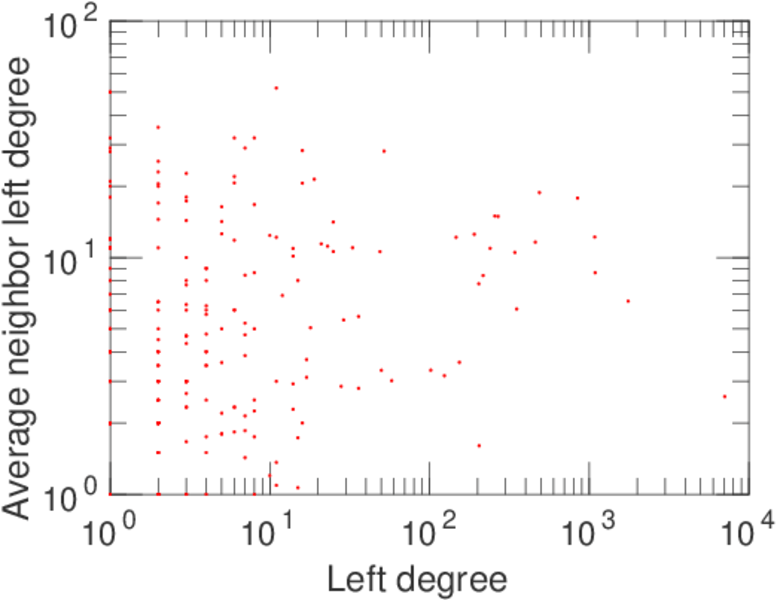
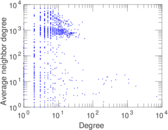
| Degree assortativity | ρ = | −0.530 306
|
| Degree assortativity p-value | pρ = | 0.000 00
|
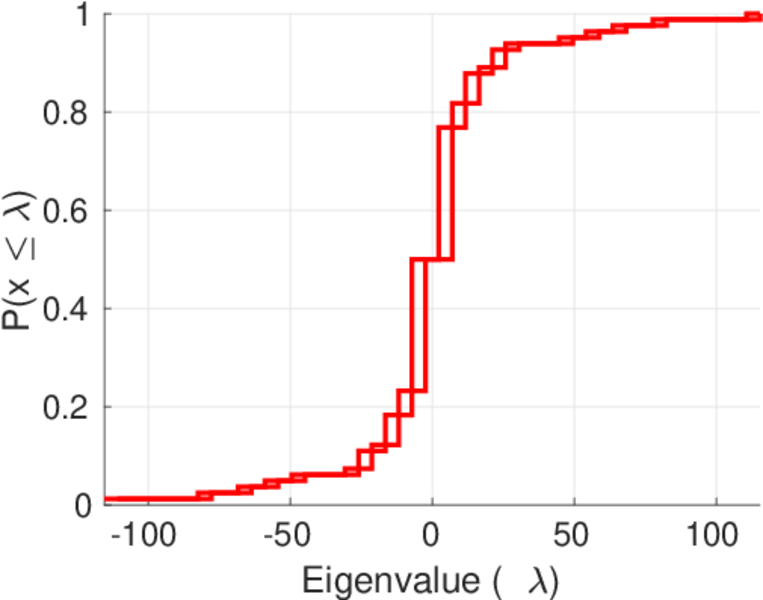
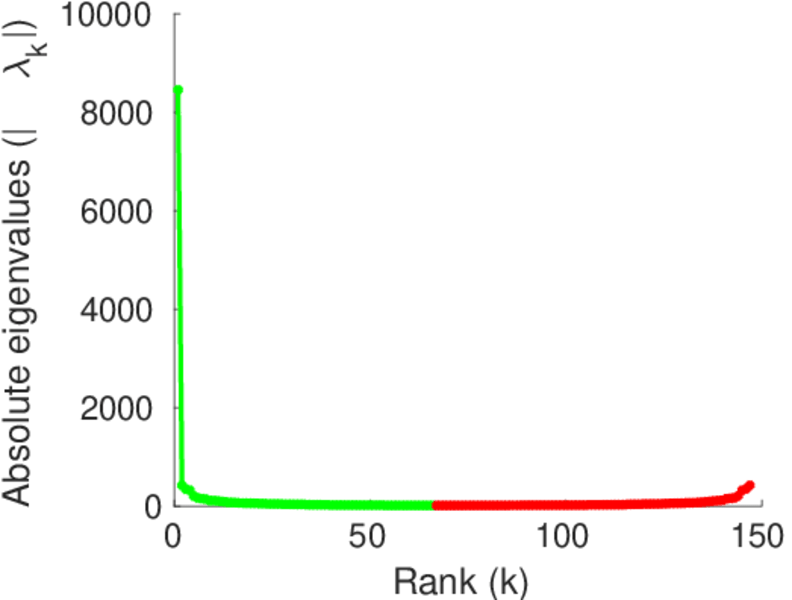
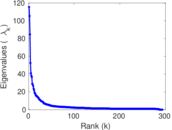
| Spectral norm | α = | 115.426
|
| Algebraic connectivity | a = | 0.009 942 58
|
| Spectral separation | |λ1[A] / λ2[A]| = | 1.095 18
|
| Controllability | C = | 6,869
|
| Relative controllability | Cr = | 0.923 129
|
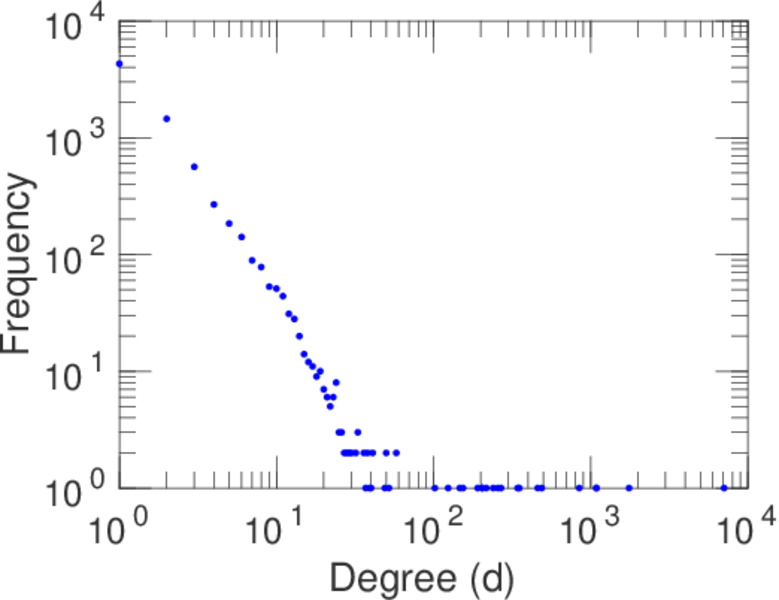
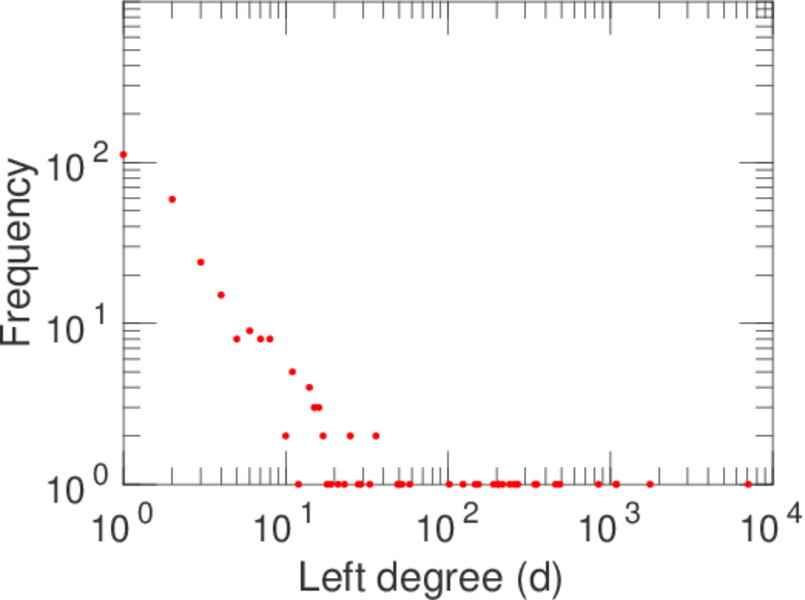
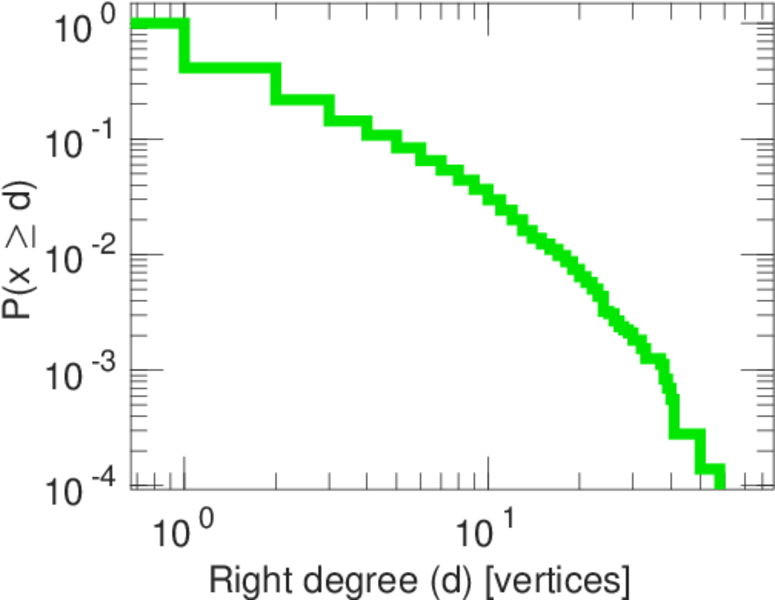
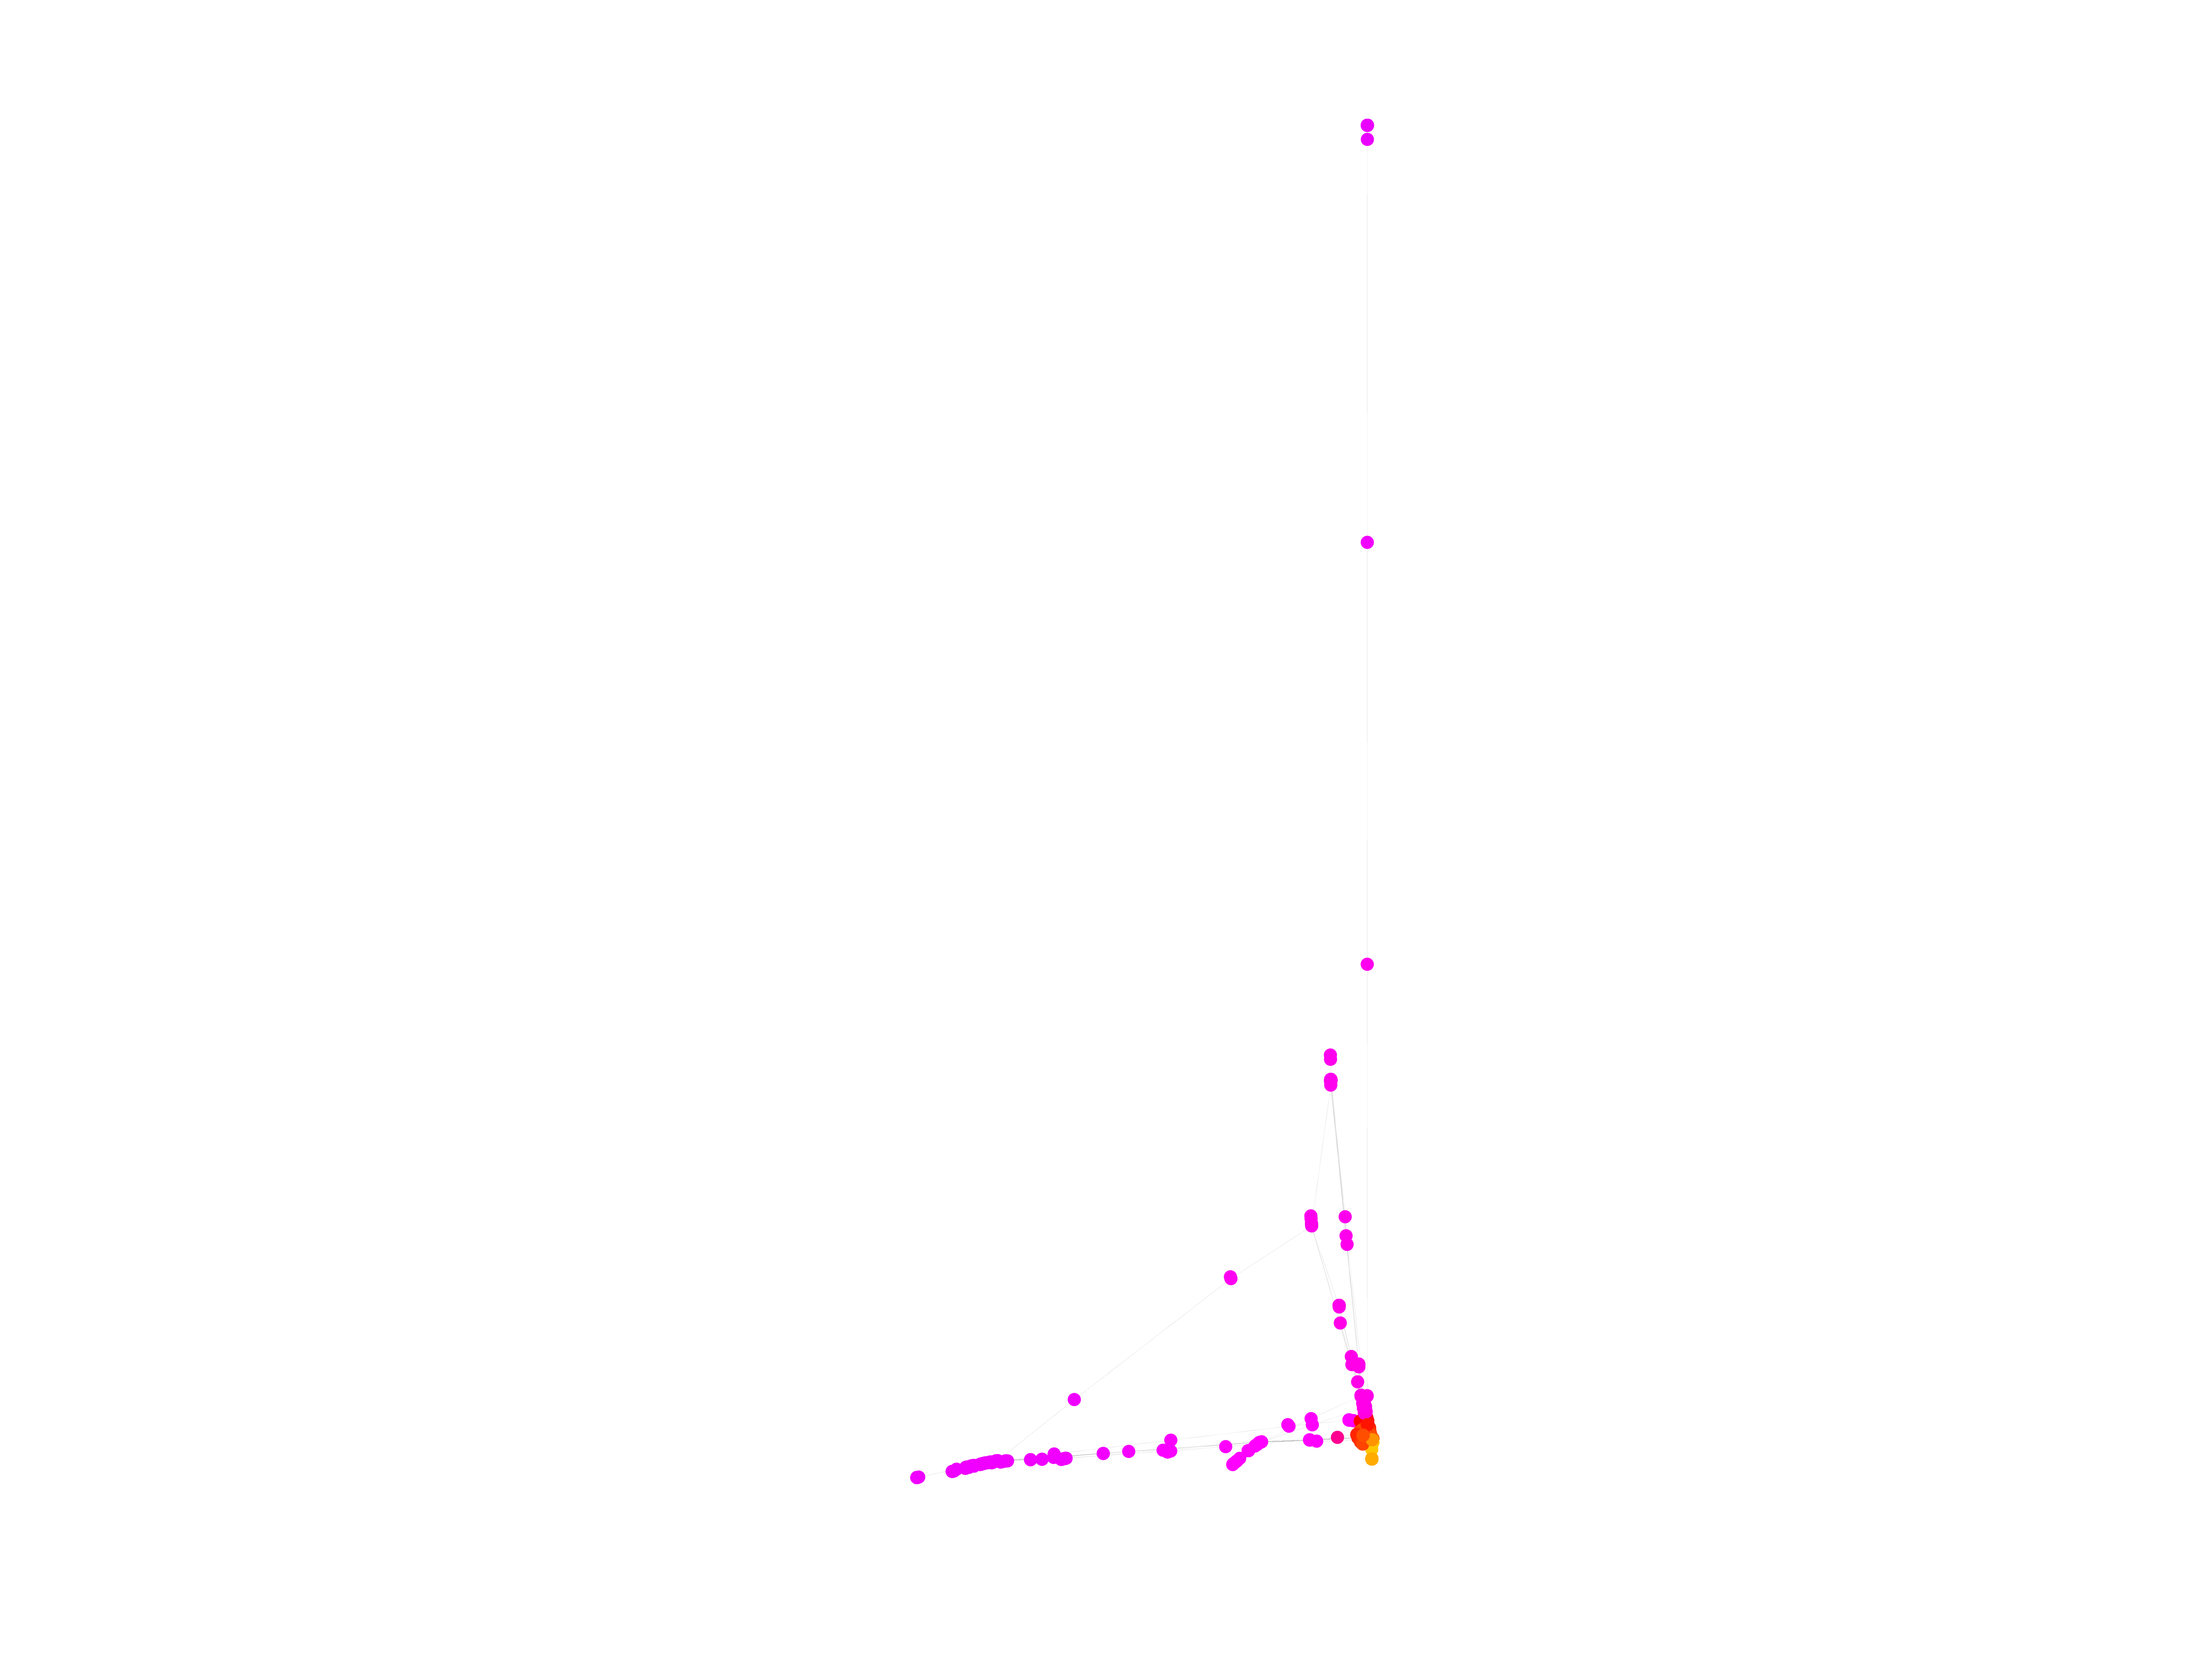
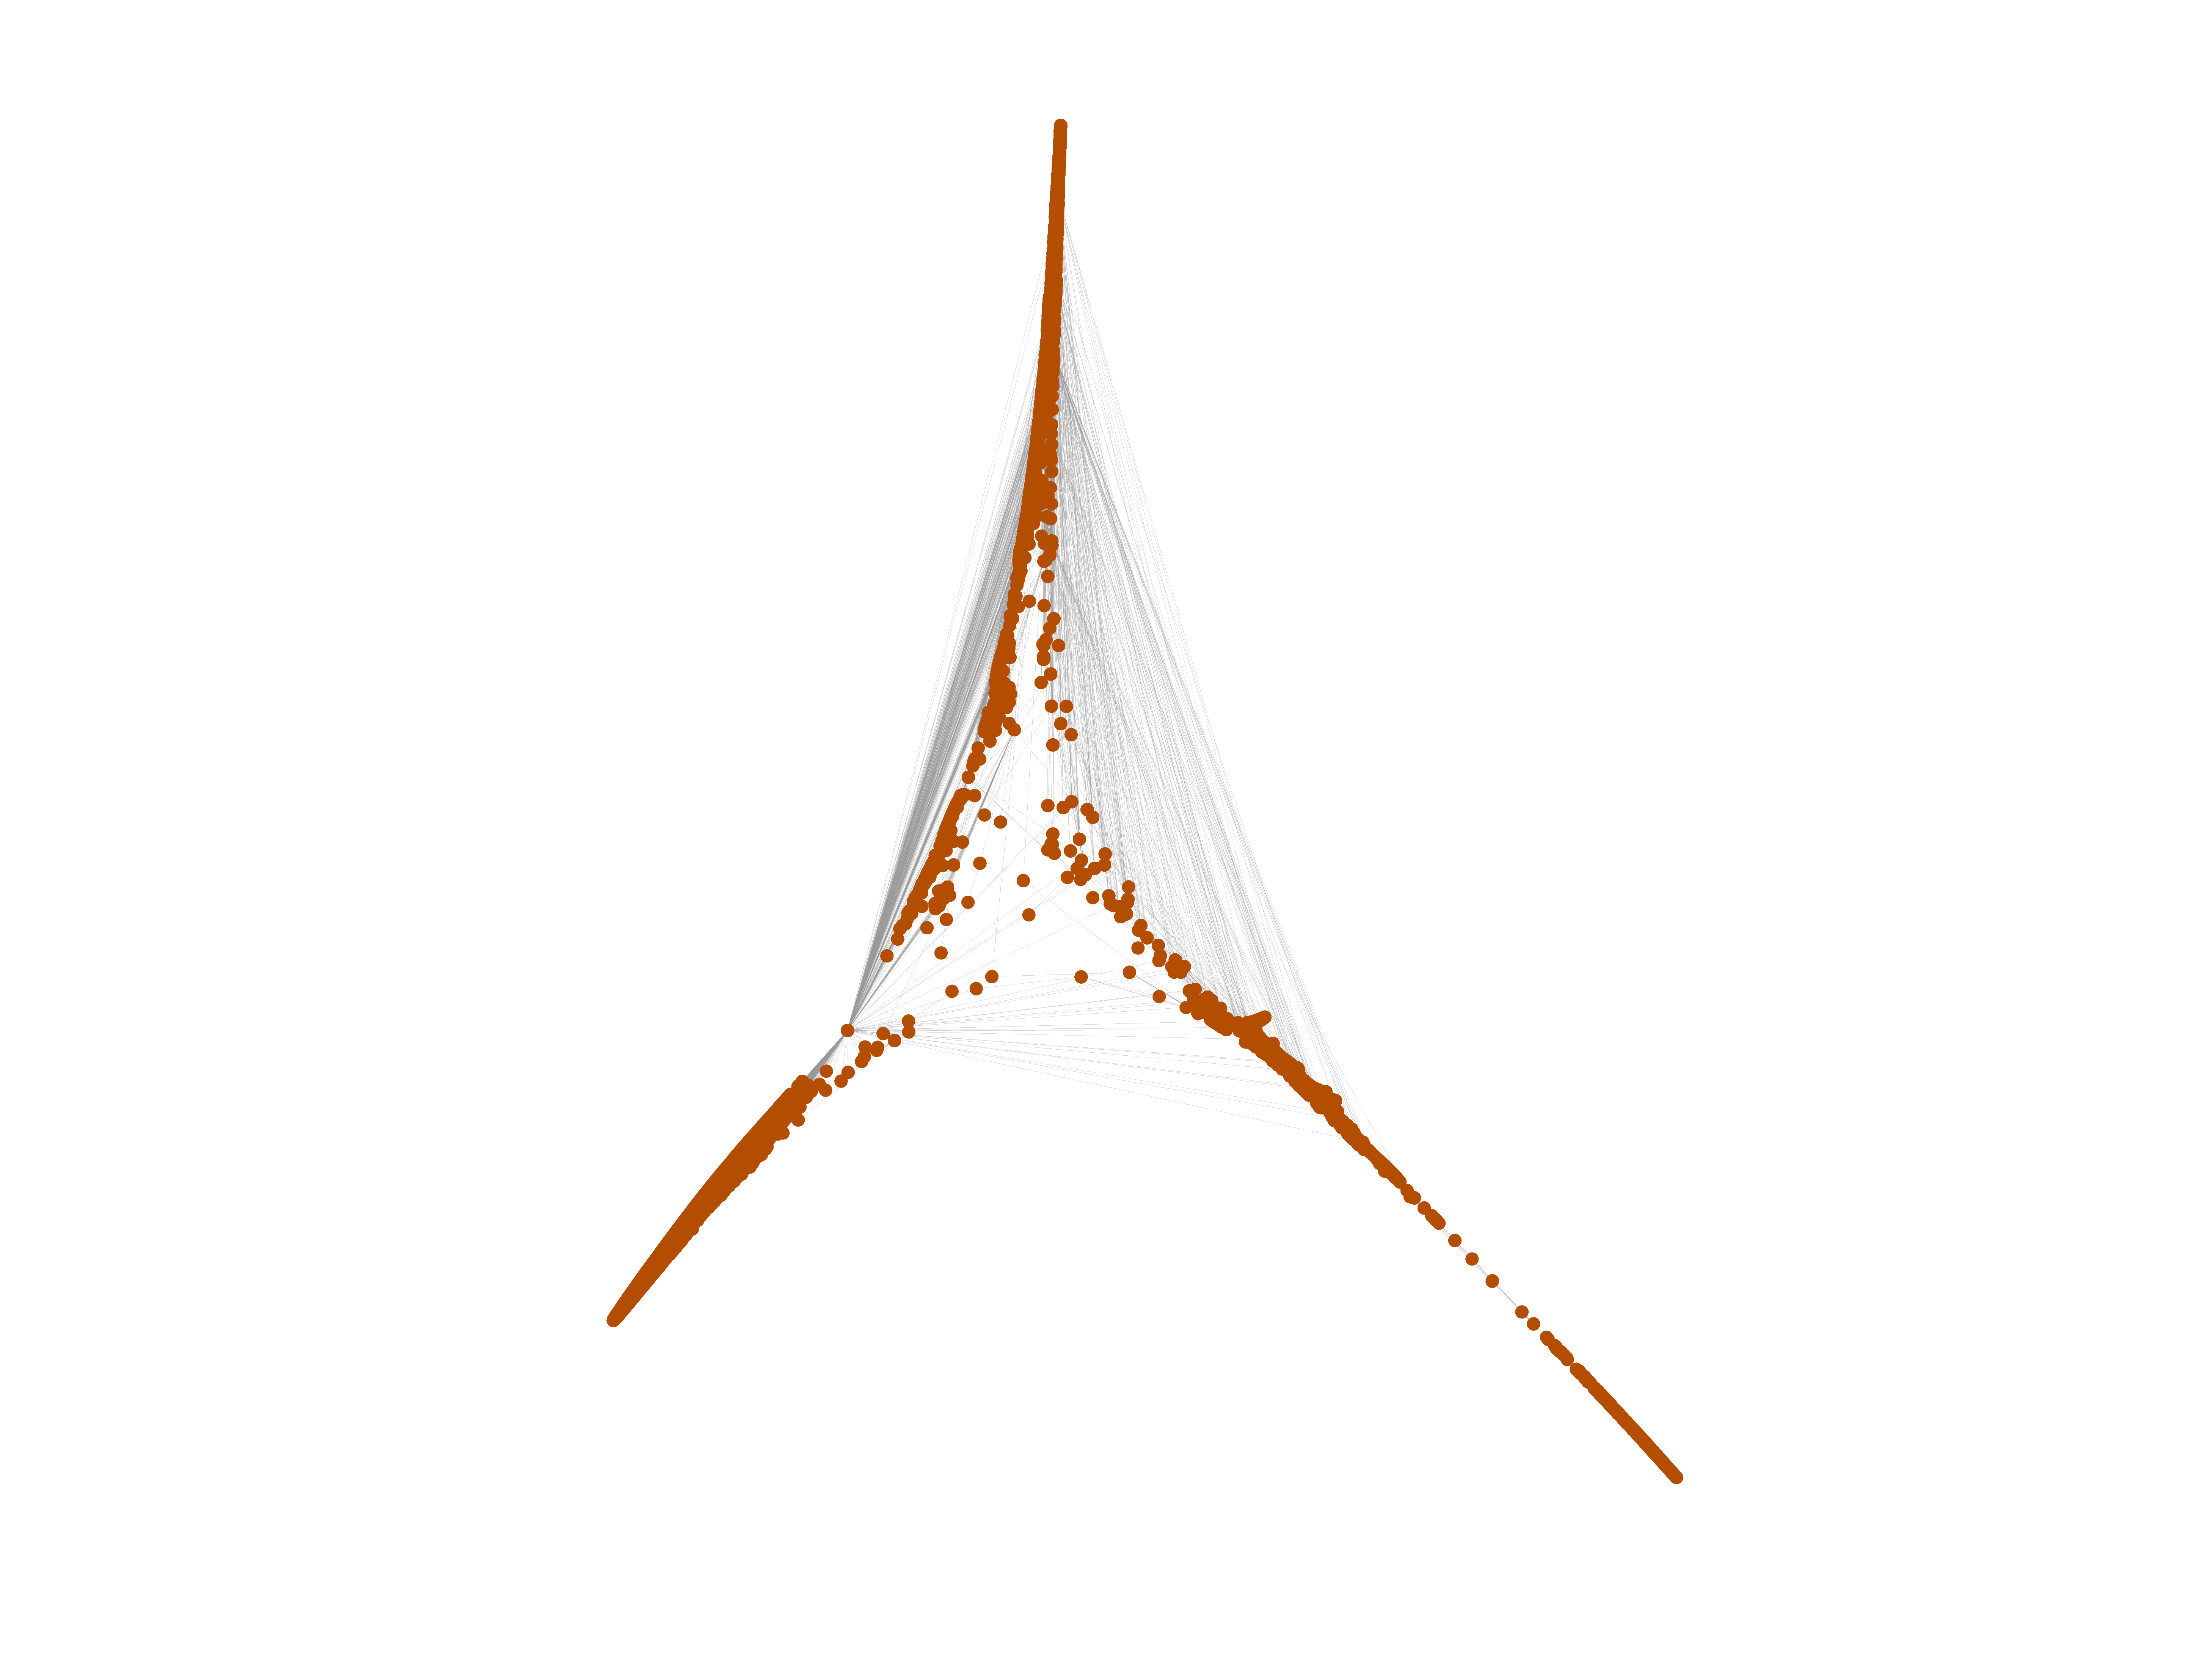
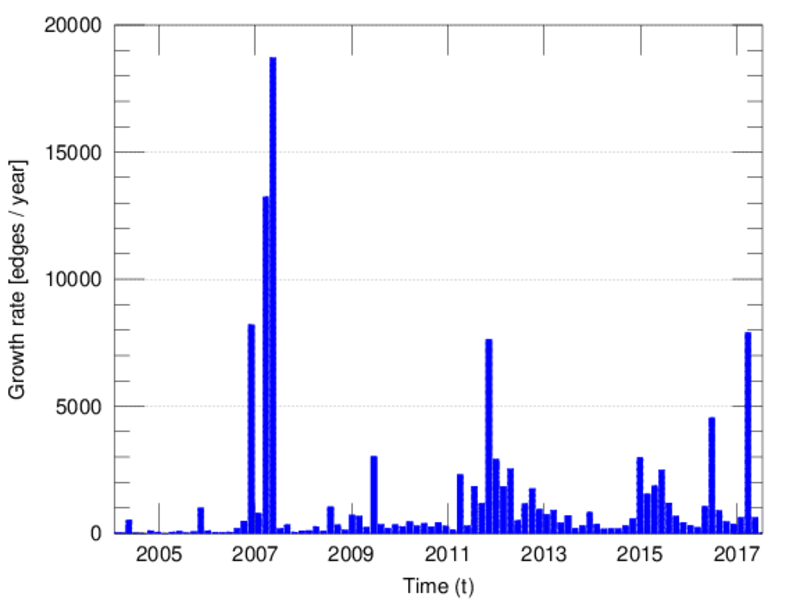
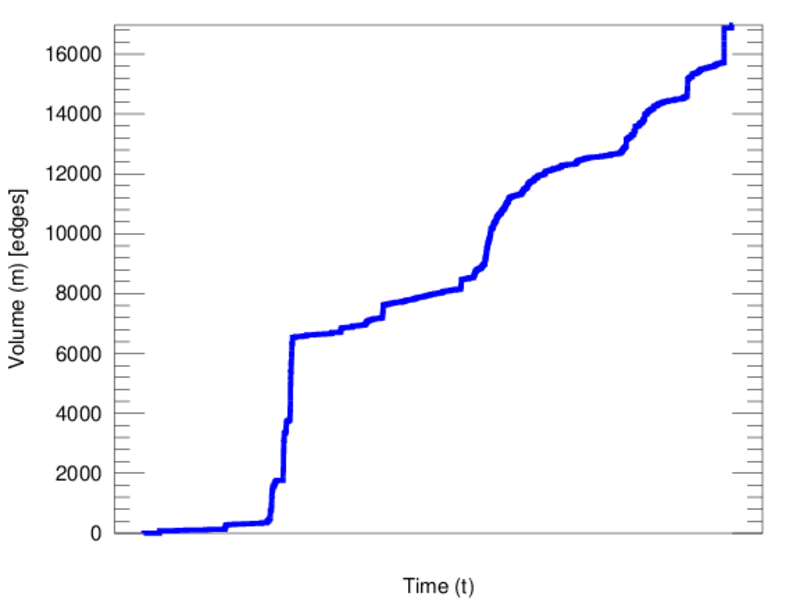
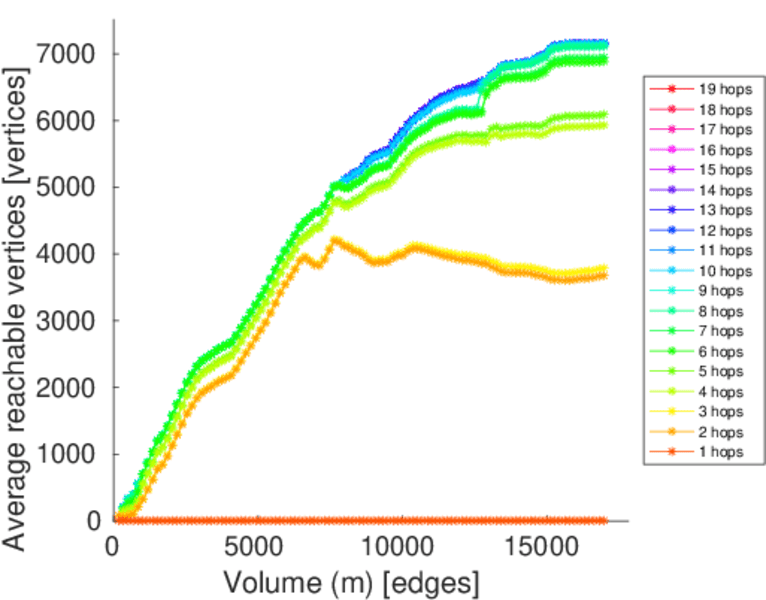
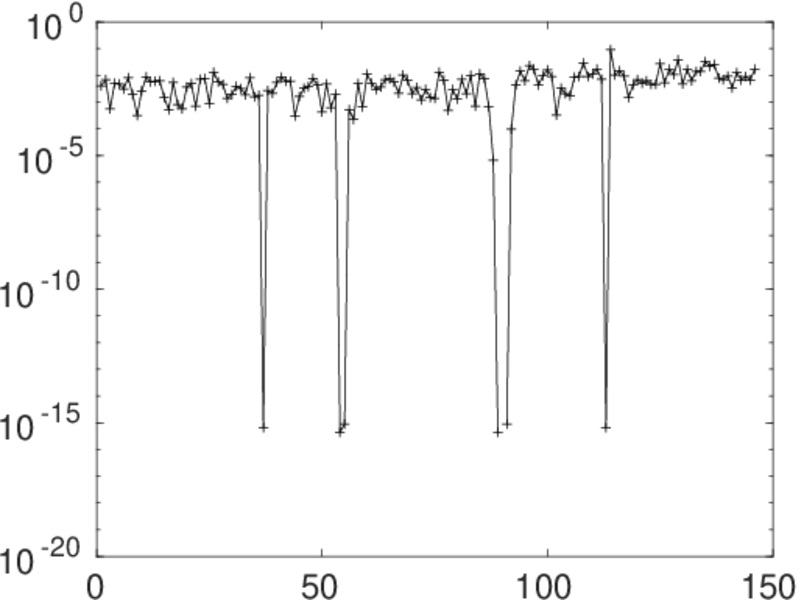
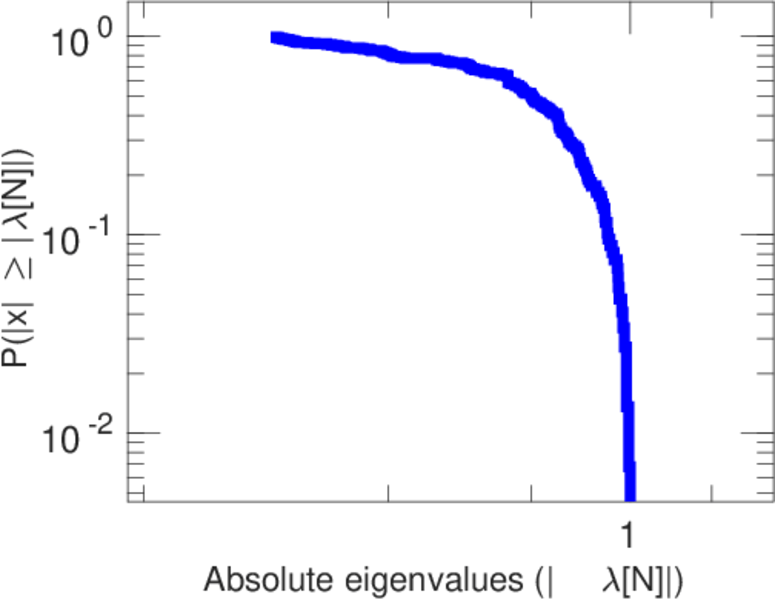
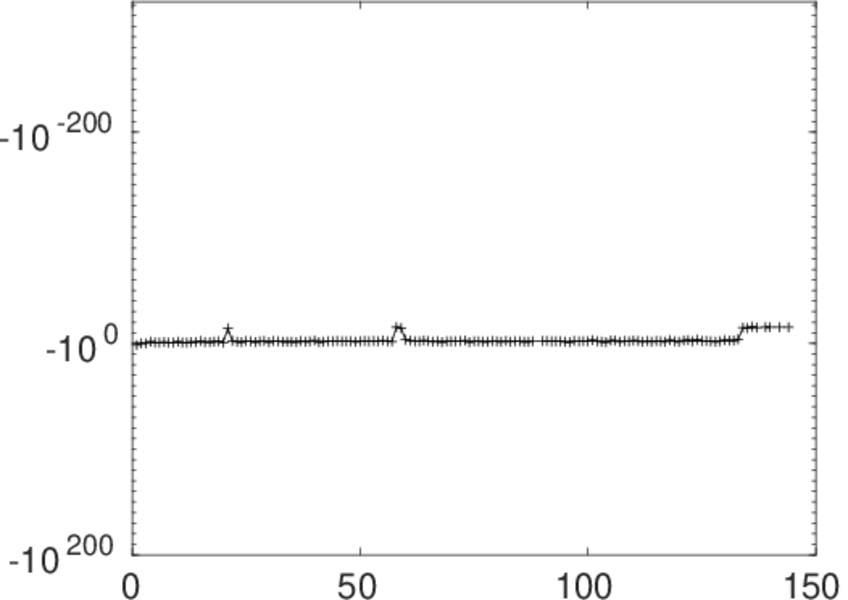
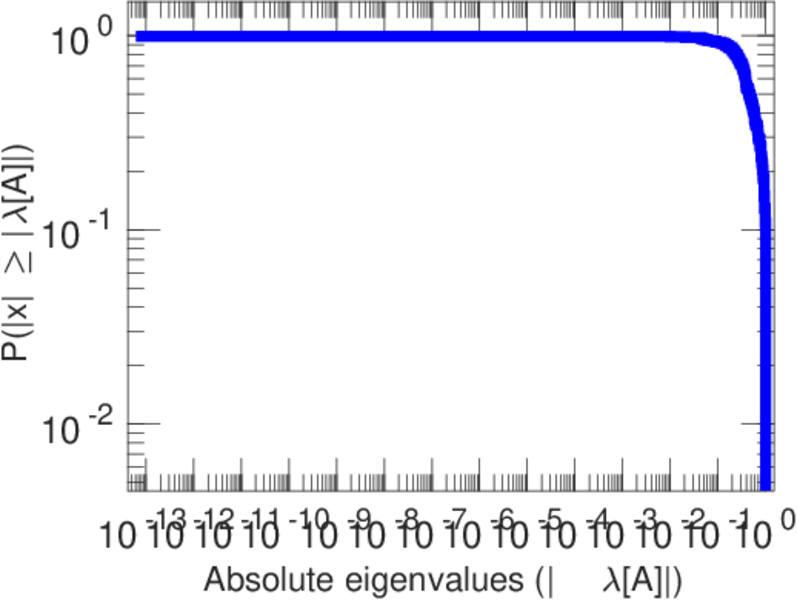
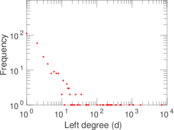
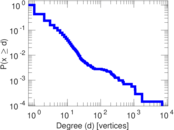
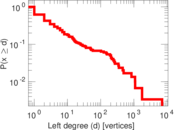
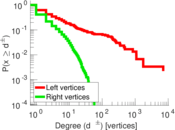
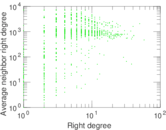
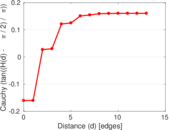
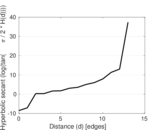
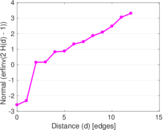
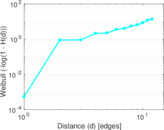
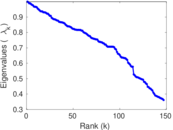
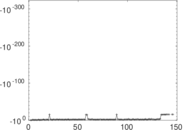
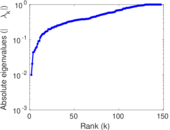
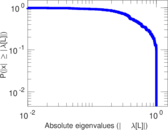
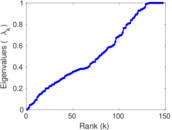
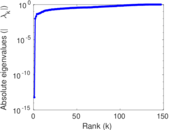
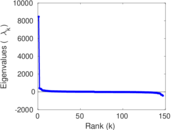
Plots


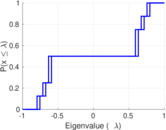
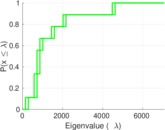


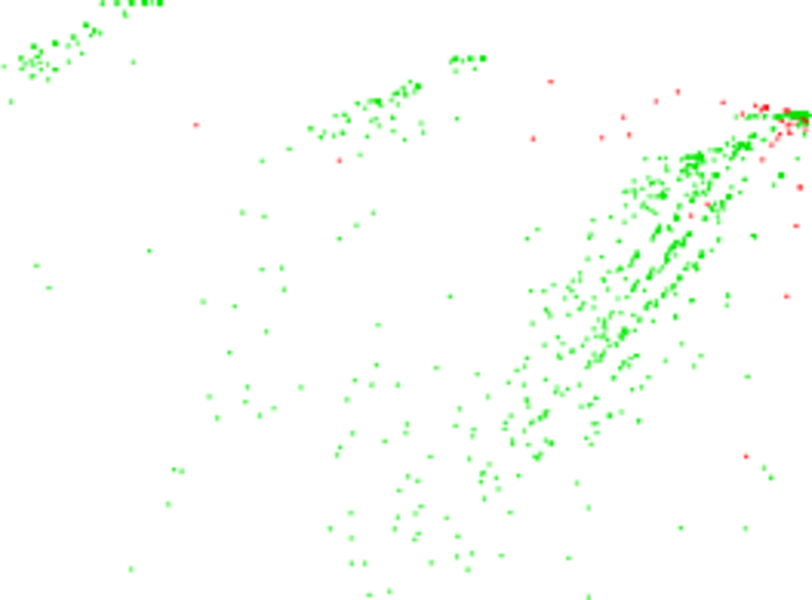
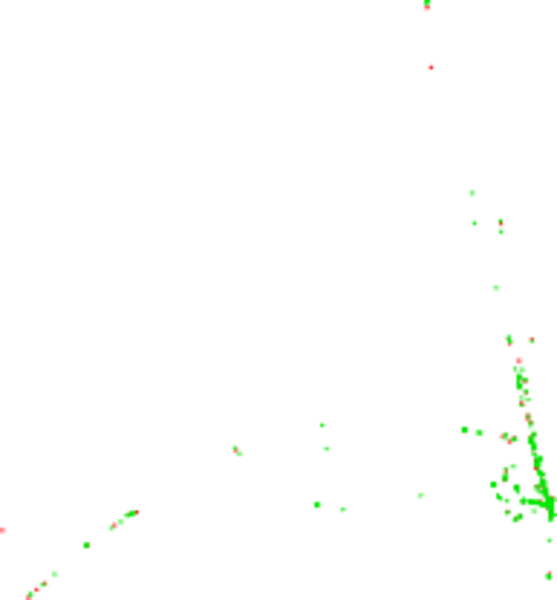
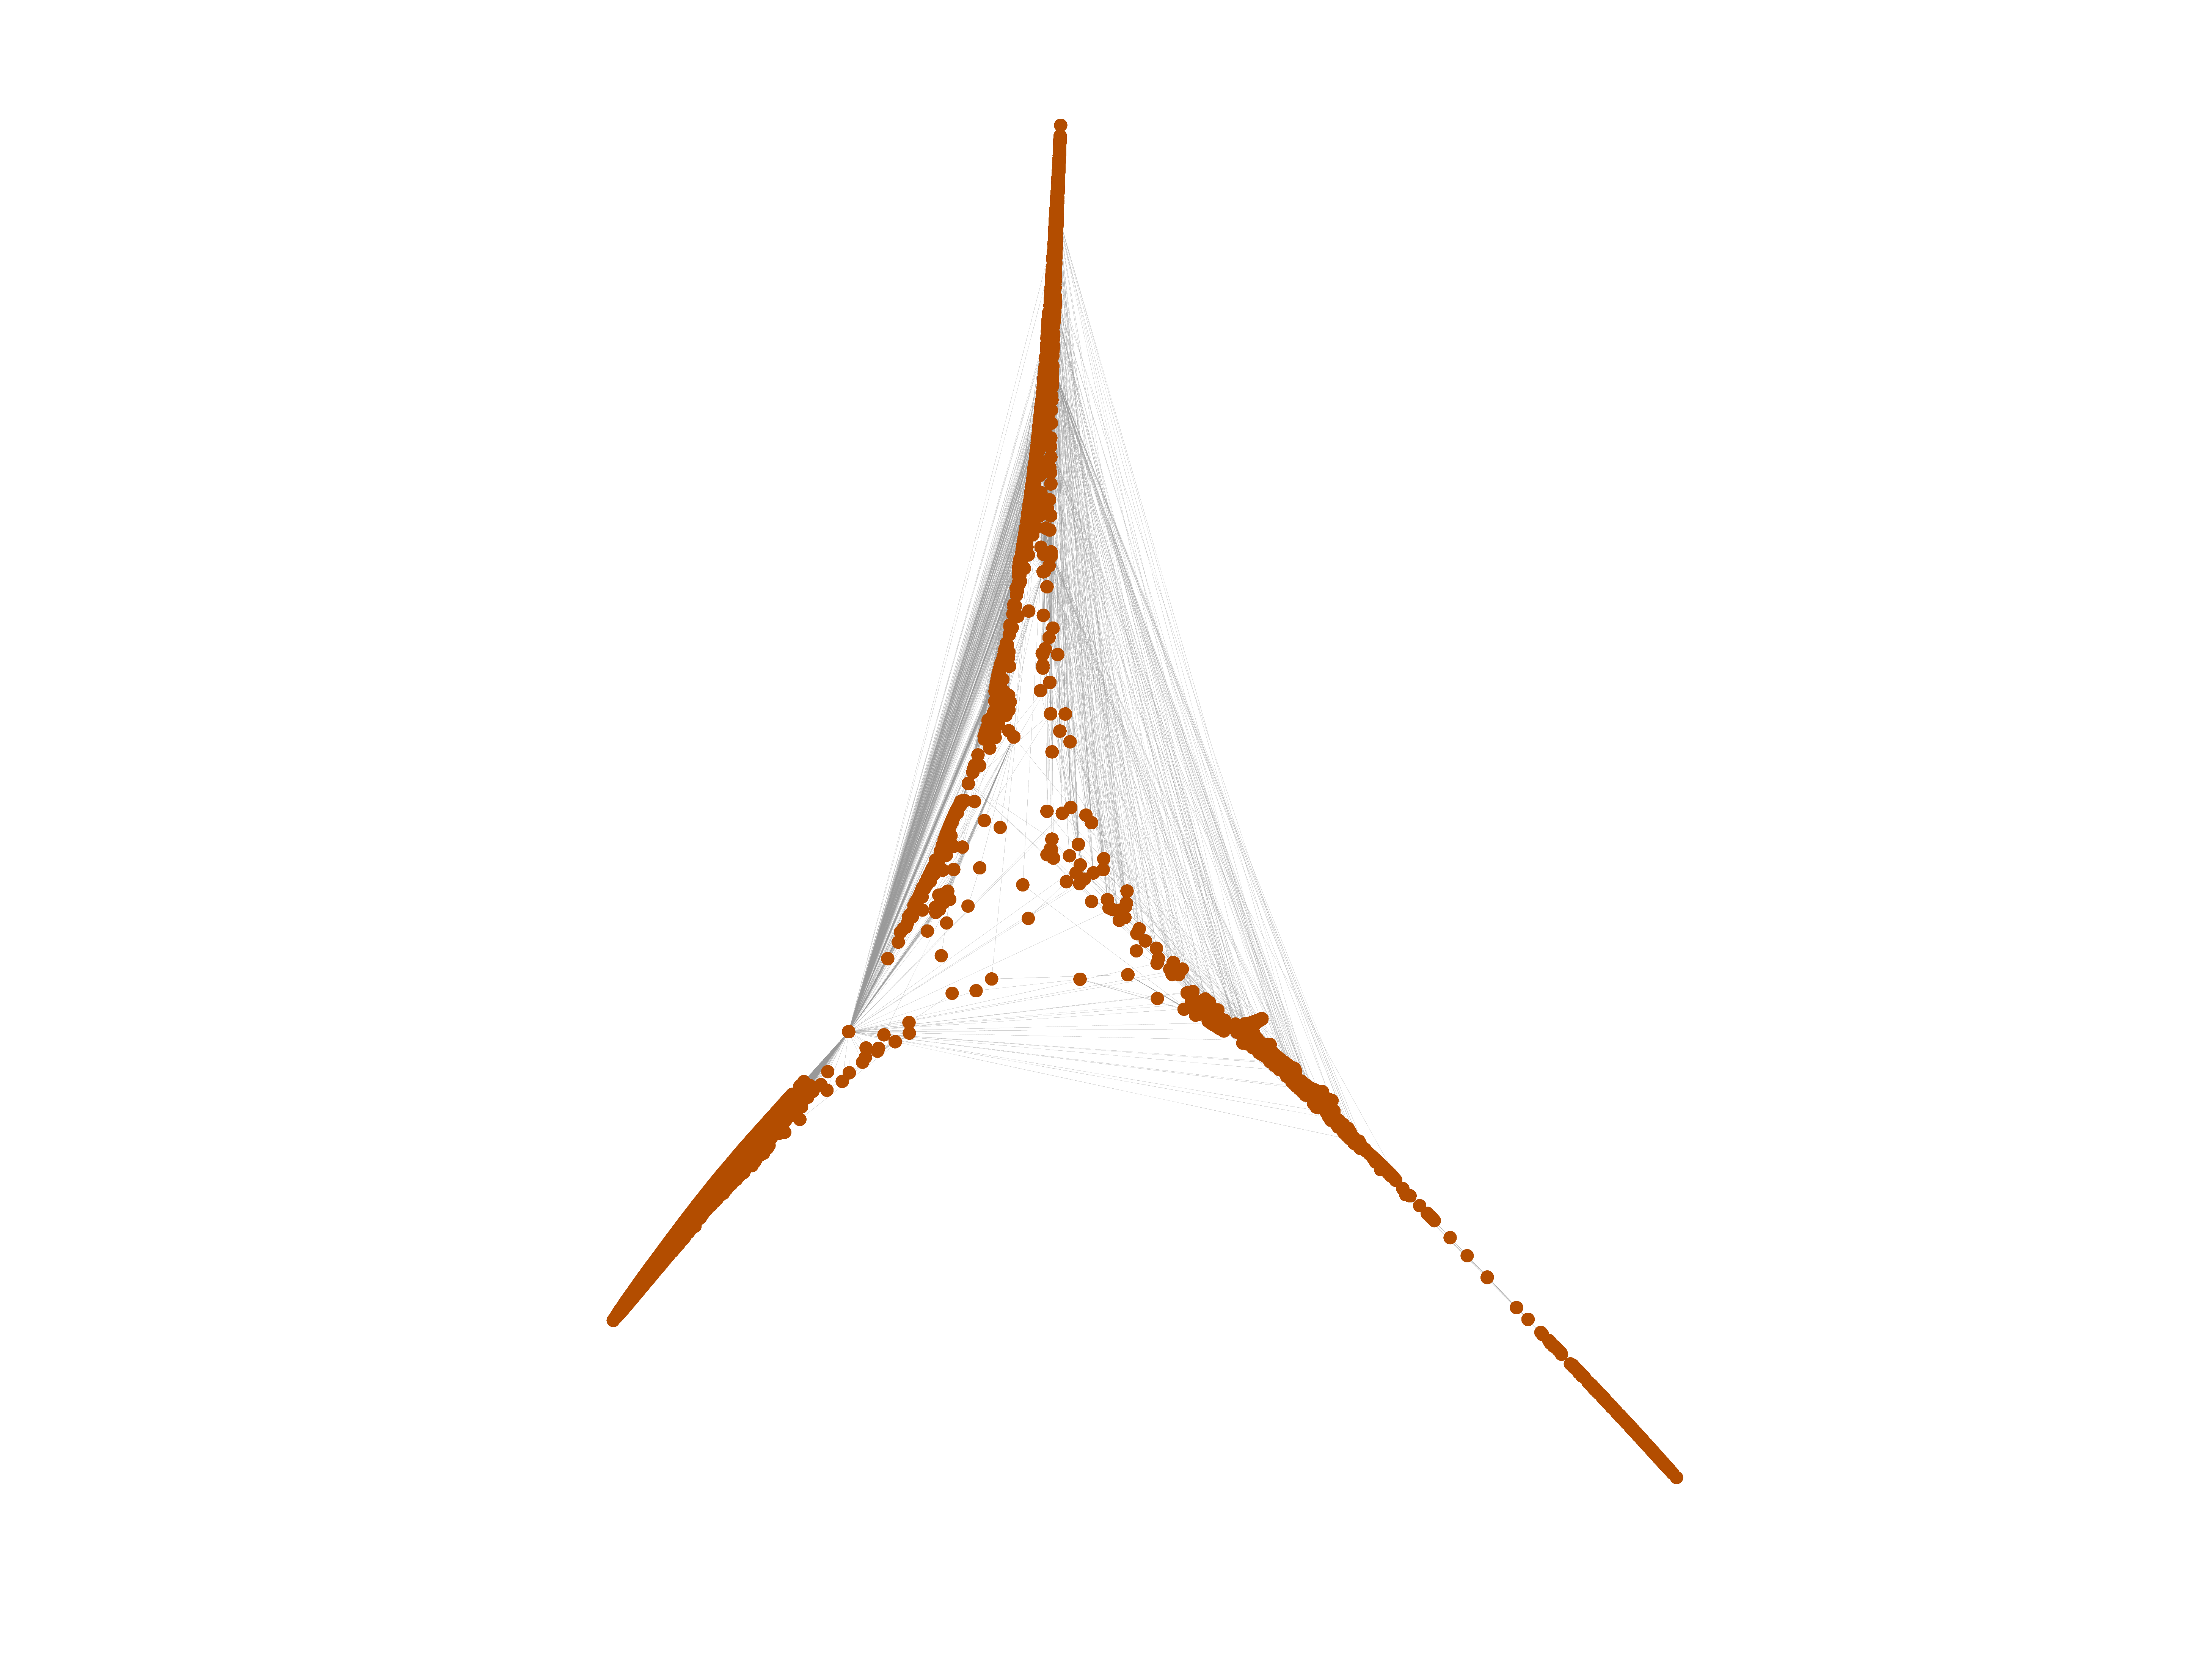
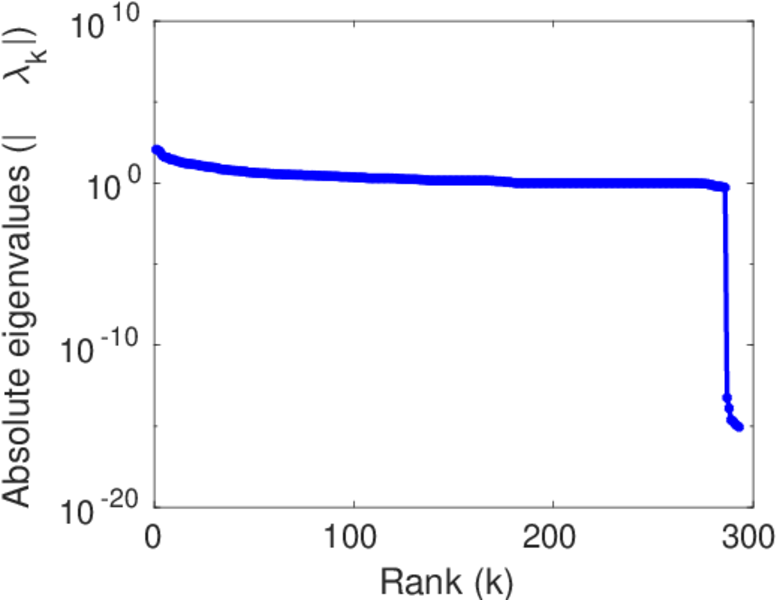
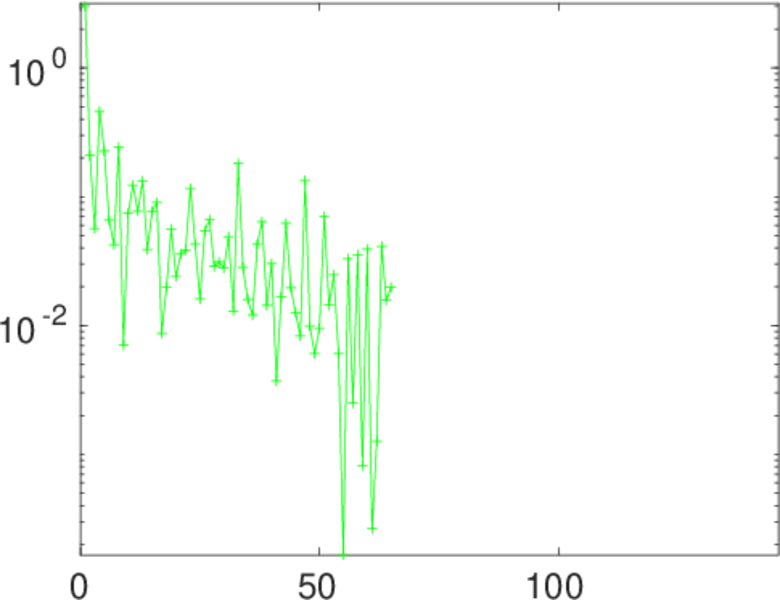
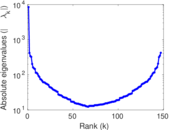
Matrix decompositions plots


Downloads
References
|
[1]
|
Jérôme Kunegis.
KONECT – The Koblenz Network Collection.
In Proc. Int. Conf. on World Wide Web Companion, pages
1343–1350, 2013.
[ http ]
|
|
[2]
|
Wikimedia Foundation.
Wikimedia downloads.
http://dumps.wikimedia.org/, January 2010.
|
 KONECT ‣ Networks ‣
Buy Me a Coffee
KONECT ‣ Networks ‣
Buy Me a Coffee