Wiktionary edits (uz)
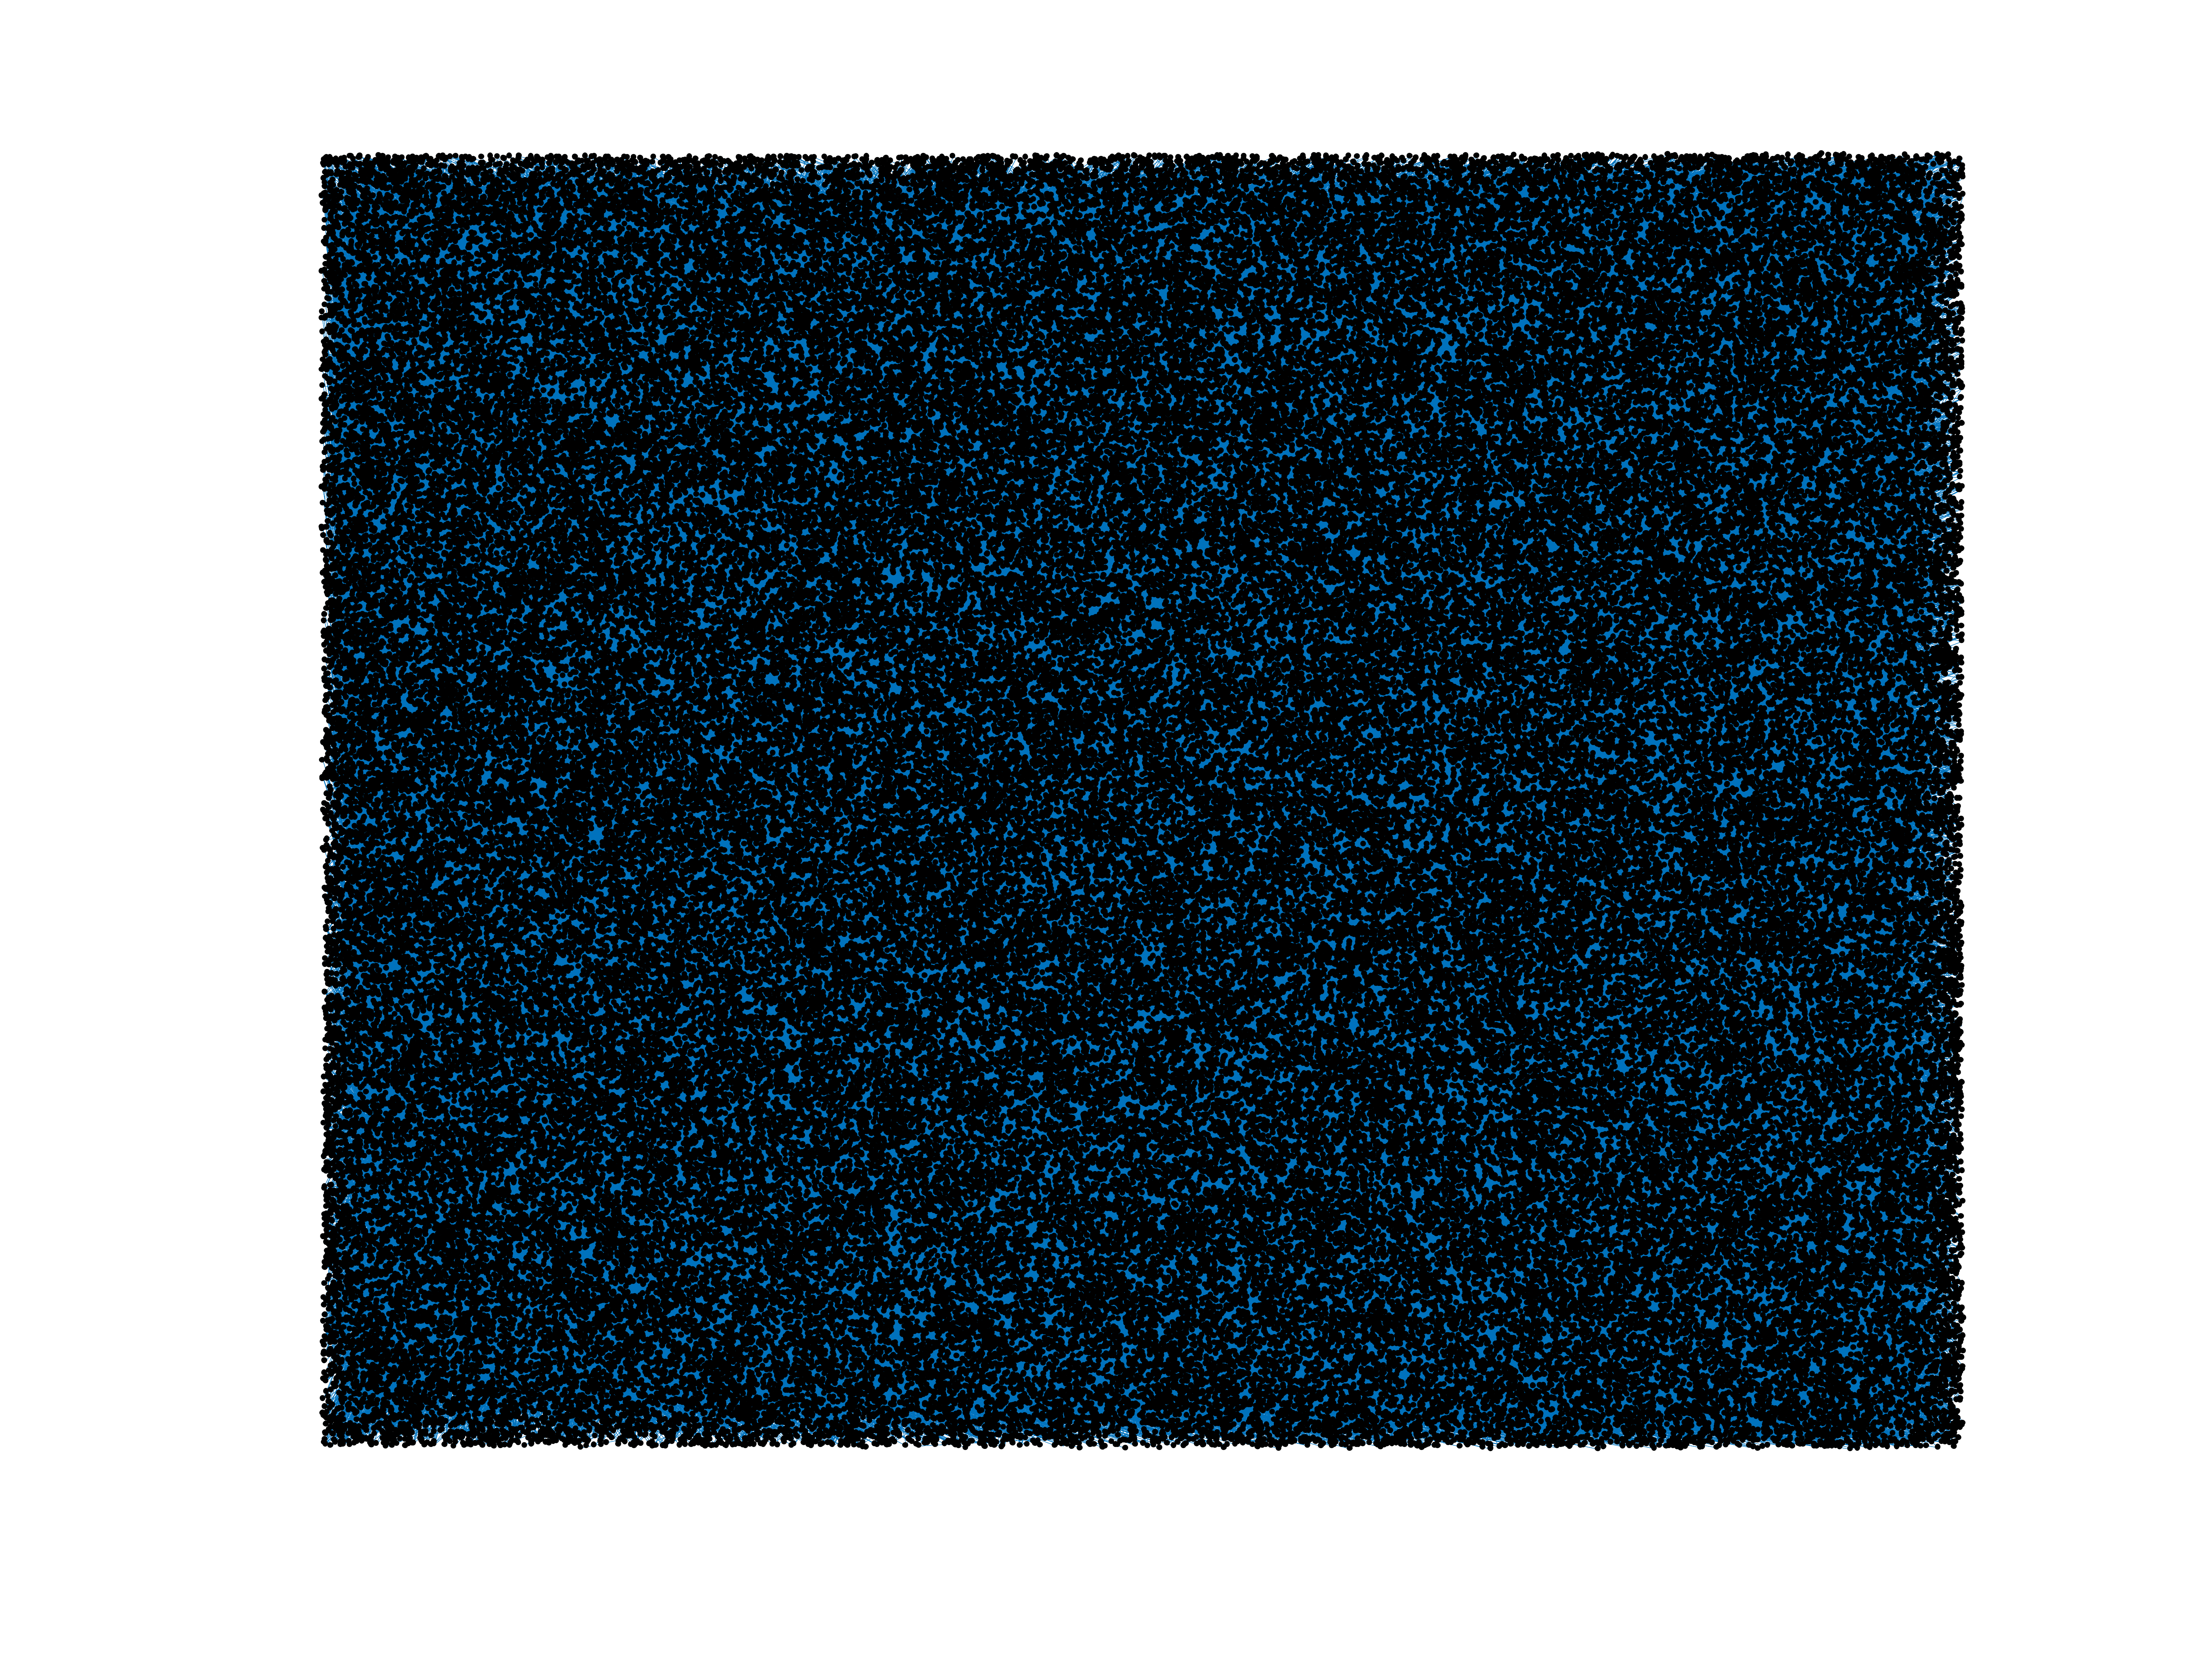
This is the bipartite edit network of the Uzbek Wiktionary. It contains users
and pages from the Uzbek Wiktionary, connected by edit events. Each edge
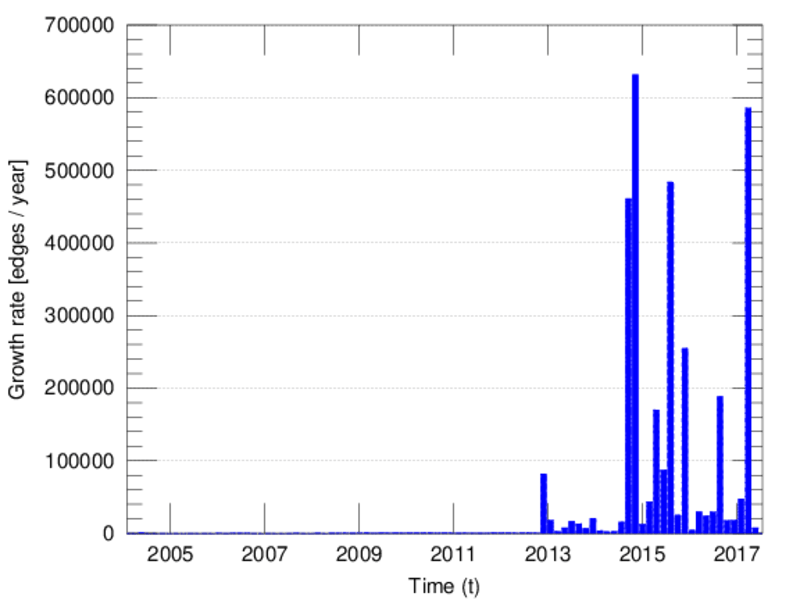
represents an edit. The dataset includes the timestamp of each edit.
Metadata
Statistics
| Size | n = | 153,595
|
| Left size | n1 = | 306
|
| Right size | n2 = | 153,289
|
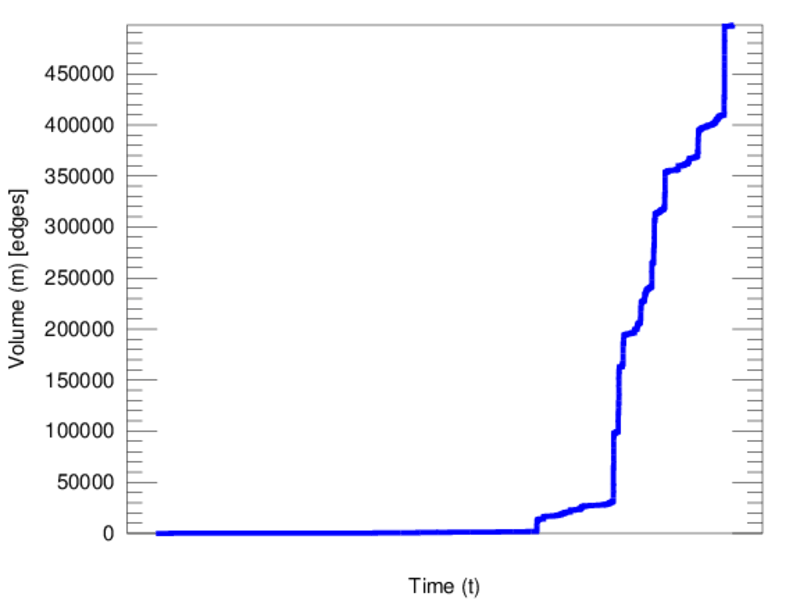
| Volume | m = | 497,719
|
| Unique edge count | m̿ = | 315,106
|
| Wedge count | s = | 12,363,094,229
|
| Claw count | z = | 423,945,914,506,203
|
| Cross count | x = | 1.174 × 10¹⁹
|
| Square count | q = | 3,880,891,968
|
| 4-Tour count | T4 = | 80,500,143,180
|
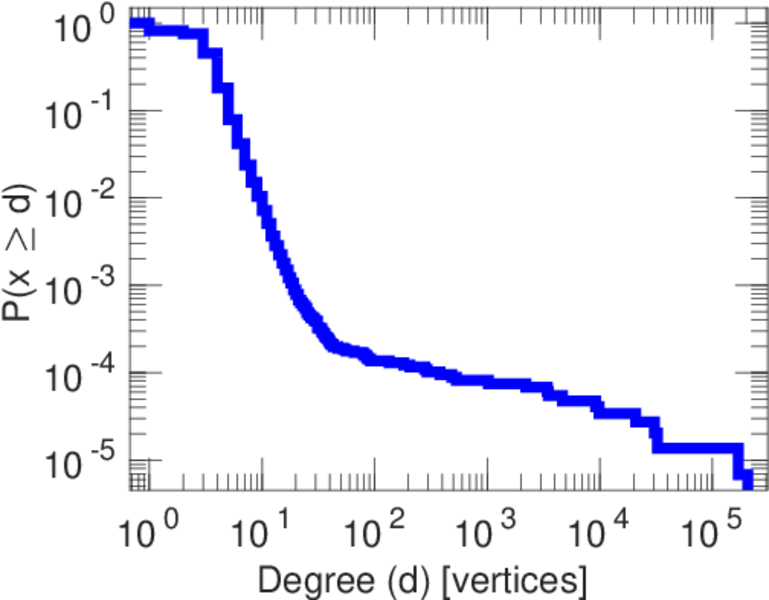
| Maximum degree | dmax = | 206,010
|
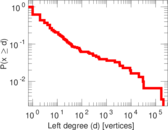
| Maximum left degree | d1max = | 206,010
|
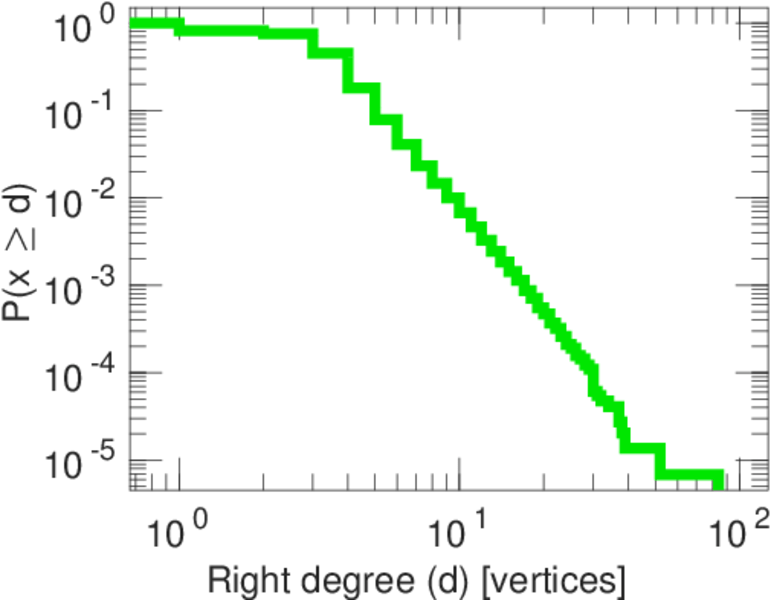
| Maximum right degree | d2max = | 84
|
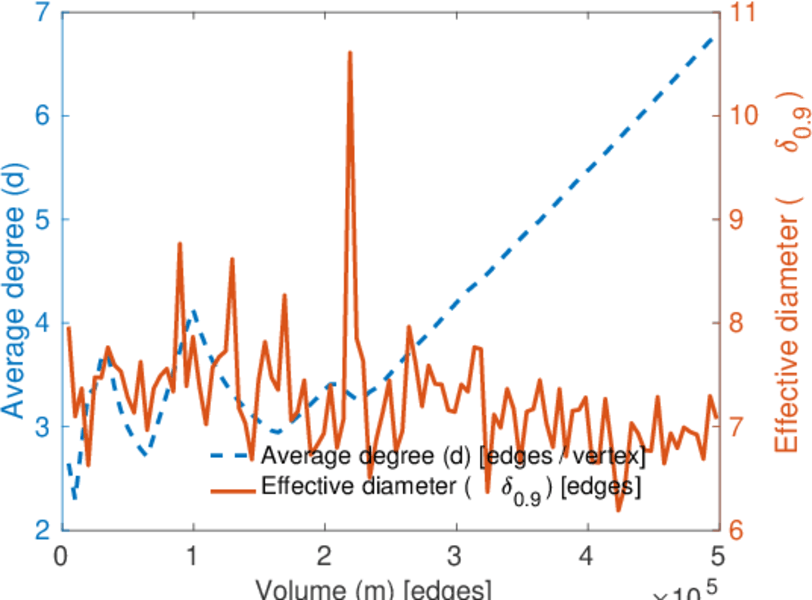
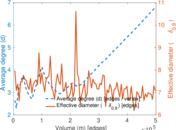
| Average degree | d = | 6.480 93
|
| Average left degree | d1 = | 1,626.53
|
| Average right degree | d2 = | 3.246 93
|
| Fill | p = | 0.006 717 76
|
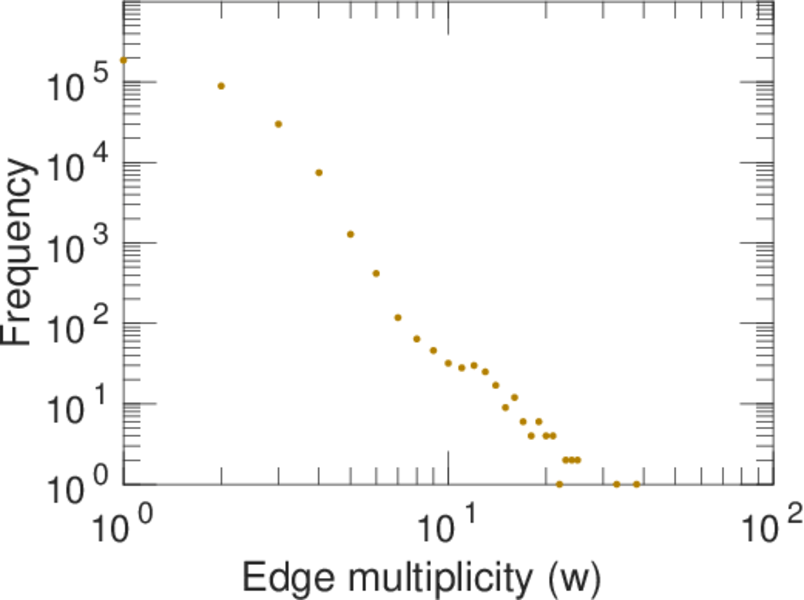
| Average edge multiplicity | m̃ = | 1.579 53
|
| Size of LCC | N = | 146,647
|
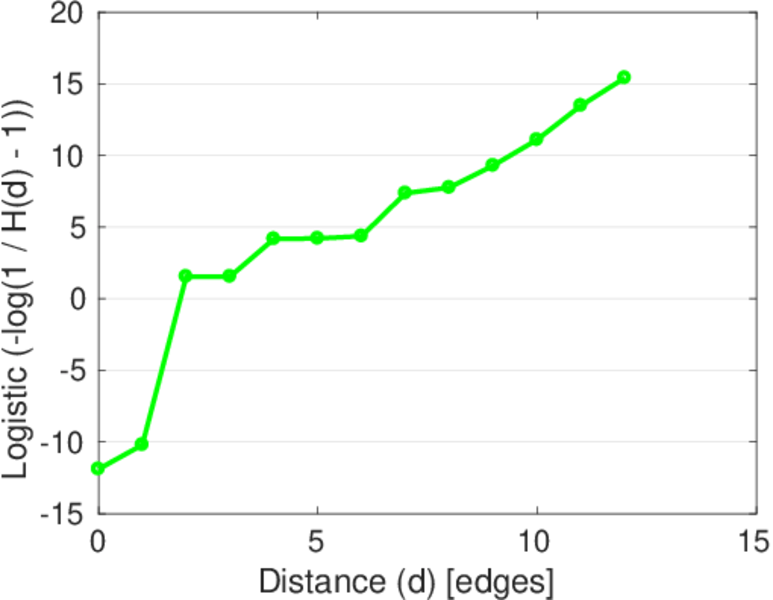
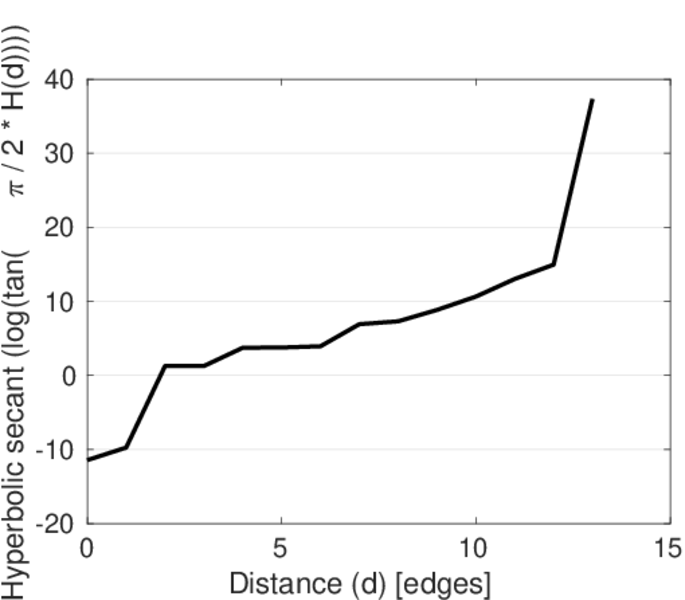
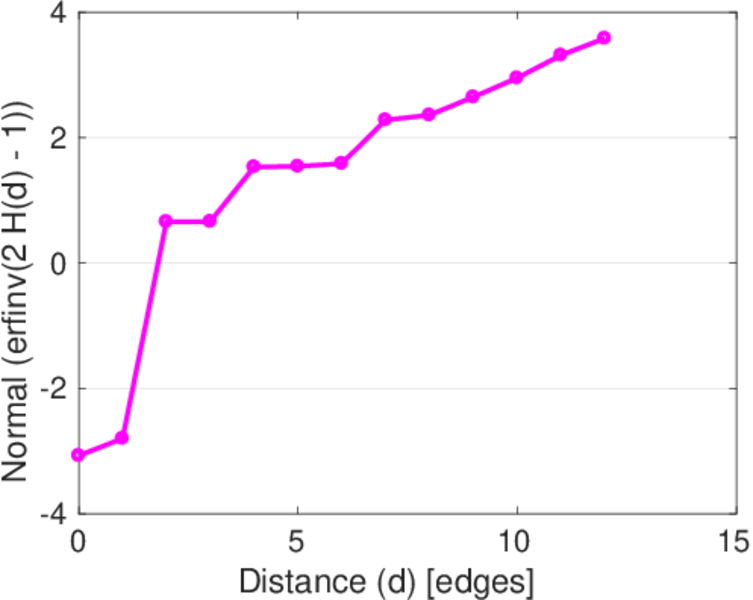
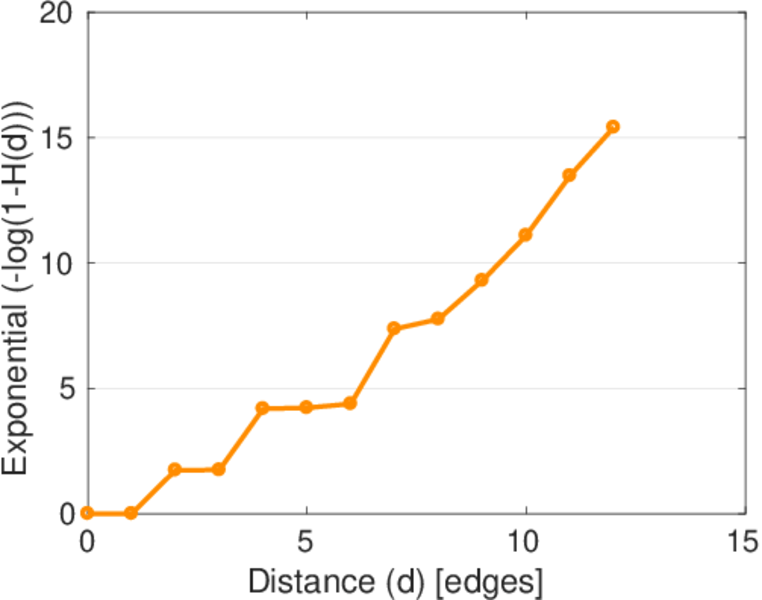
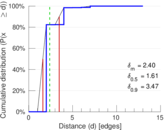
| Diameter | δ = | 16
|
| 50-Percentile effective diameter | δ0.5 = | 1.607 15
|
| 90-Percentile effective diameter | δ0.9 = | 3.472 11
|
| Median distance | δM = | 2
|
| Mean distance | δm = | 2.395 97
|
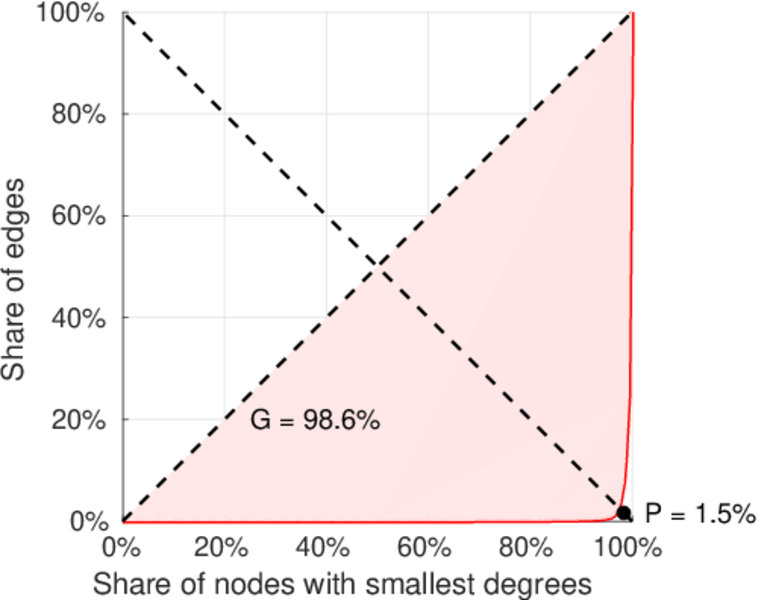
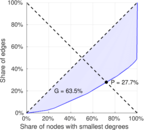
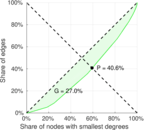
| Gini coefficient | G = | 0.634 492
|
| Balanced inequality ratio | P = | 0.277 254
|
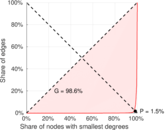
| Left balanced inequality ratio | P1 = | 0.014 920 1
|
| Right balanced inequality ratio | P2 = | 0.406 304
|
| Relative edge distribution entropy | Her = | 0.628 425
|
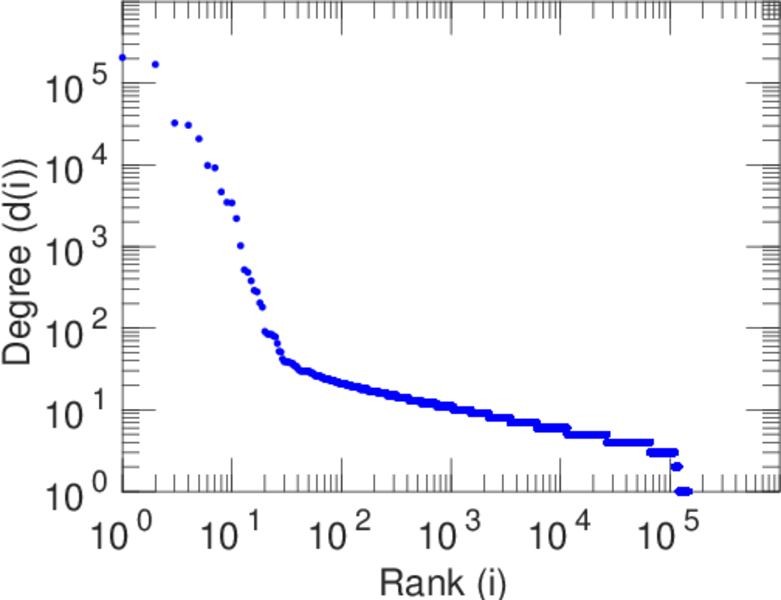
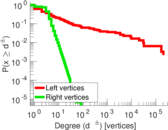
| Power law exponent | γ = | 2.491 18
|
| Tail power law exponent | γt = | 5.551 00
|
| Tail power law exponent with p | γ3 = | 5.551 00
|
| p-value | p = | 0.000 00
|
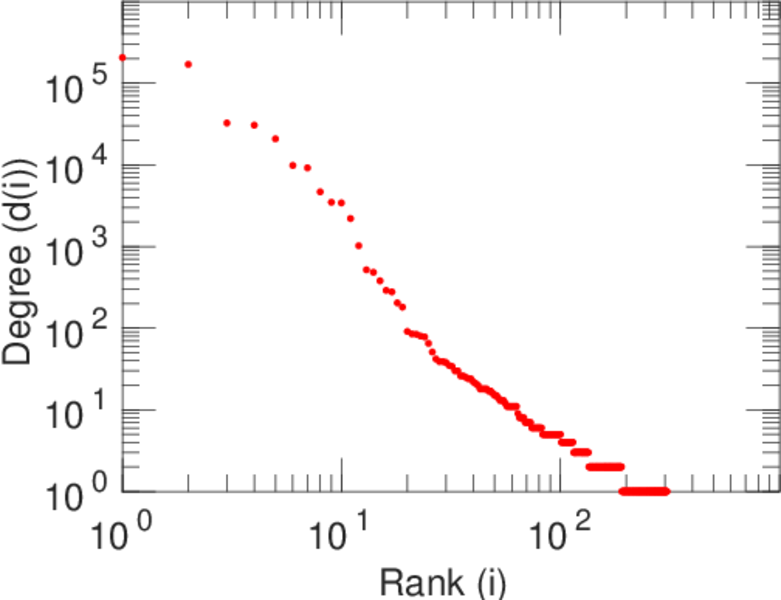
| Left tail power law exponent with p | γ3,1 = | 1.581 00
|
| Left p-value | p1 = | 0.001 000 00
|
| Right tail power law exponent with p | γ3,2 = | 7.991 00
|
| Right p-value | p2 = | 0.775 000
|
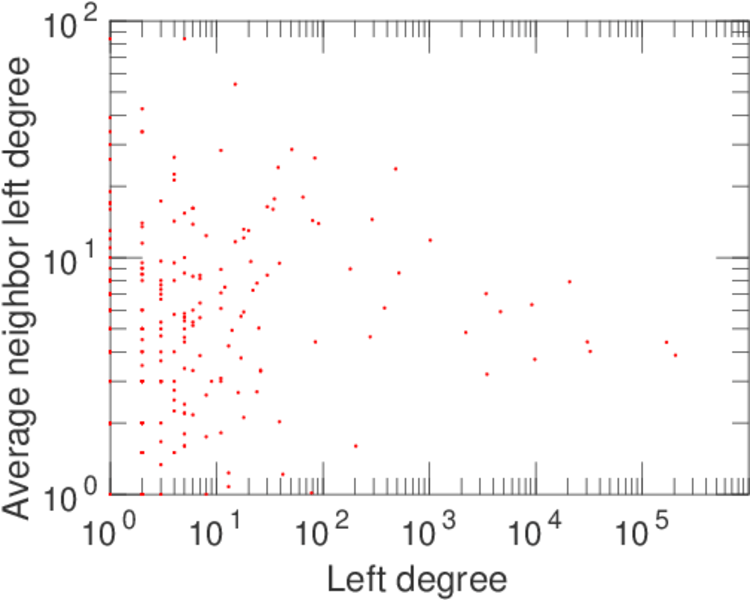
| Degree assortativity | ρ = | −0.361 688
|
| Degree assortativity p-value | pρ = | 0.000 00
|
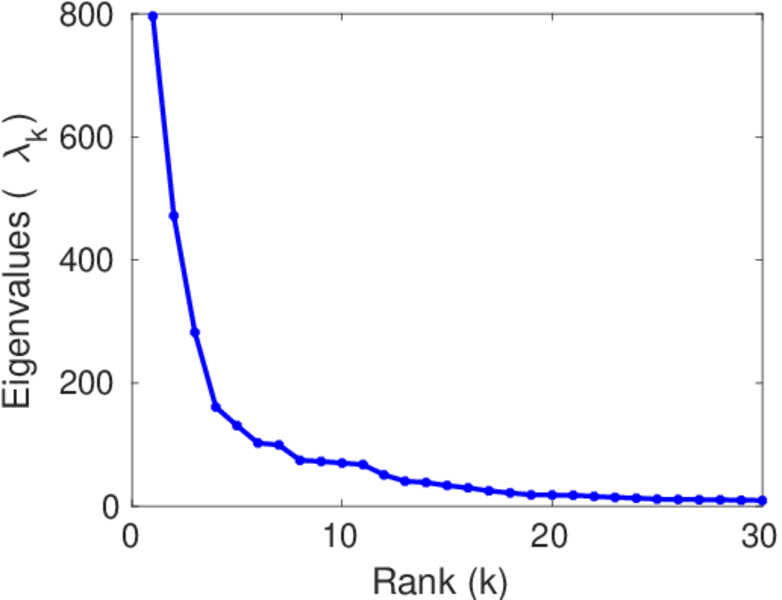
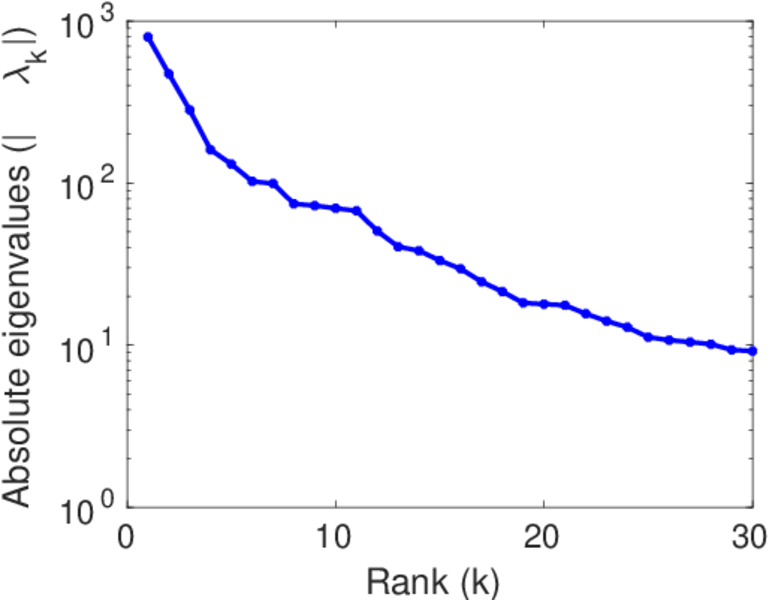
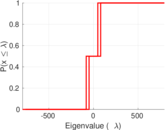
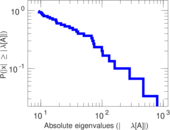
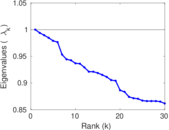
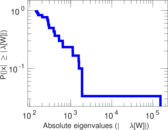
| Spectral norm | α = | 795.876
|
| Algebraic connectivity | a = | 0.016 215 9
|
| Spectral separation | |λ1[A] / λ2[A]| = | 1.687 97
|
| Controllability | C = | 146,378
|
| Relative controllability | Cr = | 0.995 999
|
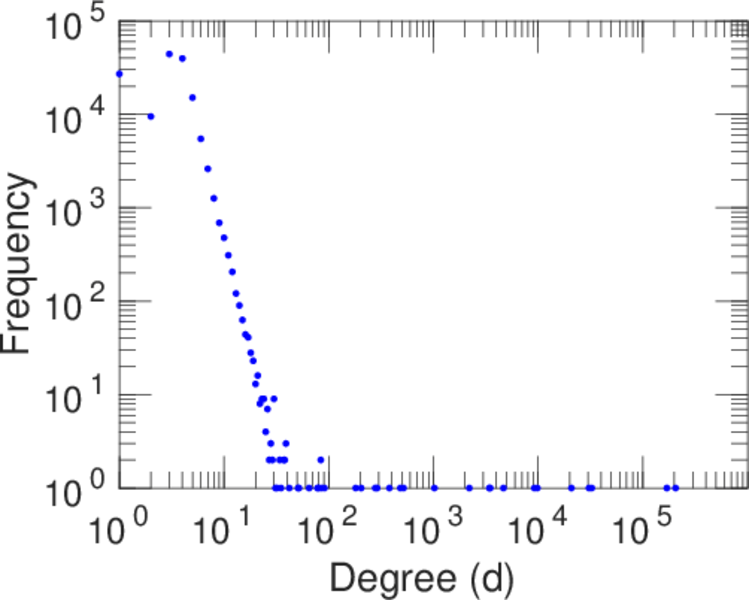
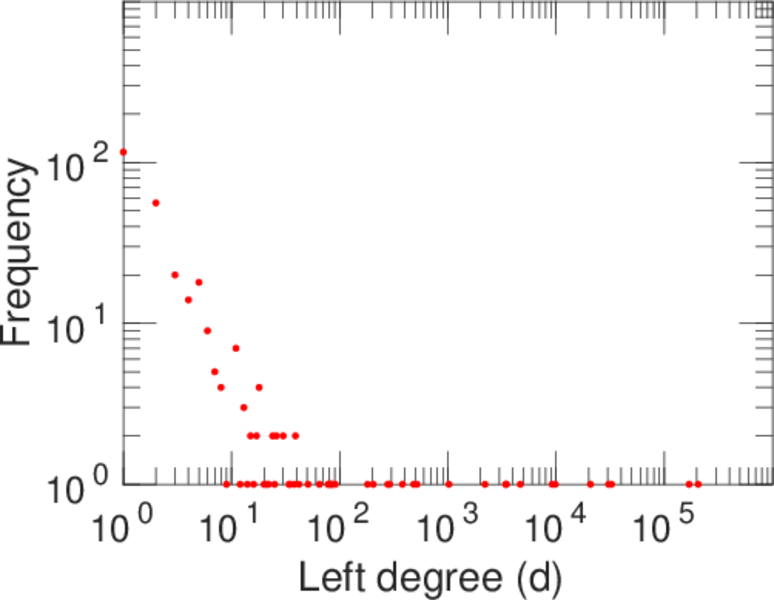
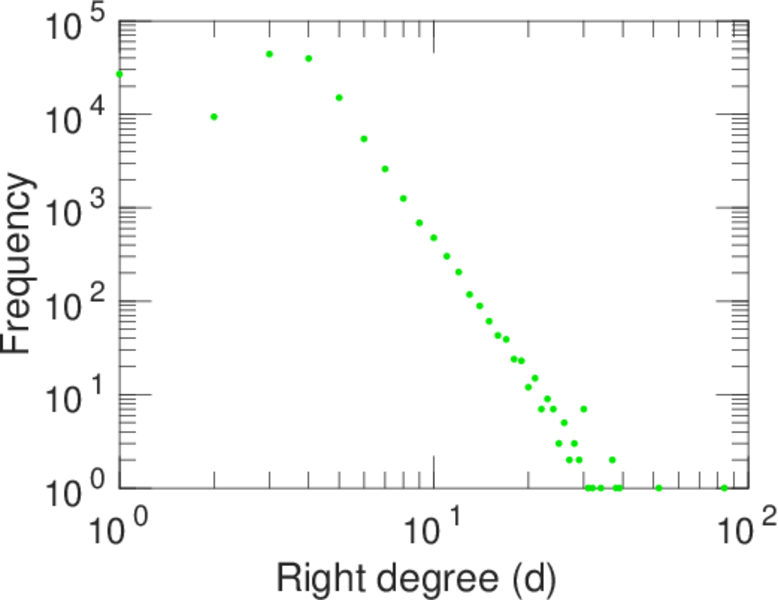
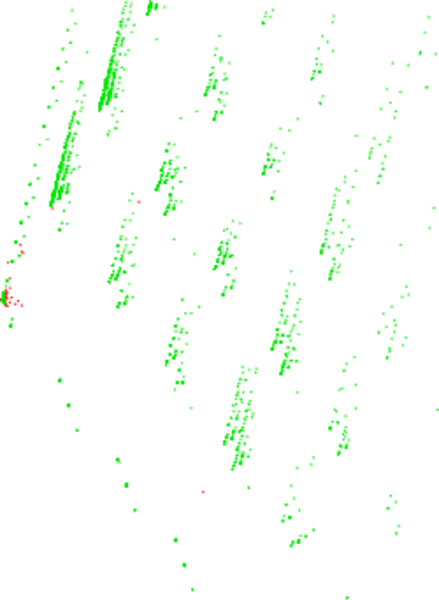
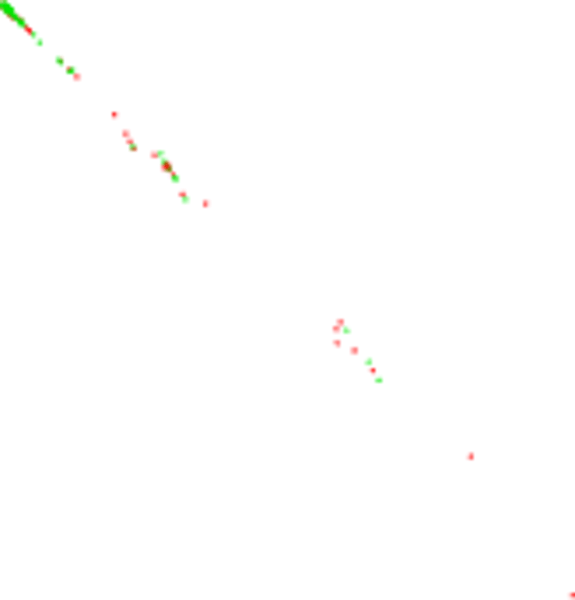
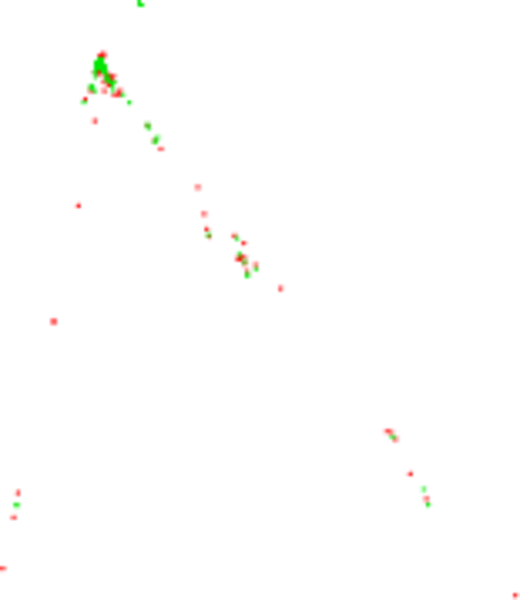
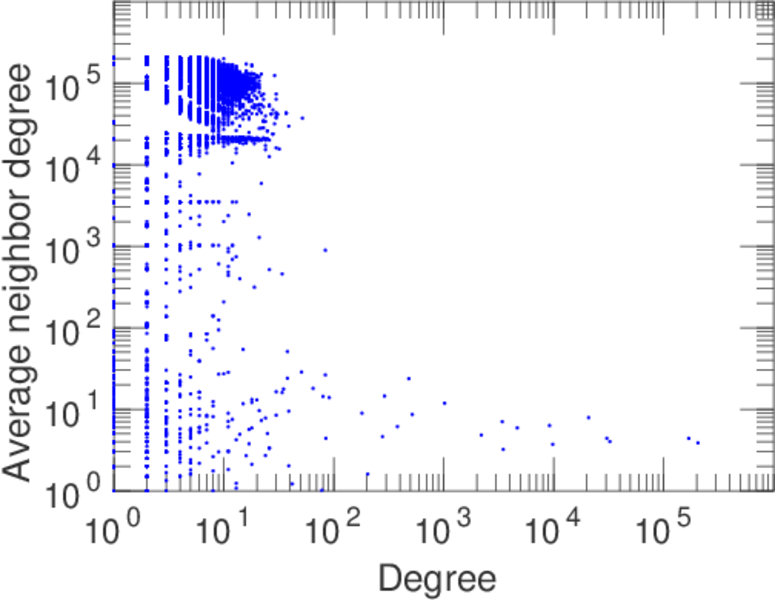
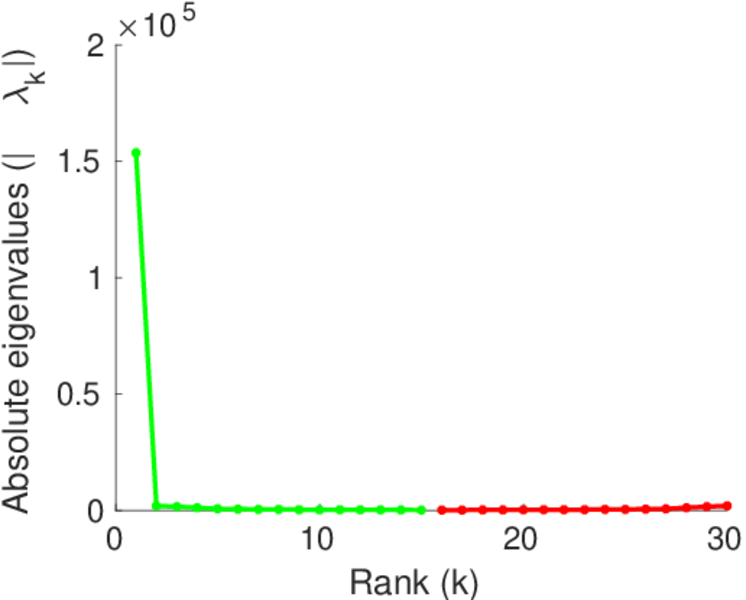
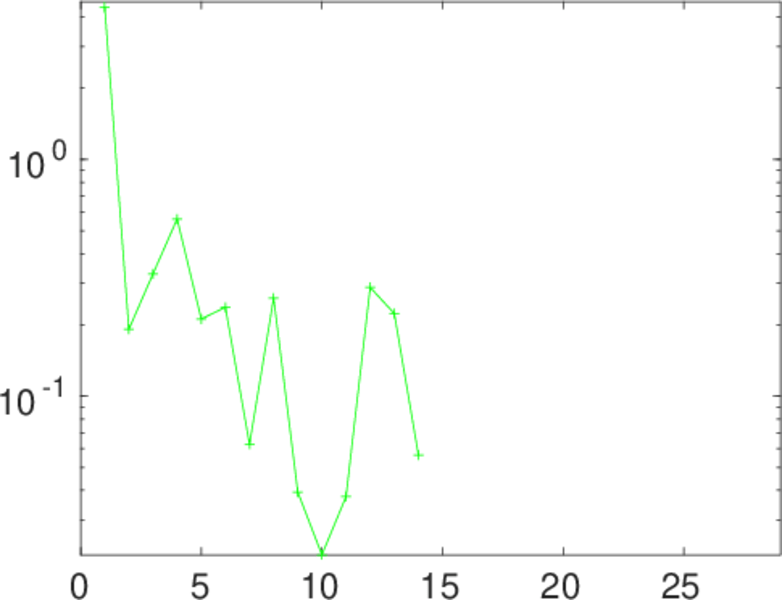
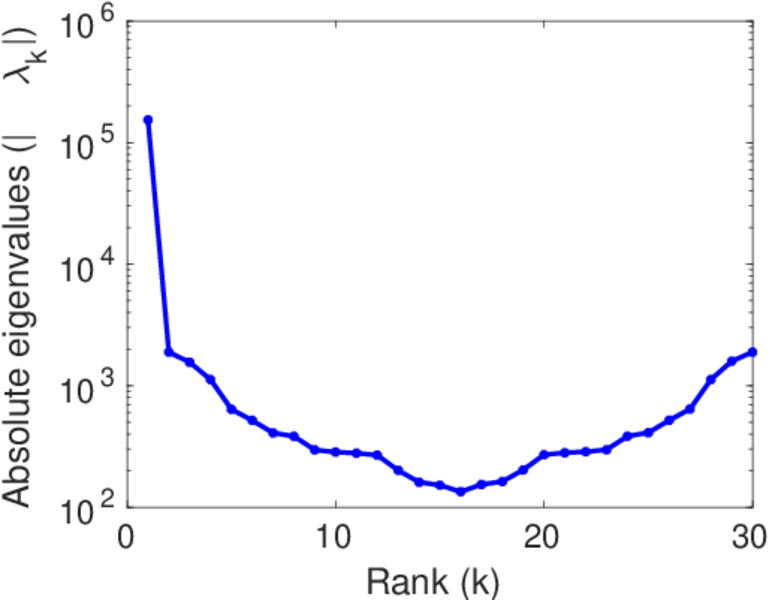
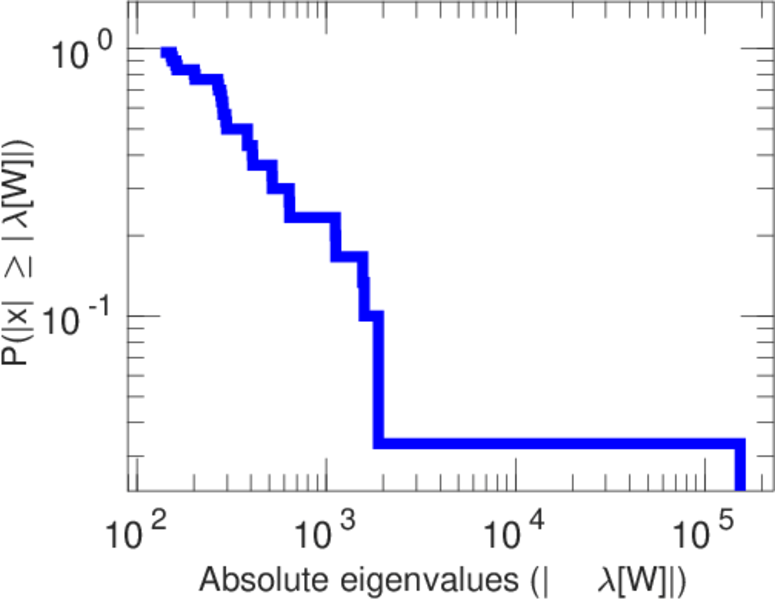
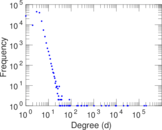
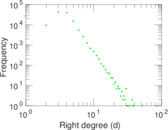
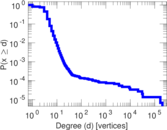
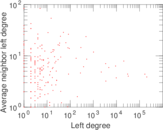
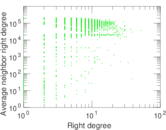
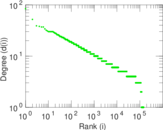
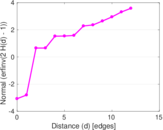
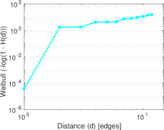
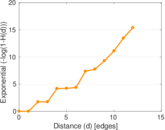
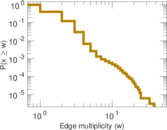
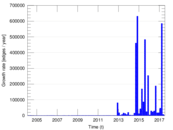
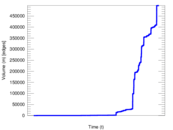
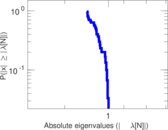
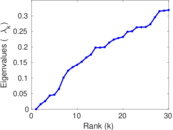
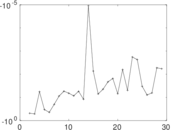
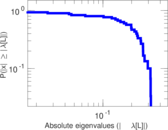
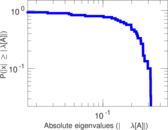
Plots


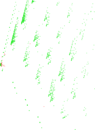


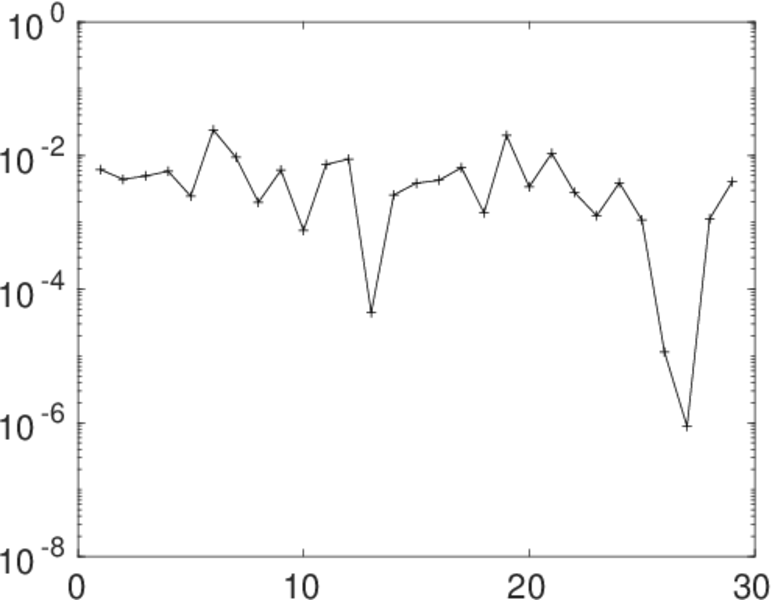
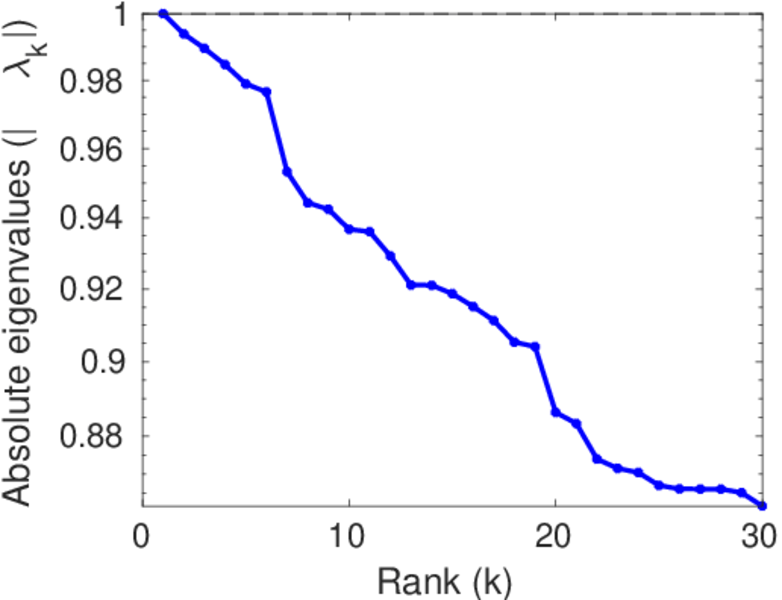
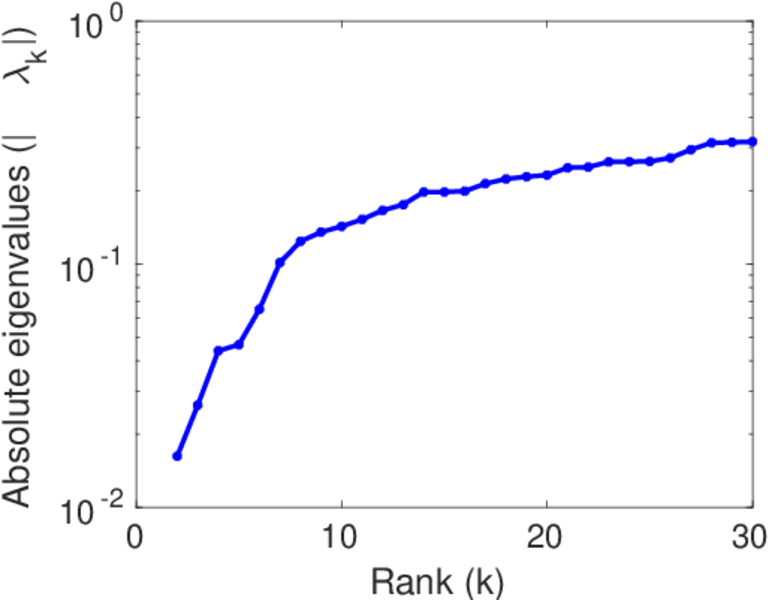
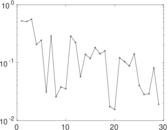
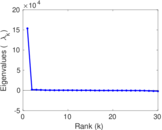
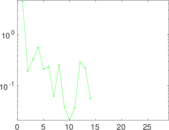
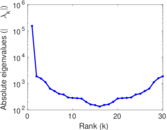
Matrix decompositions plots


Downloads
References
|
[1]
|
Jérôme Kunegis.
KONECT – The Koblenz Network Collection.
In Proc. Int. Conf. on World Wide Web Companion, pages
1343–1350, 2013.
[ http ]
|
|
[2]
|
Wikimedia Foundation.
Wikimedia downloads.
http://dumps.wikimedia.org/, January 2010.
|
 KONECT ‣ Networks ‣
Buy Me a Coffee
KONECT ‣ Networks ‣
Buy Me a Coffee