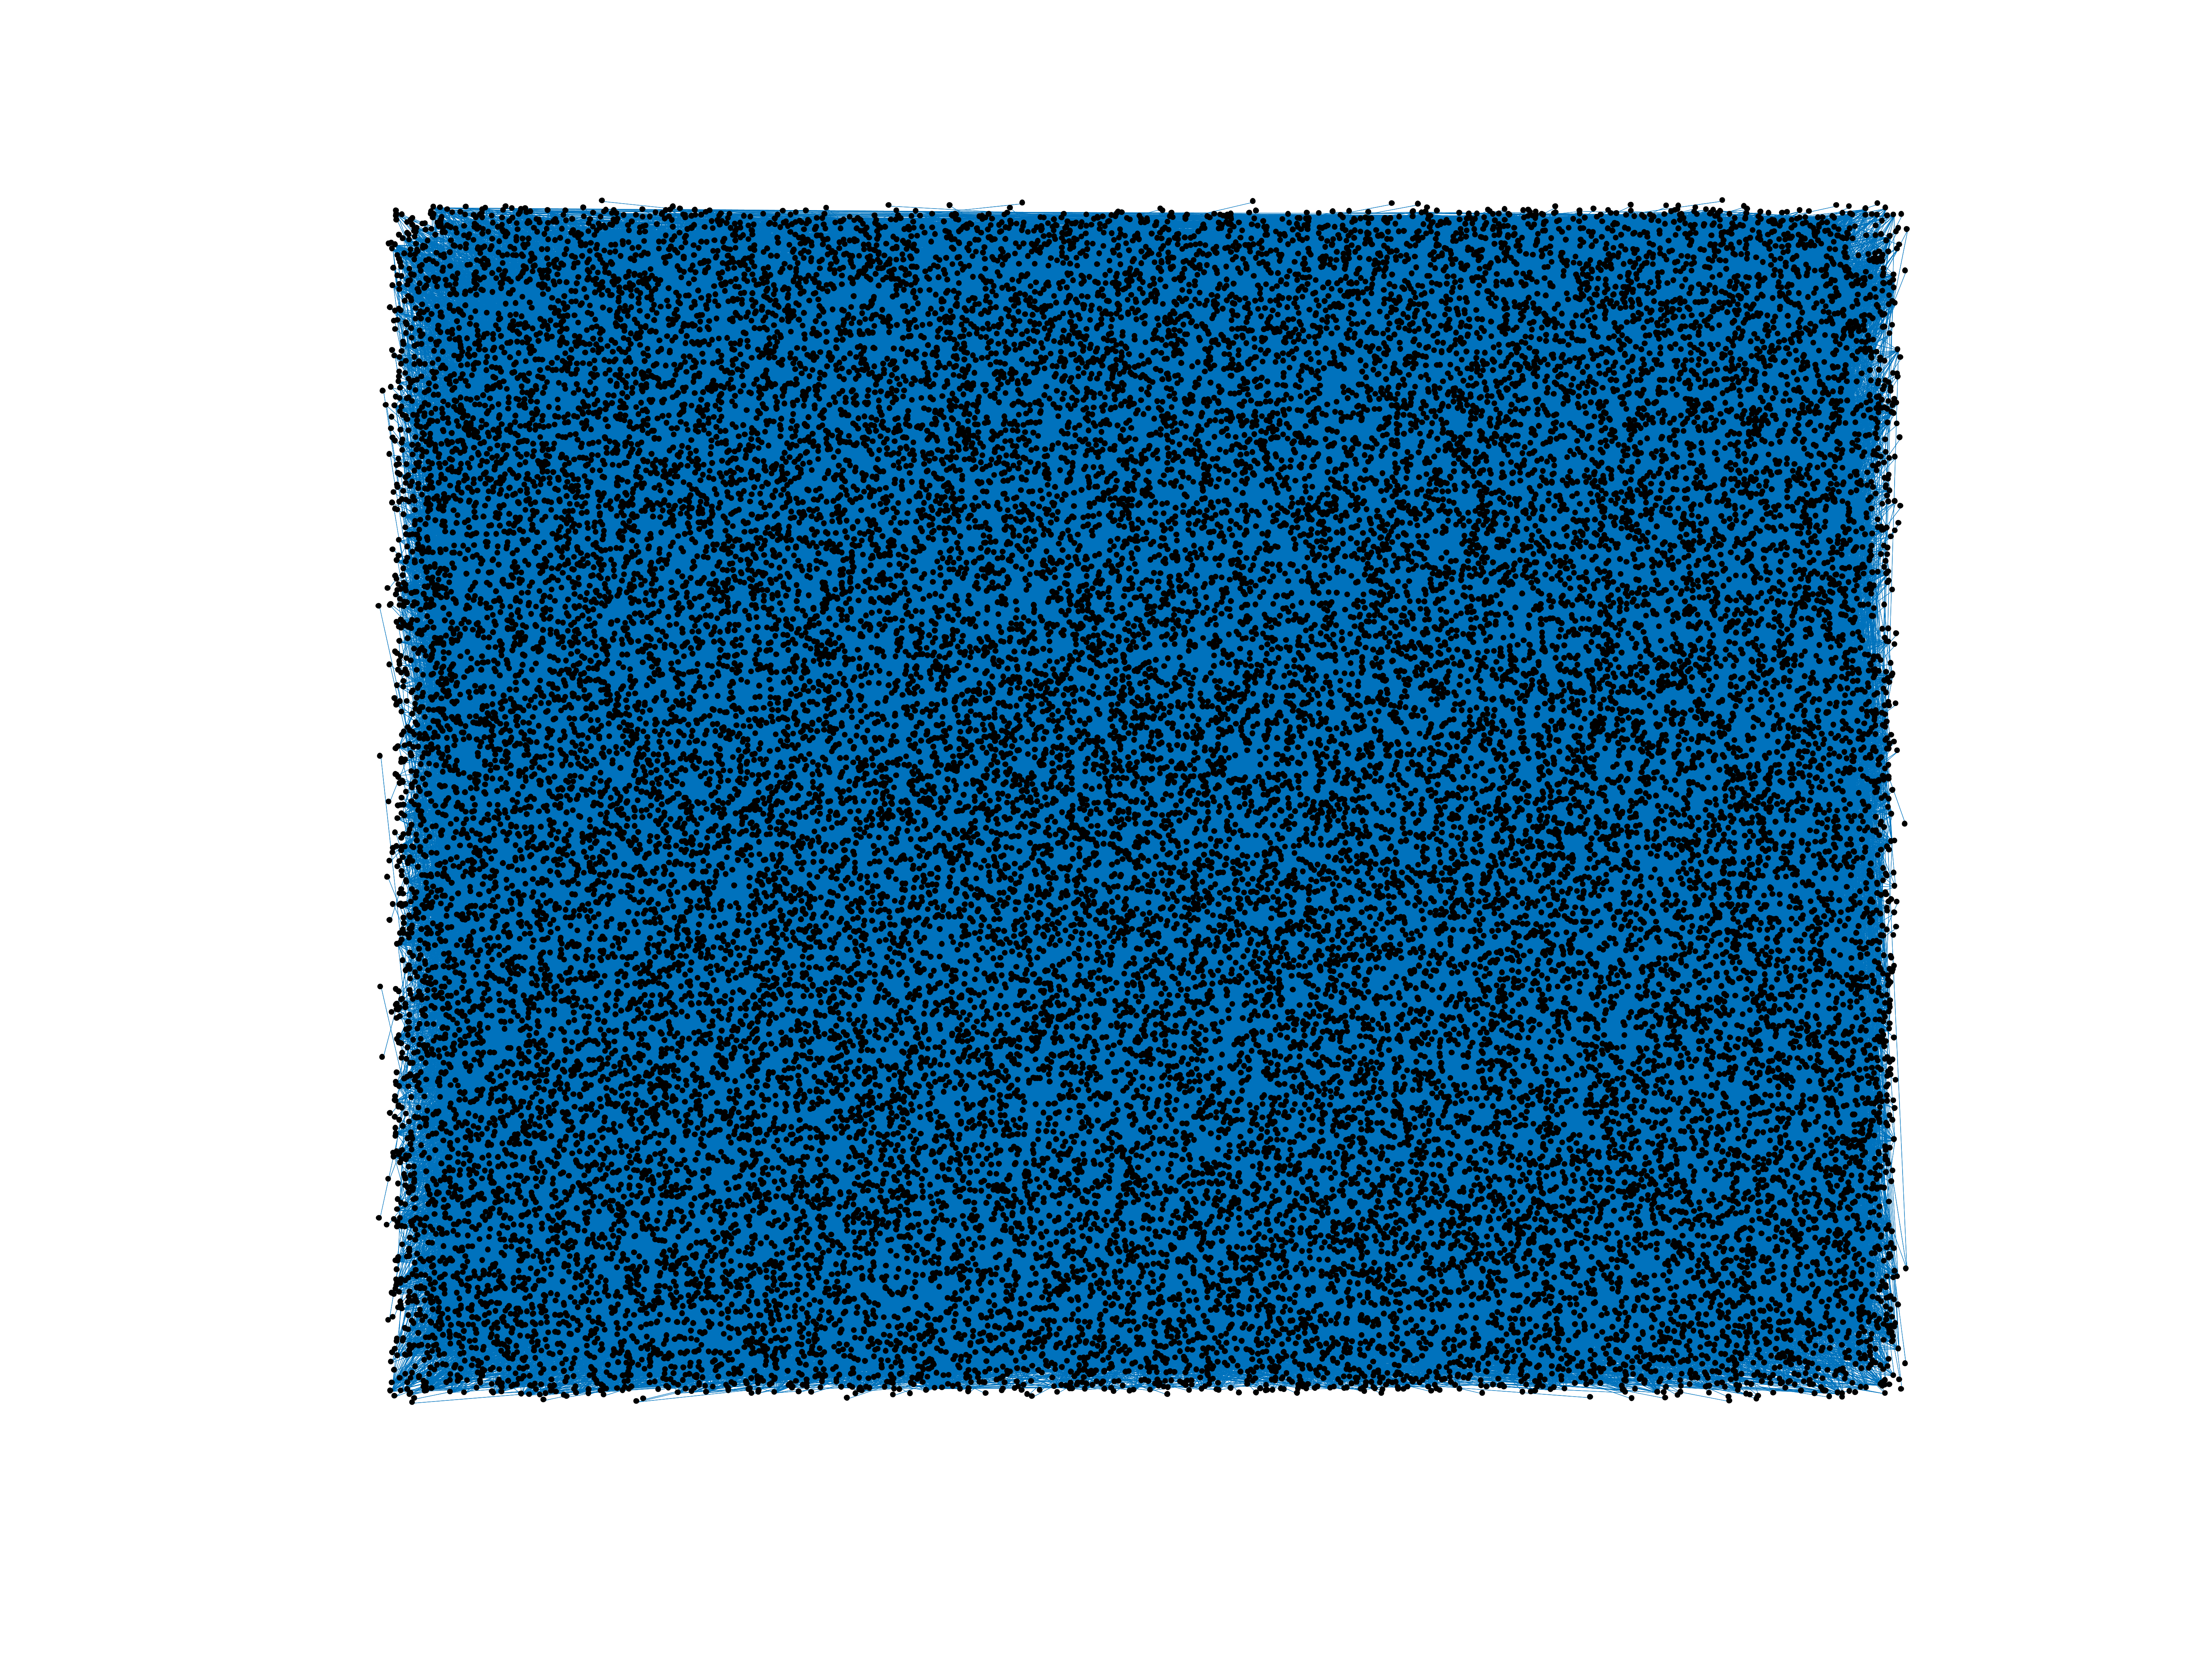
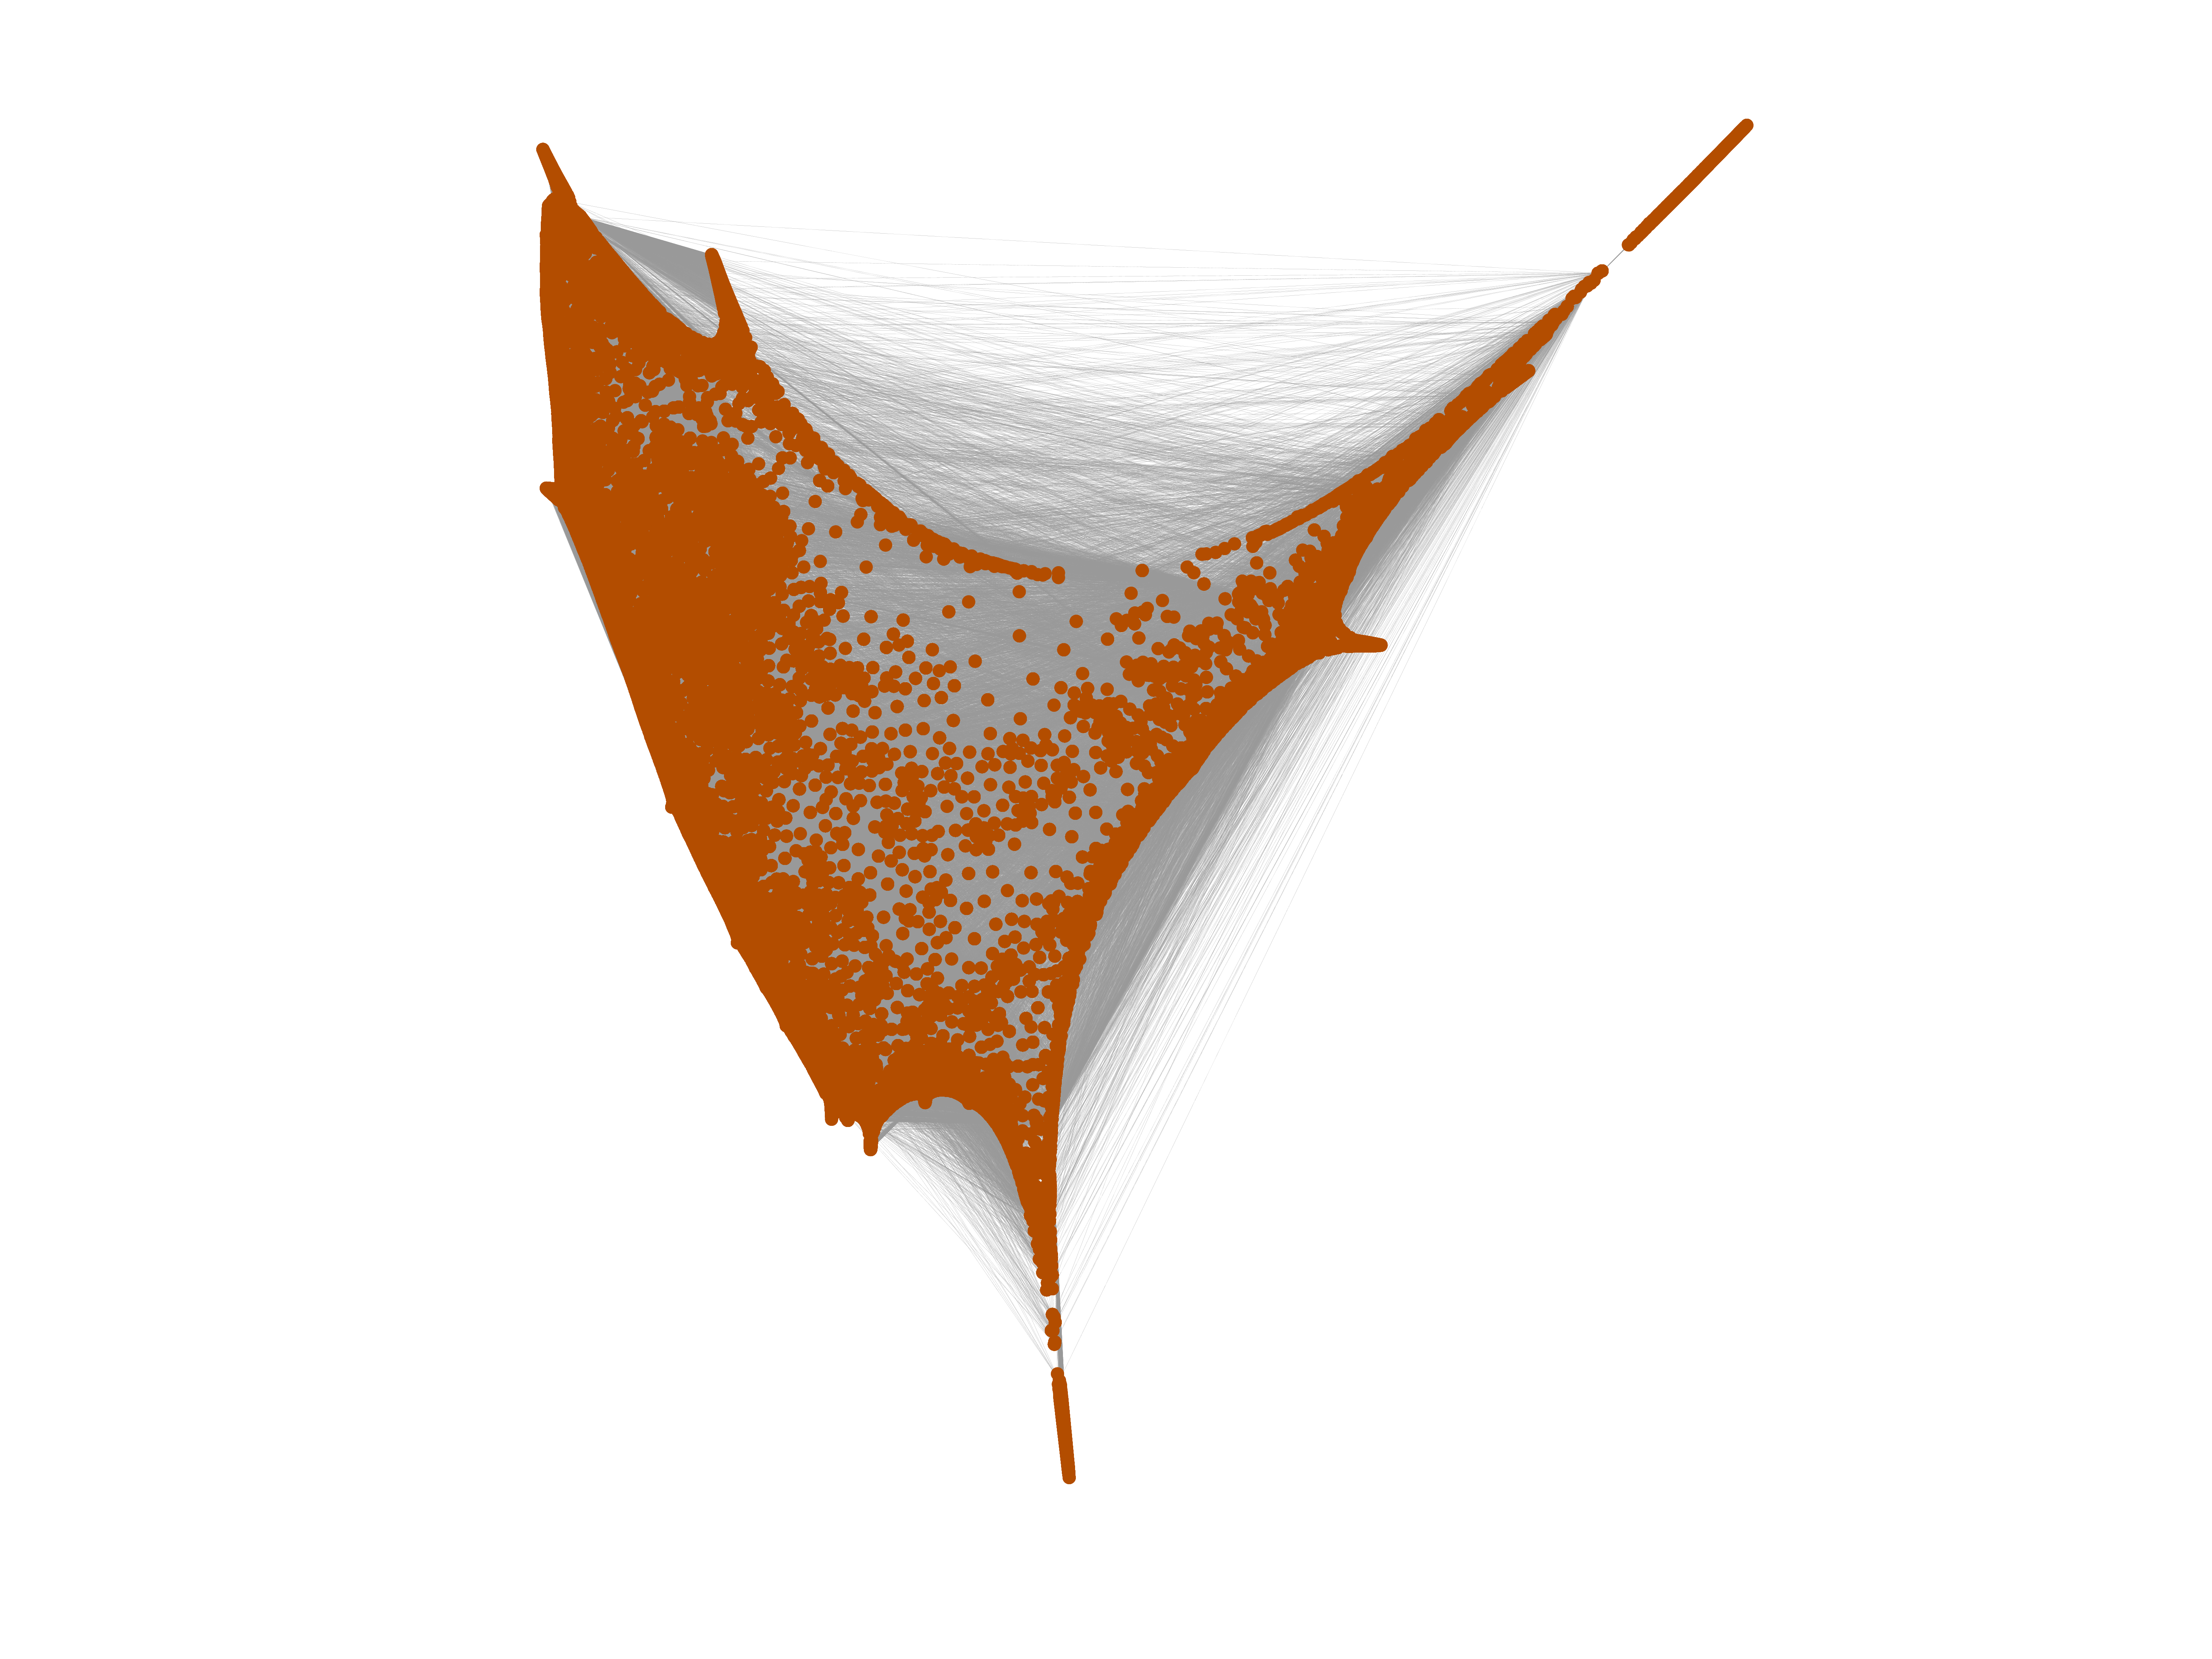
Wikipedia edits (vec)
This is the bipartite edit network of the Venetian Wikipedia. It contains users
and pages from the Venetian Wikipedia, connected by edit events. Each edge
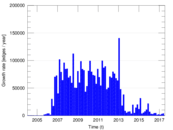
represents an edit. The dataset includes the timestamp of each edit.
Metadata
Statistics
| Size | n = | 35,868
|
| Left size | n1 = | 2,282
|
| Right size | n2 = | 33,586
|
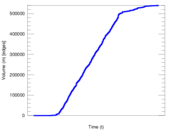
| Volume | m = | 540,090
|
| Unique edge count | m̿ = | 247,225
|
| Wedge count | s = | 598,332,548
|
| Claw count | z = | 1,453,341,425,736
|
| Square count | q = | 2,309,388,500
|
| 4-Tour count | T4 = | 20,868,984,590
|
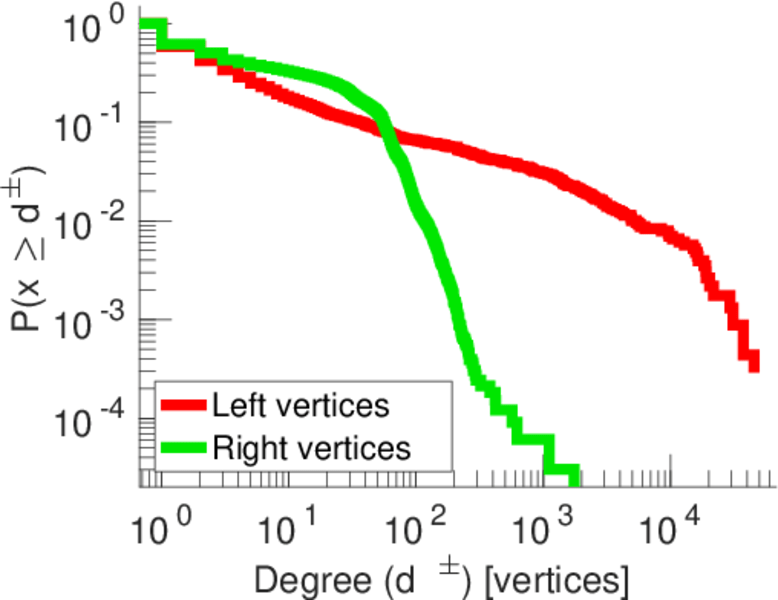
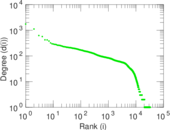
| Maximum degree | dmax = | 45,325
|
| Maximum left degree | d1max = | 45,325
|
| Maximum right degree | d2max = | 1,741
|
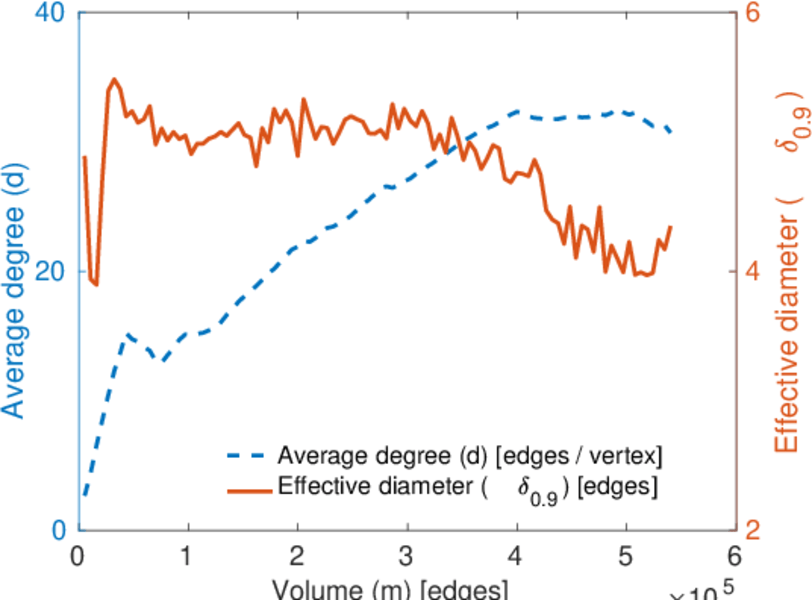
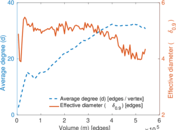
| Average degree | d = | 30.115 4
|
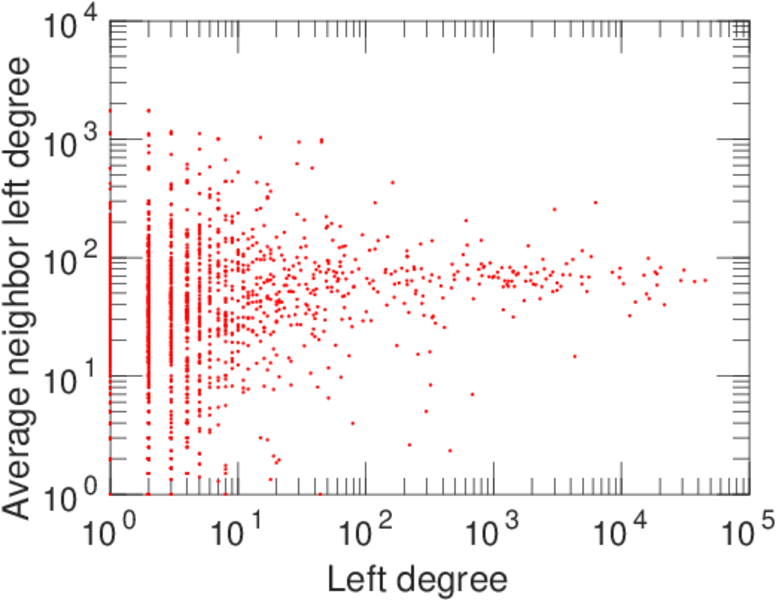
| Average left degree | d1 = | 236.674
|
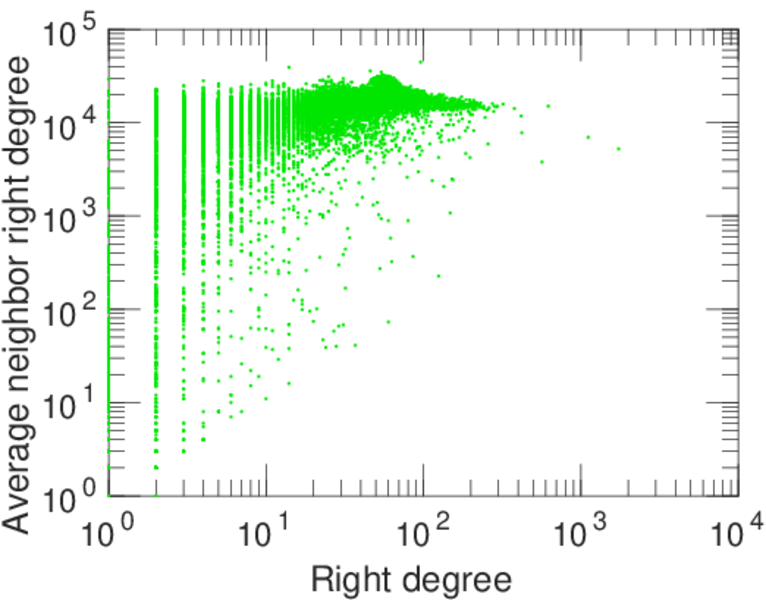
| Average right degree | d2 = | 16.080 8
|
| Fill | p = | 0.003 225 66
|
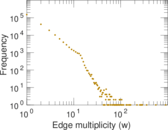
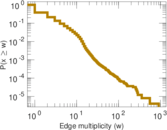
| Average edge multiplicity | m̃ = | 2.184 61
|
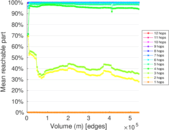
| Size of LCC | N = | 34,653
|
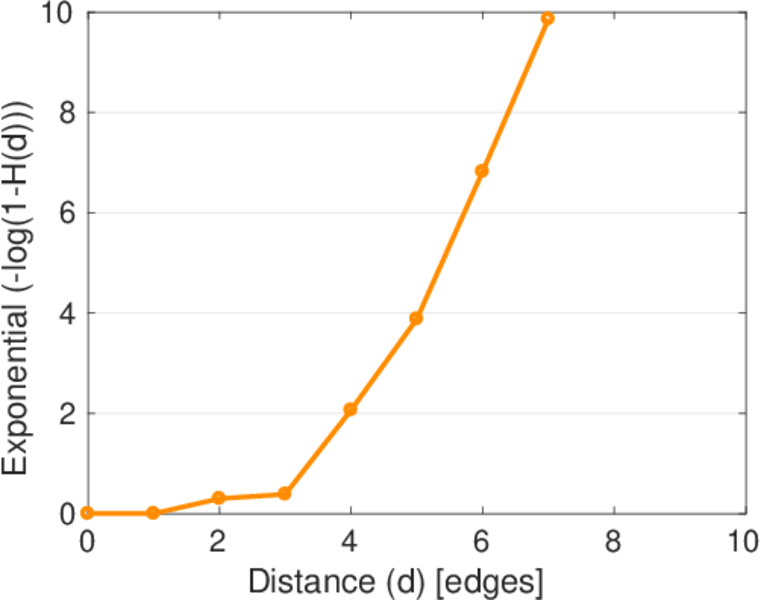
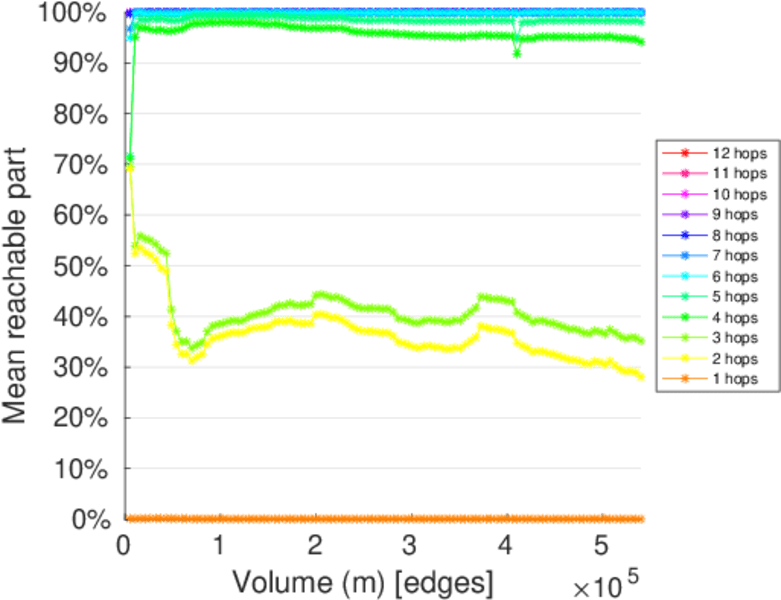
| Diameter | δ = | 10
|
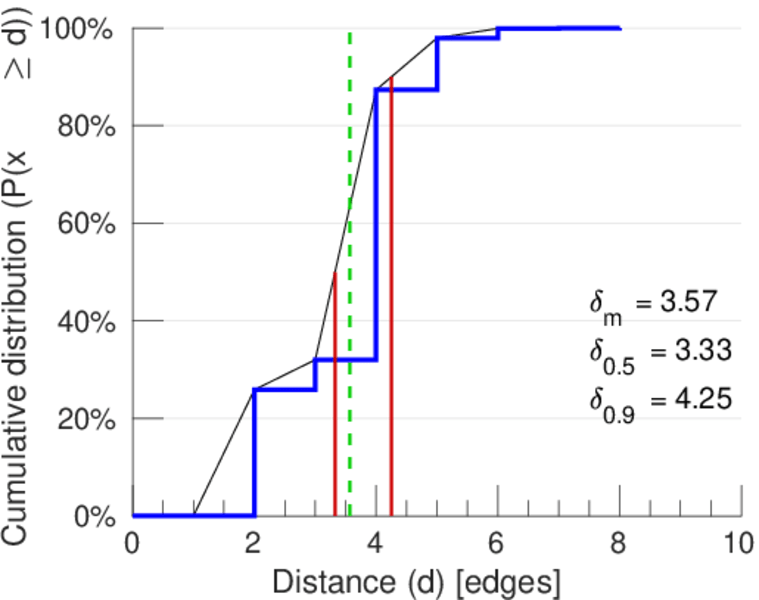
| 50-Percentile effective diameter | δ0.5 = | 3.325 36
|
| 90-Percentile effective diameter | δ0.9 = | 4.252 77
|
| Median distance | δM = | 4
|
| Mean distance | δm = | 3.569 65
|
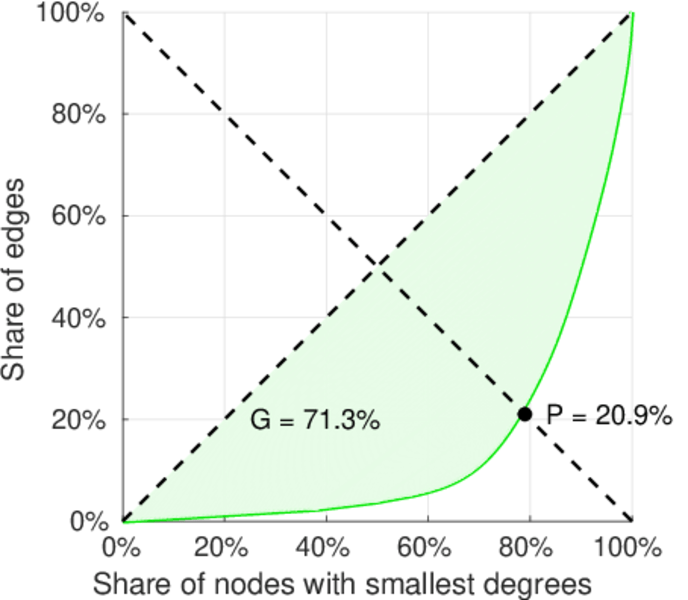
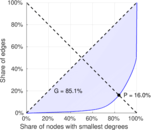
| Gini coefficient | G = | 0.849 247
|
| Balanced inequality ratio | P = | 0.159 868
|
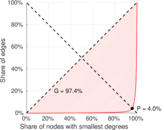
| Left balanced inequality ratio | P1 = | 0.039 678 6
|
| Right balanced inequality ratio | P2 = | 0.208 699
|
| Relative edge distribution entropy | Her = | 0.742 267
|
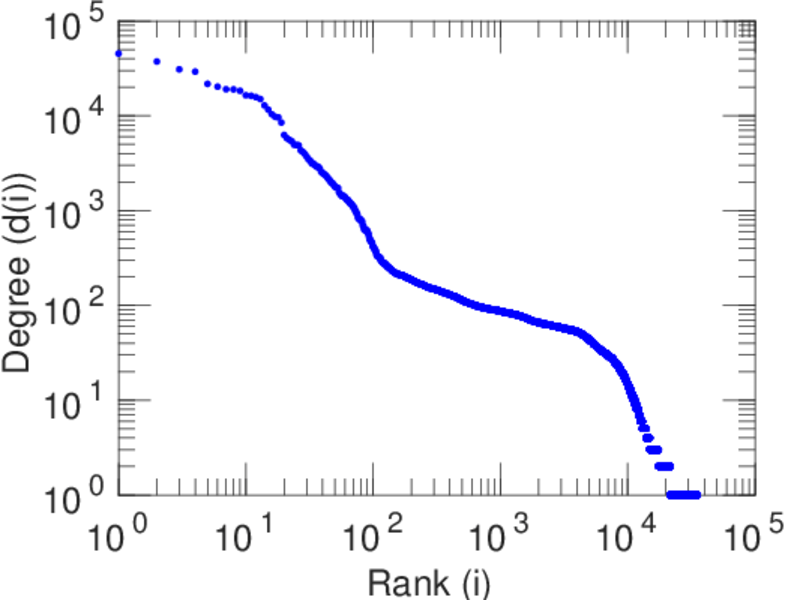
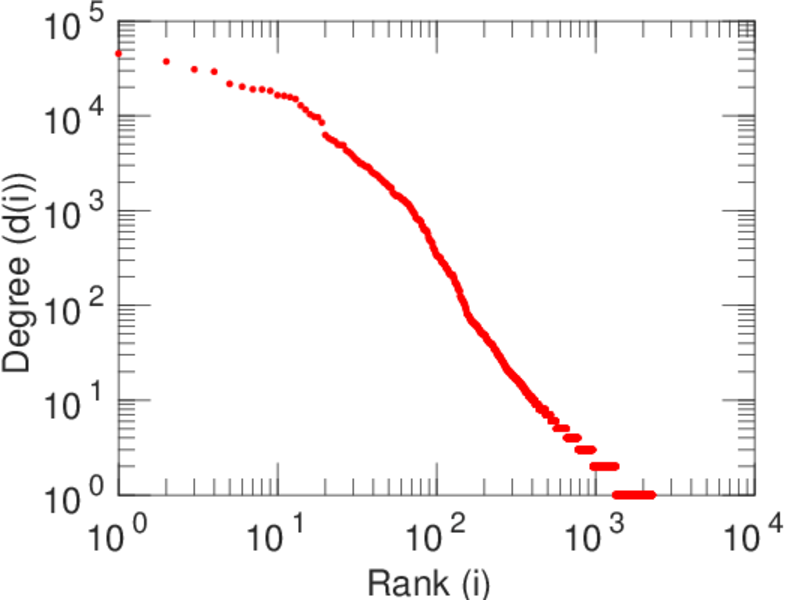
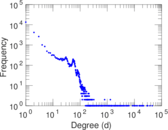
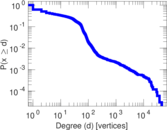
| Power law exponent | γ = | 1.856 57
|
| Tail power law exponent | γt = | 3.591 00
|
| Tail power law exponent with p | γ3 = | 3.591 00
|
| p-value | p = | 0.000 00
|
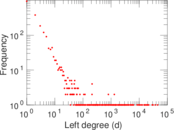
| Left tail power law exponent with p | γ3,1 = | 1.671 00
|
| Left p-value | p1 = | 0.000 00
|
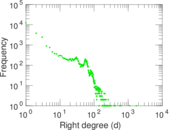
| Right tail power law exponent with p | γ3,2 = | 6.971 00
|
| Right p-value | p2 = | 0.261 000
|
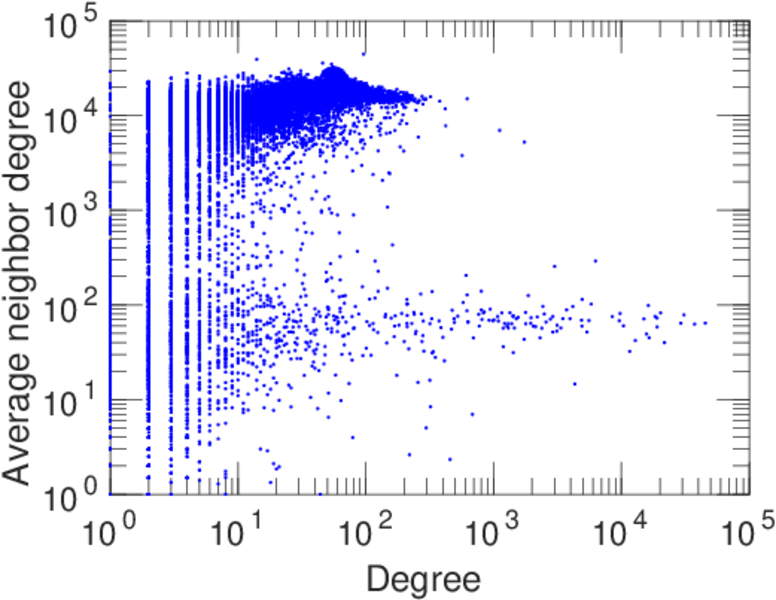
| Degree assortativity | ρ = | −0.125 749
|
| Degree assortativity p-value | pρ = | 0.000 00
|
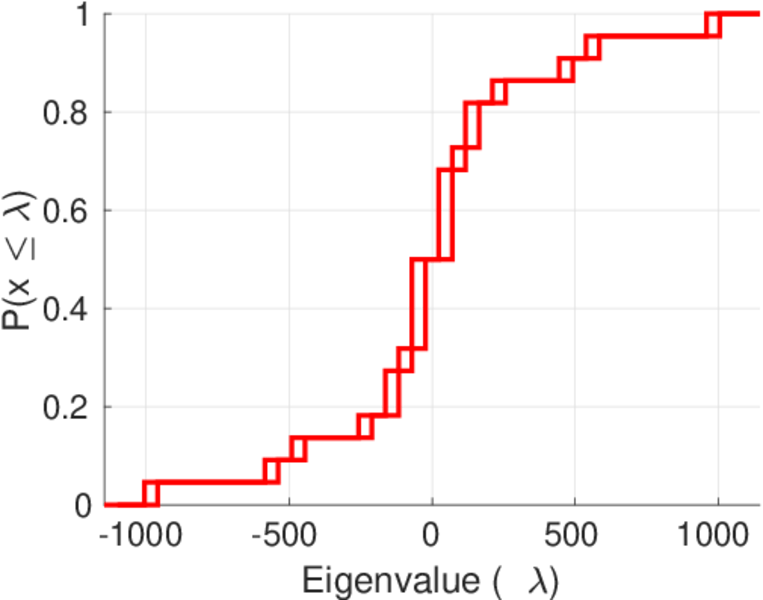
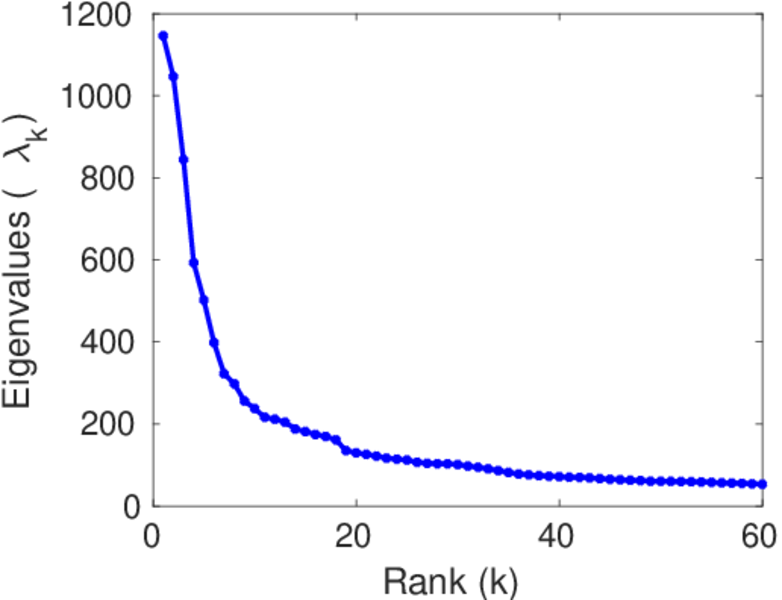
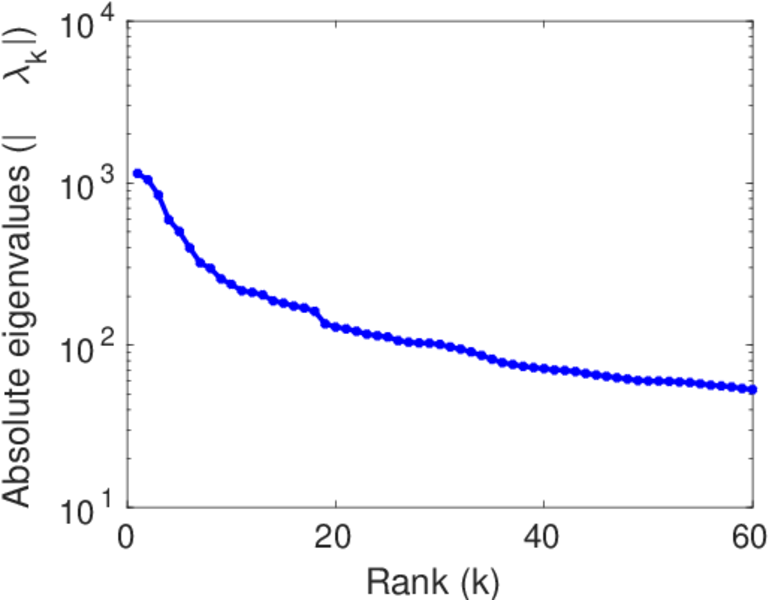
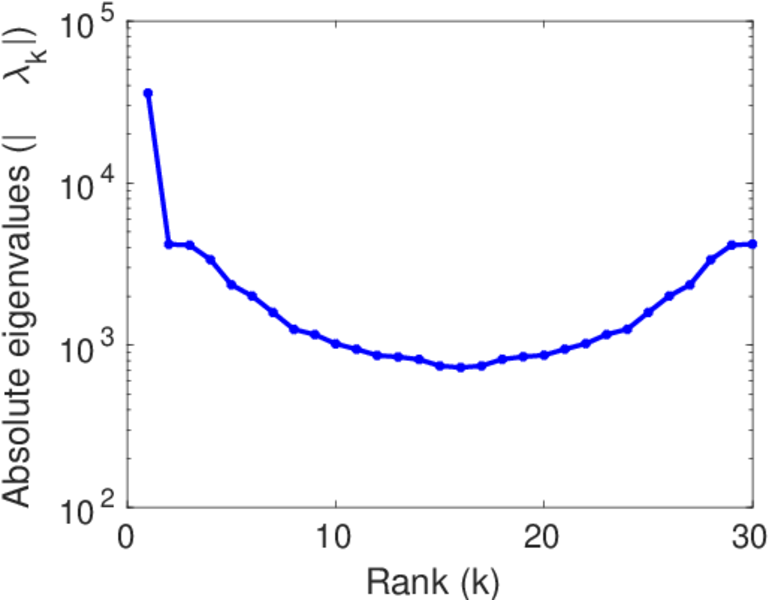
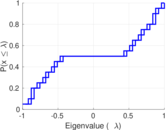
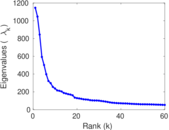
| Spectral norm | α = | 1,145.91
|
| Algebraic connectivity | a = | 0.110 997
|
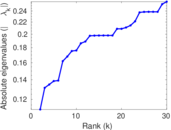
| Spectral separation | |λ1[A] / λ2[A]| = | 1.094 94
|
| Controllability | C = | 31,035
|
| Relative controllability | Cr = | 0.881 701
|
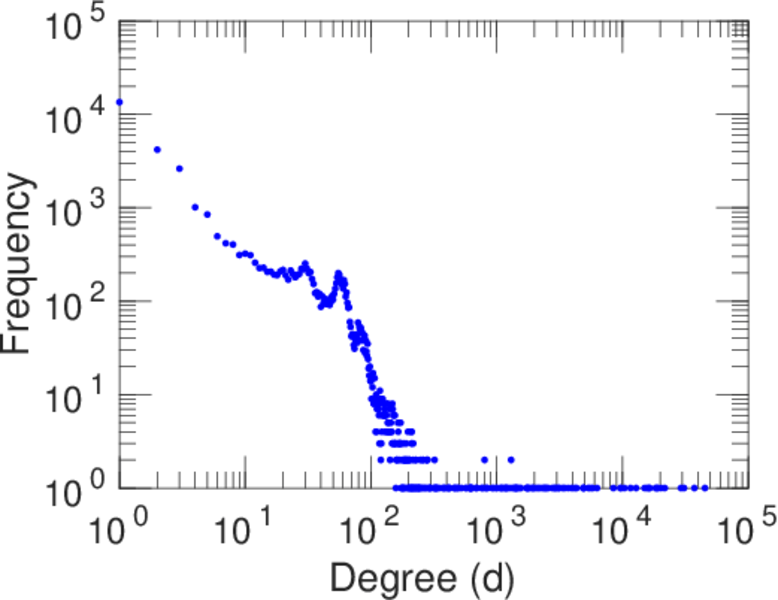
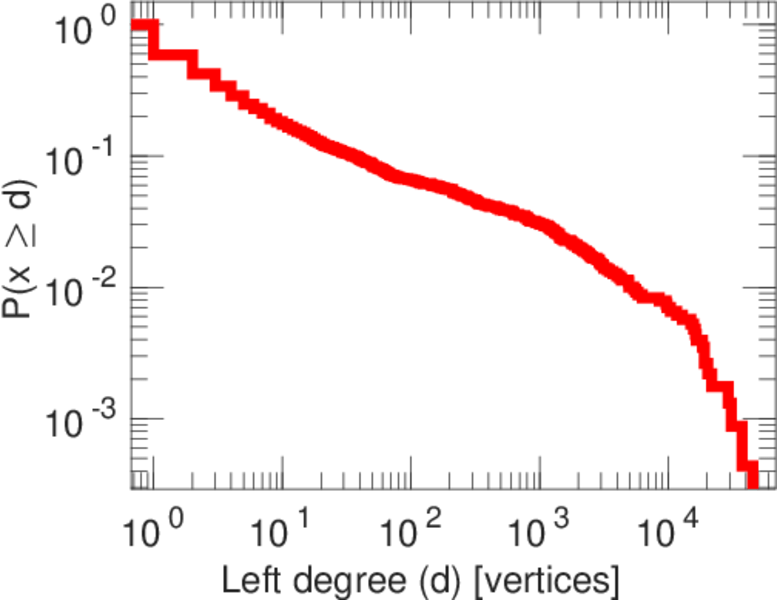
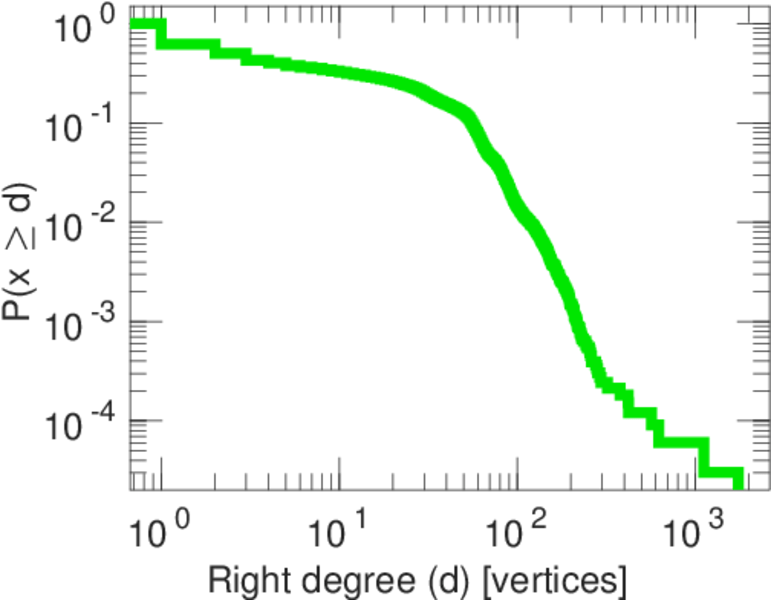
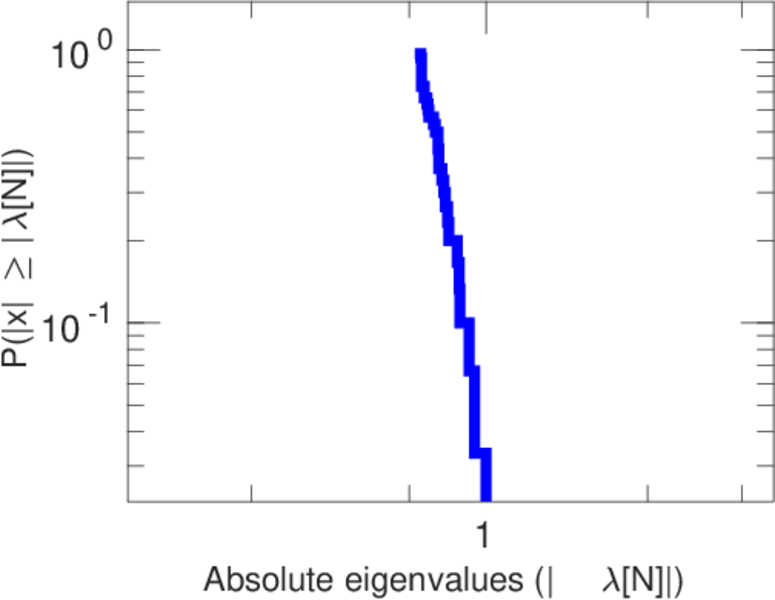
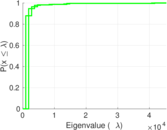
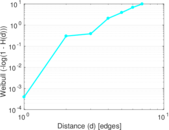
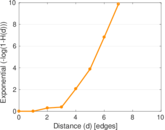
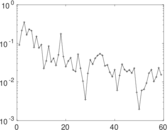
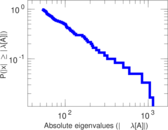
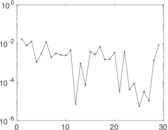
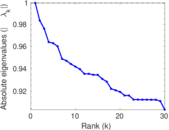
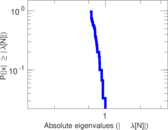
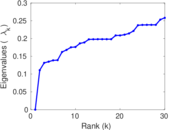
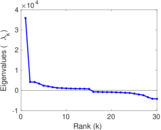
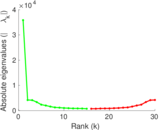
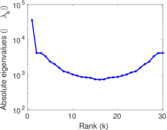
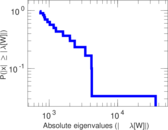
Plots


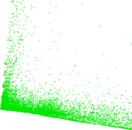
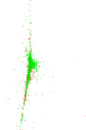
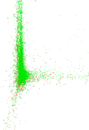


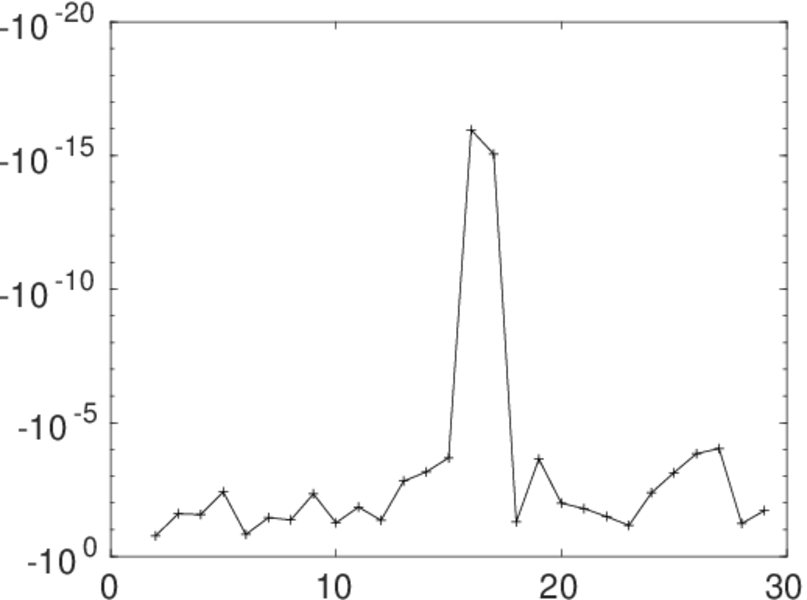
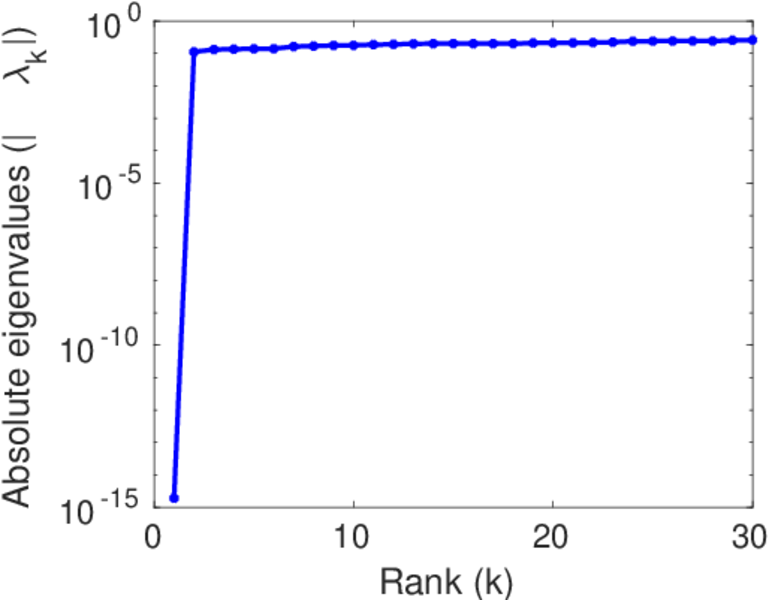
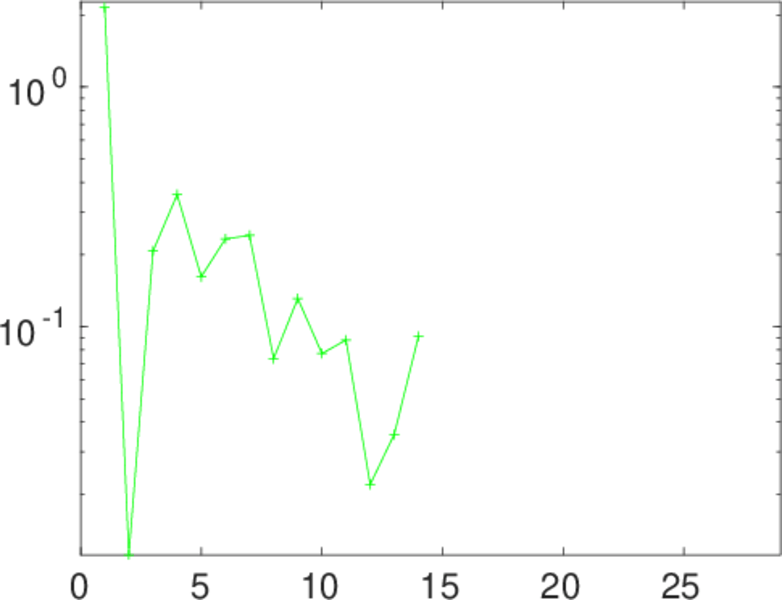
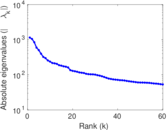
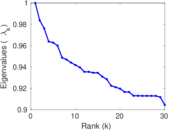
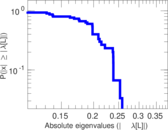
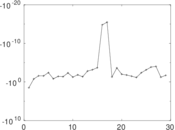
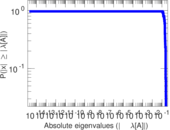
Matrix decompositions plots


Downloads
References
|
[1]
|
Jérôme Kunegis.
KONECT – The Koblenz Network Collection.
In Proc. Int. Conf. on World Wide Web Companion, pages
1343–1350, 2013.
[ http ]
|
|
[2]
|
Wikimedia Foundation.
Wikimedia downloads.
http://dumps.wikimedia.org/, January 2010.
|
 KONECT ‣ Networks ‣
Buy Me a Coffee
KONECT ‣ Networks ‣
Buy Me a Coffee