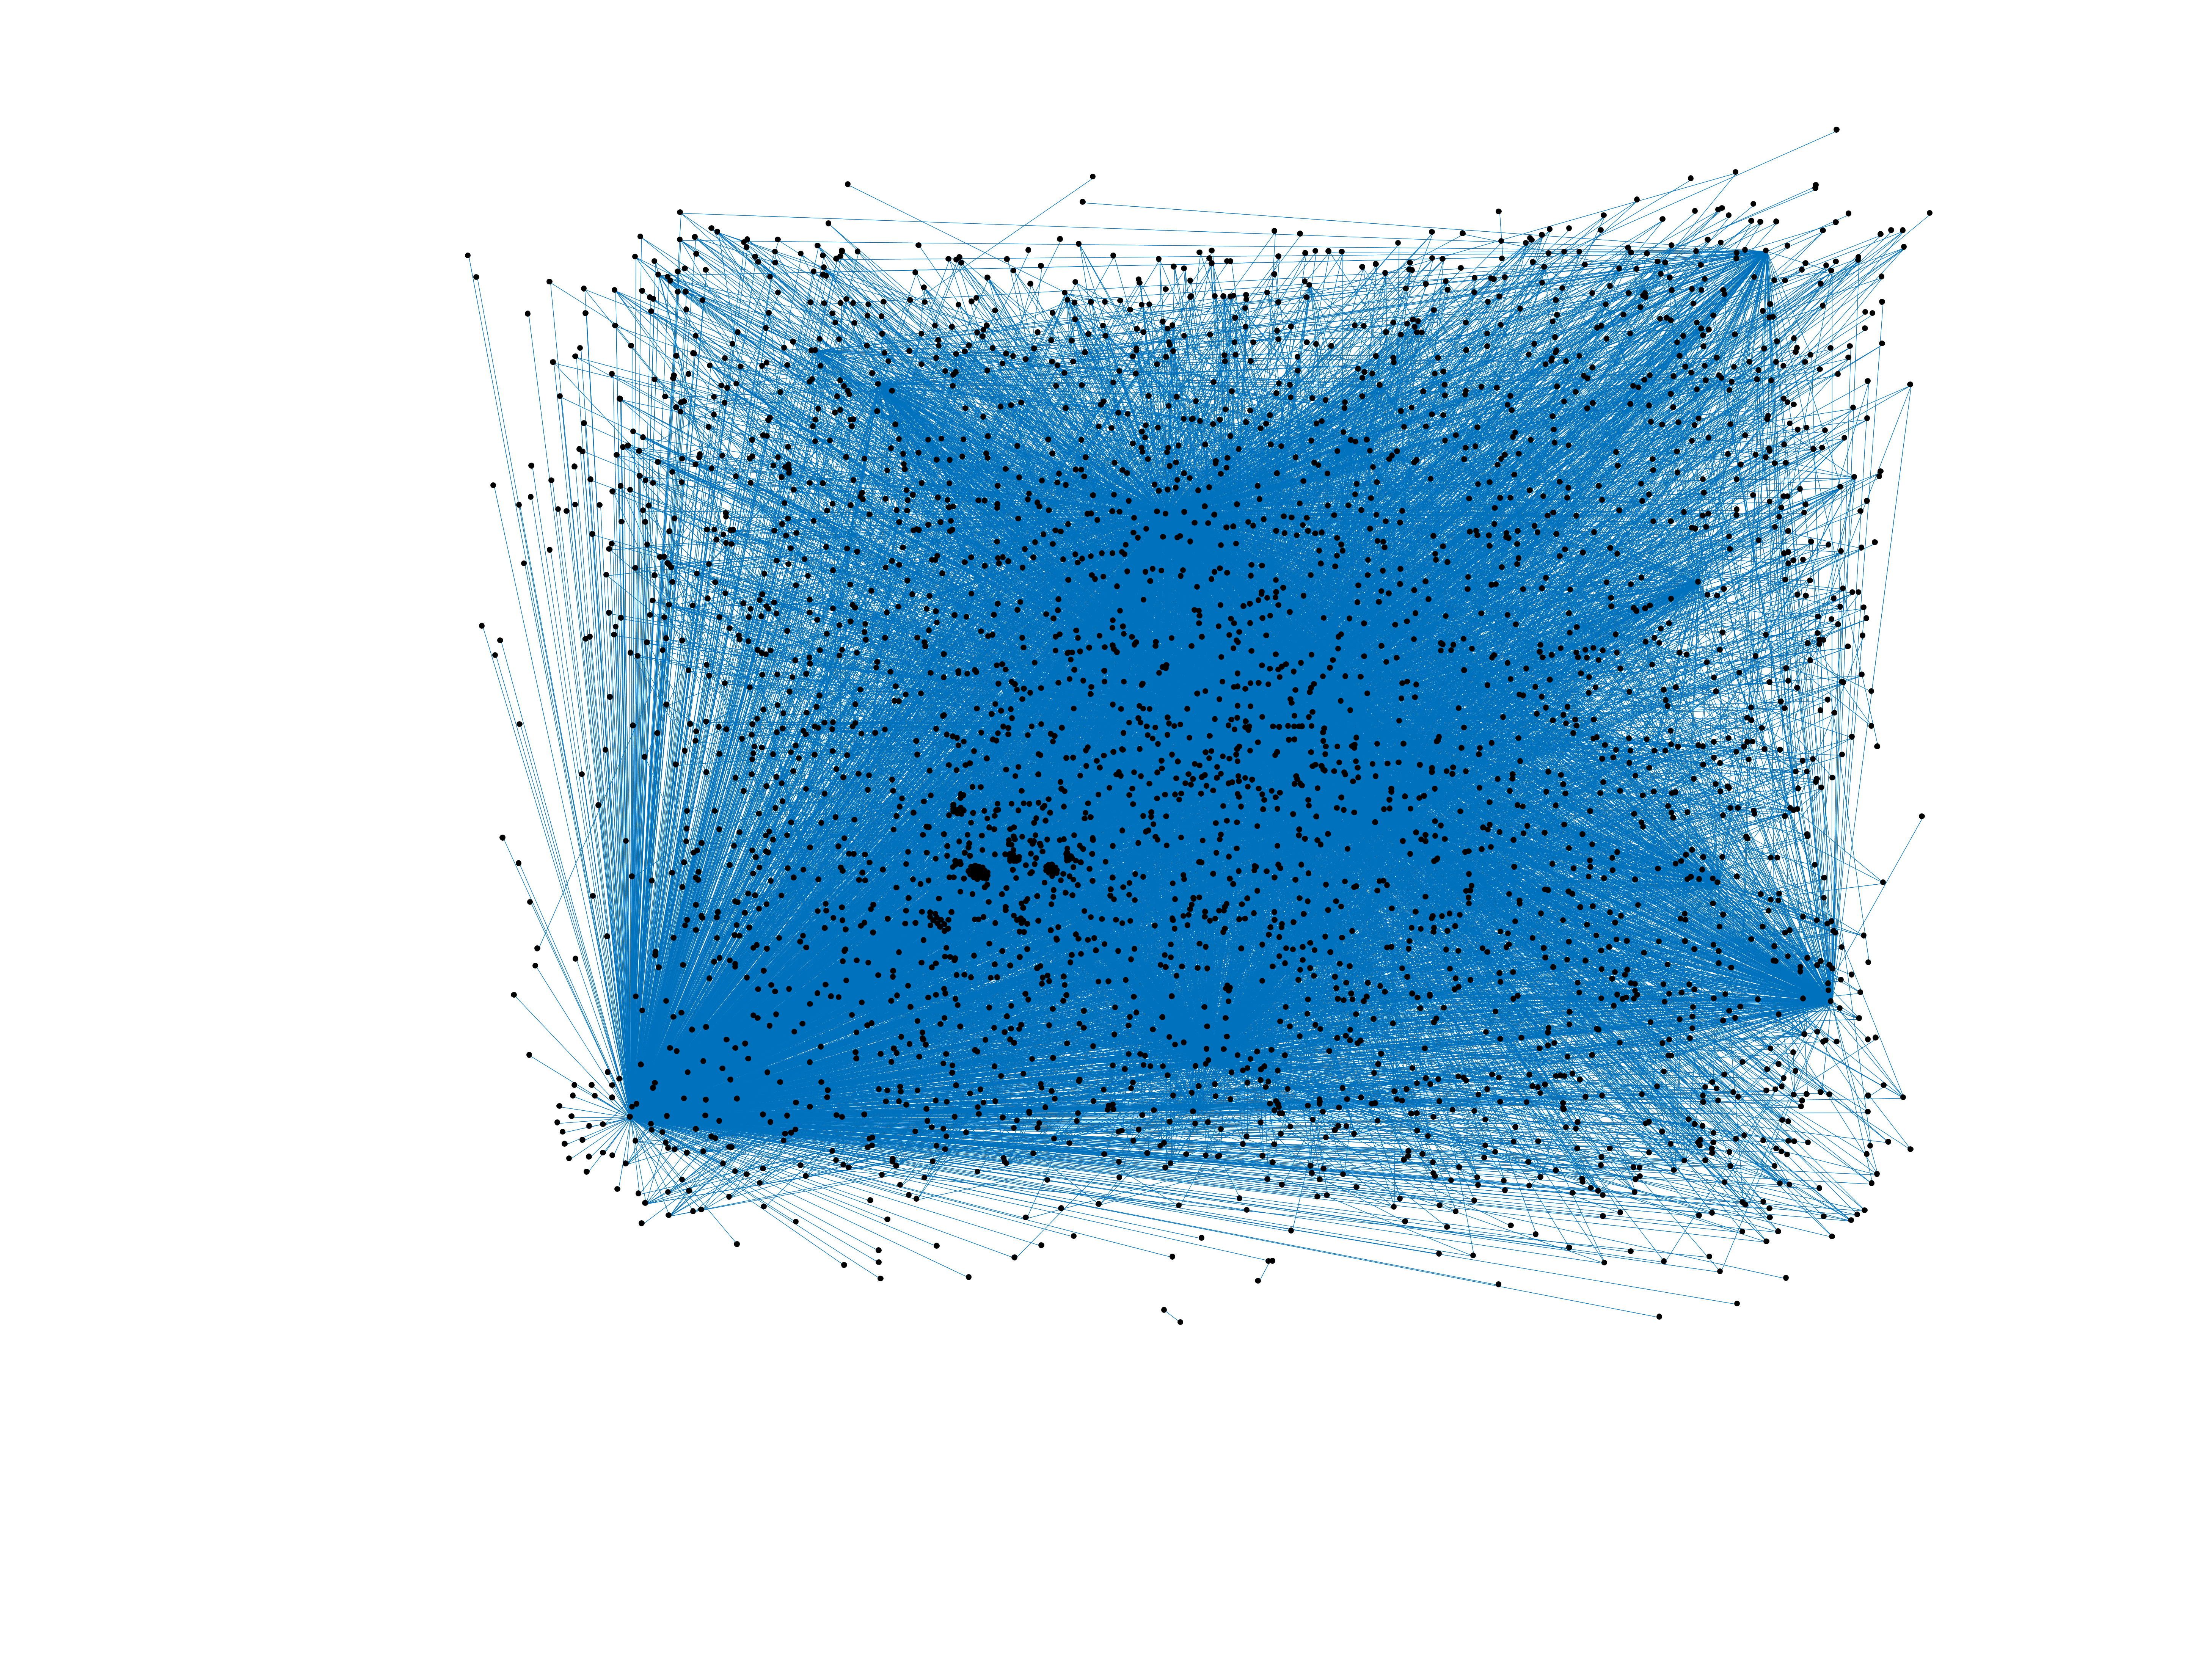
Wiktionary edits (vec)
This is the bipartite edit network of the Venetian Wiktionary. It contains
users and pages from the Venetian Wiktionary, connected by edit events. Each
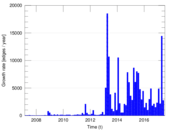
edge represents an edit. The dataset includes the timestamp of each edit.
Metadata
Statistics
| Size | n = | 3,366
|
| Left size | n1 = | 208
|
| Right size | n2 = | 3,158
|
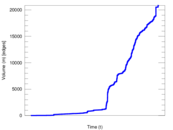
| Volume | m = | 20,858
|
| Unique edge count | m̿ = | 10,994
|
| Wedge count | s = | 6,427,418
|
| Claw count | z = | 3,594,663,253
|
| Cross count | x = | 1,712,126,731,071
|
| Square count | q = | 4,044,839
|
| 4-Tour count | T4 = | 58,099,600
|
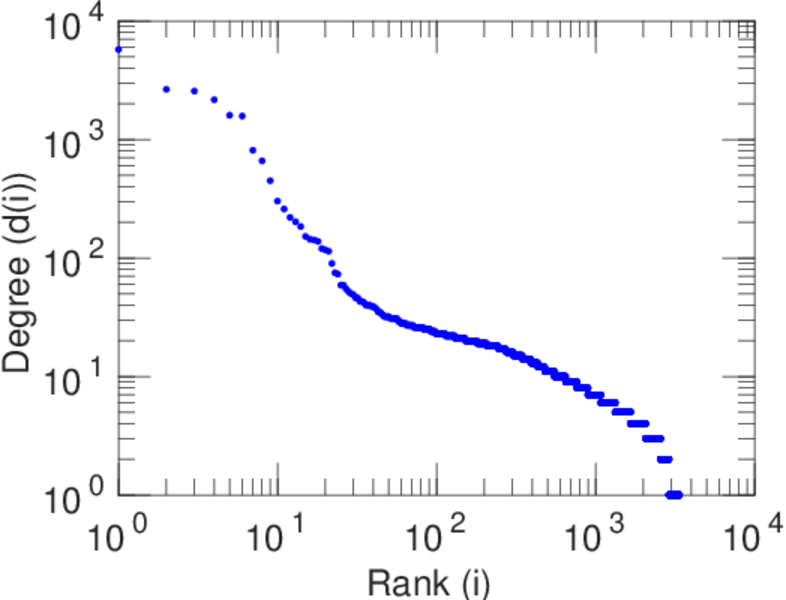
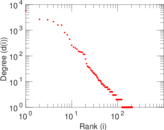
| Maximum degree | dmax = | 5,750
|
| Maximum left degree | d1max = | 5,750
|
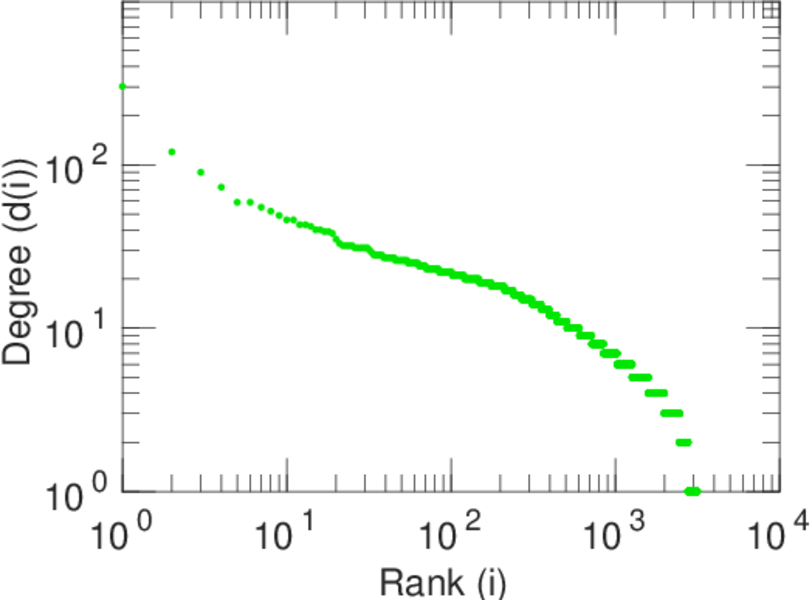
| Maximum right degree | d2max = | 302
|
| Average degree | d = | 12.393 3
|
| Average left degree | d1 = | 100.279
|
| Average right degree | d2 = | 6.604 81
|
| Fill | p = | 0.016 737 1
|
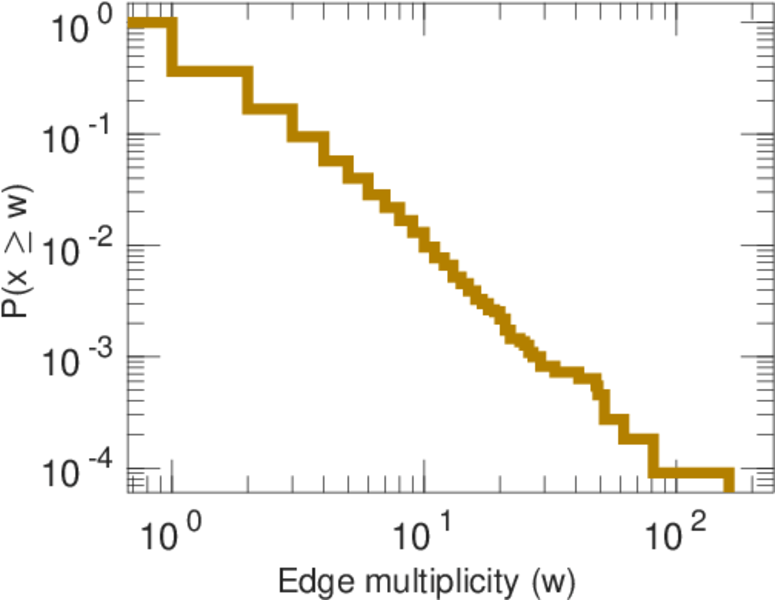
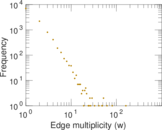
| Average edge multiplicity | m̃ = | 1.897 22
|
| Size of LCC | N = | 3,239
|
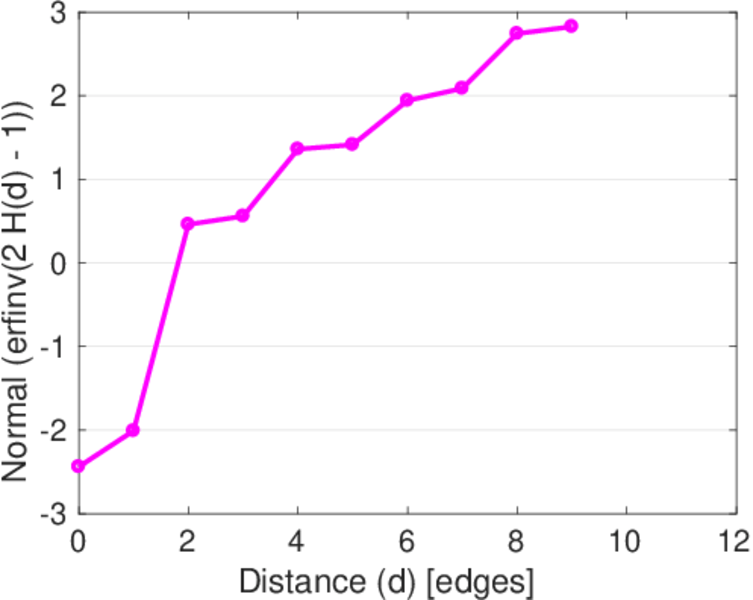
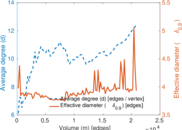
| Diameter | δ = | 12
|
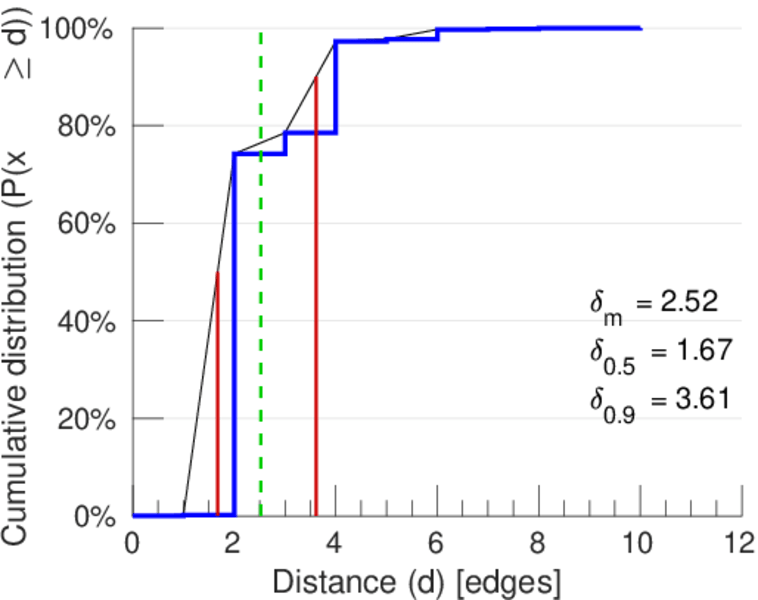
| 50-Percentile effective diameter | δ0.5 = | 1.672 70
|
| 90-Percentile effective diameter | δ0.9 = | 3.612 22
|
| Median distance | δM = | 2
|
| Mean distance | δm = | 2.524 92
|
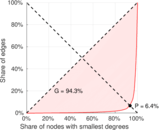
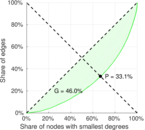
| Gini coefficient | G = | 0.723 772
|
| Balanced inequality ratio | P = | 0.224 662
|
| Left balanced inequality ratio | P1 = | 0.063 956 3
|
| Right balanced inequality ratio | P2 = | 0.330 521
|
| Relative edge distribution entropy | Her = | 0.739 348
|
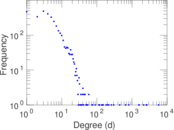
| Power law exponent | γ = | 1.958 87
|
| Tail power law exponent | γt = | 3.151 00
|
| Tail power law exponent with p | γ3 = | 3.151 00
|
| p-value | p = | 0.000 00
|
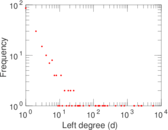
| Left tail power law exponent with p | γ3,1 = | 1.601 00
|
| Left p-value | p1 = | 0.351 000
|
| Right tail power law exponent with p | γ3,2 = | 3.581 00
|
| Right p-value | p2 = | 0.000 00
|
| Degree assortativity | ρ = | −0.363 437
|
| Degree assortativity p-value | pρ = | 0.000 00
|
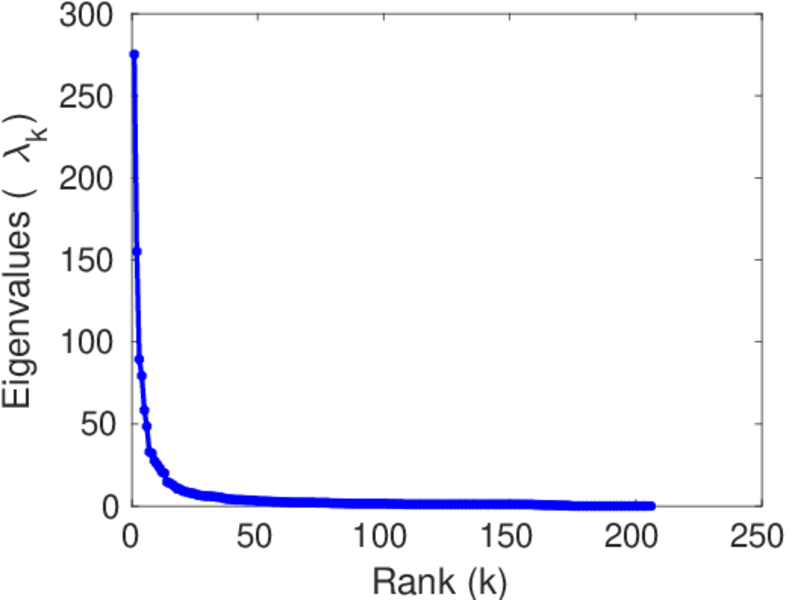
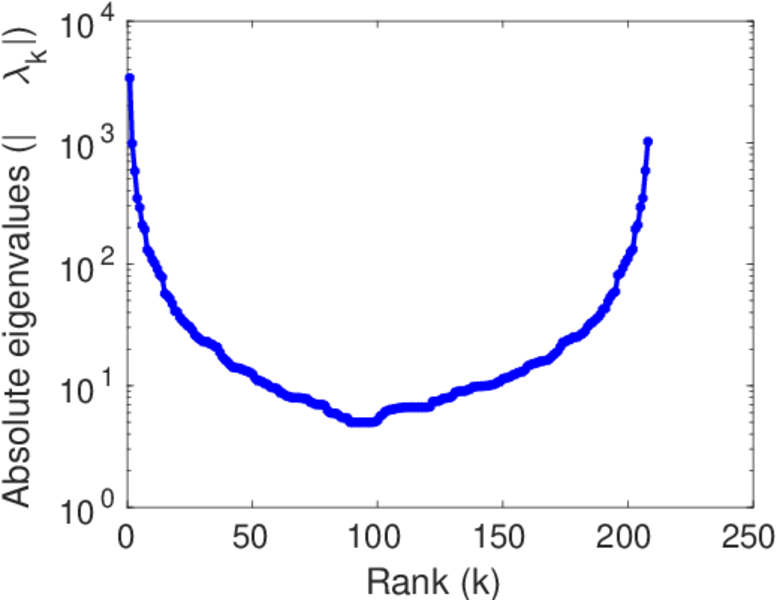
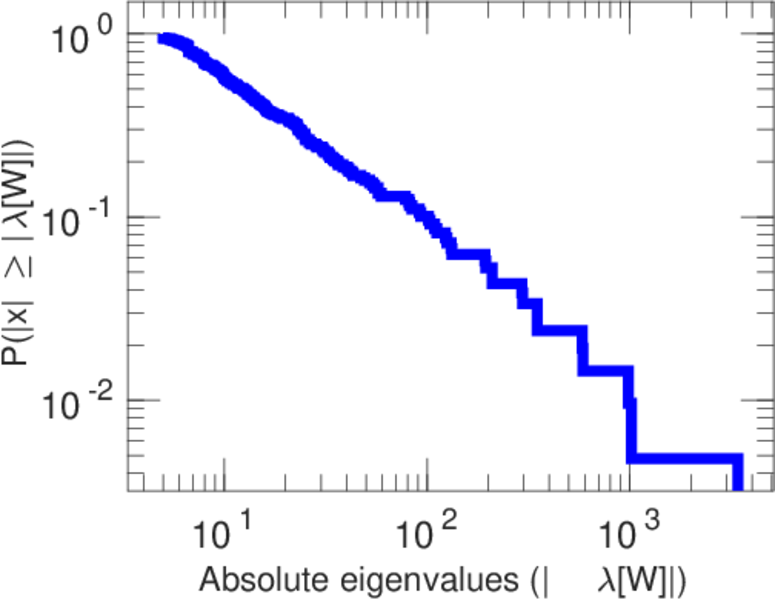
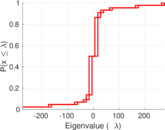
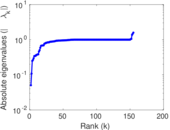
| Spectral norm | α = | 275.168
|
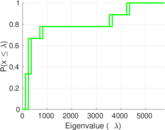
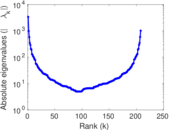
| Algebraic connectivity | a = | 0.050 304 0
|
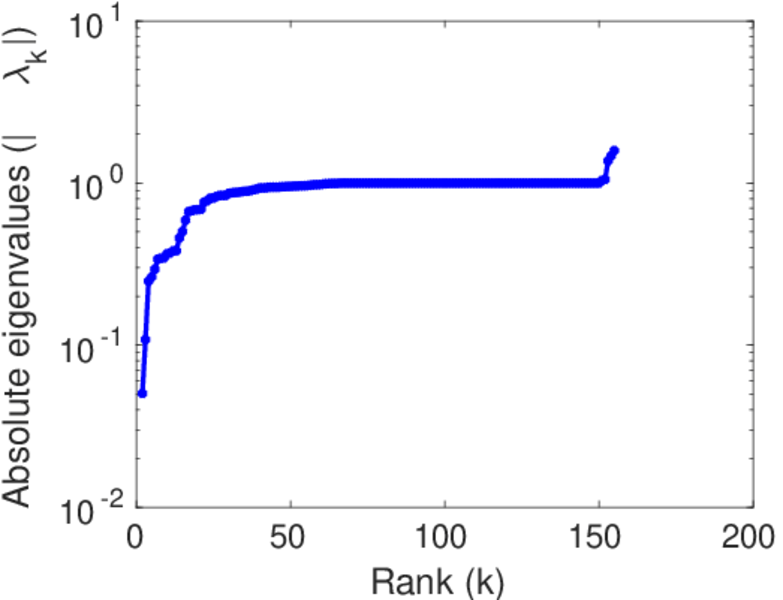
| Spectral separation | |λ1[A] / λ2[A]| = | 1.773 69
|
| Controllability | C = | 3,019
|
| Relative controllability | Cr = | 0.896 910
|
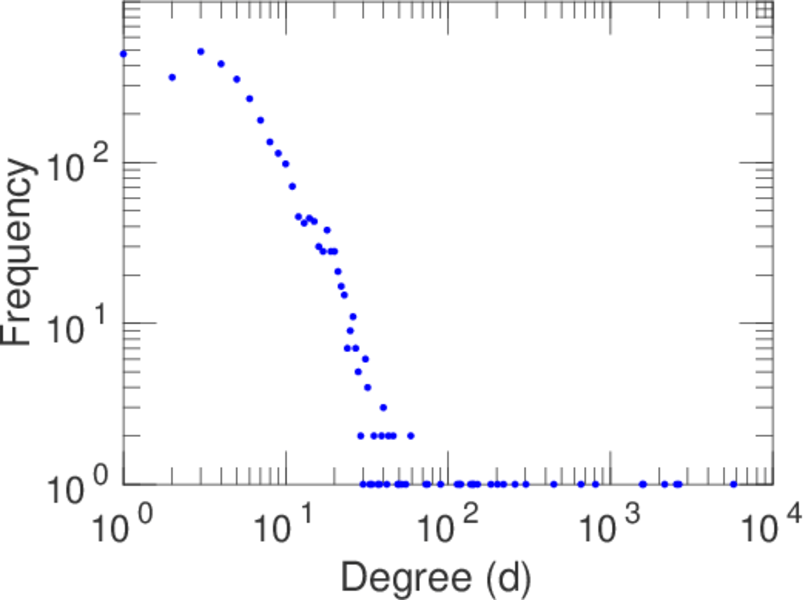
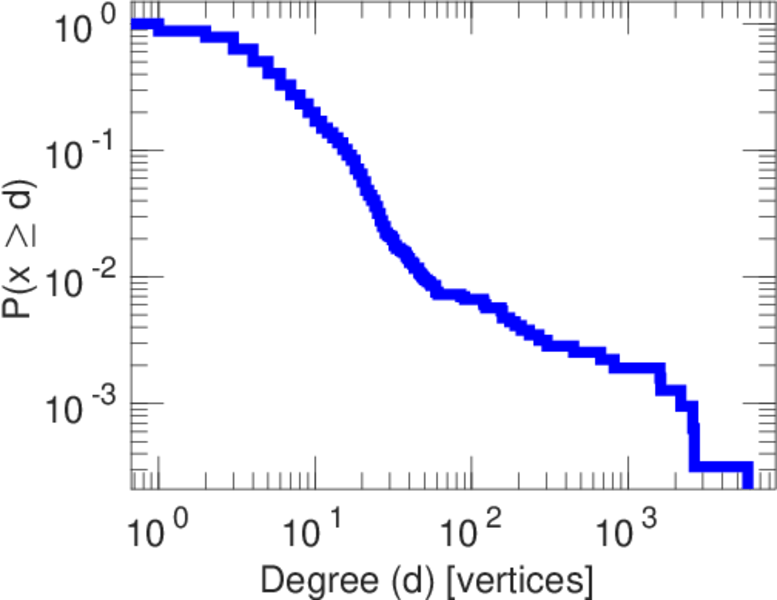
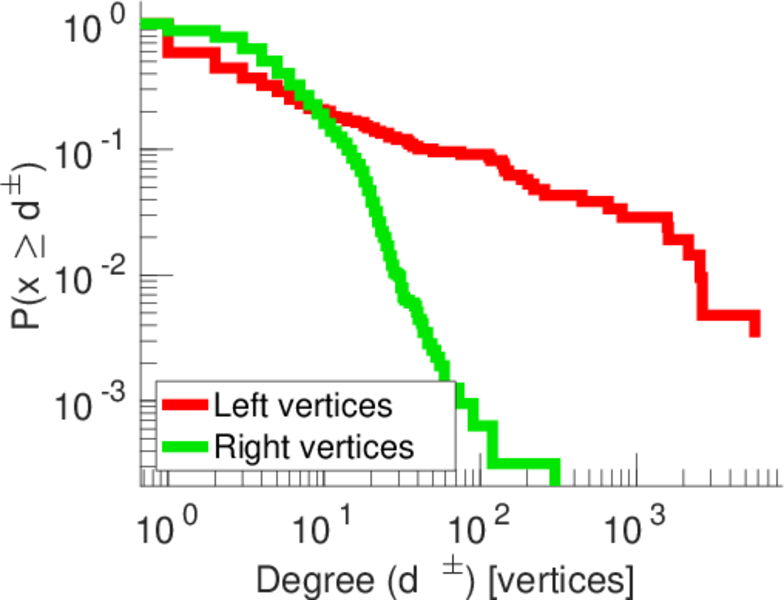
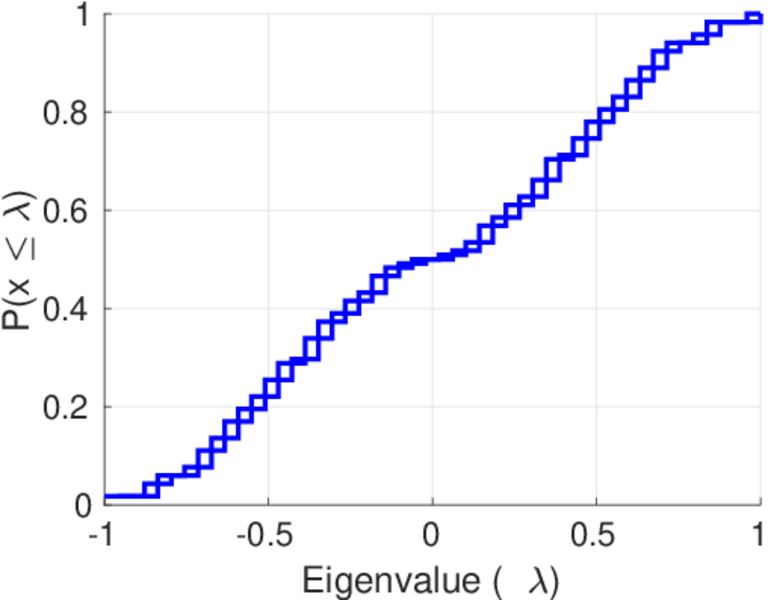
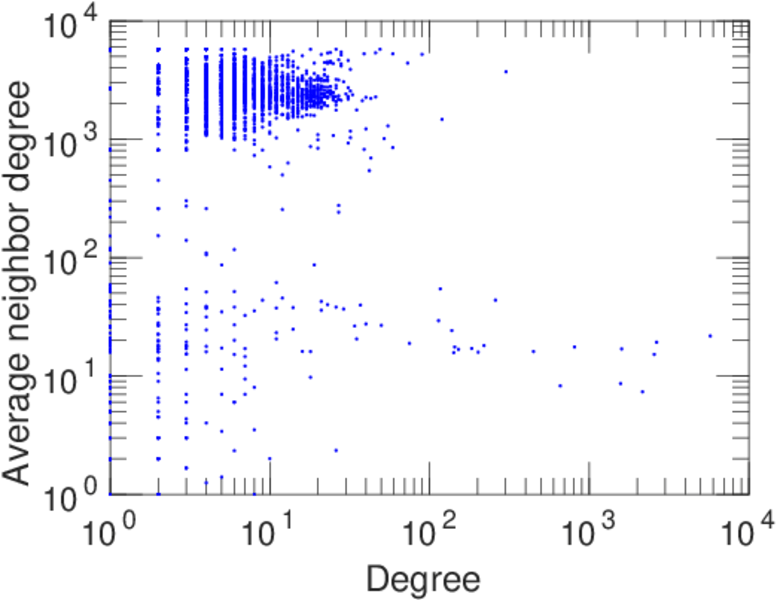
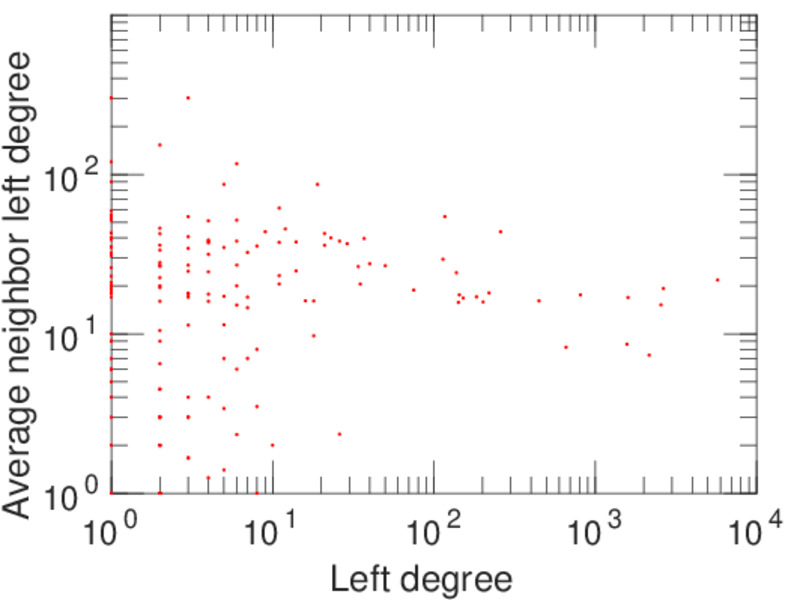
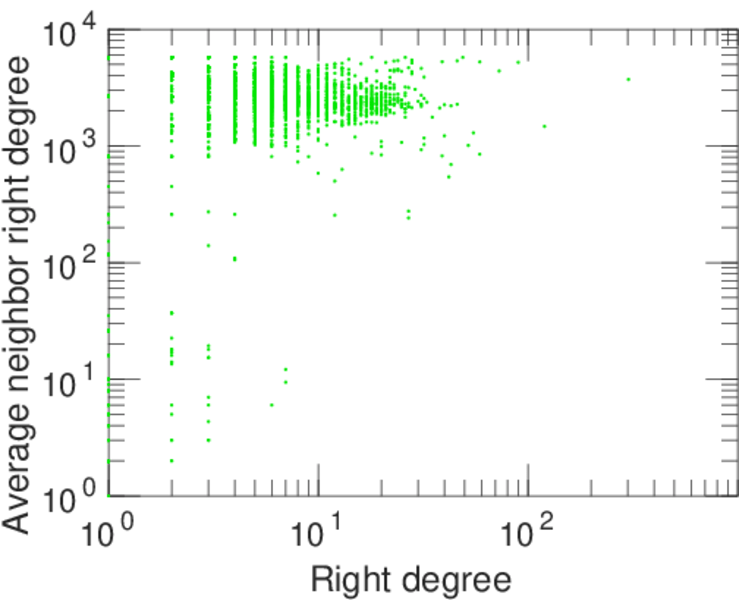
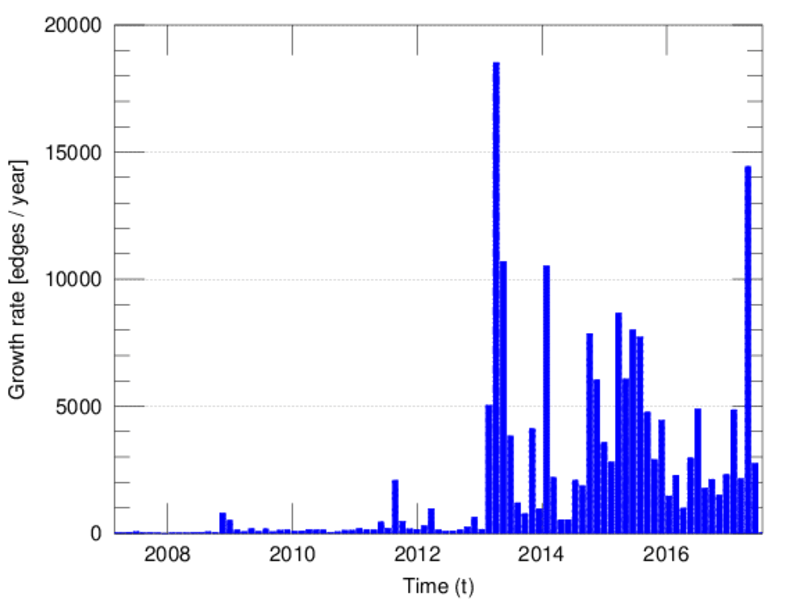
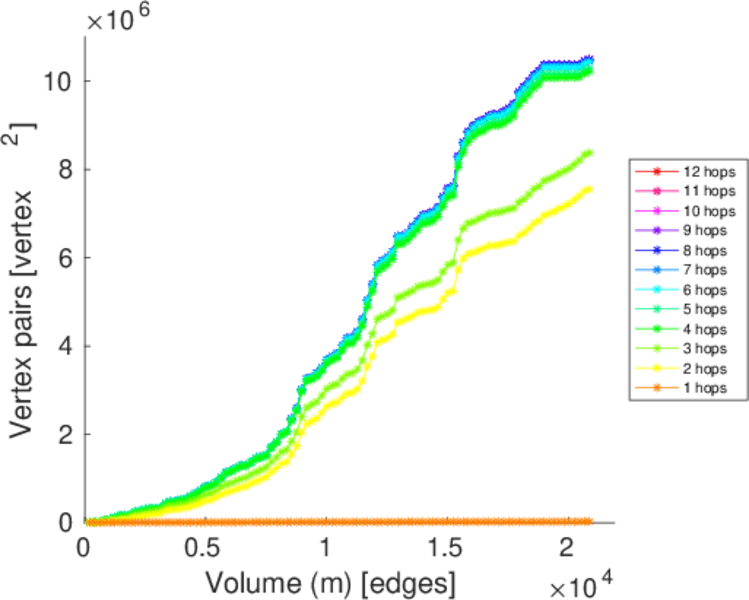
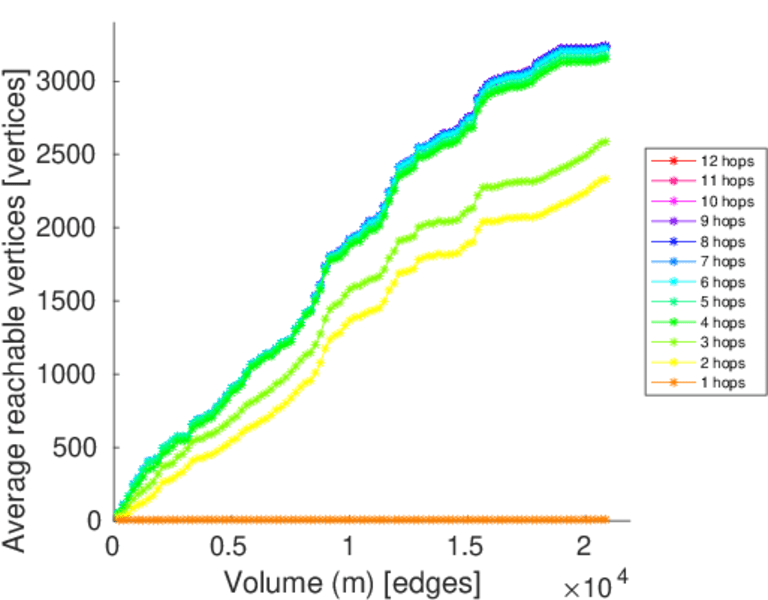
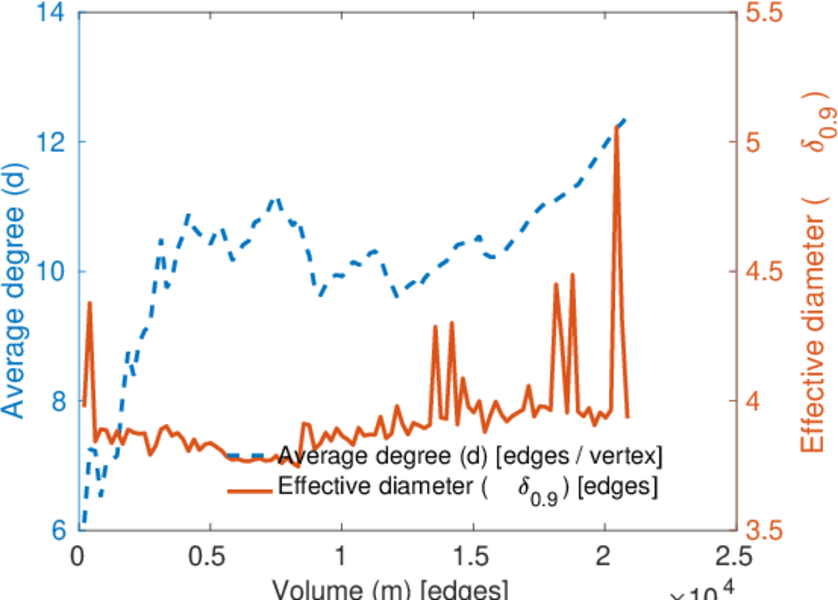
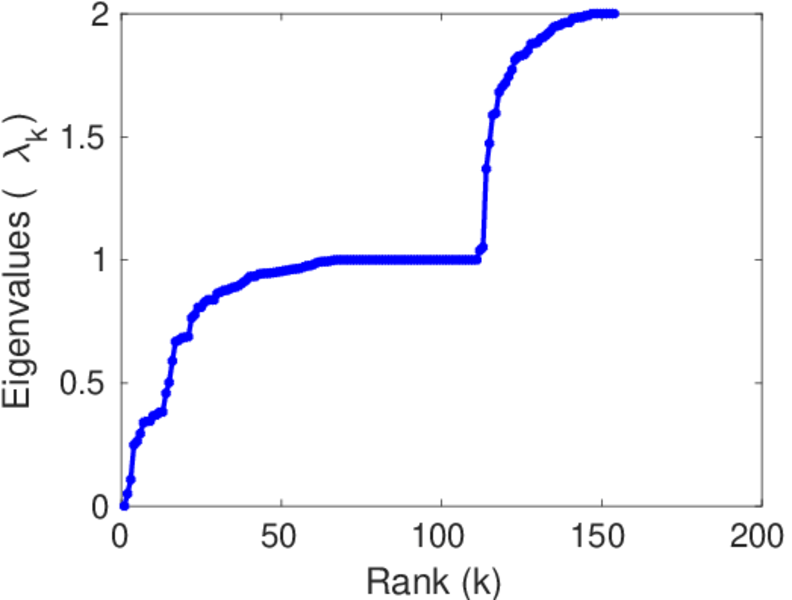
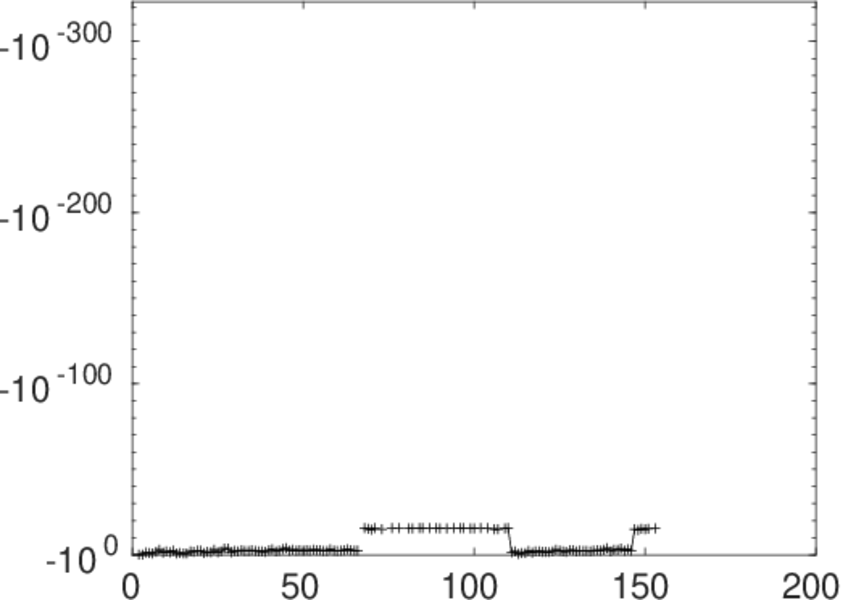
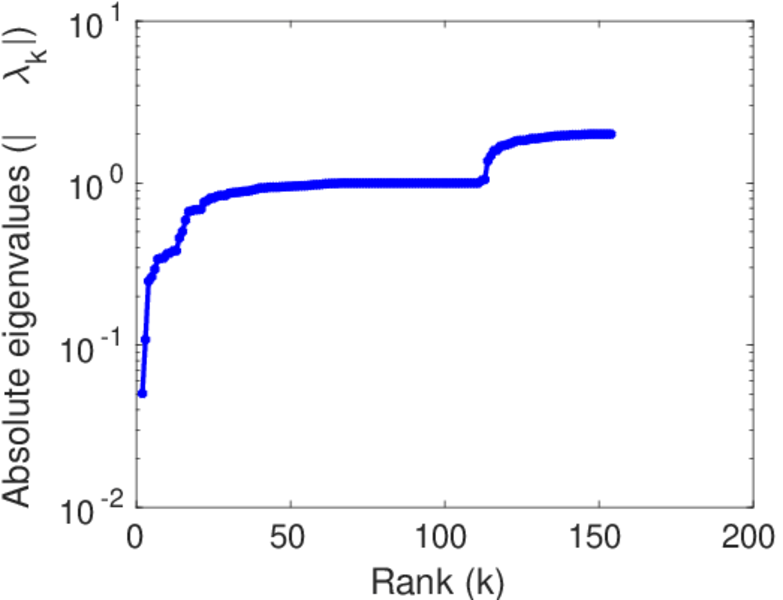
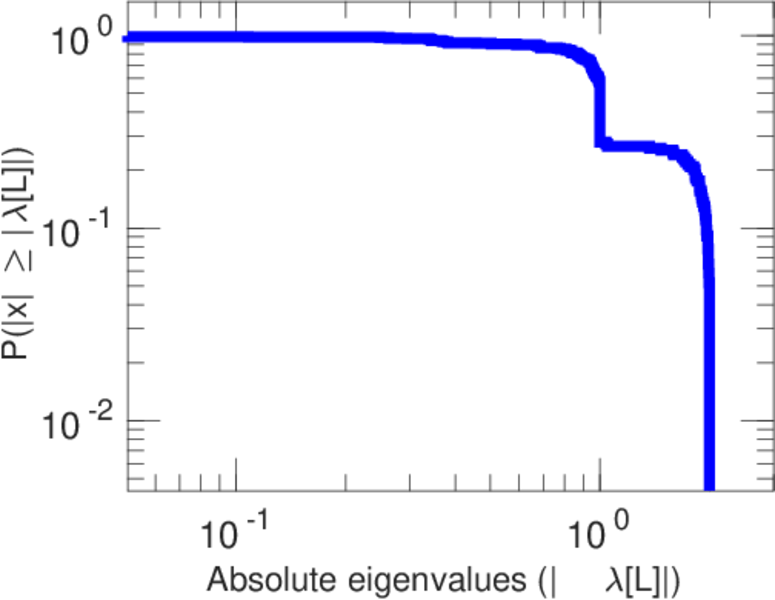
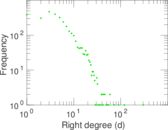
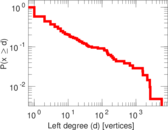
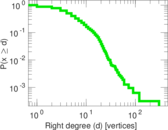
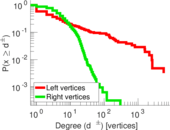
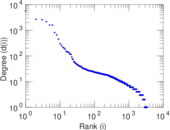
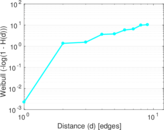
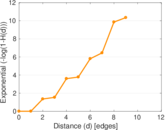
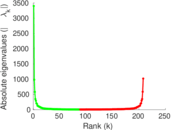
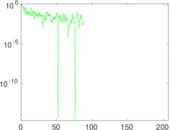
Plots
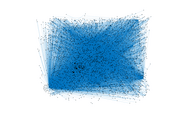


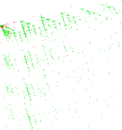
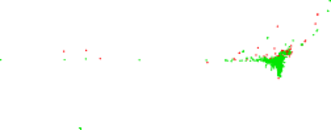
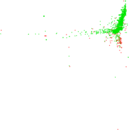


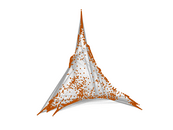


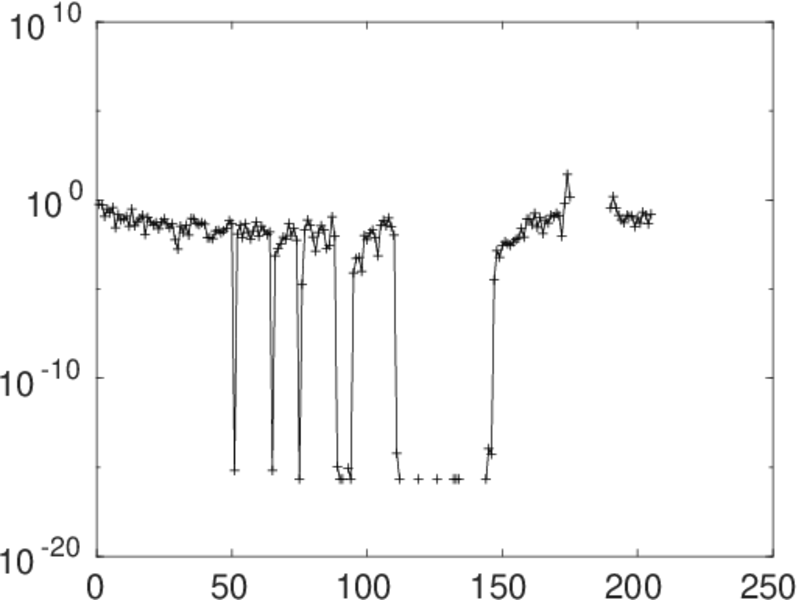
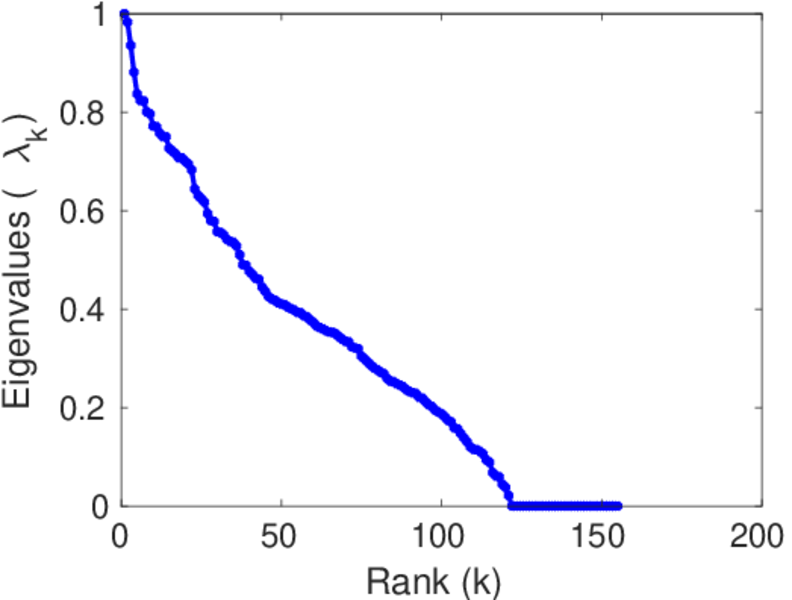
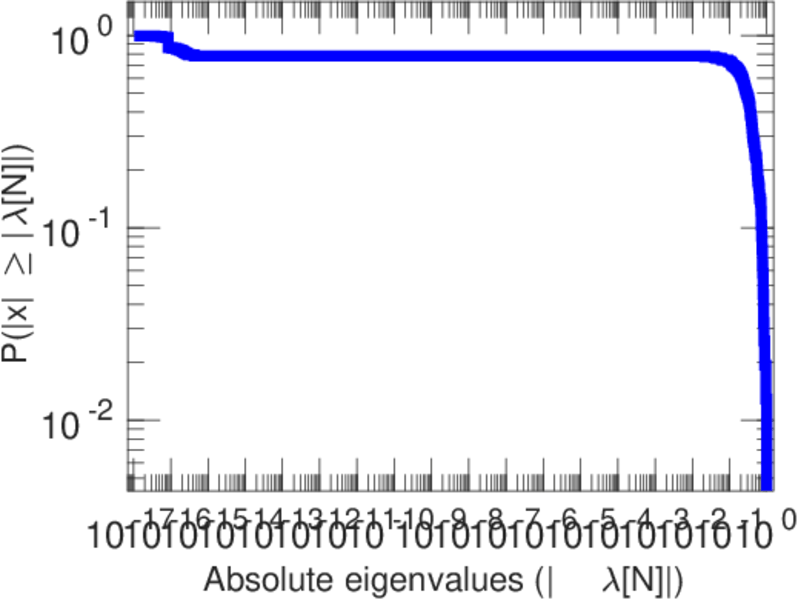
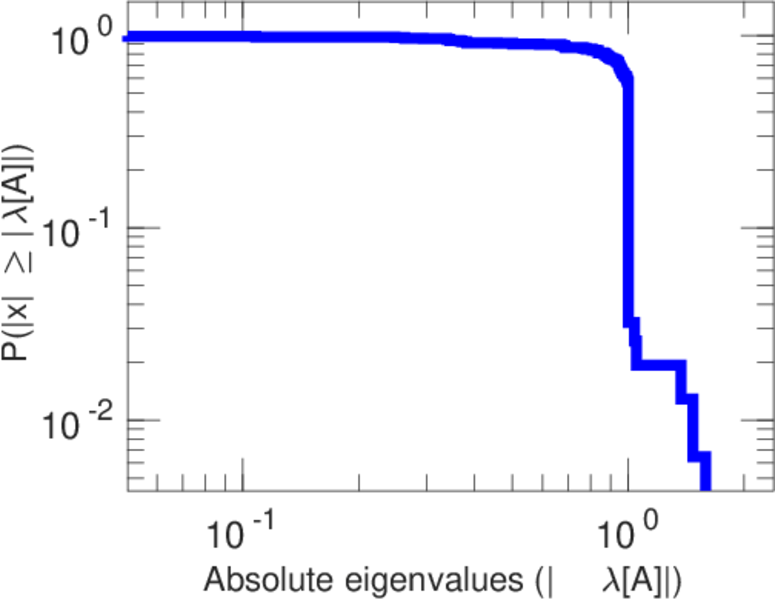
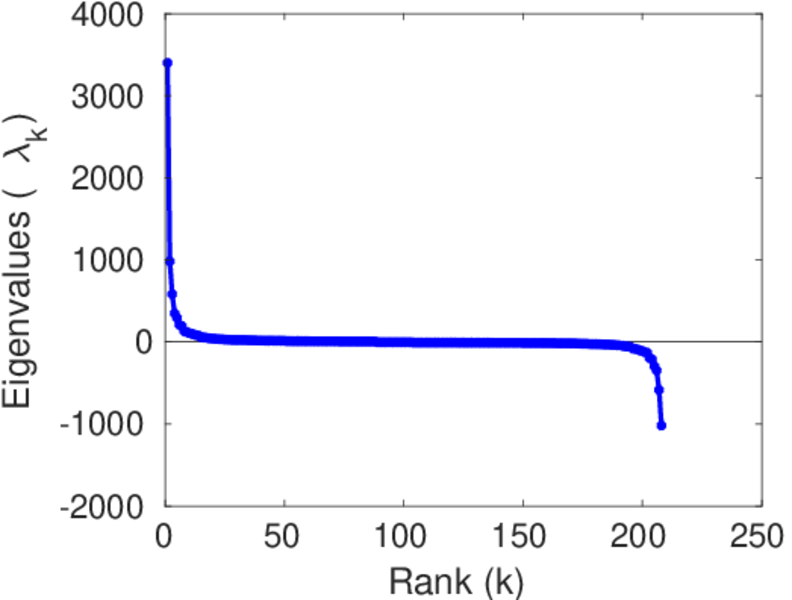
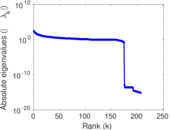
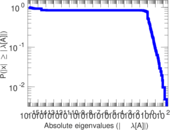
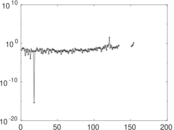
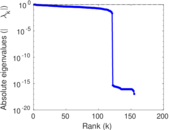
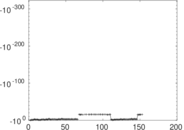
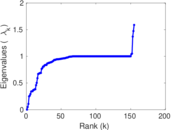
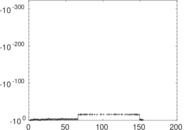
Matrix decompositions plots


Downloads
References
|
[1]
|
Jérôme Kunegis.
KONECT – The Koblenz Network Collection.
In Proc. Int. Conf. on World Wide Web Companion, pages
1343–1350, 2013.
[ http ]
|
|
[2]
|
Wikimedia Foundation.
Wikimedia downloads.
http://dumps.wikimedia.org/, January 2010.
|
 KONECT ‣ Networks ‣
Buy Me a Coffee
KONECT ‣ Networks ‣
Buy Me a Coffee