Wikipedia edits (vep)
This is the bipartite edit network of the Veps Wikipedia. It contains users and
pages from the Veps Wikipedia, connected by edit events. Each edge represents
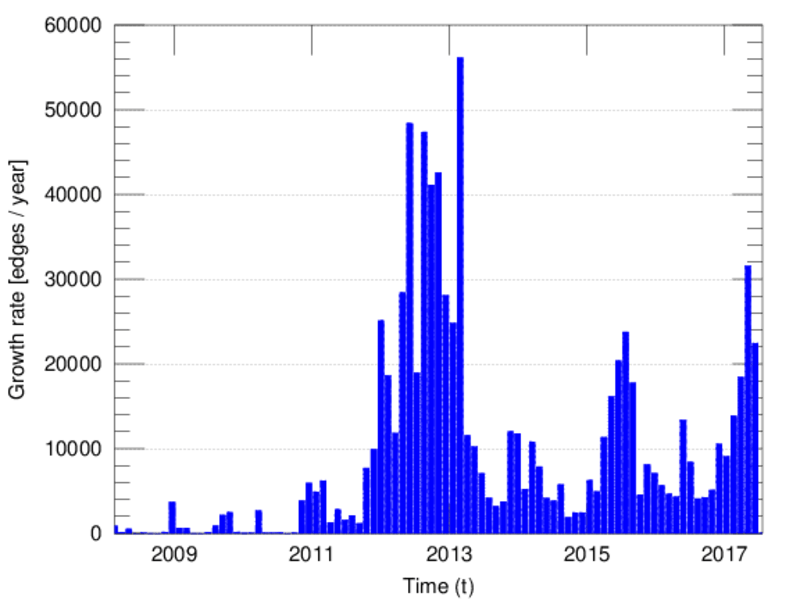
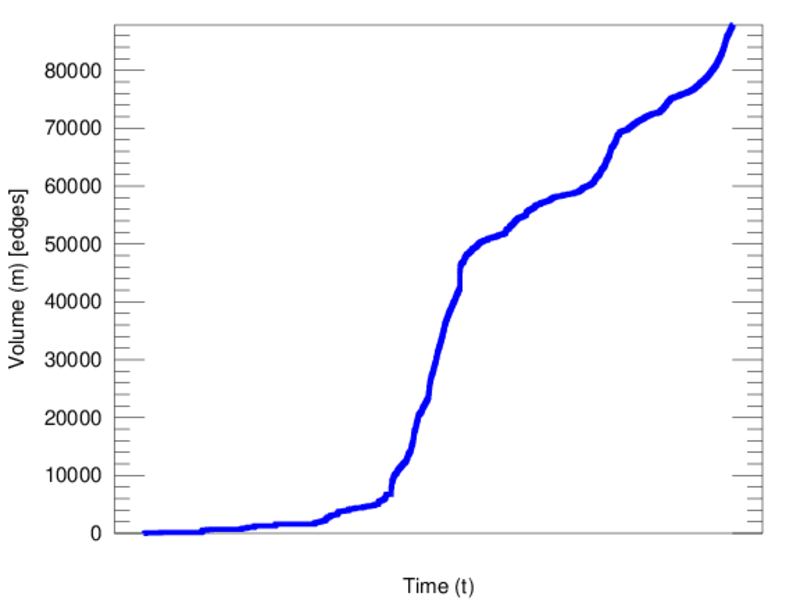
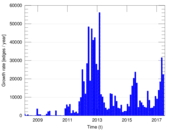
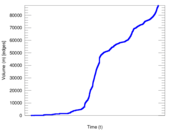
an edit. The dataset includes the timestamp of each edit.
Metadata
Statistics
| Size | n = | 17,107
|
| Left size | n1 = | 730
|
| Right size | n2 = | 16,377
|
| Volume | m = | 87,803
|
| Unique edge count | m̿ = | 46,421
|
| Wedge count | s = | 92,251,428
|
| Claw count | z = | 238,093,291,016
|
| Cross count | x = | 560,452,625,079,222
|
| Square count | q = | 43,971,470
|
| 4-Tour count | T4 = | 720,943,862
|
| Maximum degree | dmax = | 25,167
|
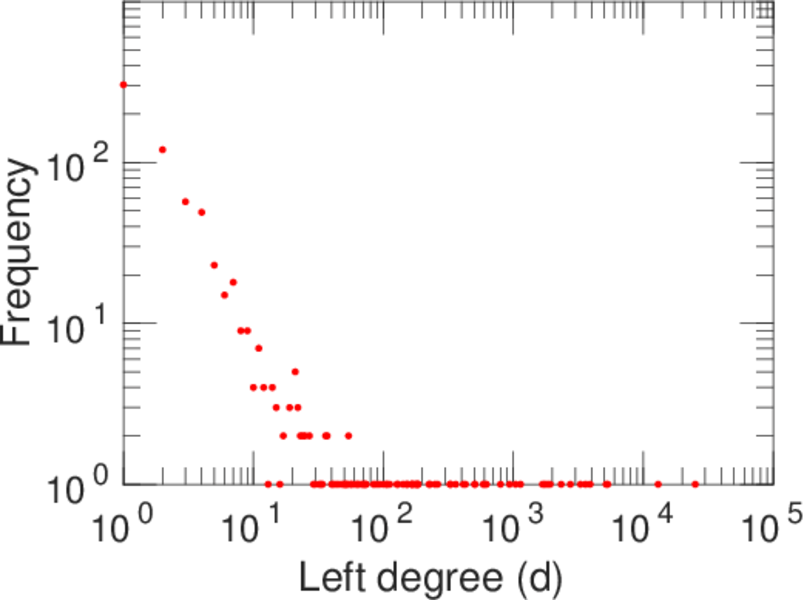
| Maximum left degree | d1max = | 25,167
|
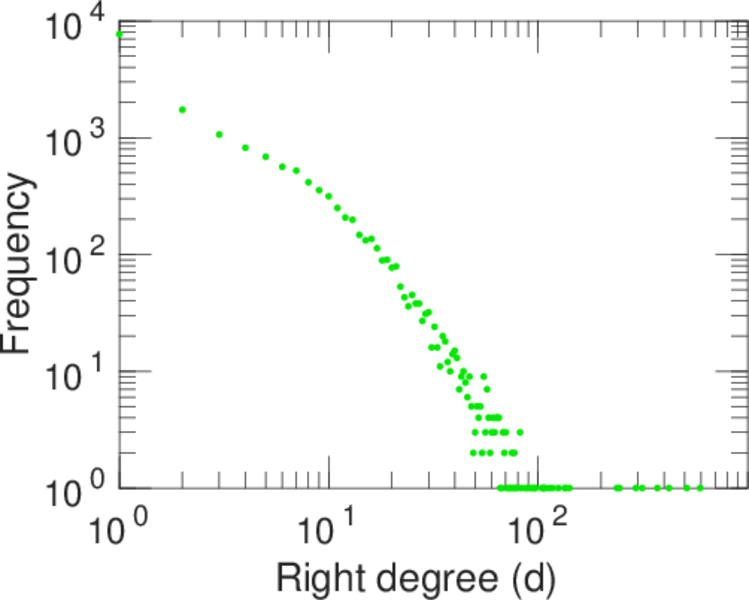
| Maximum right degree | d2max = | 594
|
| Average degree | d = | 10.265 2
|
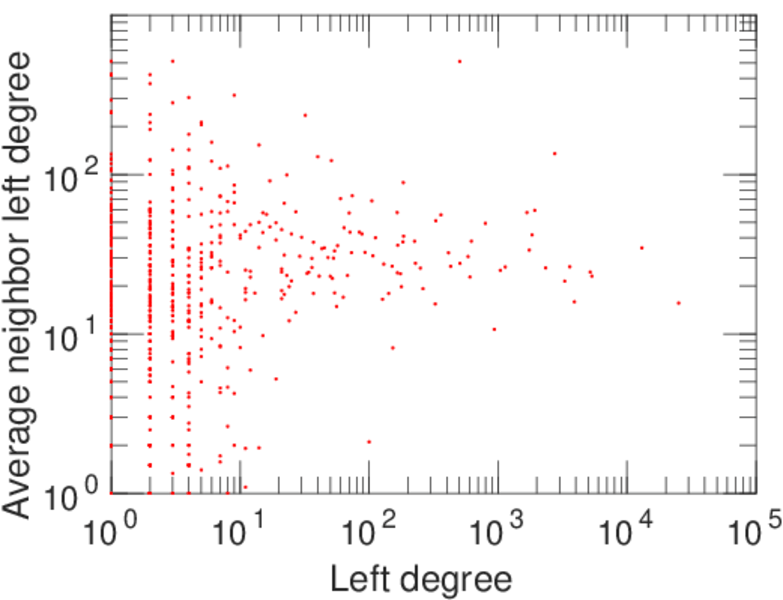
| Average left degree | d1 = | 120.278
|
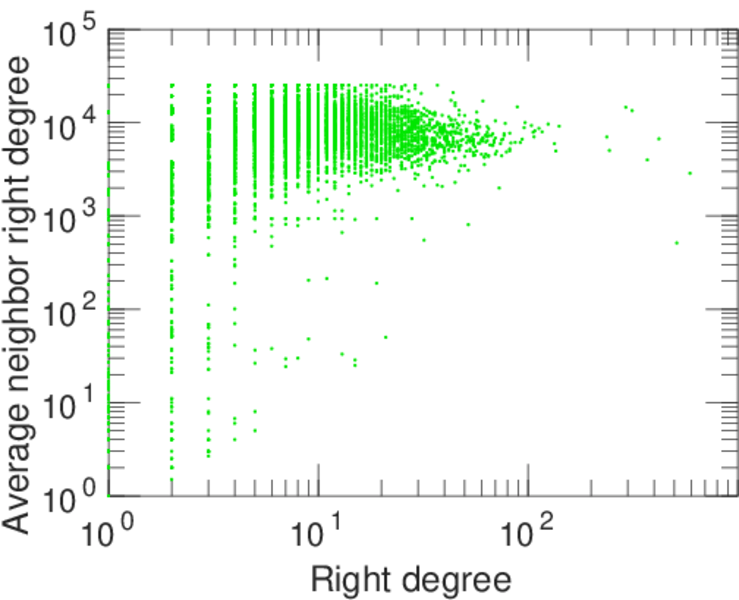
| Average right degree | d2 = | 5.361 36
|
| Fill | p = | 0.003 882 91
|
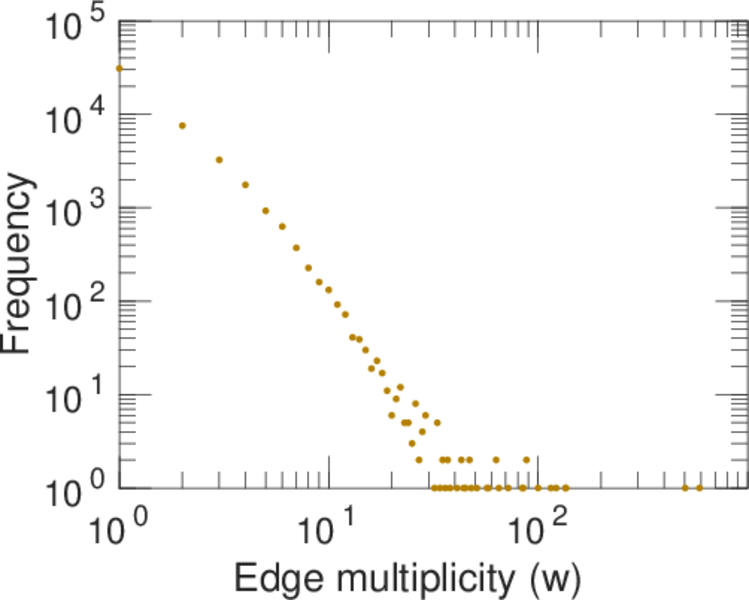
| Average edge multiplicity | m̃ = | 1.891 45
|
| Size of LCC | N = | 16,873
|
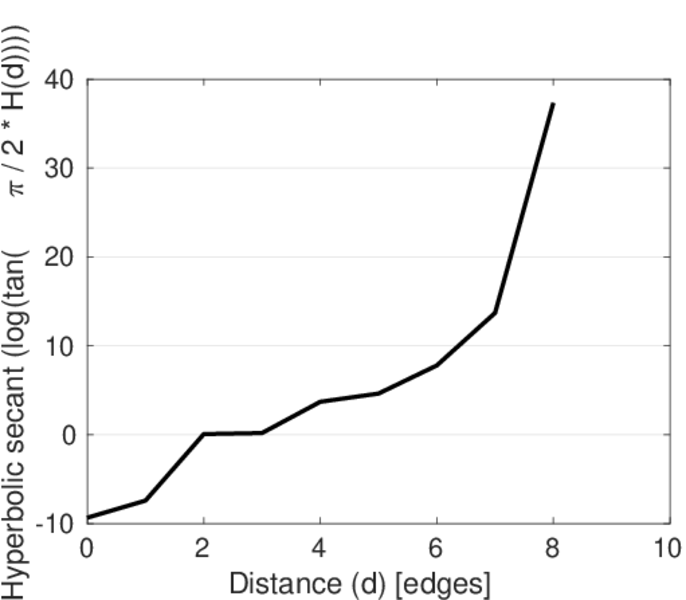
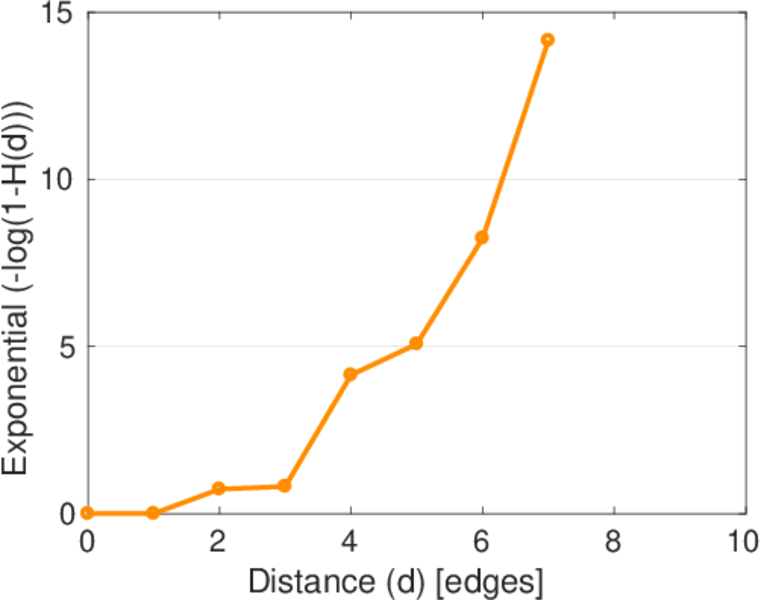
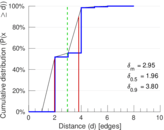
| Diameter | δ = | 10
|
| 50-Percentile effective diameter | δ0.5 = | 1.964 22
|
| 90-Percentile effective diameter | δ0.9 = | 3.803 16
|
| Median distance | δM = | 2
|
| Mean distance | δm = | 2.946 86
|
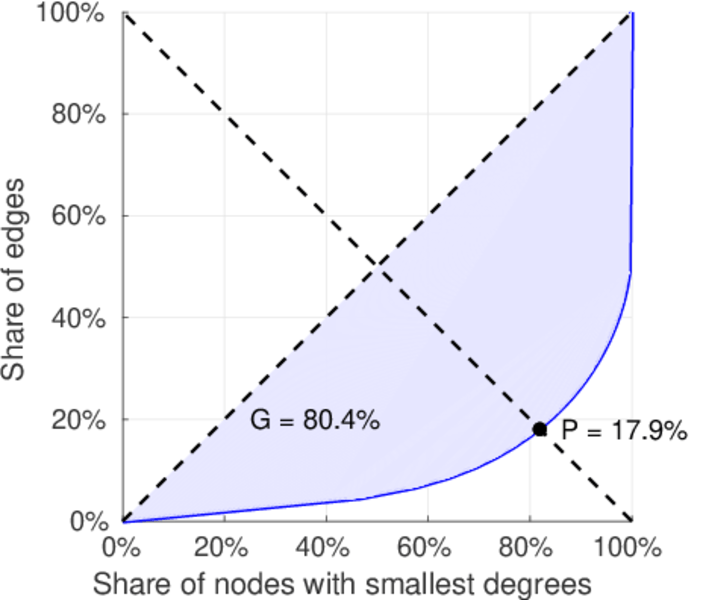
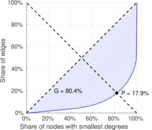
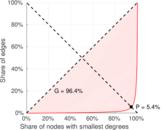
| Gini coefficient | G = | 0.810 200
|
| Balanced inequality ratio | P = | 0.177 557
|
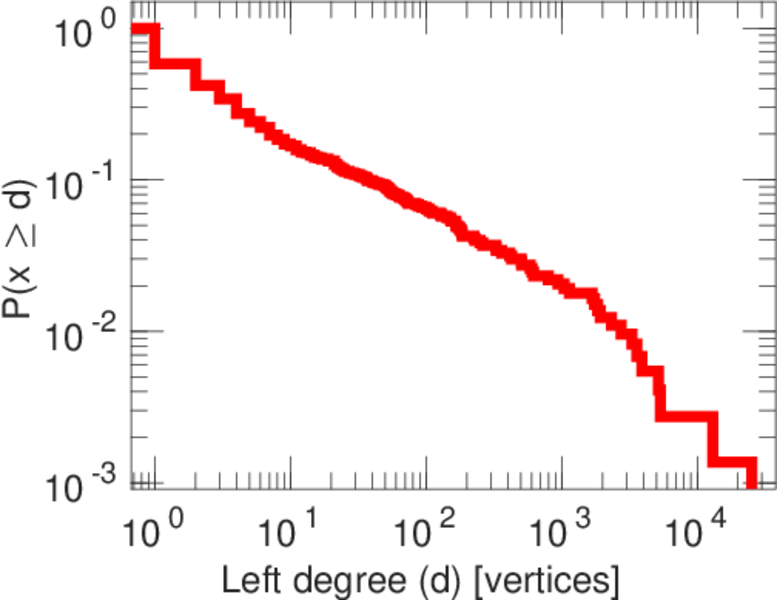
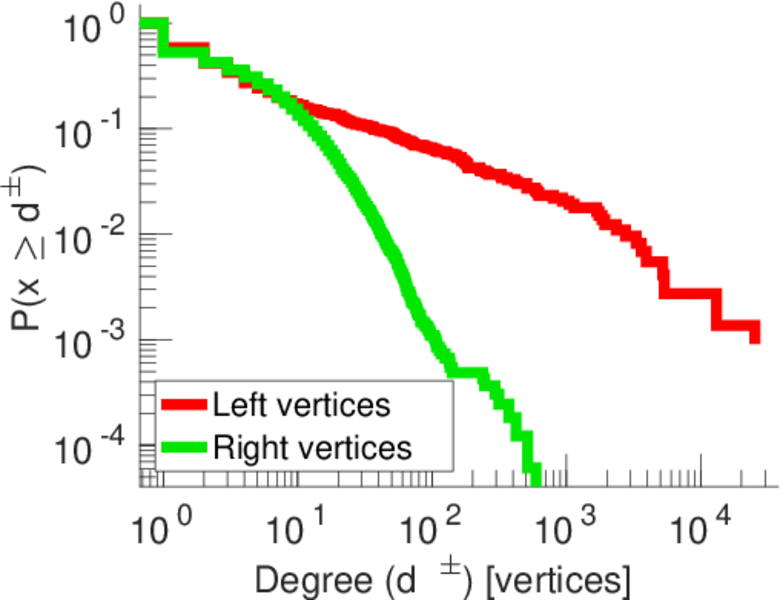
| Left balanced inequality ratio | P1 = | 0.053 859 2
|
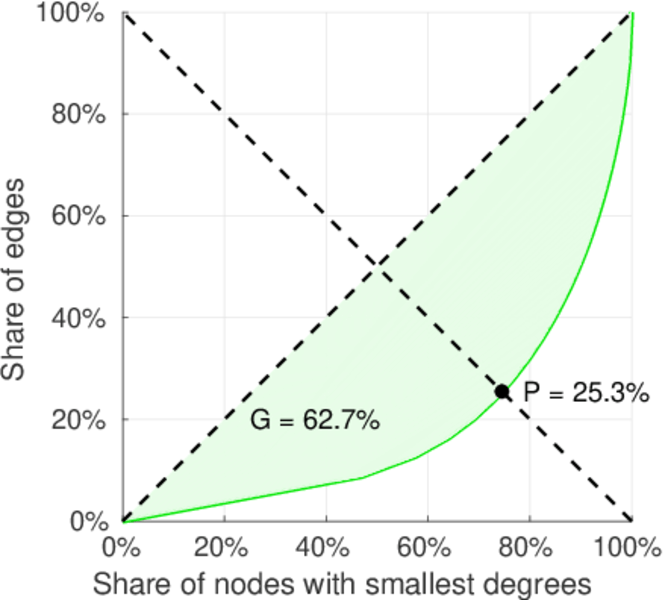
| Right balanced inequality ratio | P2 = | 0.253 351
|
| Relative edge distribution entropy | Her = | 0.713 265
|
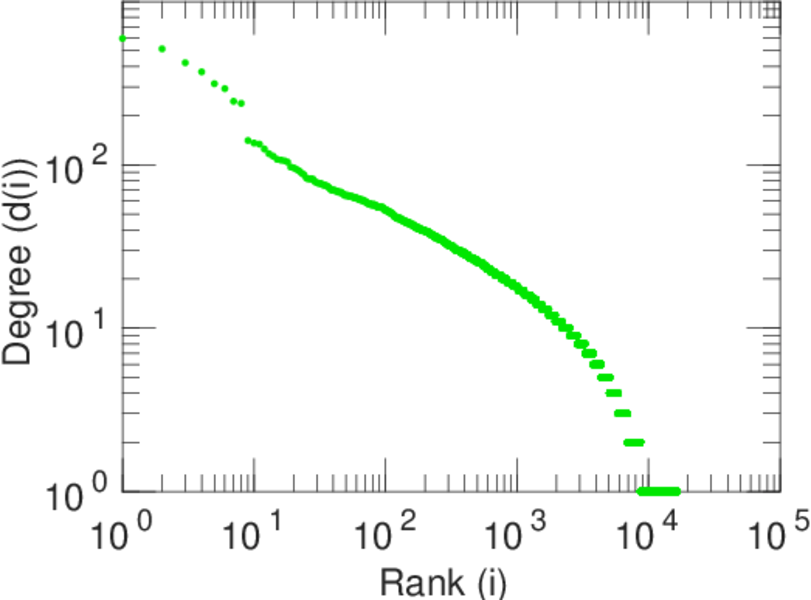
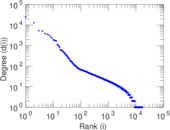
| Power law exponent | γ = | 2.630 82
|
| Tail power law exponent | γt = | 2.911 00
|
| Tail power law exponent with p | γ3 = | 2.911 00
|
| p-value | p = | 0.000 00
|
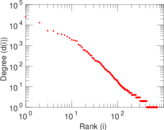
| Left tail power law exponent with p | γ3,1 = | 1.671 00
|
| Left p-value | p1 = | 0.000 00
|
| Right tail power law exponent with p | γ3,2 = | 7.371 00
|
| Right p-value | p2 = | 0.919 000
|
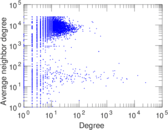
| Degree assortativity | ρ = | −0.413 831
|
| Degree assortativity p-value | pρ = | 0.000 00
|
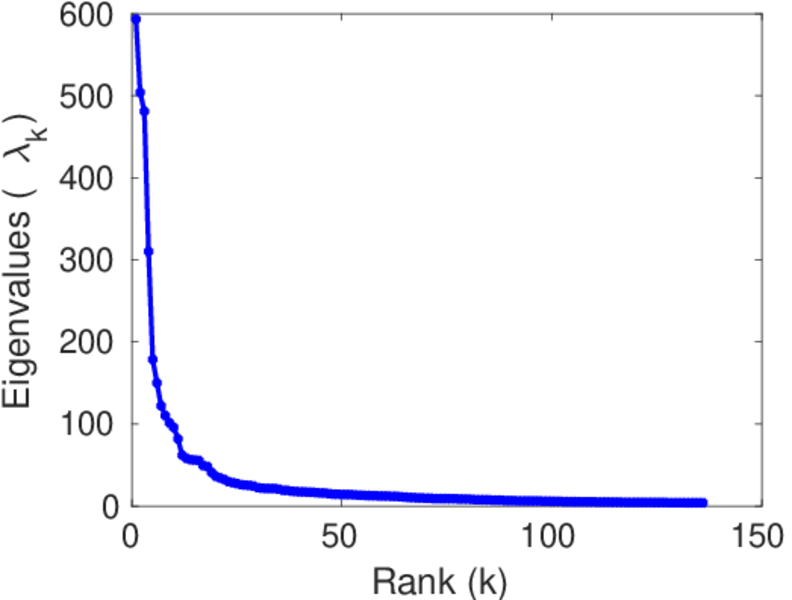
| Spectral norm | α = | 593.282
|
| Algebraic connectivity | a = | 0.083 620 7
|
| Spectral separation | |λ1[A] / λ2[A]| = | 1.177 10
|
| Controllability | C = | 15,749
|
| Relative controllability | Cr = | 0.921 371
|
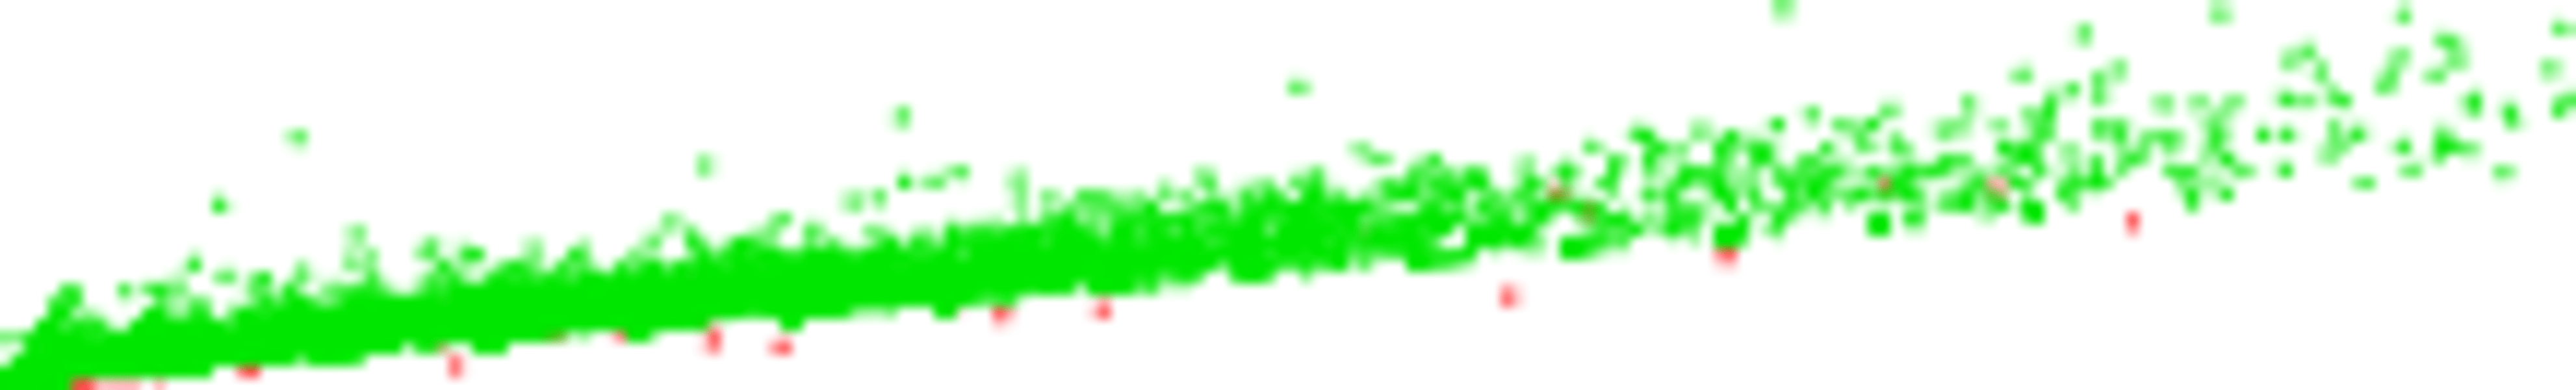
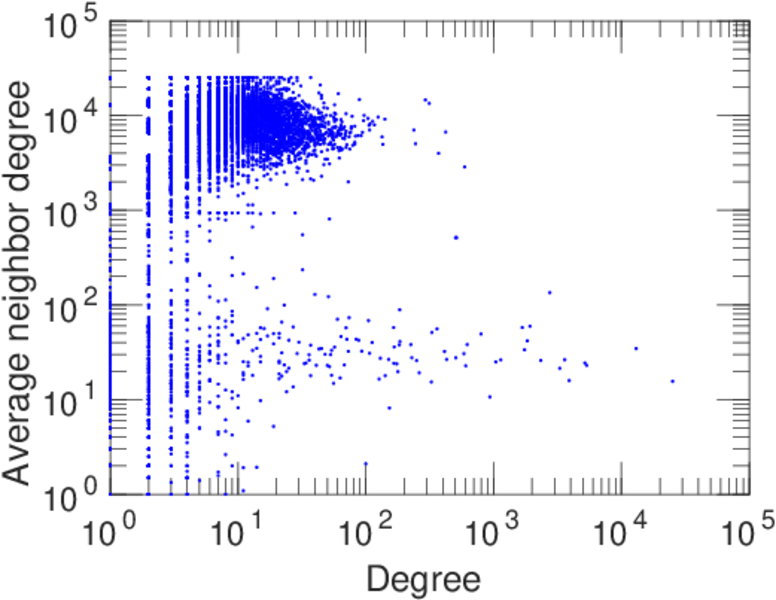
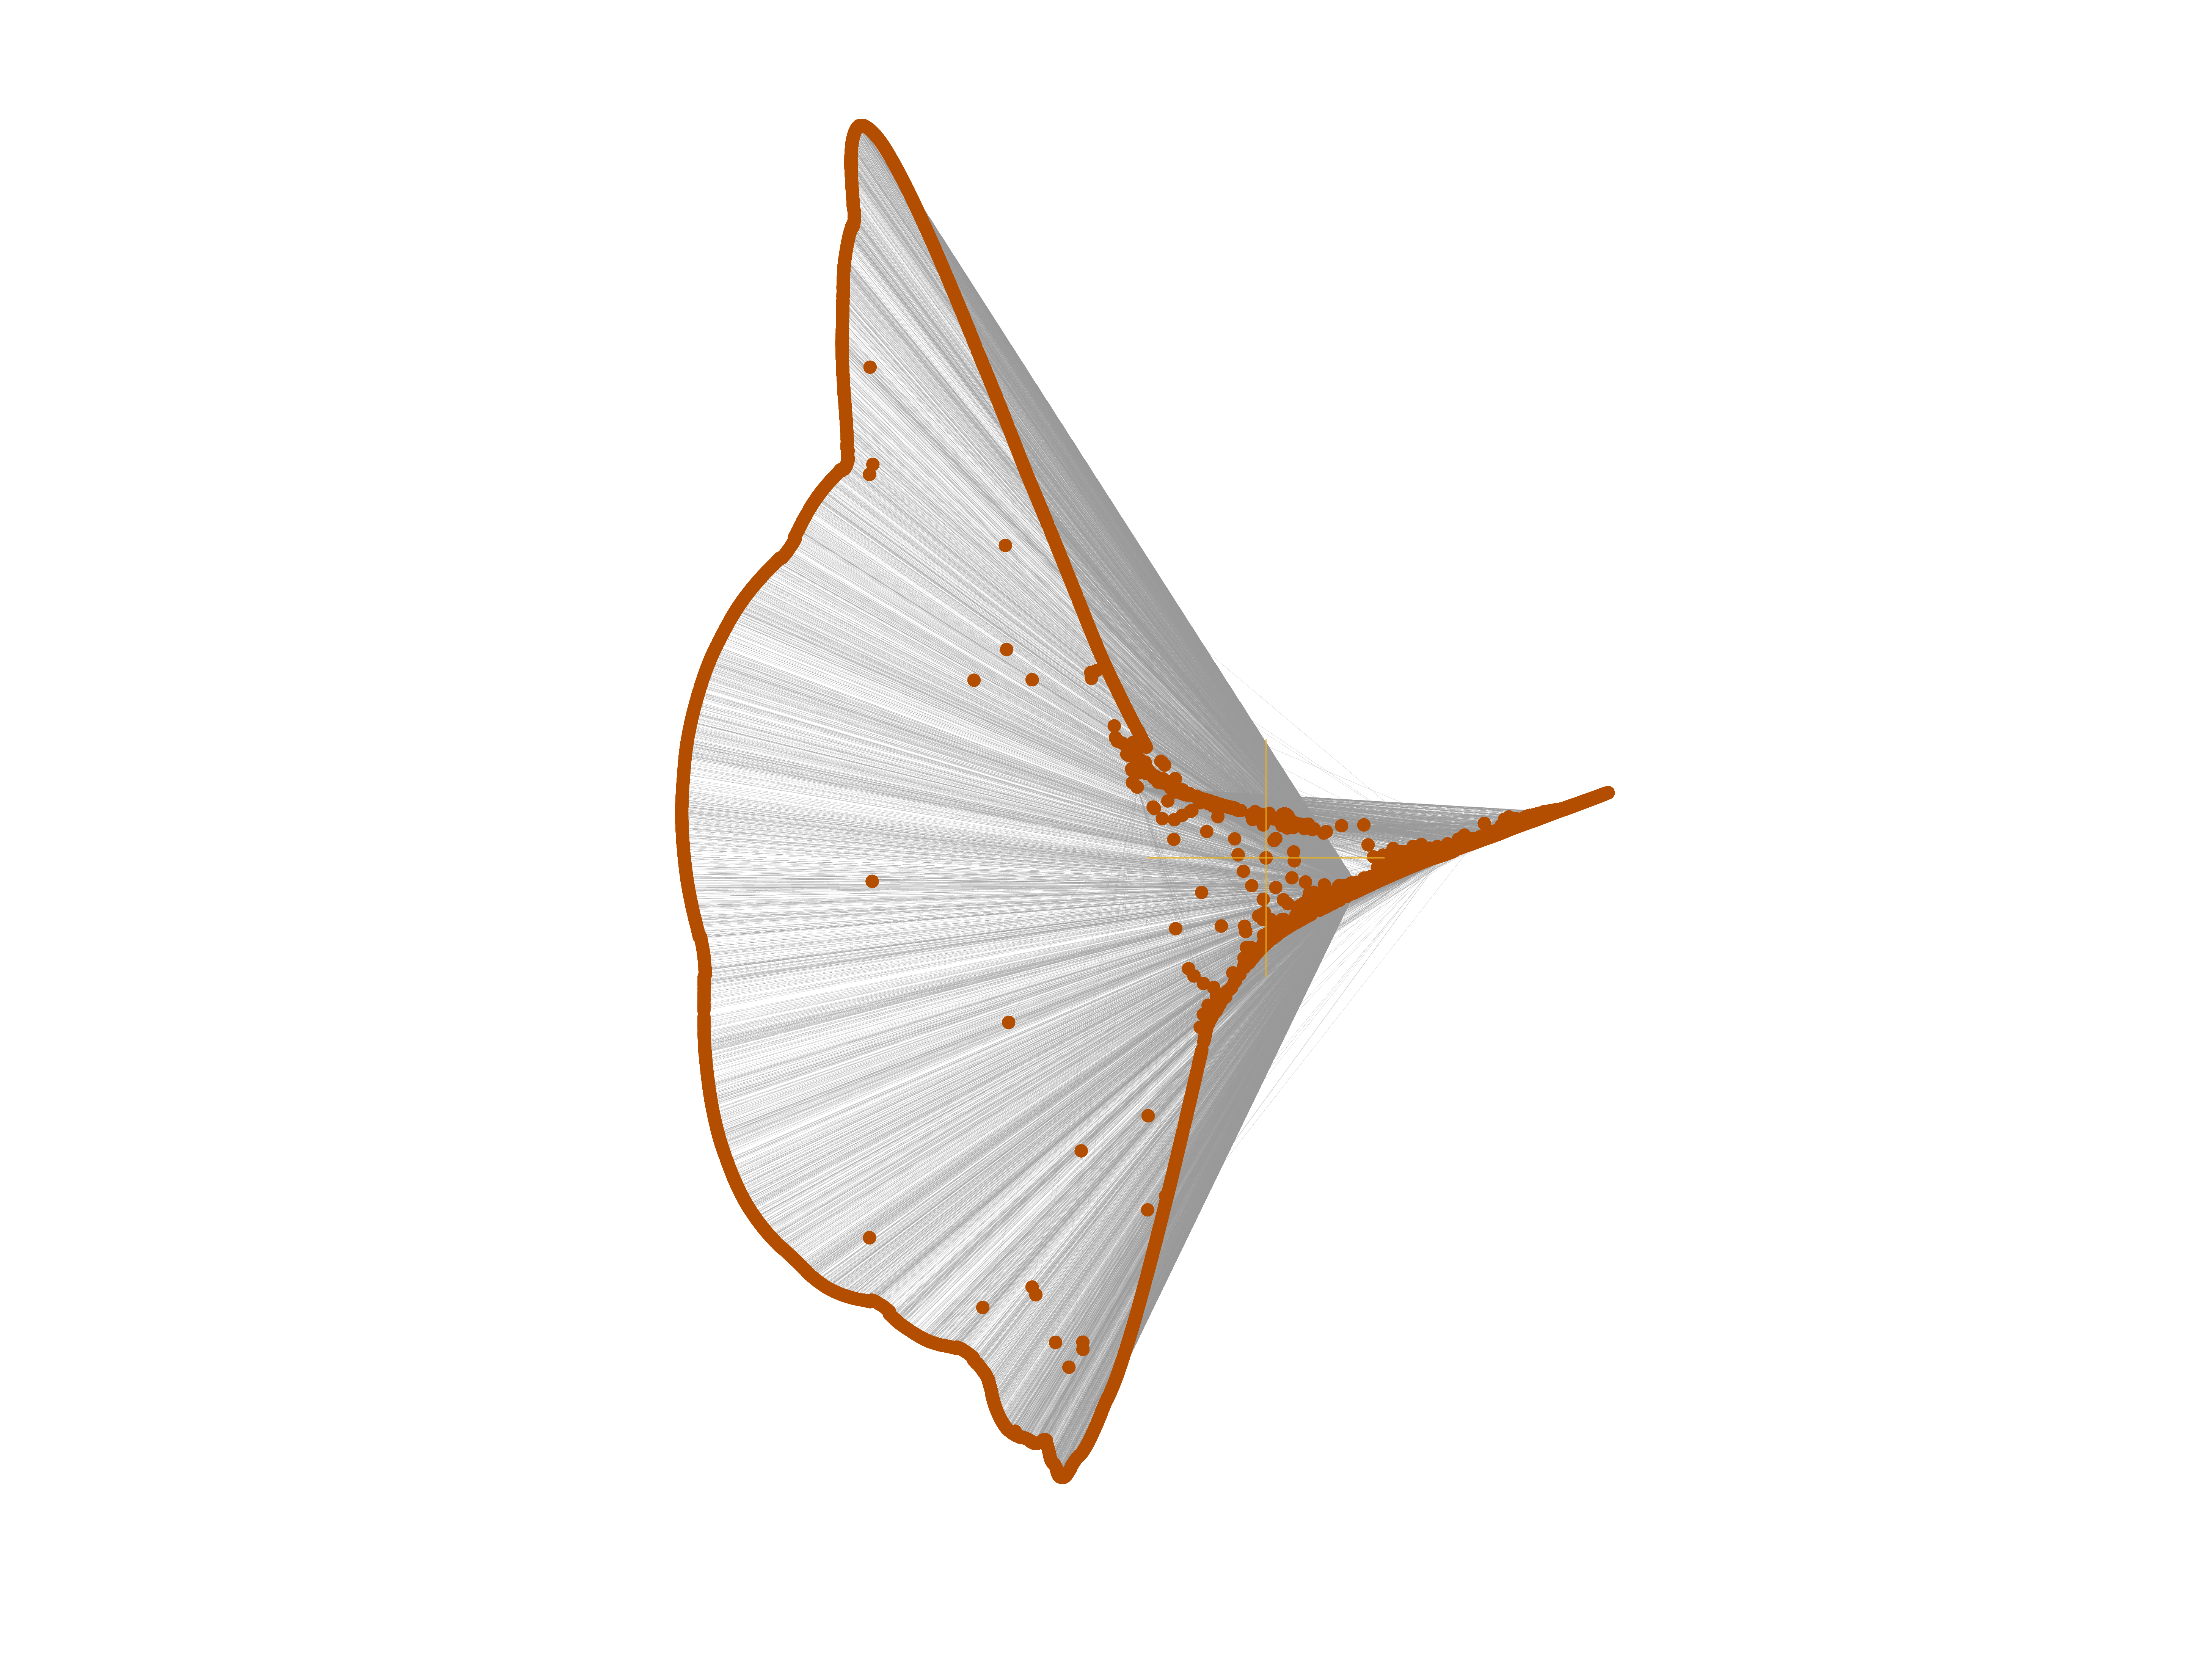
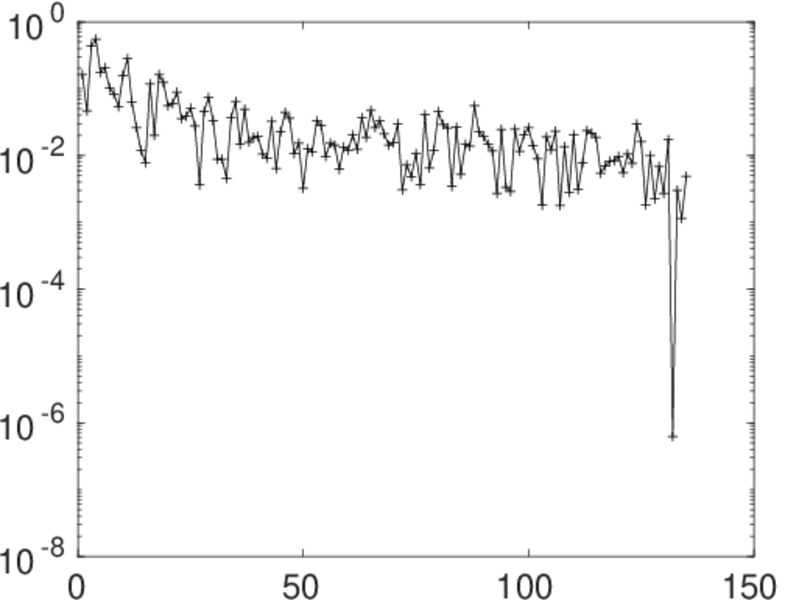
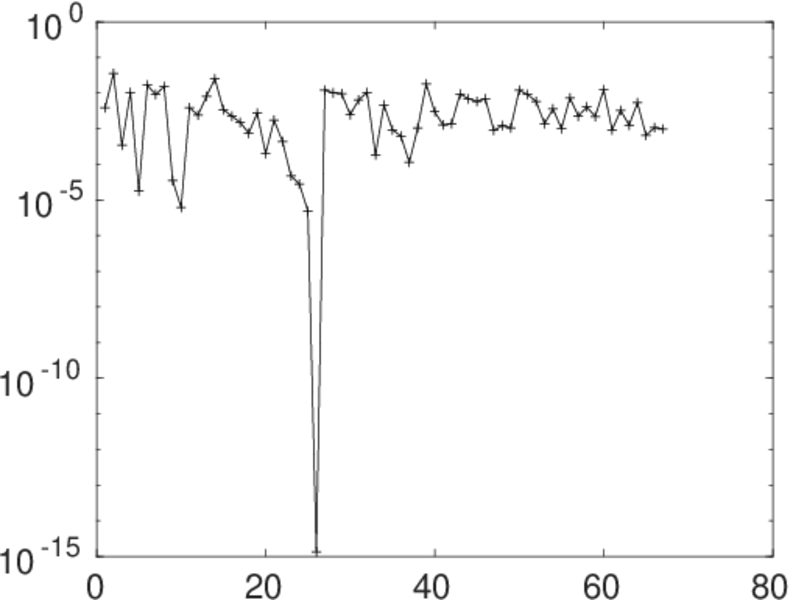
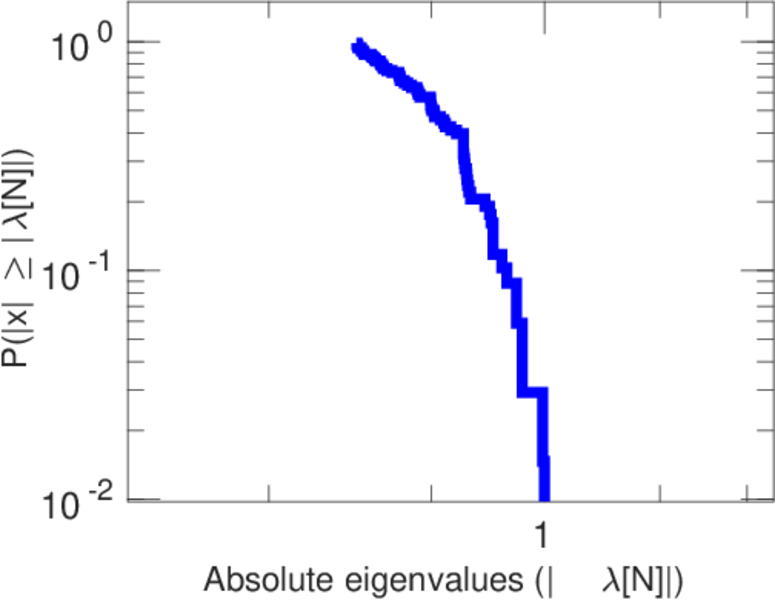
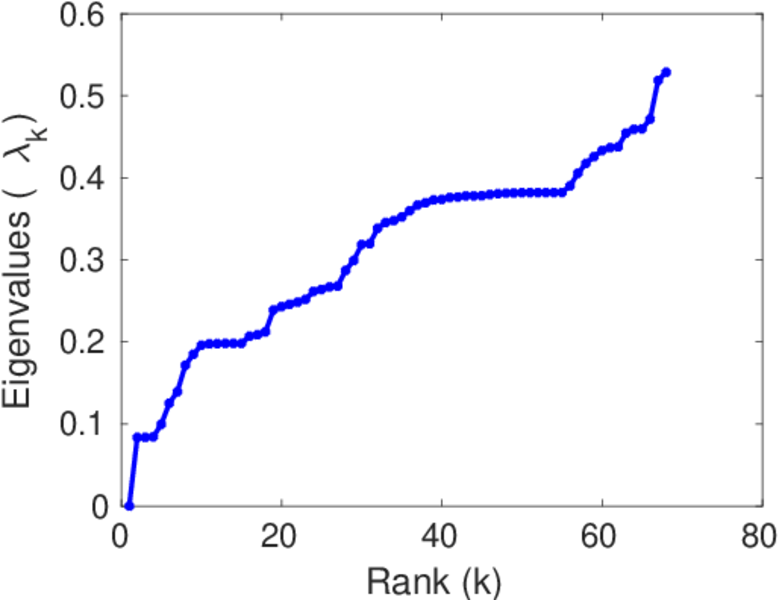
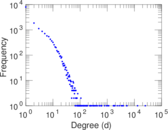
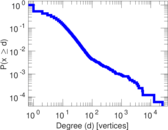
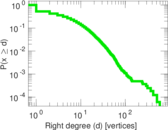
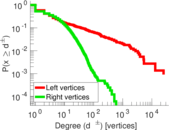
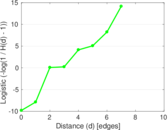
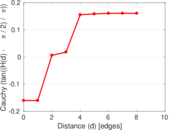
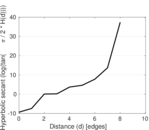
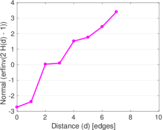
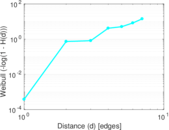
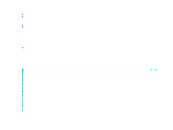
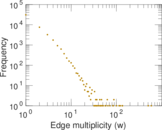
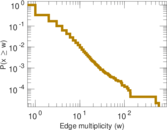
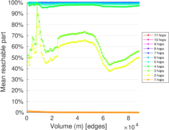
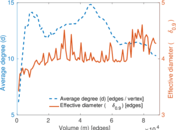
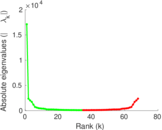
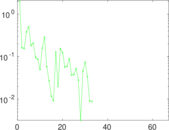
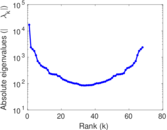
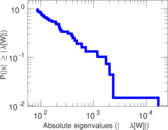
Plots


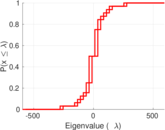
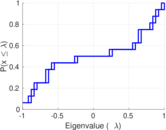
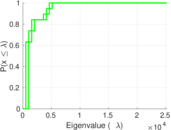


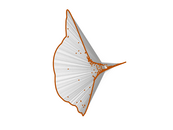
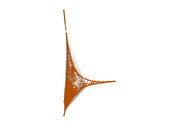
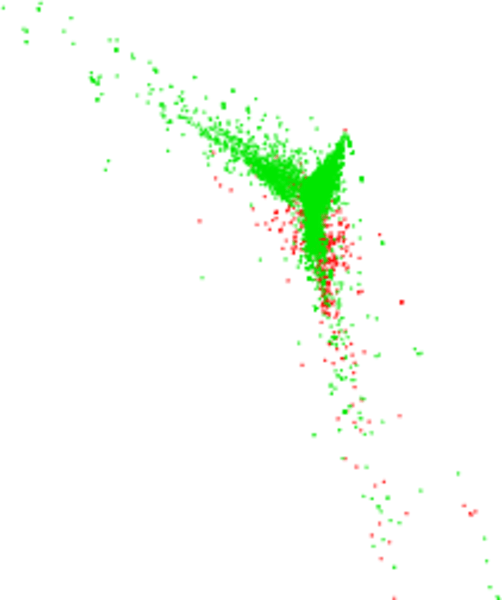
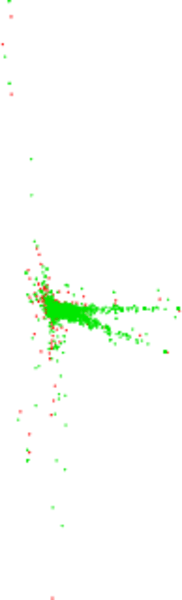
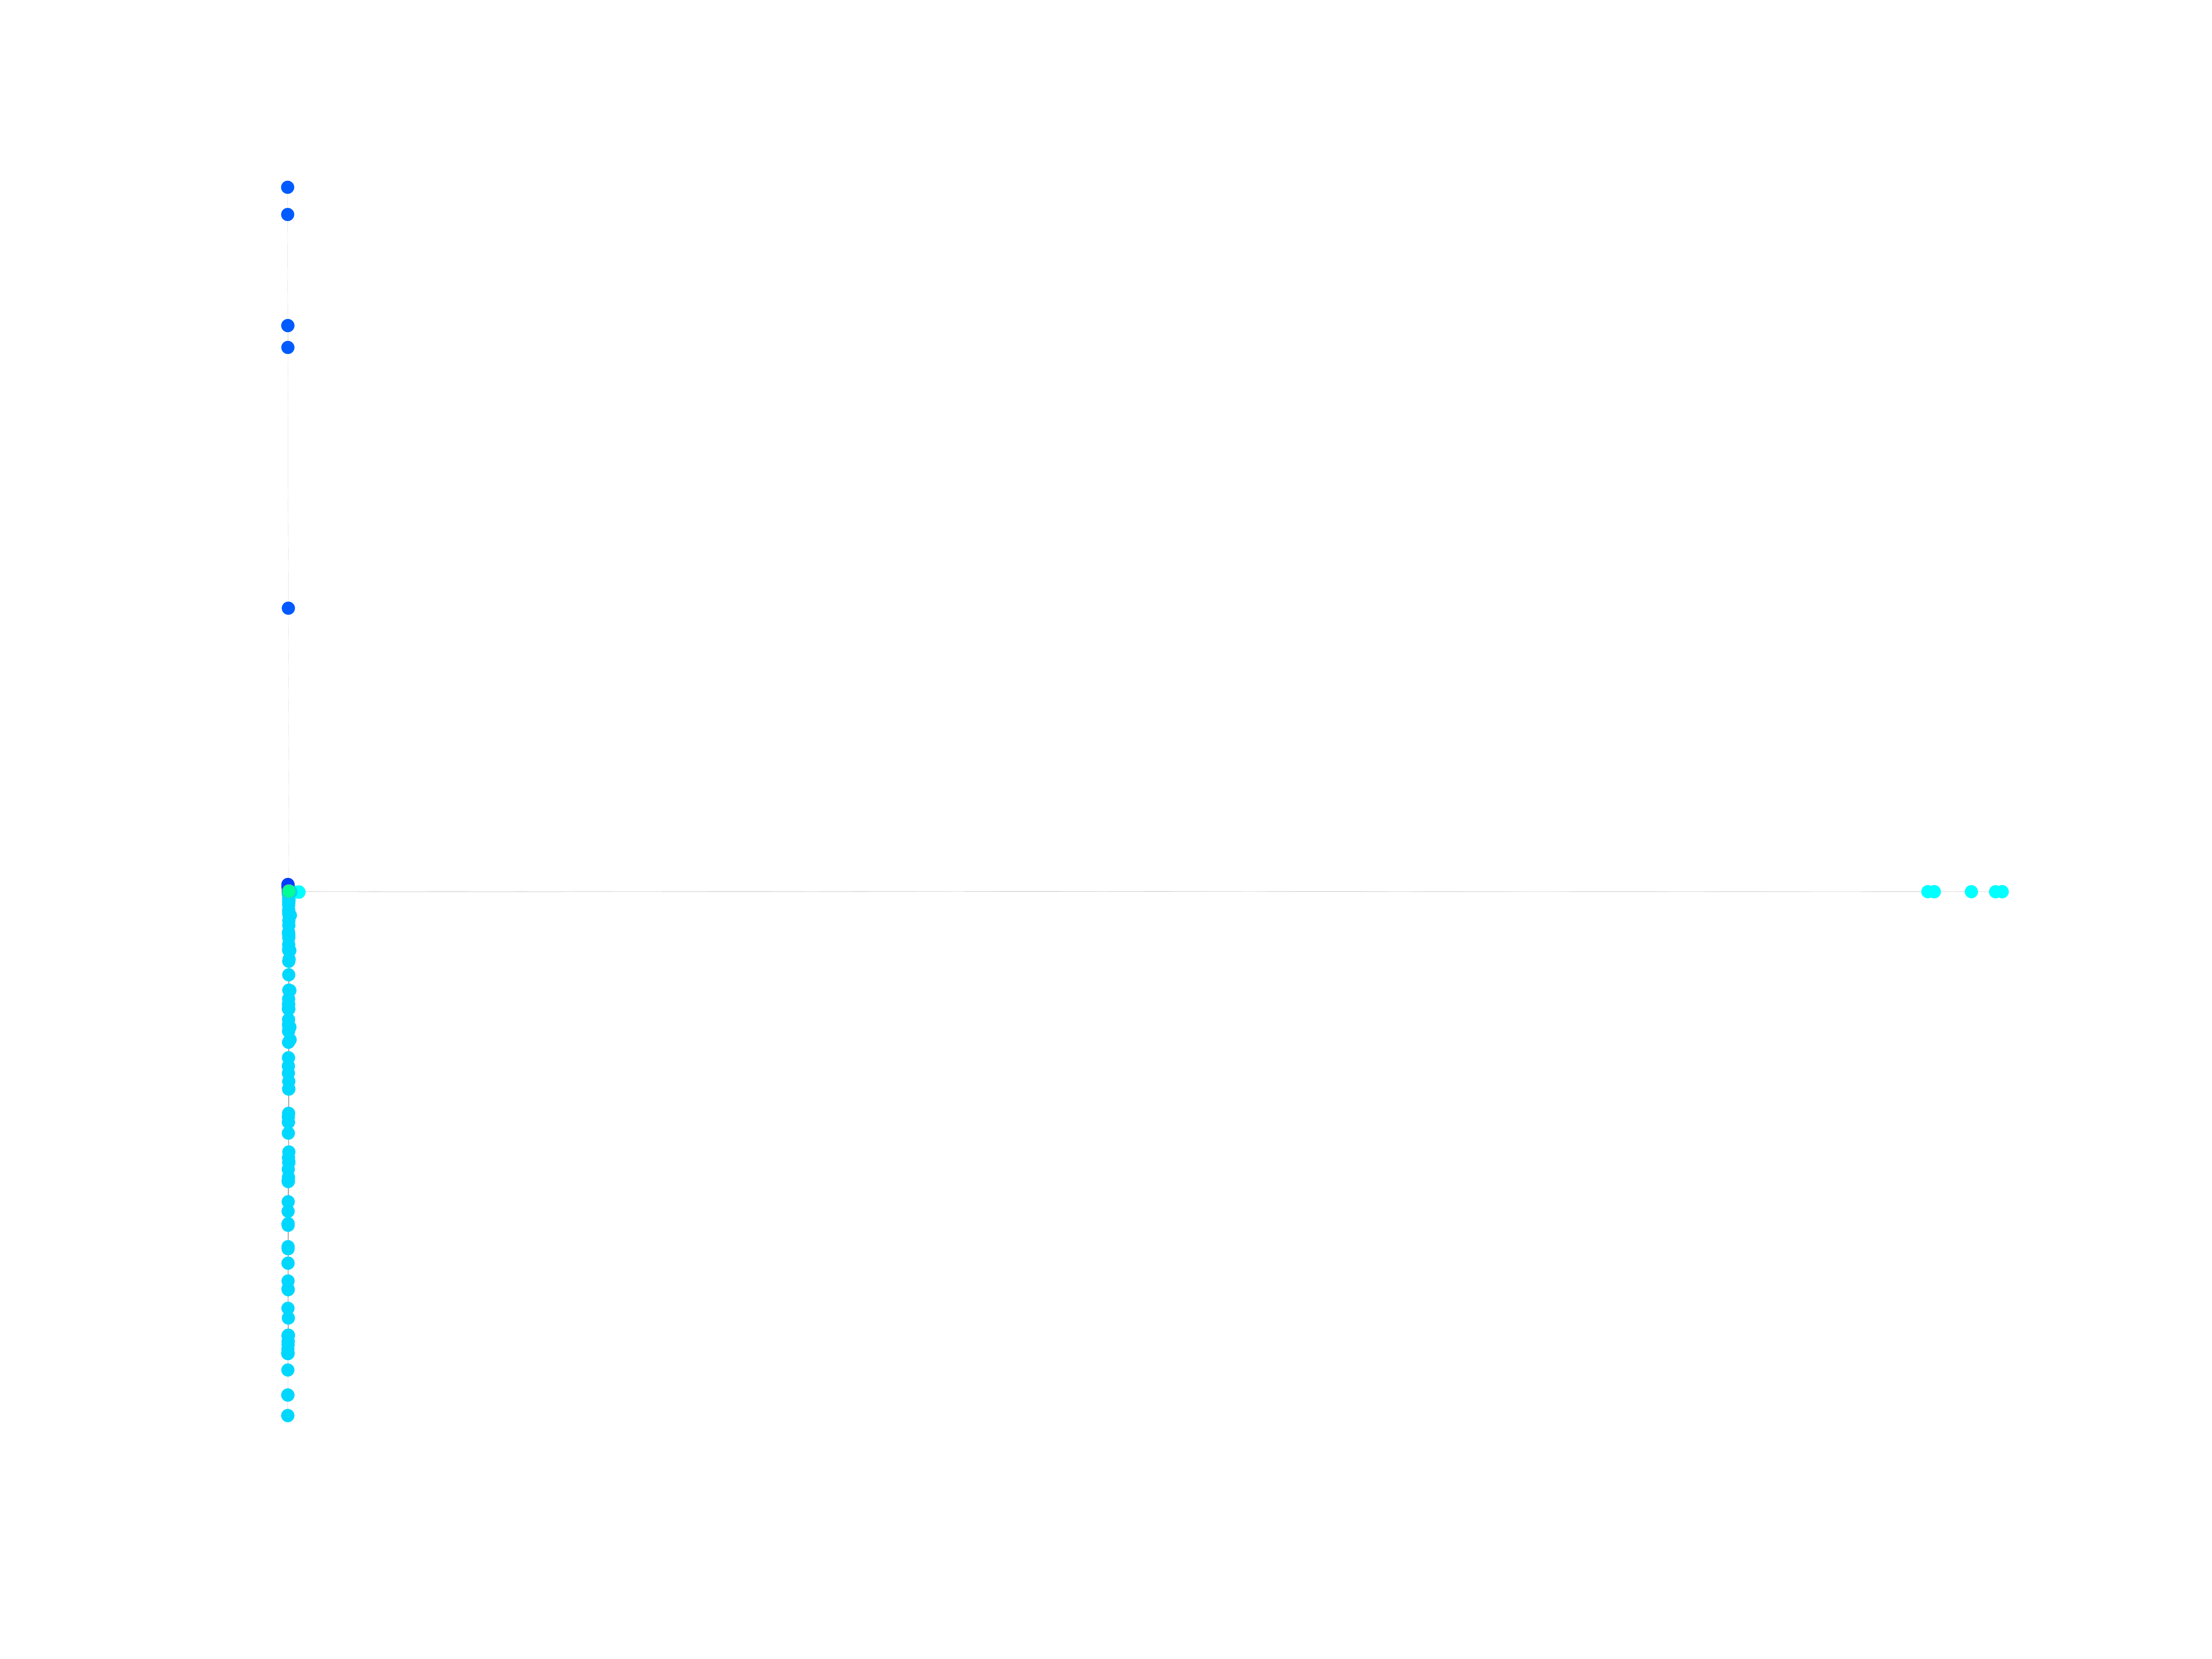
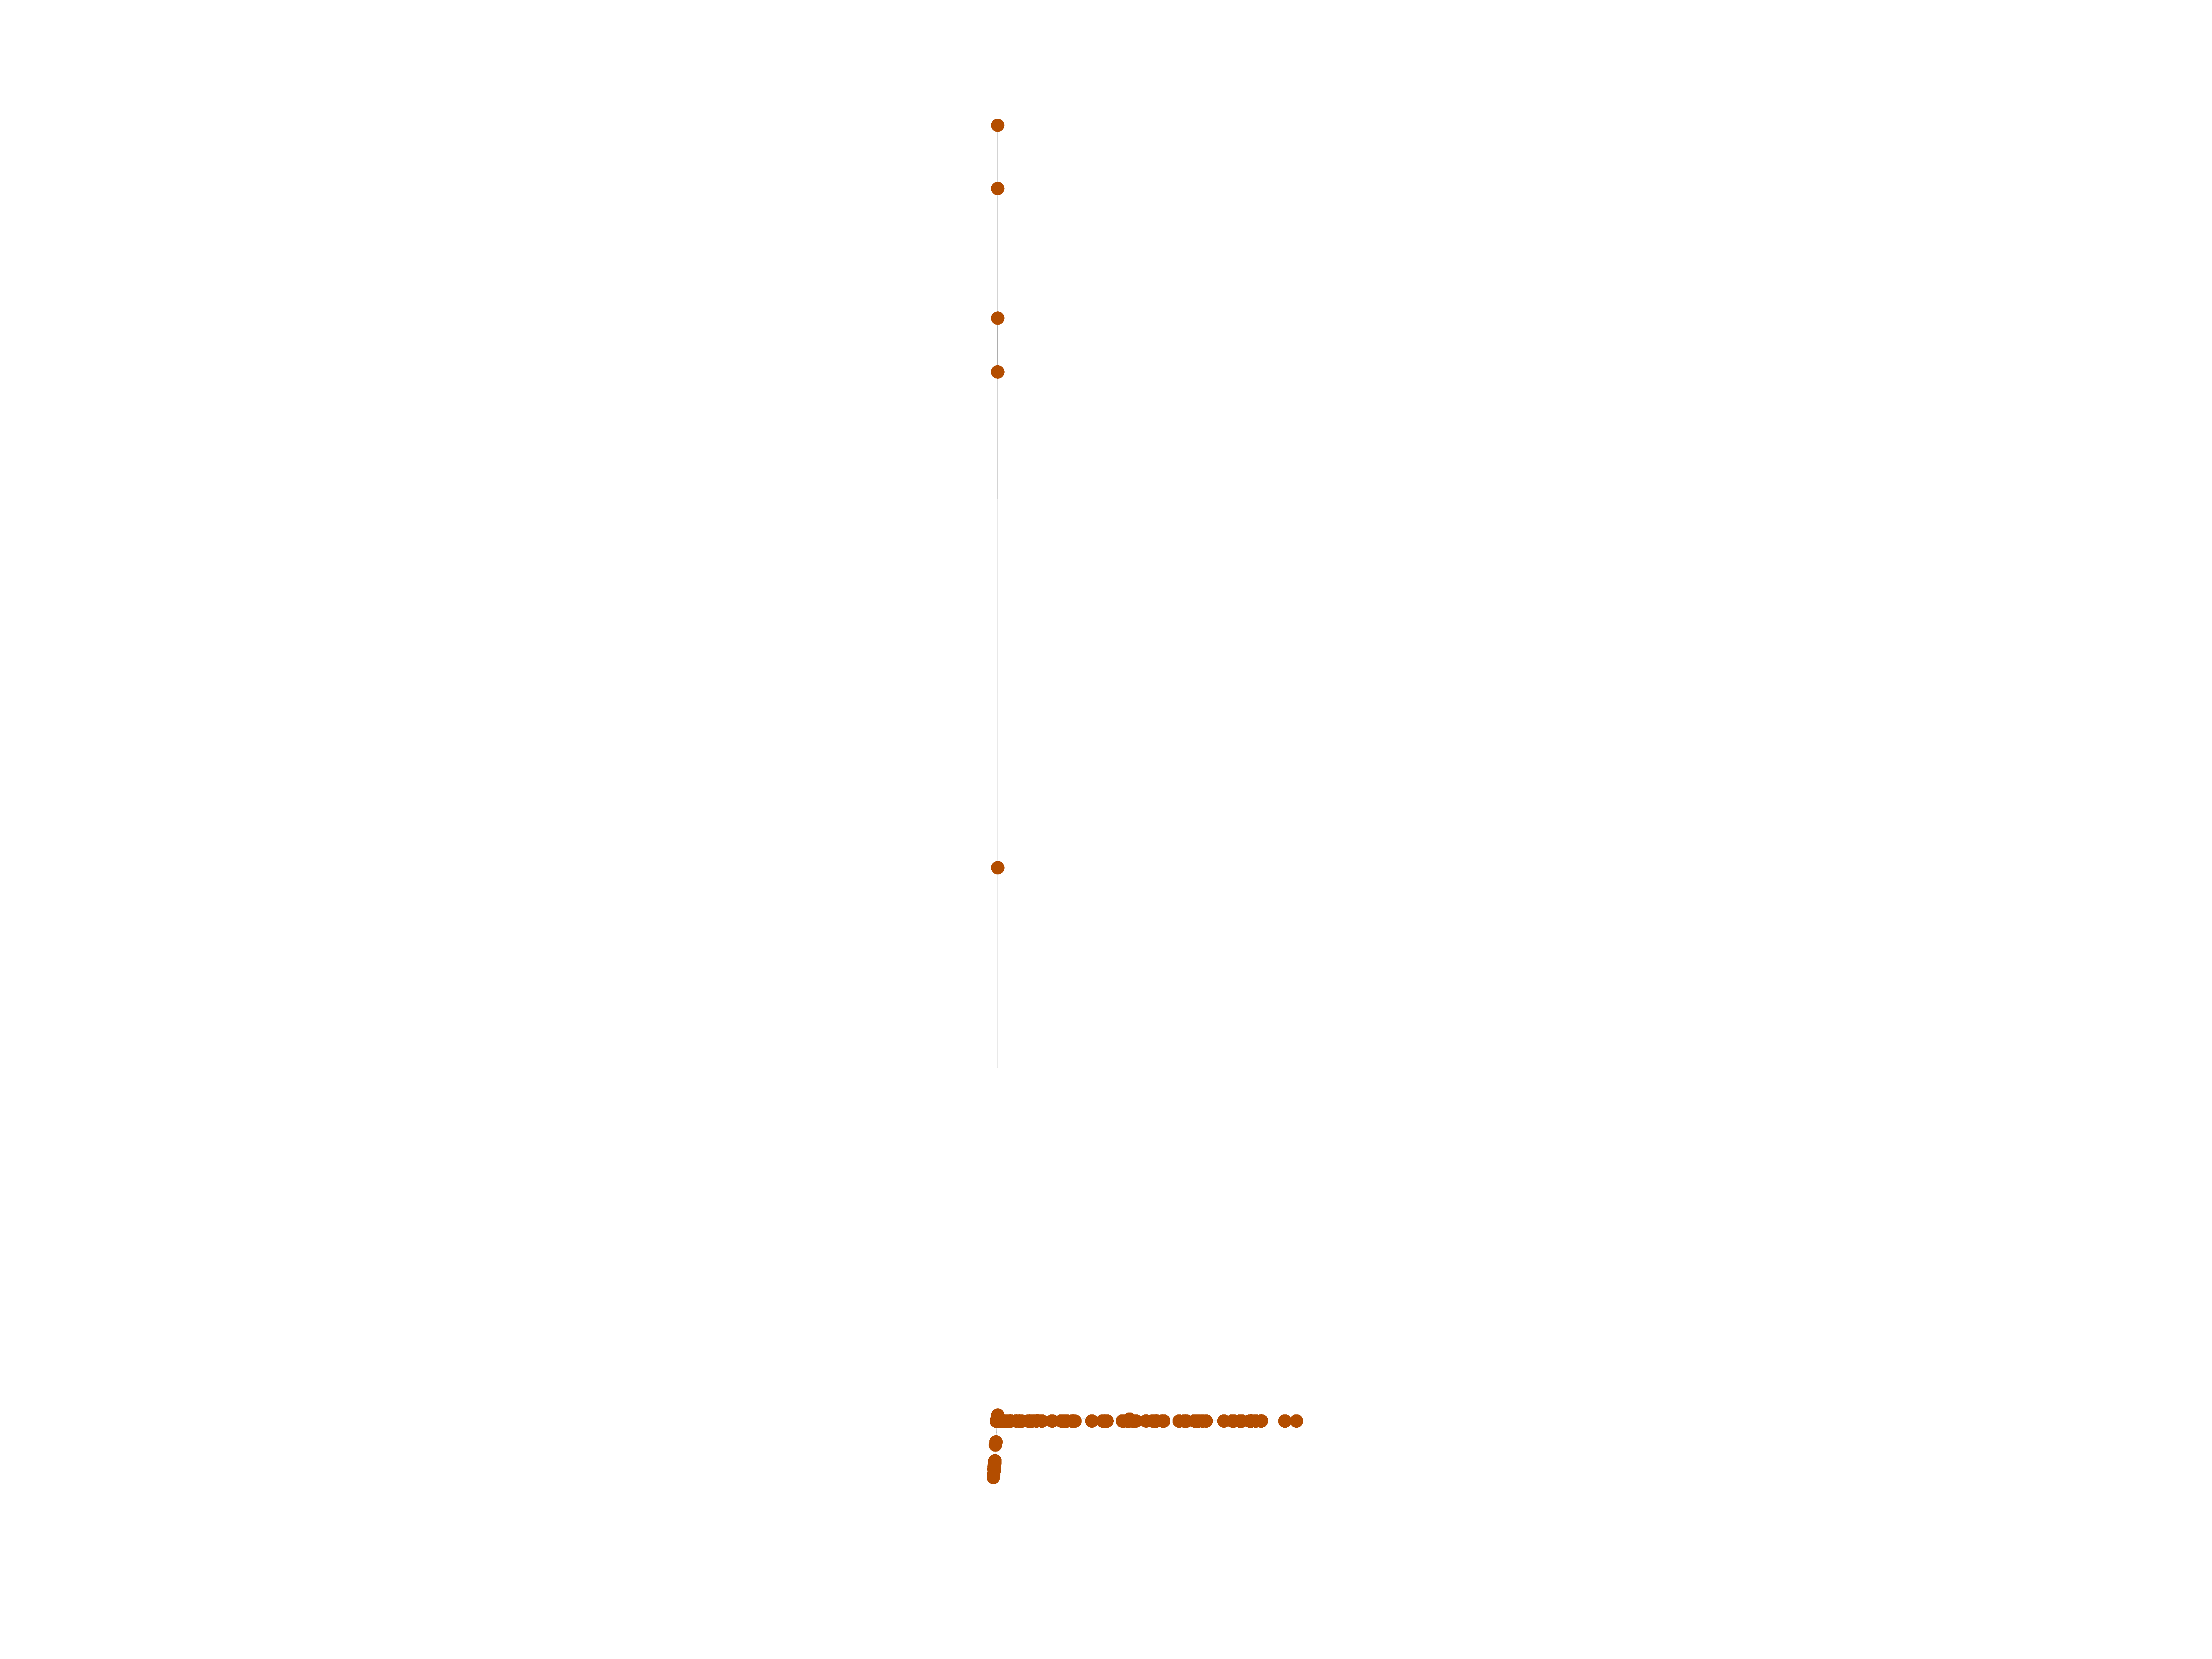
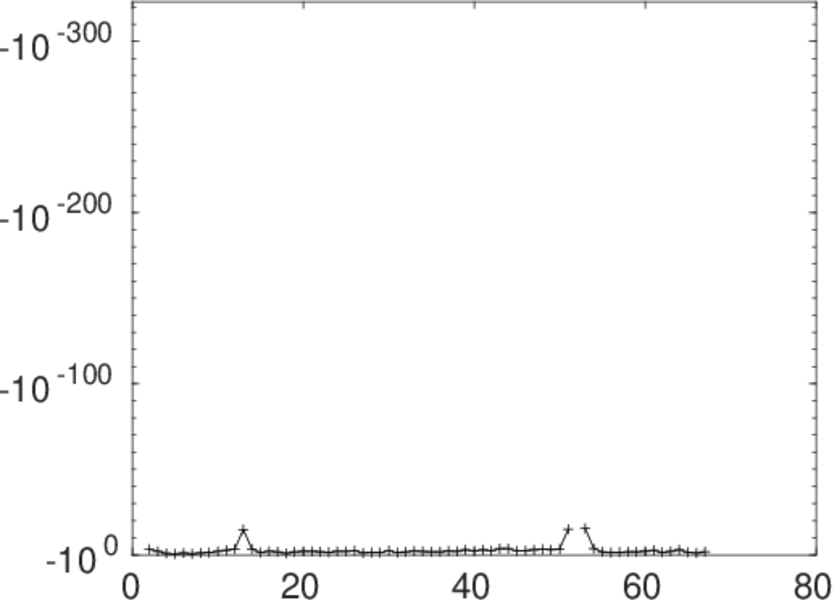
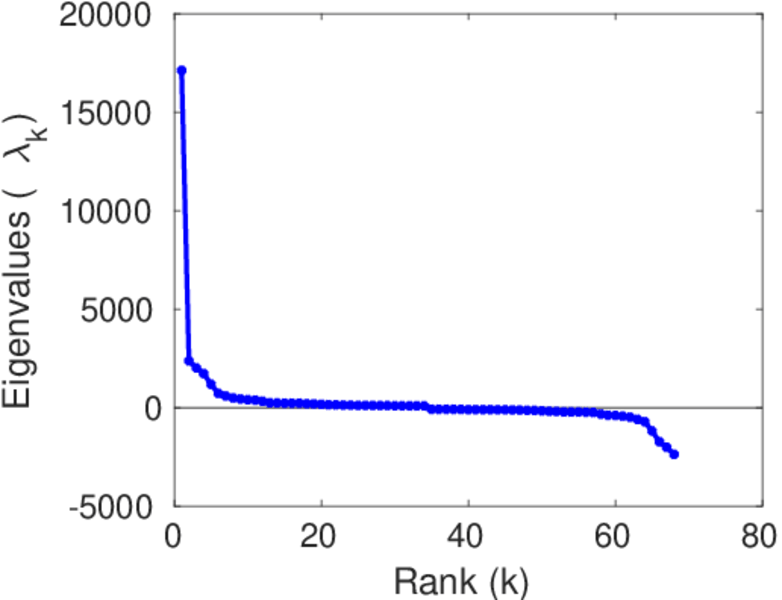
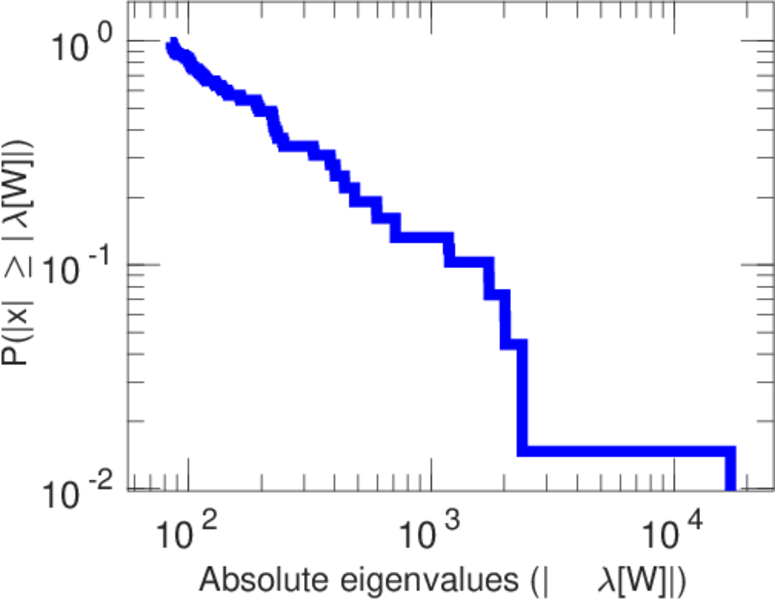
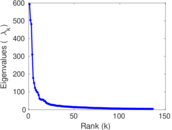
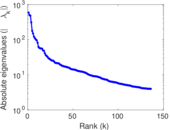
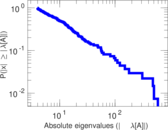
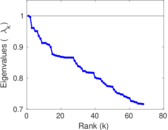
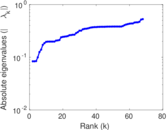
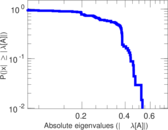
Matrix decompositions plots


Downloads
References
|
[1]
|
Jérôme Kunegis.
KONECT – The Koblenz Network Collection.
In Proc. Int. Conf. on World Wide Web Companion, pages
1343–1350, 2013.
[ http ]
|
|
[2]
|
Wikimedia Foundation.
Wikimedia downloads.
http://dumps.wikimedia.org/, January 2010.
|
 KONECT ‣ Networks ‣
Buy Me a Coffee
KONECT ‣ Networks ‣
Buy Me a Coffee