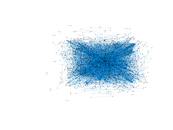
Wikipedia edits (ve)
This is the bipartite edit network of the Venda Wikipedia. It contains users
and pages from the Venda Wikipedia, connected by edit events. Each edge
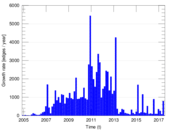
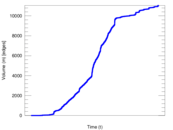
represents an edit. The dataset includes the timestamp of each edit.
Metadata
Statistics
| Size | n = | 2,134
|
| Left size | n1 = | 543
|
| Right size | n2 = | 1,591
|
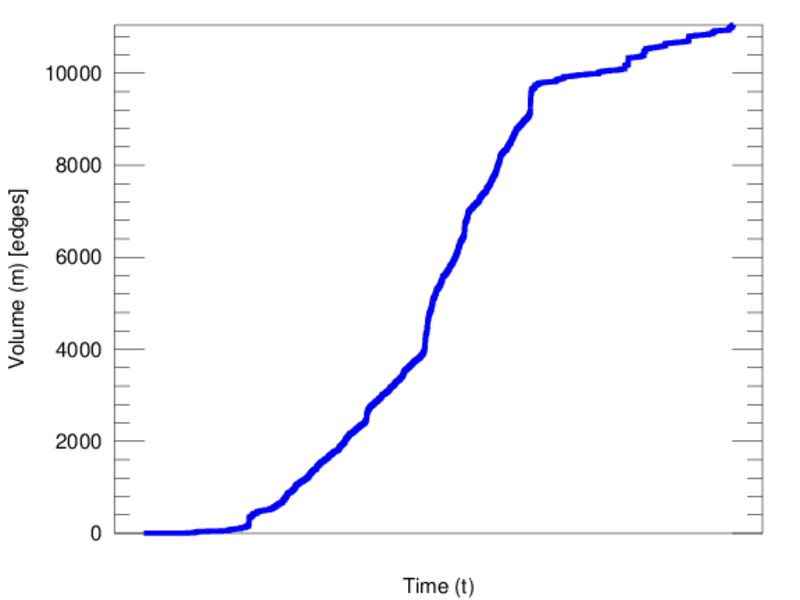
| Volume | m = | 11,047
|
| Unique edge count | m̿ = | 5,178
|
| Wedge count | s = | 237,318
|
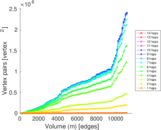
| Claw count | z = | 9,668,566
|
| Cross count | x = | 394,027,698
|
| Square count | q = | 460,826
|
| 4-Tour count | T4 = | 4,647,404
|
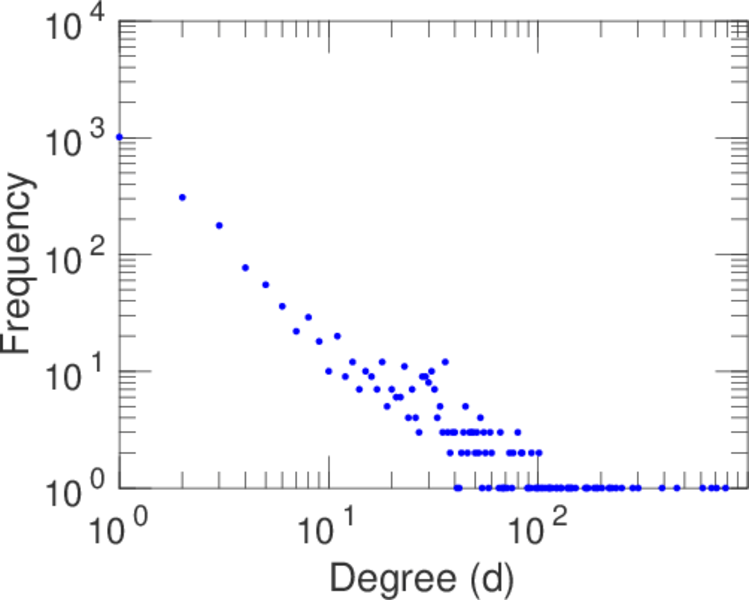
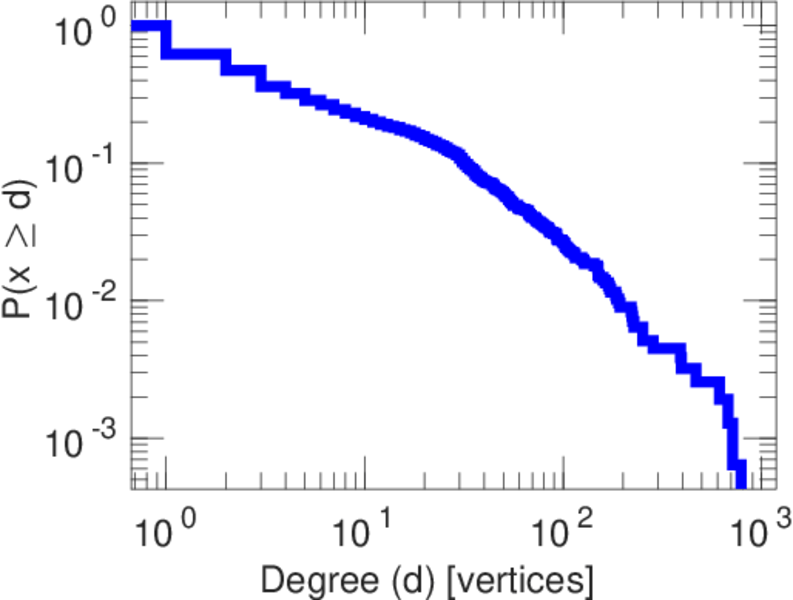
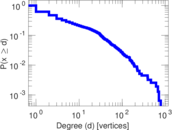
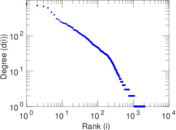
| Maximum degree | dmax = | 786
|
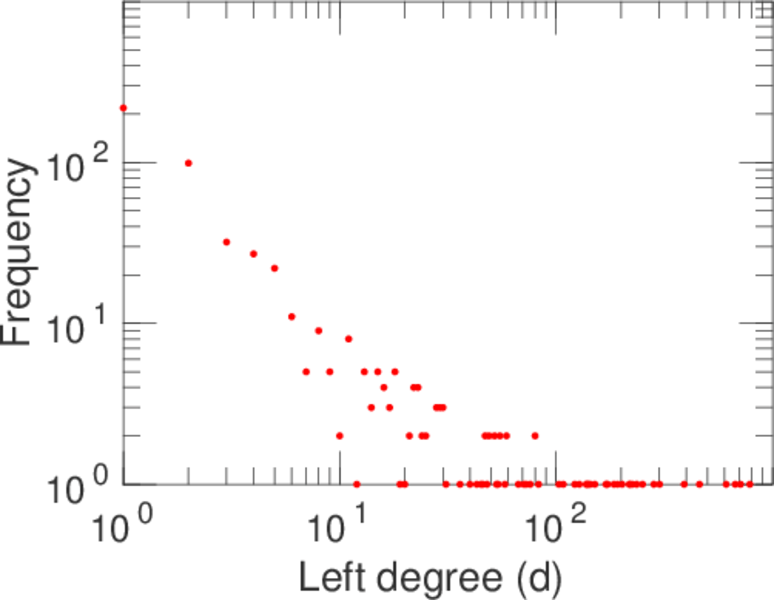
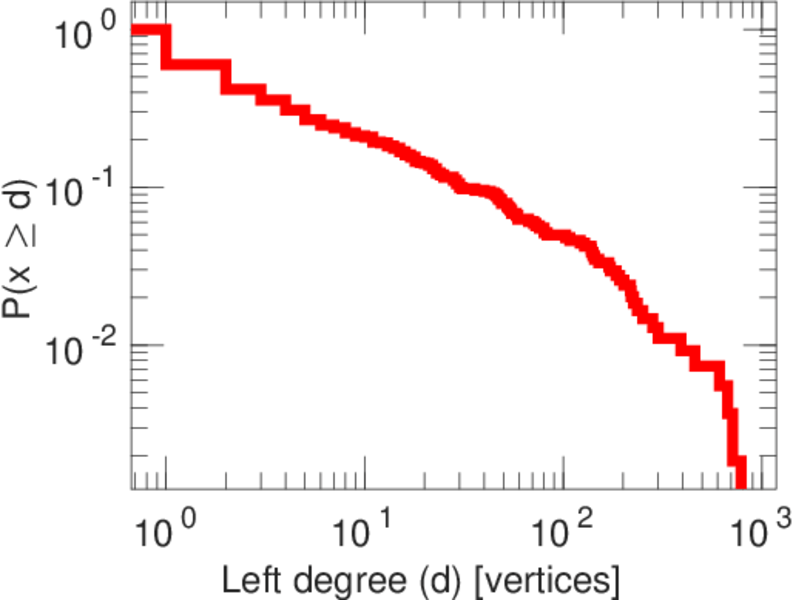
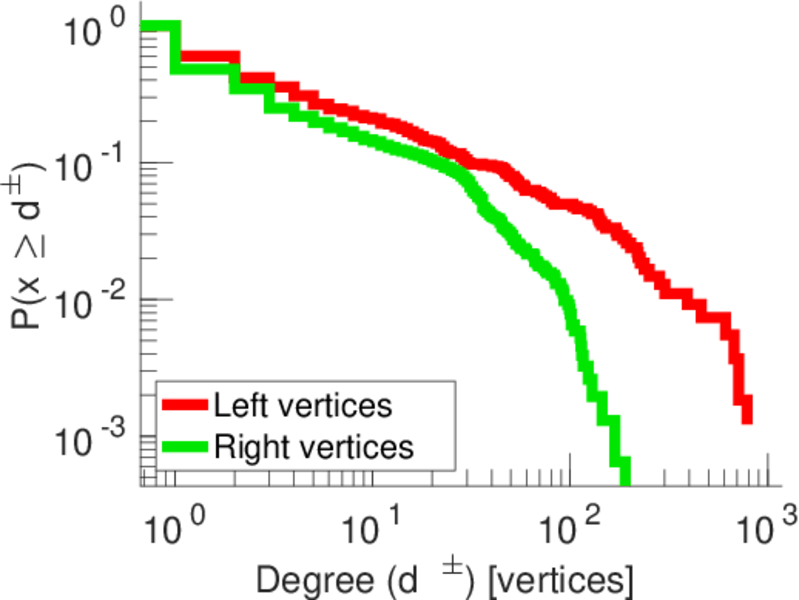
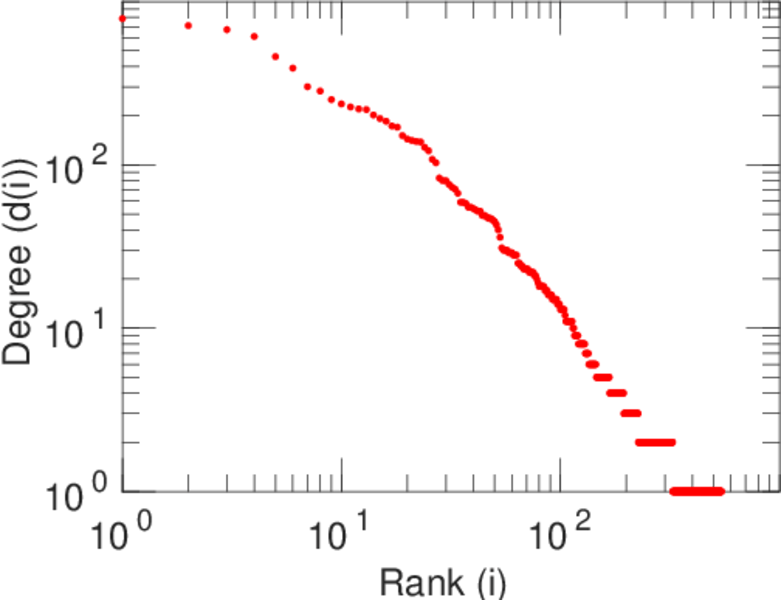
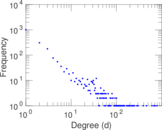
| Maximum left degree | d1max = | 786
|
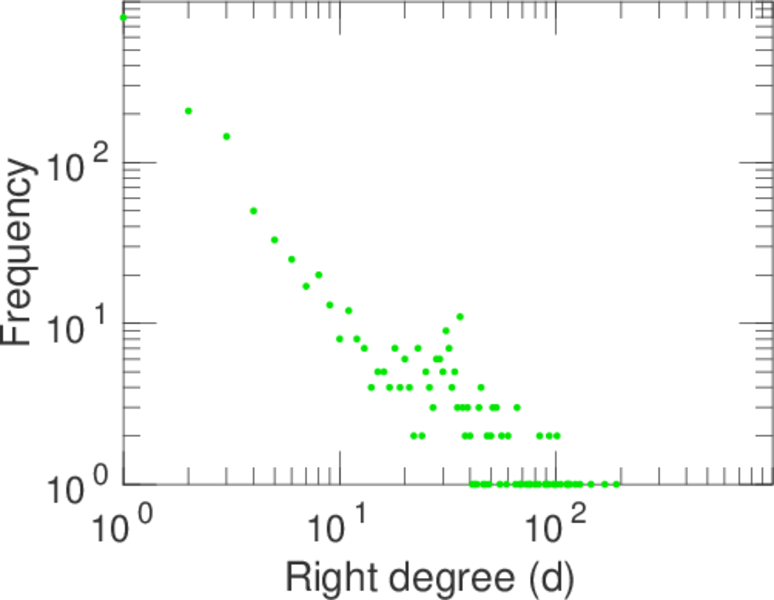
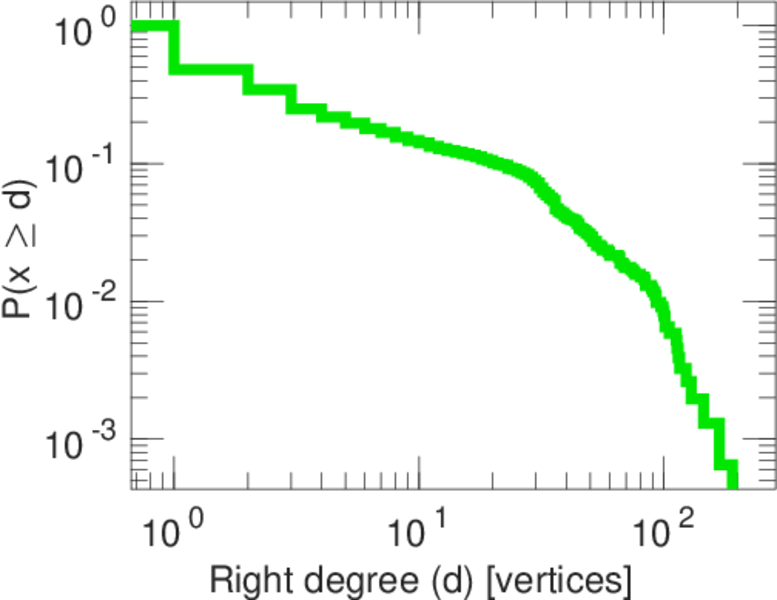
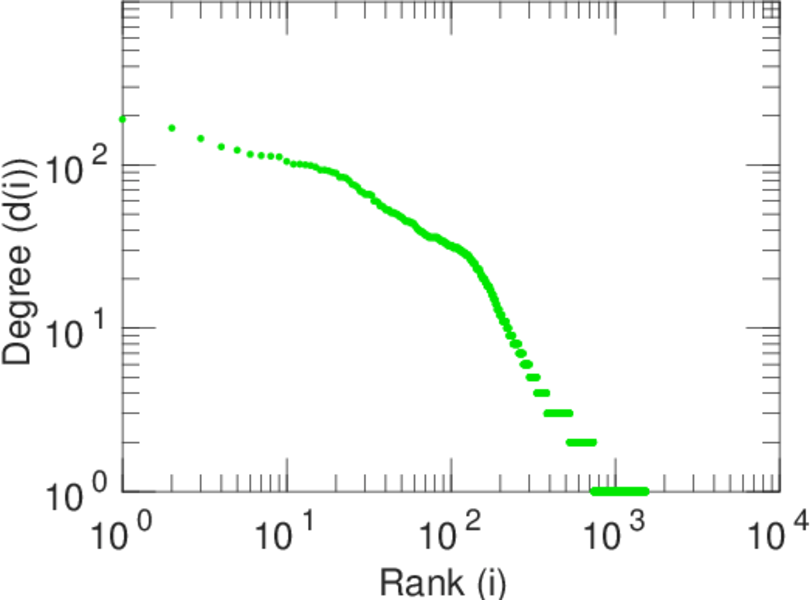
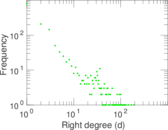
| Maximum right degree | d2max = | 190
|
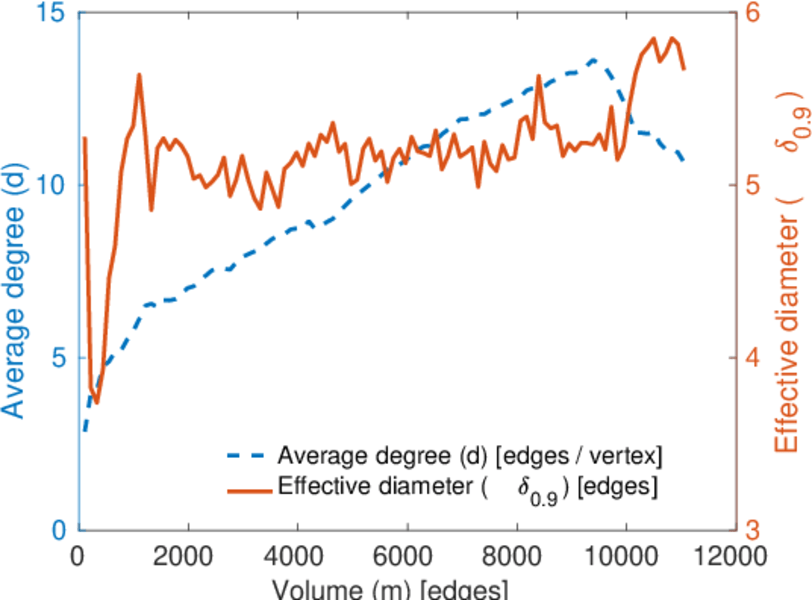
| Average degree | d = | 10.353 3
|
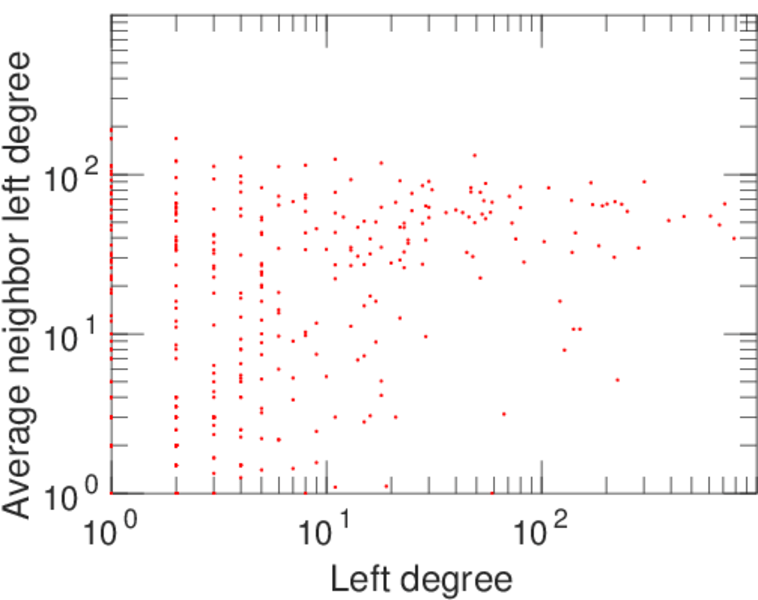
| Average left degree | d1 = | 20.344 4
|
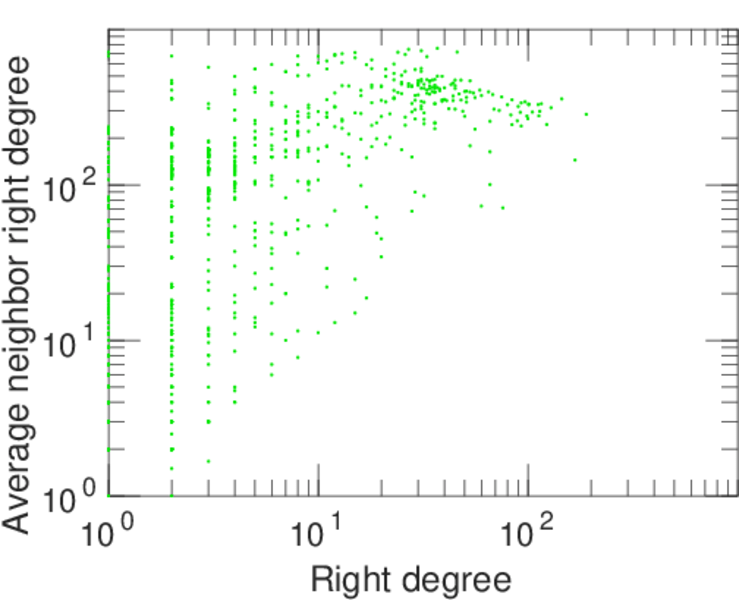
| Average right degree | d2 = | 6.943 43
|
| Fill | p = | 0.005 993 66
|
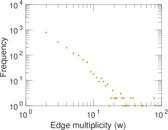
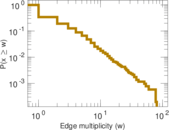
| Average edge multiplicity | m̃ = | 2.133 45
|
| Size of LCC | N = | 1,550
|
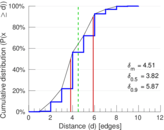
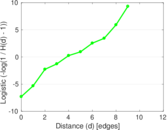
| Diameter | δ = | 12
|
| 50-Percentile effective diameter | δ0.5 = | 3.817 30
|
| 90-Percentile effective diameter | δ0.9 = | 5.871 80
|
| Median distance | δM = | 4
|
| Mean distance | δm = | 4.508 02
|
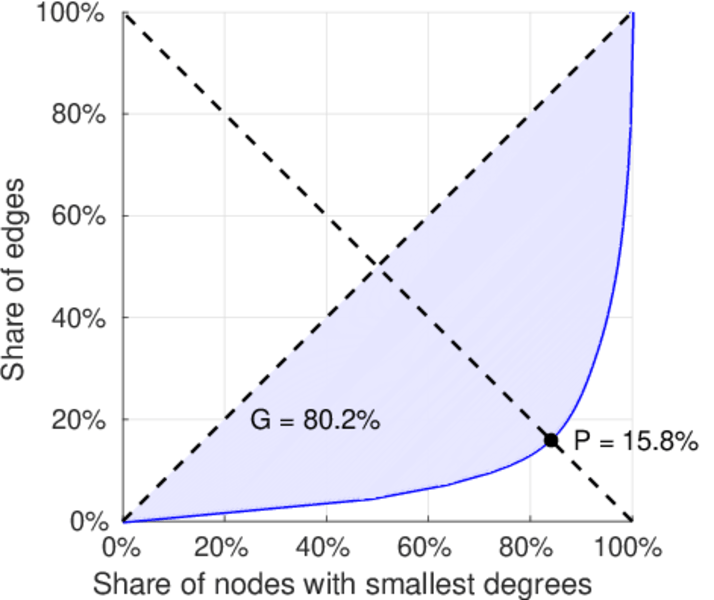
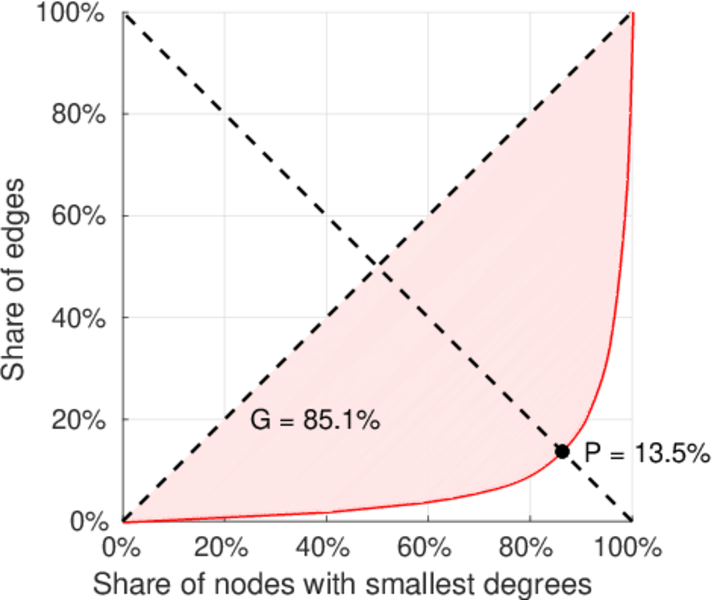
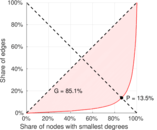
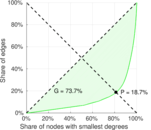
| Gini coefficient | G = | 0.795 306
|
| Balanced inequality ratio | P = | 0.166 652
|
| Left balanced inequality ratio | P1 = | 0.135 240
|
| Right balanced inequality ratio | P2 = | 0.186 566
|
| Relative edge distribution entropy | Her = | 0.836 430
|
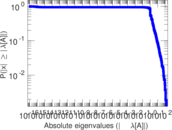
| Power law exponent | γ = | 2.508 83
|
| Tail power law exponent | γt = | 2.491 00
|
| Tail power law exponent with p | γ3 = | 2.491 00
|
| p-value | p = | 0.667 000
|
| Left tail power law exponent with p | γ3,1 = | 1.711 00
|
| Left p-value | p1 = | 0.132 000
|
| Right tail power law exponent with p | γ3,2 = | 2.011 00
|
| Right p-value | p2 = | 0.000 00
|
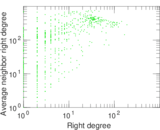
| Degree assortativity | ρ = | −0.028 725 2
|
| Degree assortativity p-value | pρ = | 0.038 739 5
|
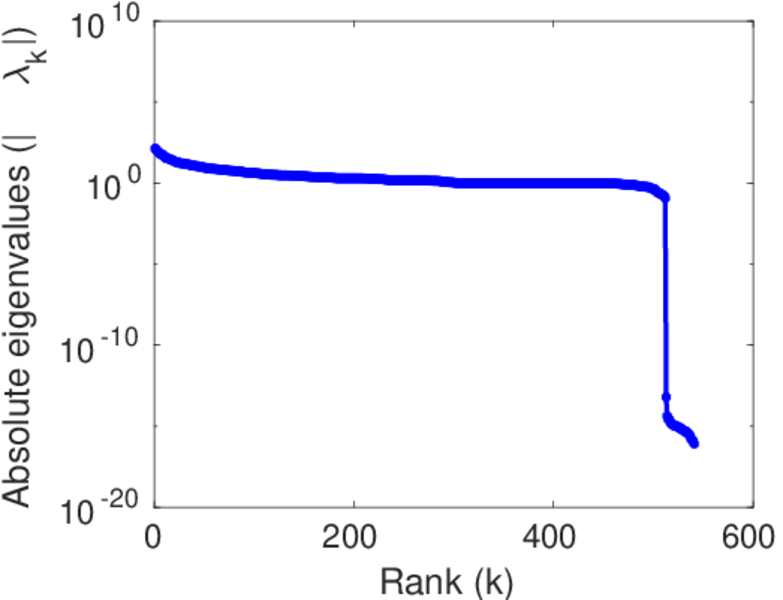
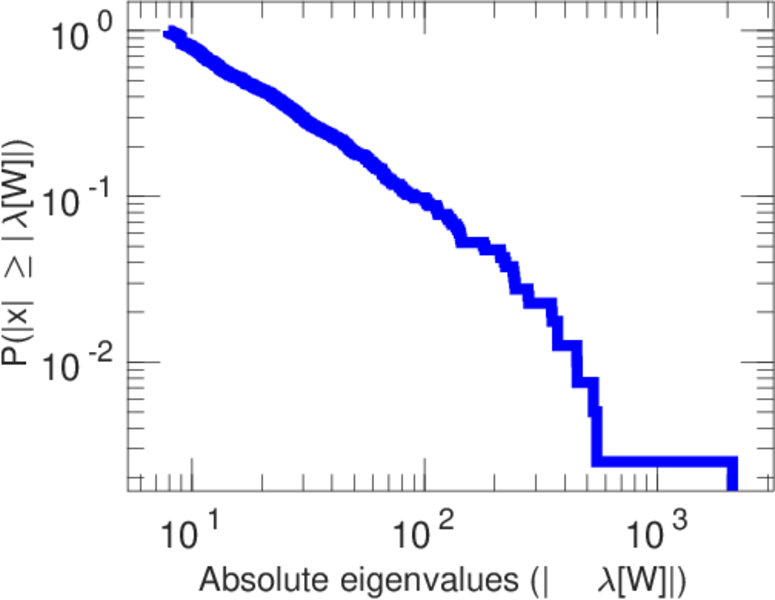
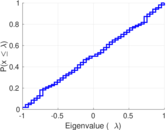
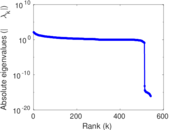
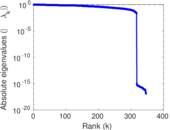
| Spectral norm | α = | 140.006
|
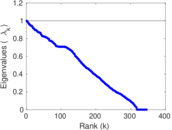
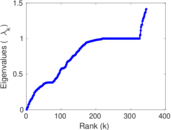
| Algebraic connectivity | a = | 0.019 380 0
|
| Spectral separation | |λ1[A] / λ2[A]| = | 1.241 75
|
| Controllability | C = | 1,053
|
| Relative controllability | Cr = | 0.507 470
|
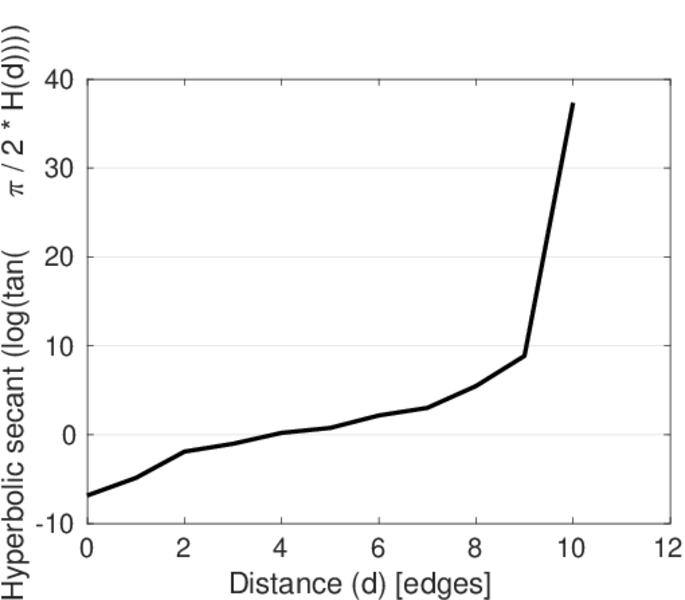
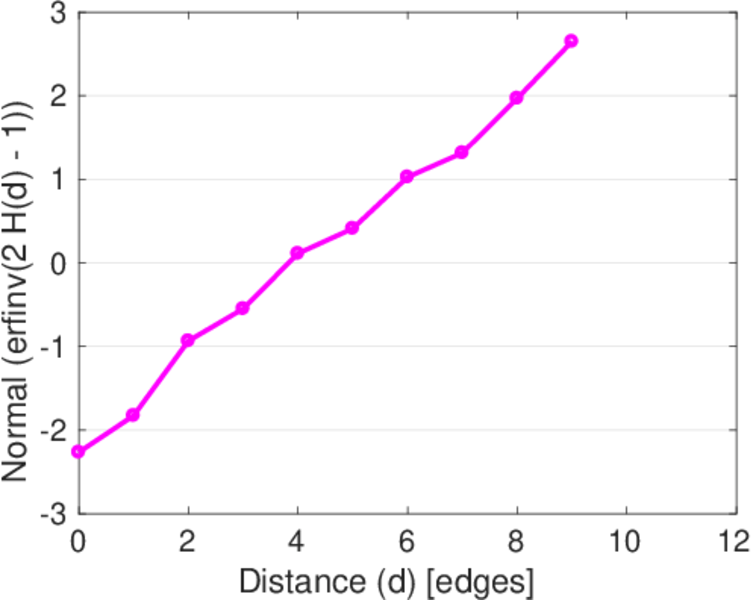
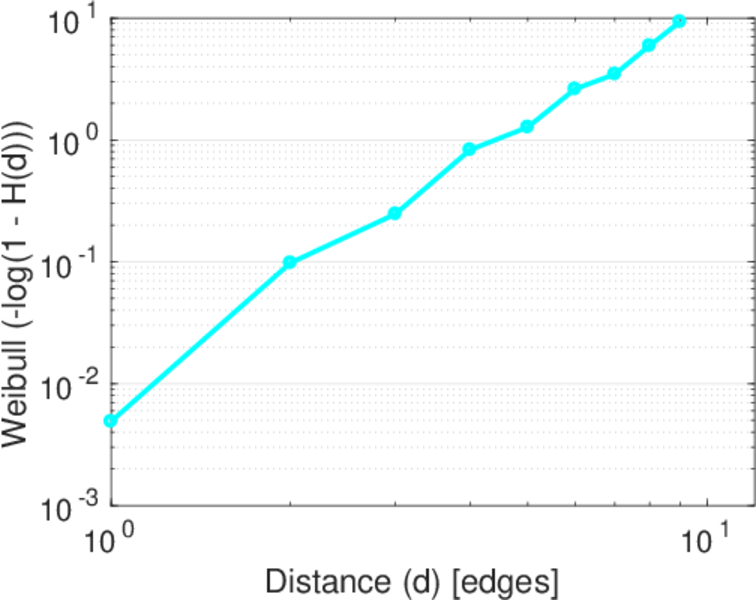
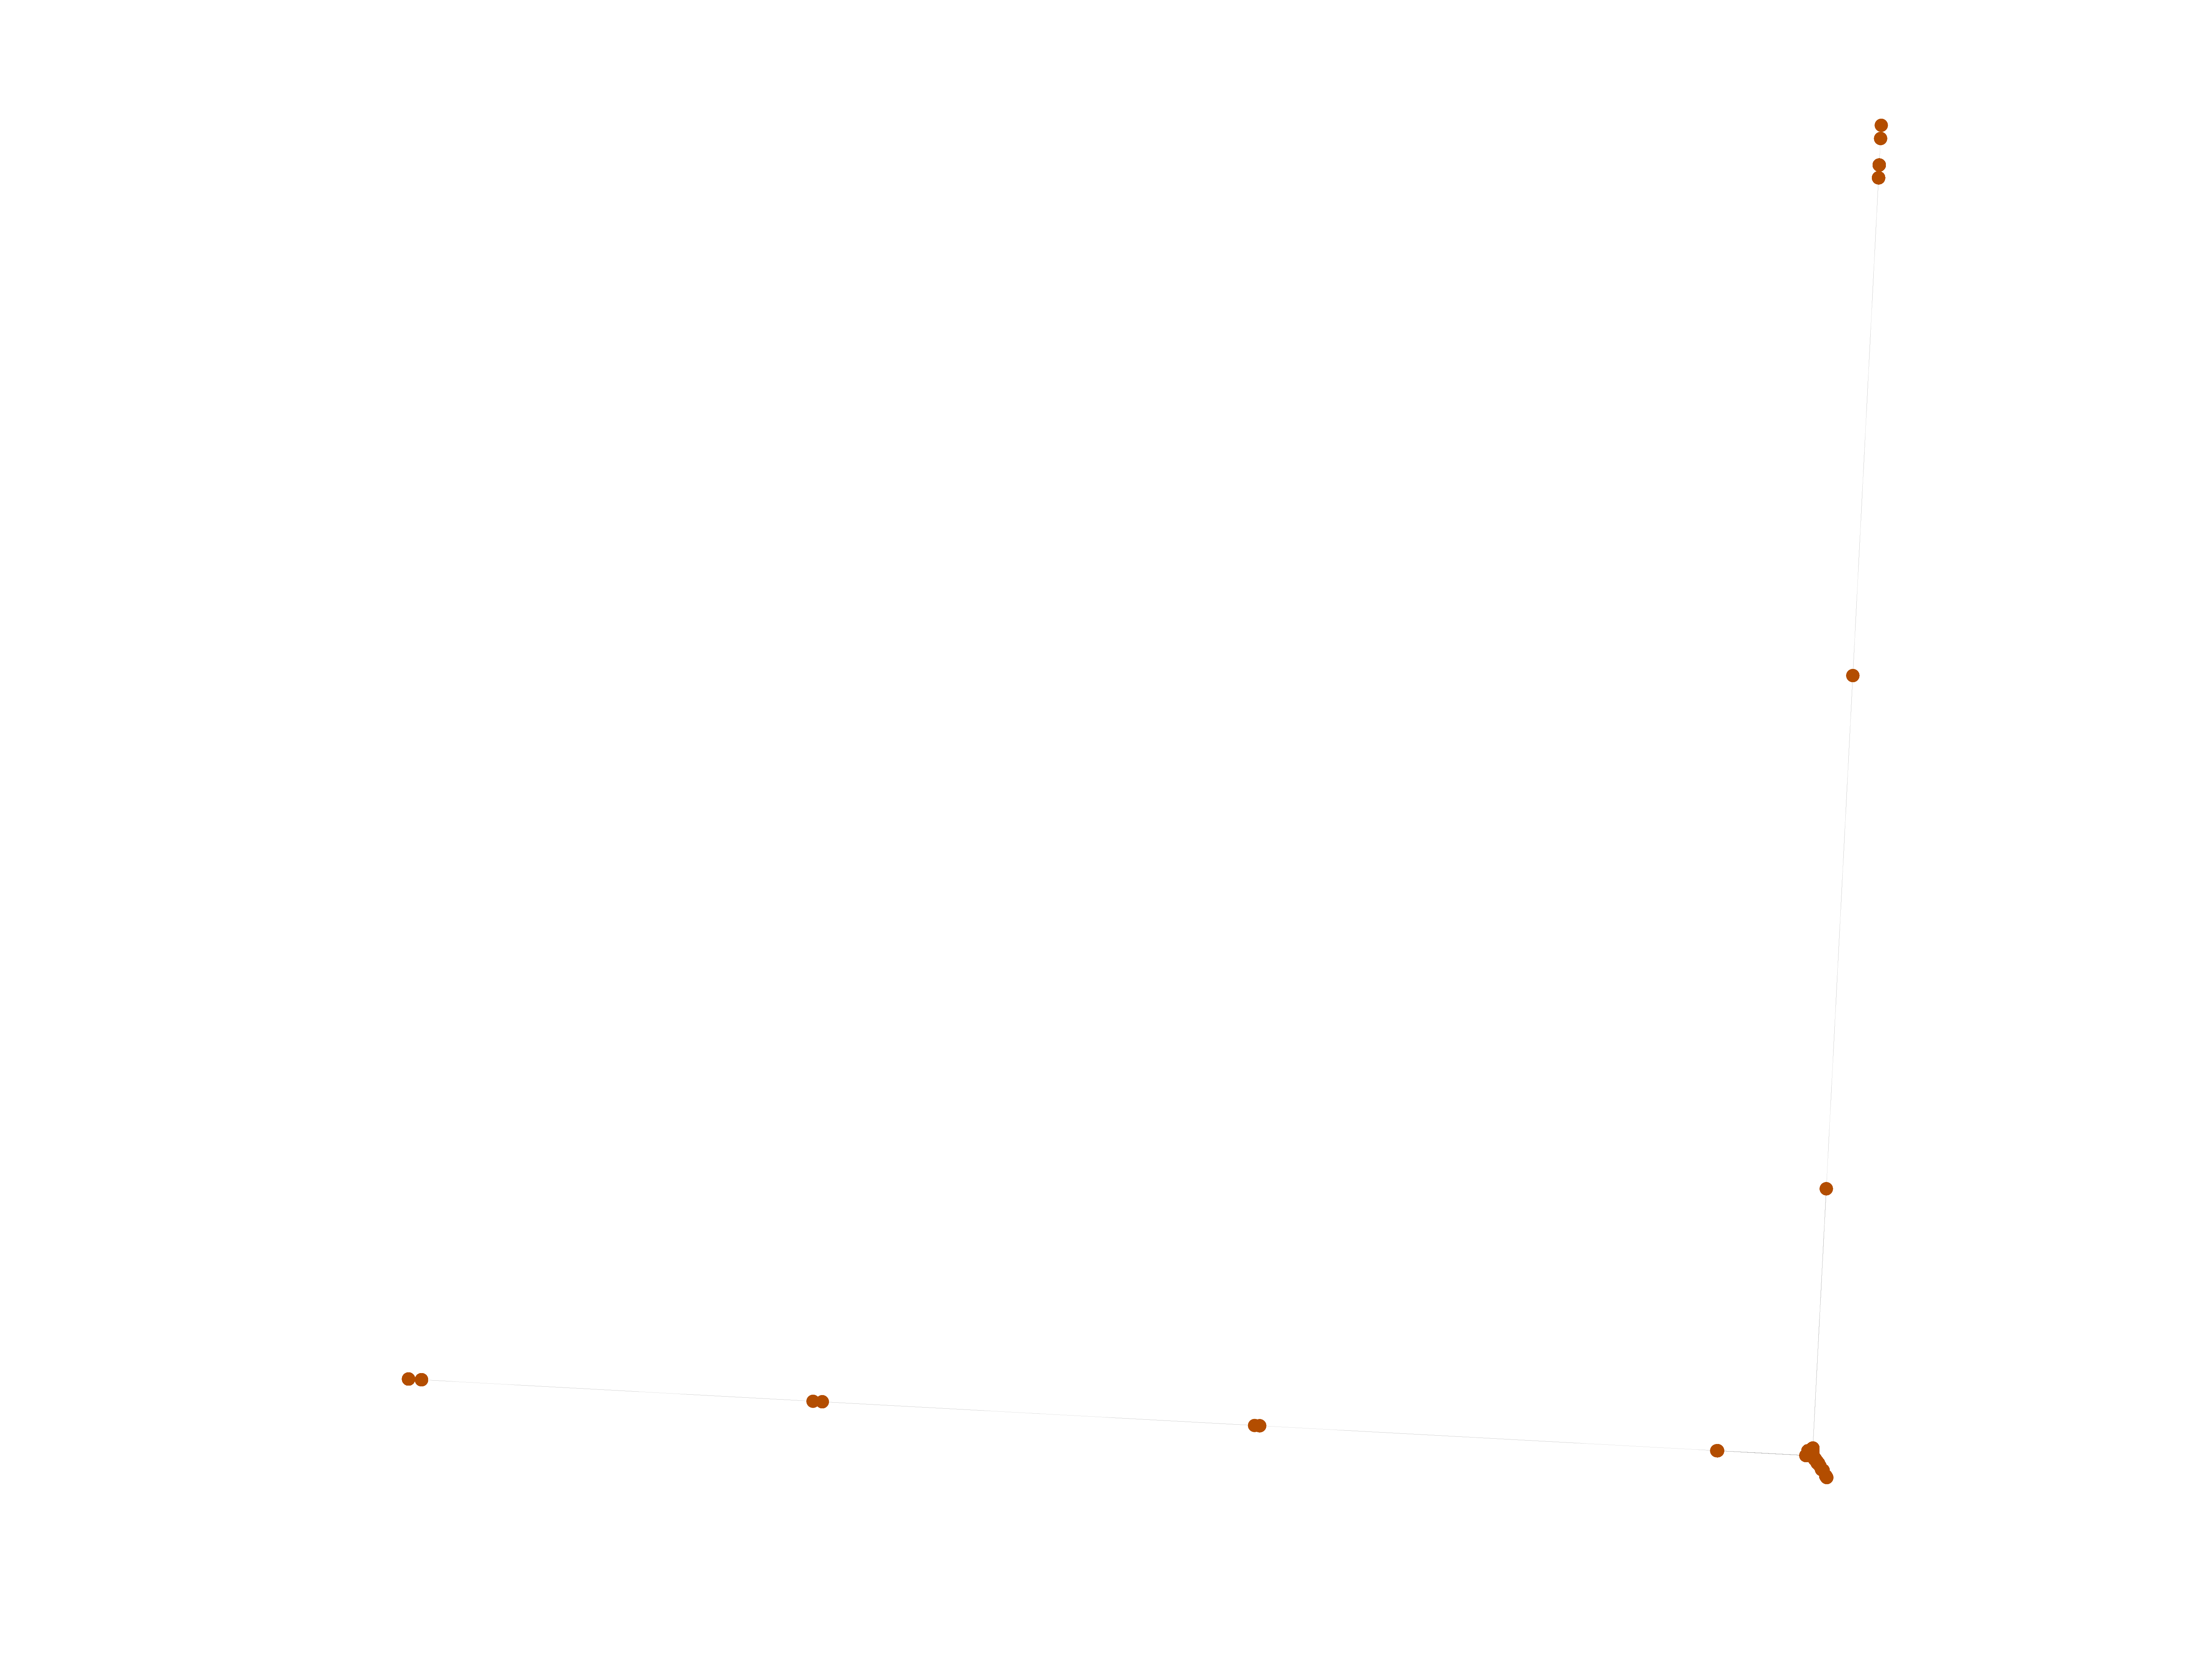
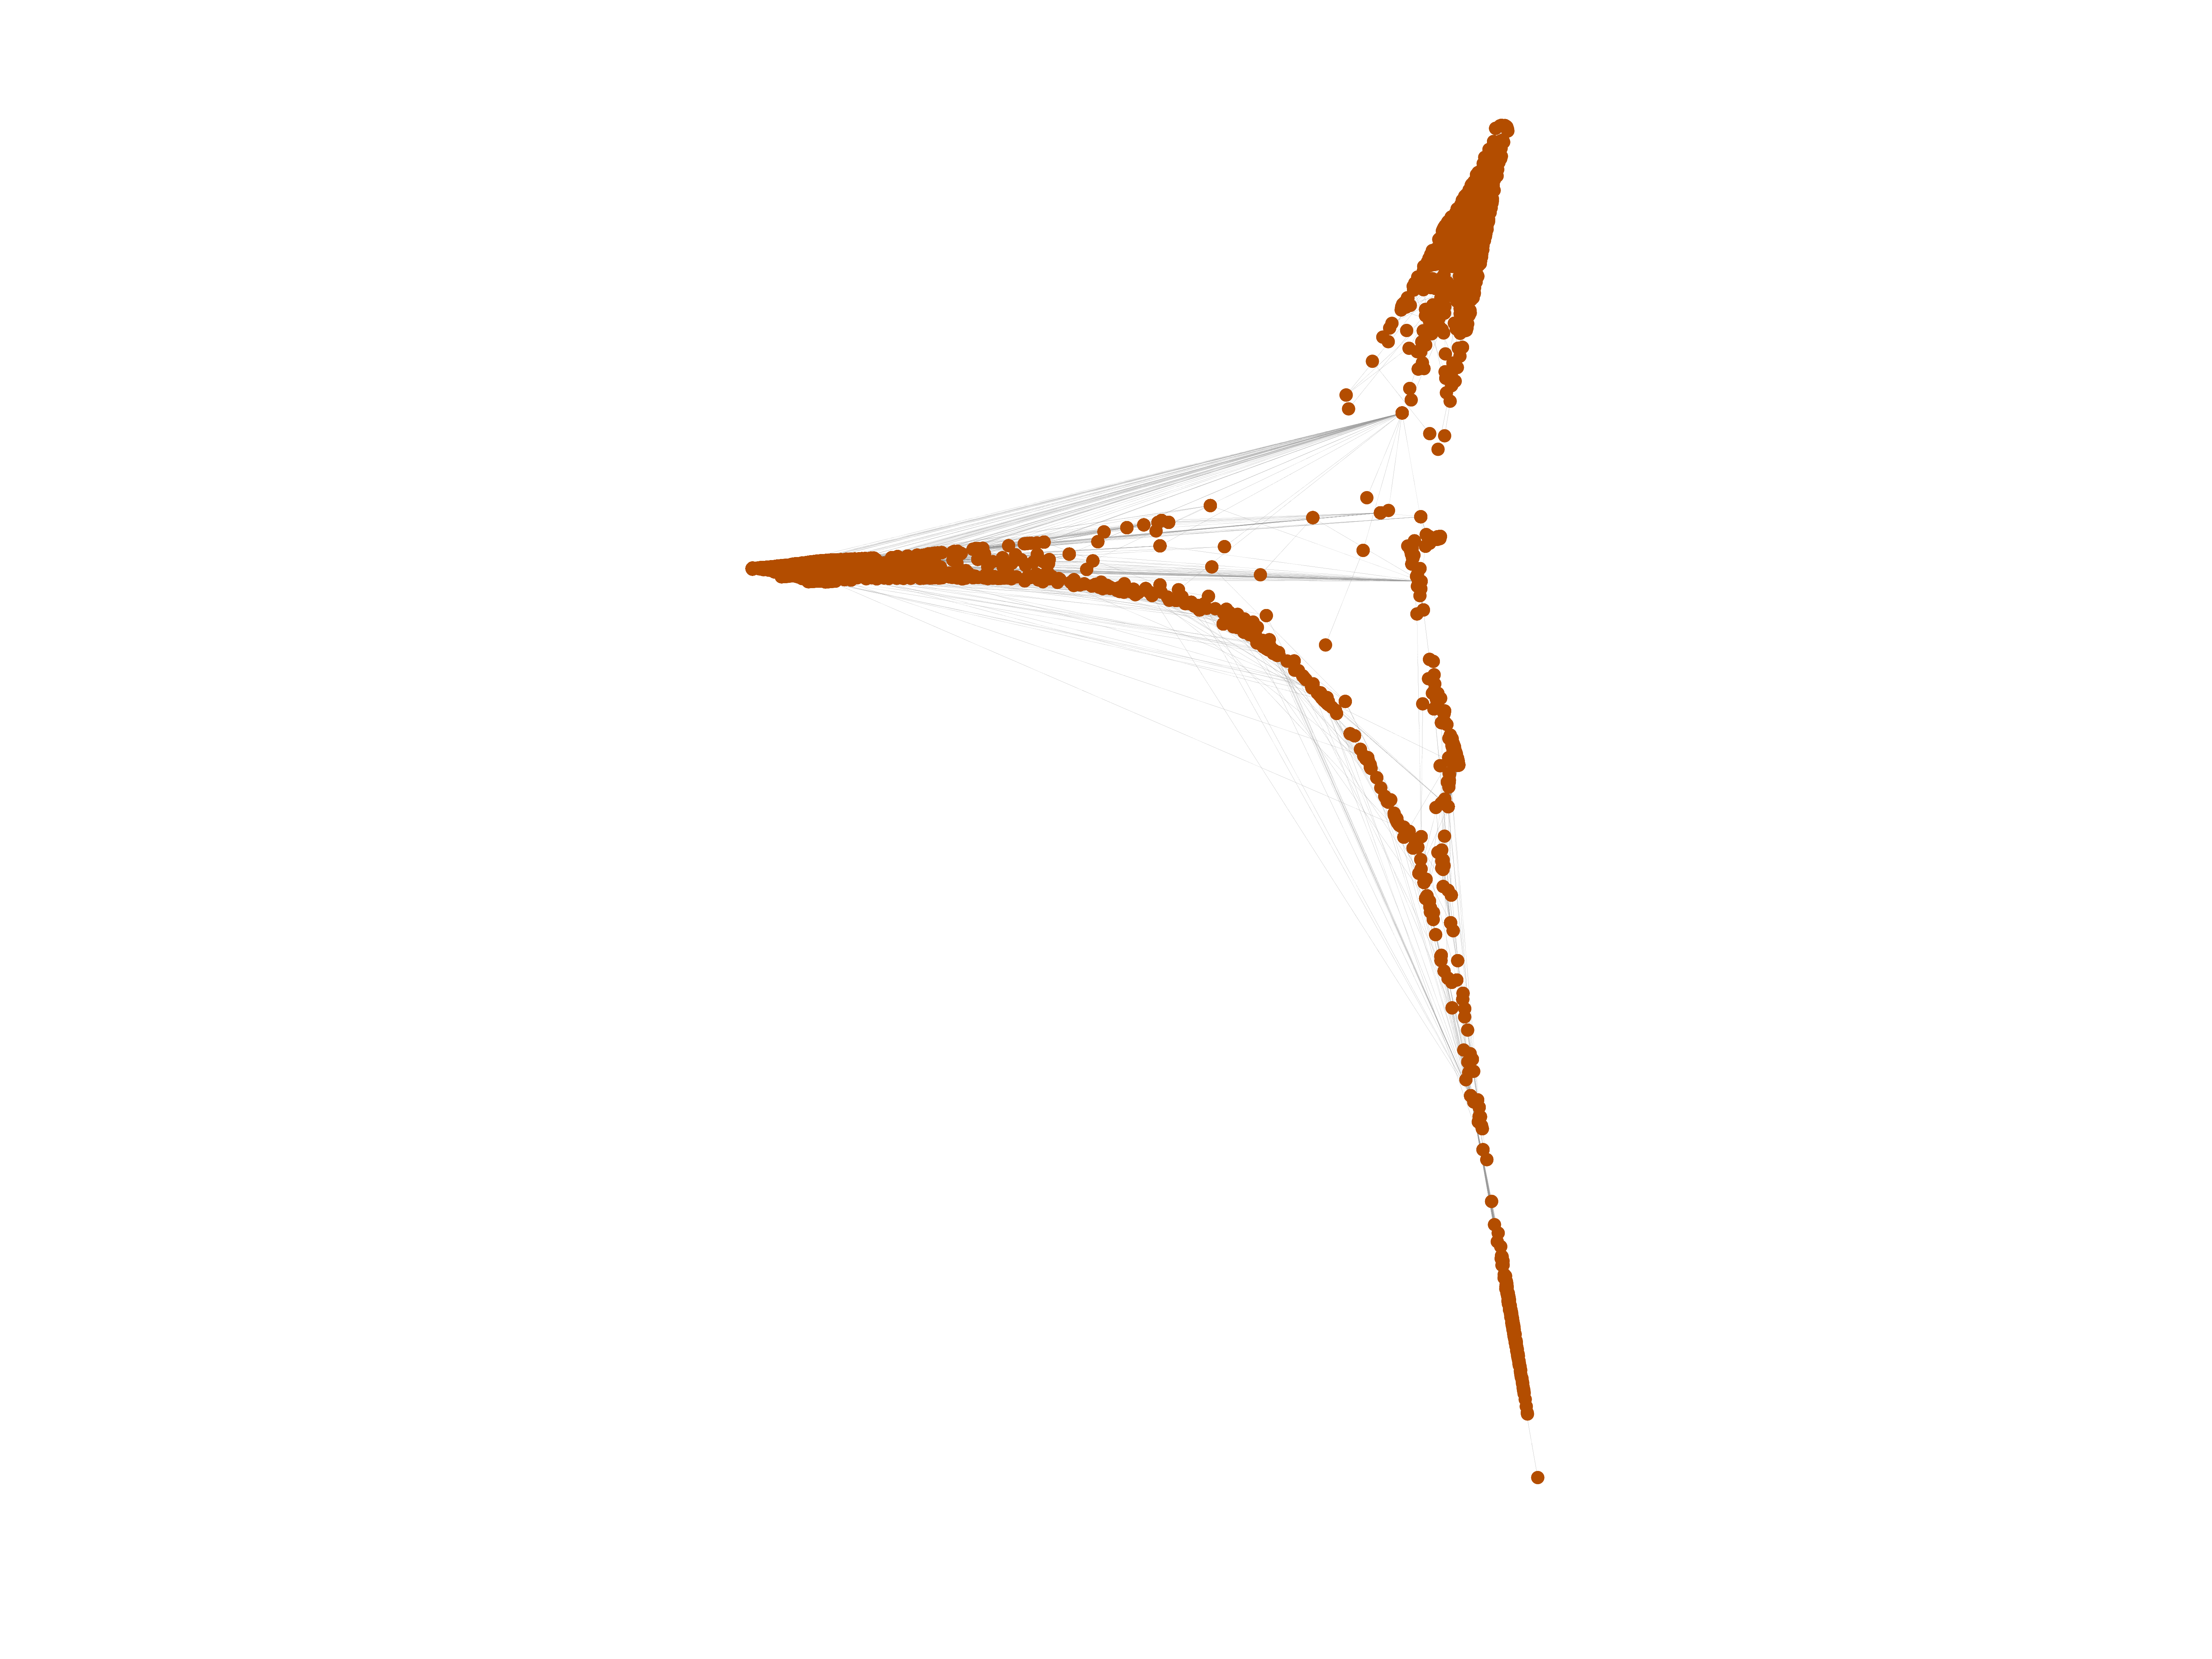
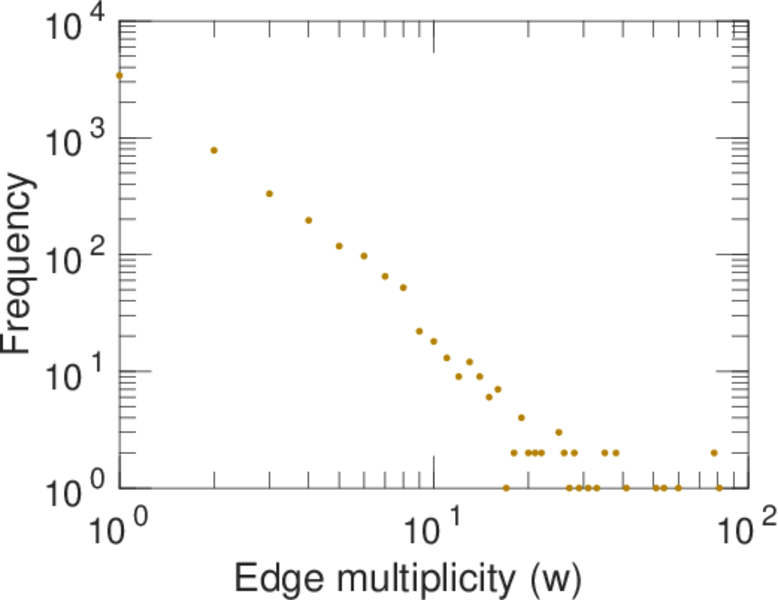
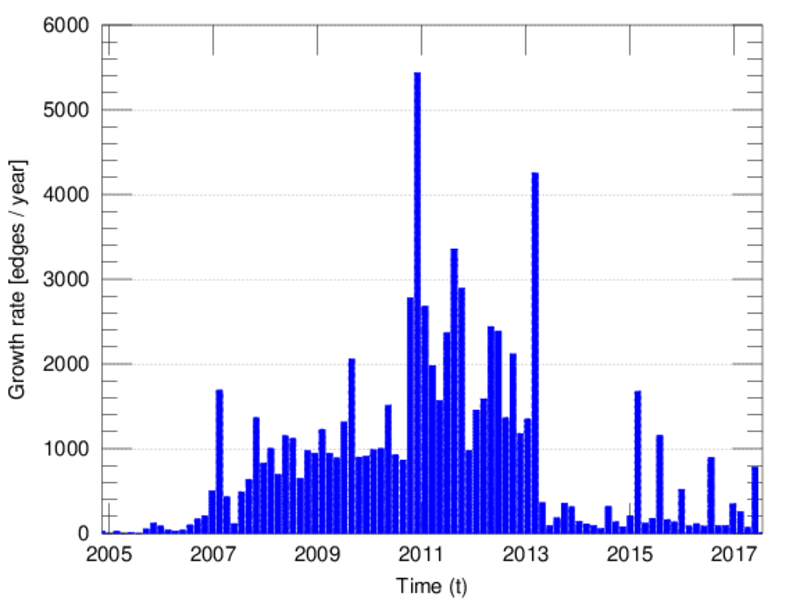
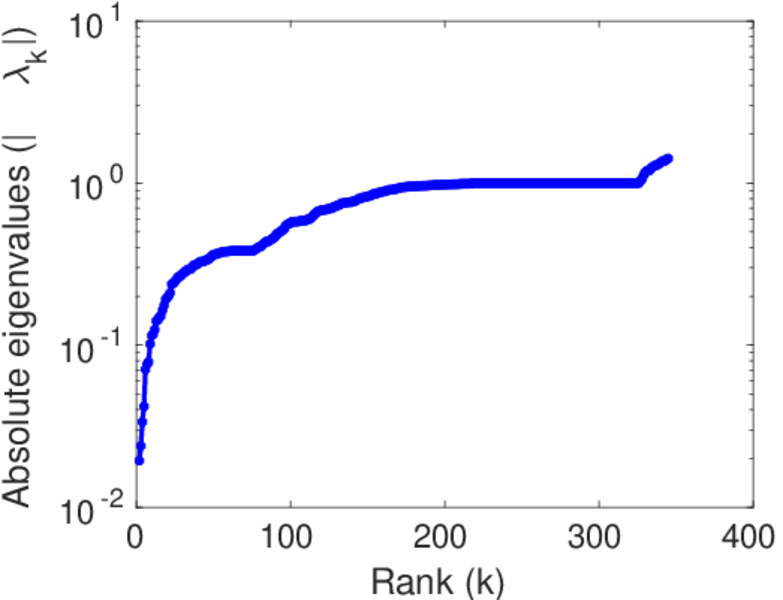
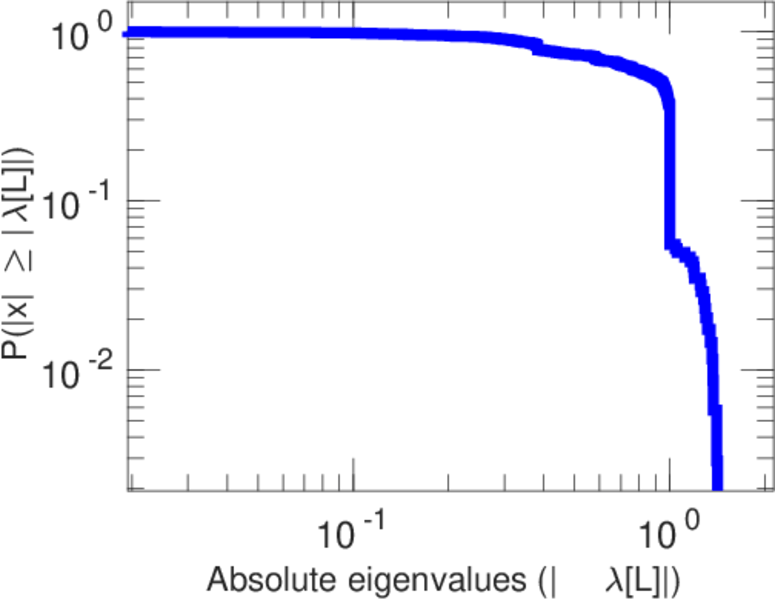
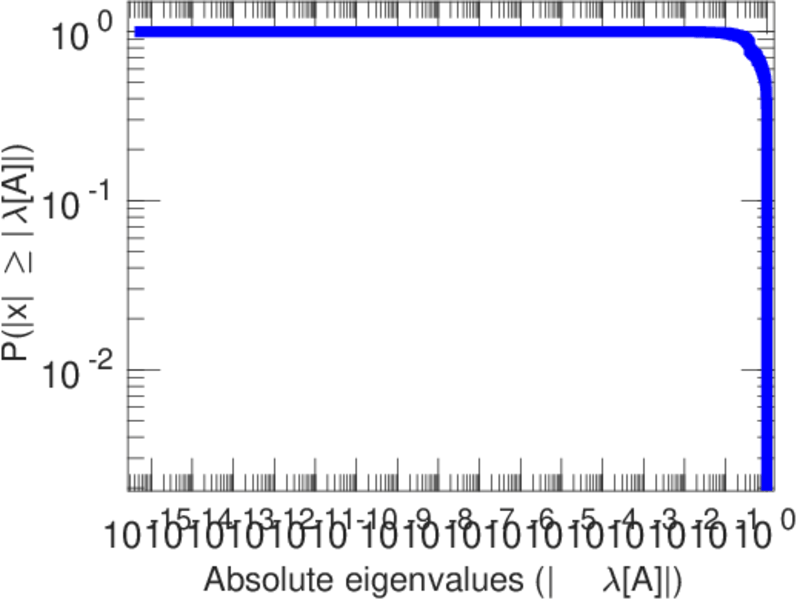
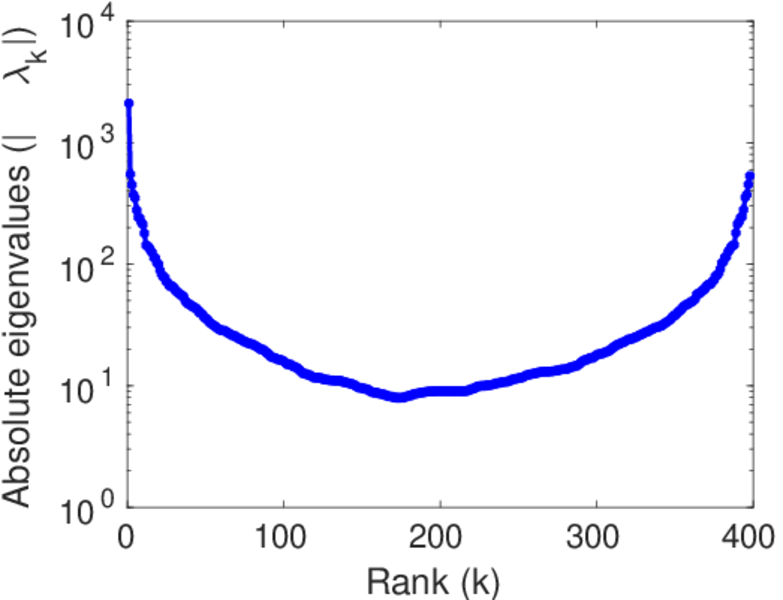
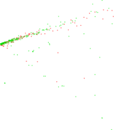
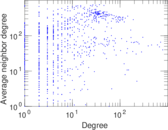
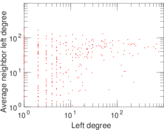
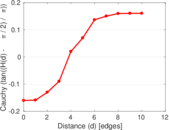
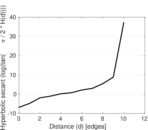
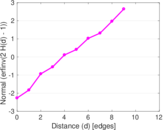
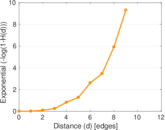
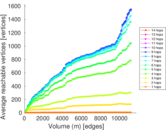
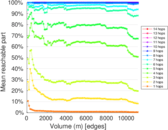
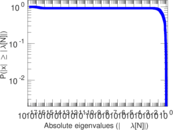
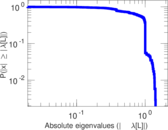
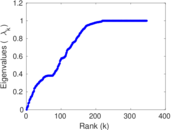
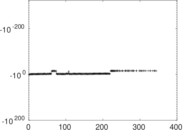
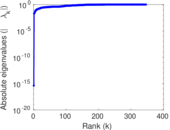
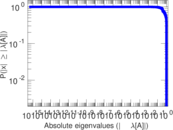
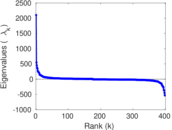
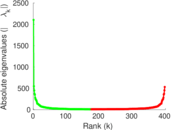
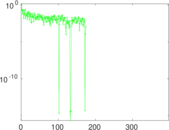
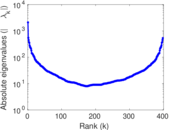
Plots


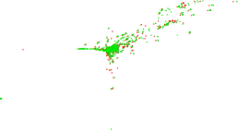


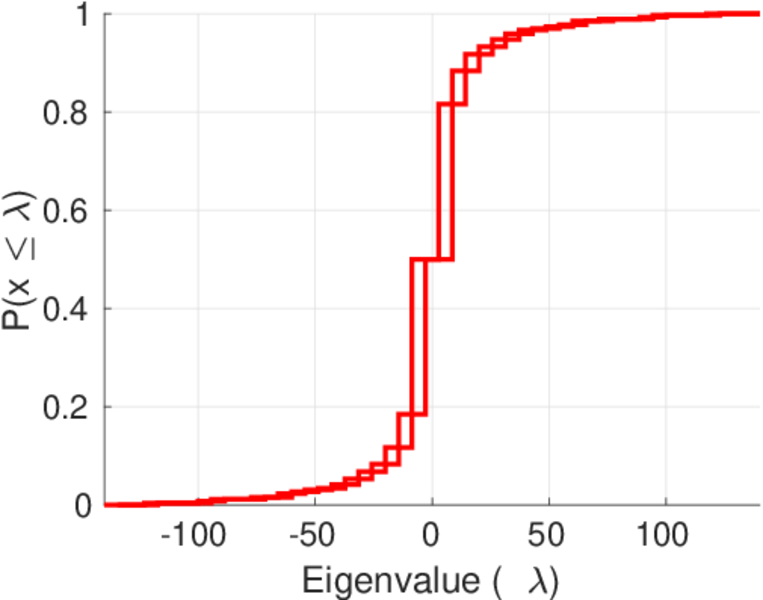
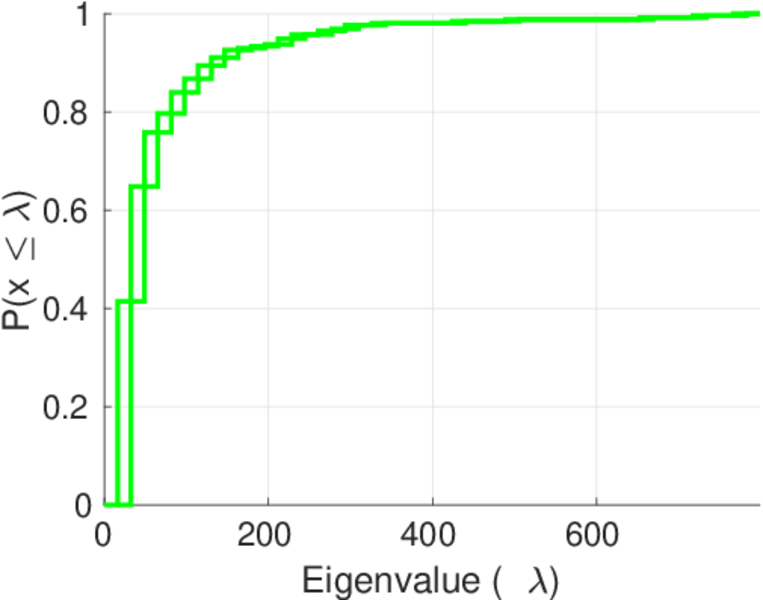
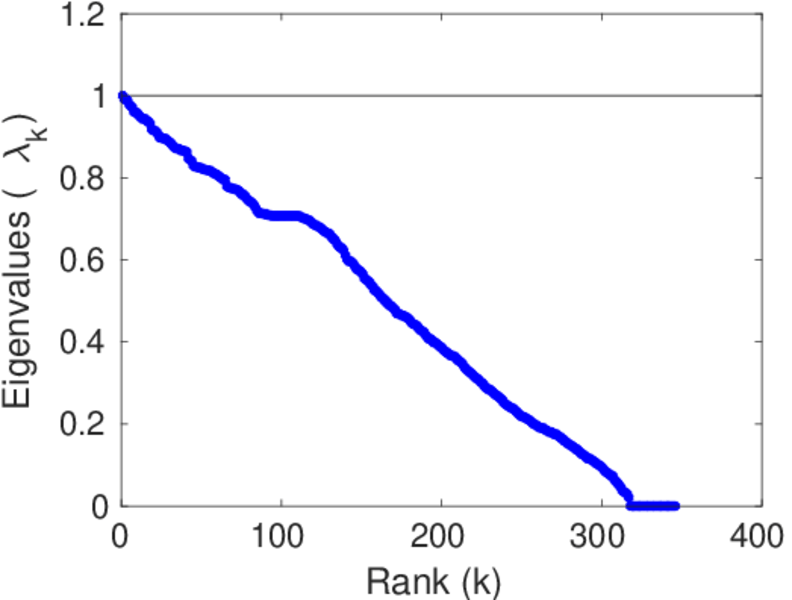
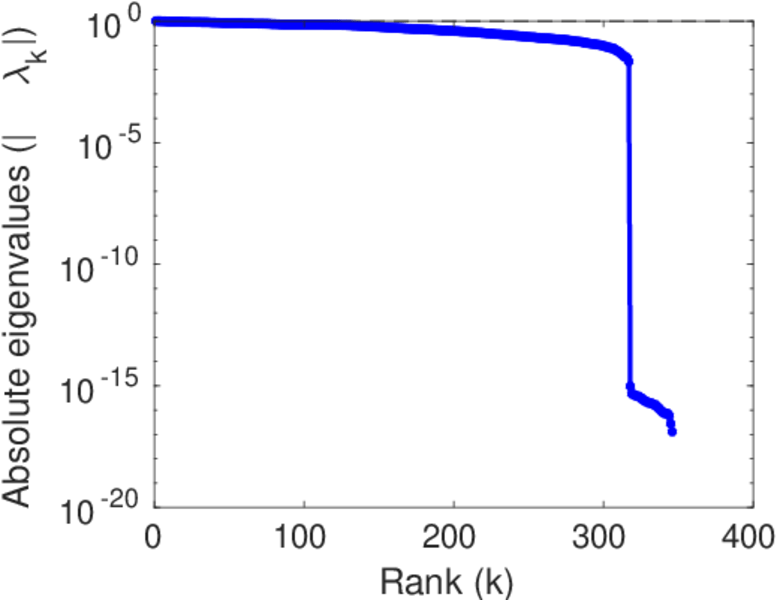
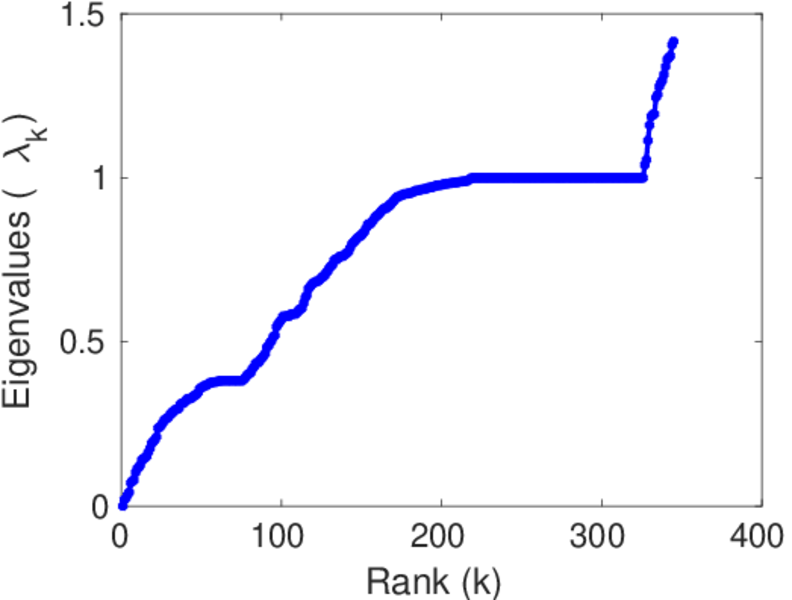
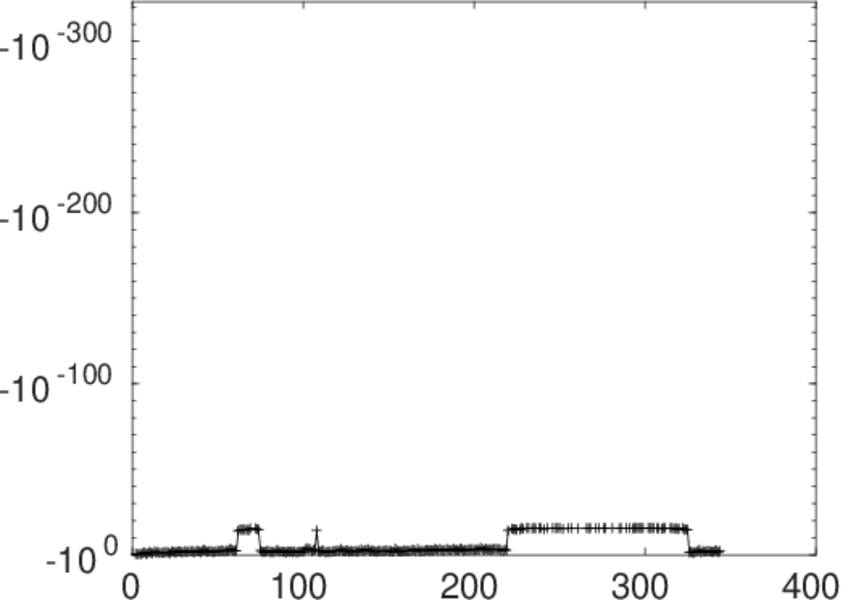
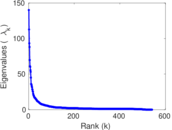
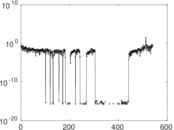
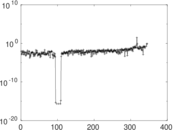
Matrix decompositions plots


Downloads
References
|
[1]
|
Jérôme Kunegis.
KONECT – The Koblenz Network Collection.
In Proc. Int. Conf. on World Wide Web Companion, pages
1343–1350, 2013.
[ http ]
|
|
[2]
|
Wikimedia Foundation.
Wikimedia downloads.
http://dumps.wikimedia.org/, January 2010.
|
 KONECT ‣ Networks ‣
Buy Me a Coffee
KONECT ‣ Networks ‣
Buy Me a Coffee