Wikipedia edits (vls)
This is the bipartite edit network of the West Flemish Wikipedia. It contains
users and pages from the West Flemish Wikipedia, connected by edit events. Each
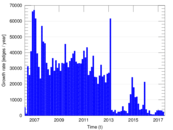
edge represents an edit. The dataset includes the timestamp of each edit.
Metadata
Statistics
| Size | n = | 19,886
|
| Left size | n1 = | 1,824
|
| Right size | n2 = | 18,062
|
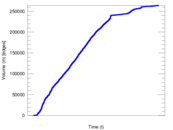
| Volume | m = | 264,055
|
| Unique edge count | m̿ = | 111,448
|
| Wedge count | s = | 128,631,580
|
| Claw count | z = | 176,467,374,982
|
| Cross count | x = | 247,605,180,171,228
|
| Square count | q = | 334,131,632
|
| 4-Tour count | T4 = | 3,187,829,160
|
| Maximum degree | dmax = | 19,418
|
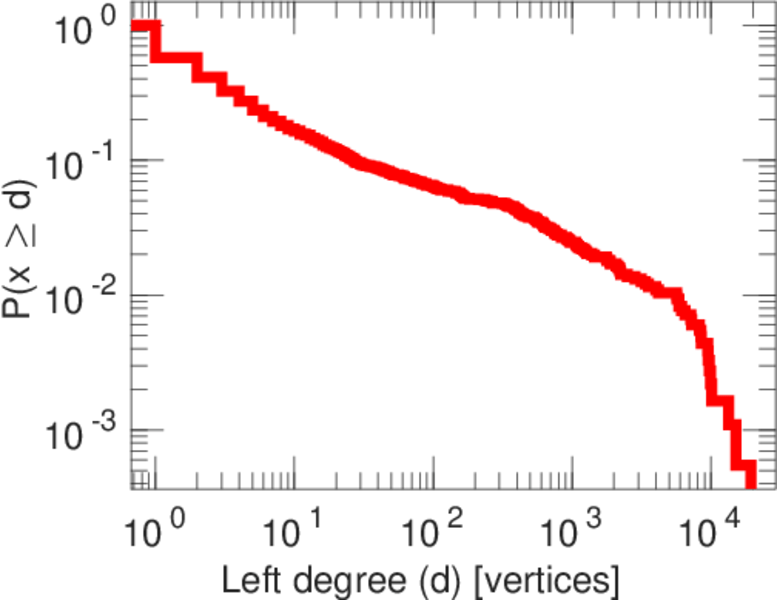
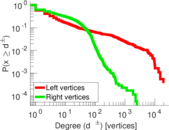
| Maximum left degree | d1max = | 19,418
|
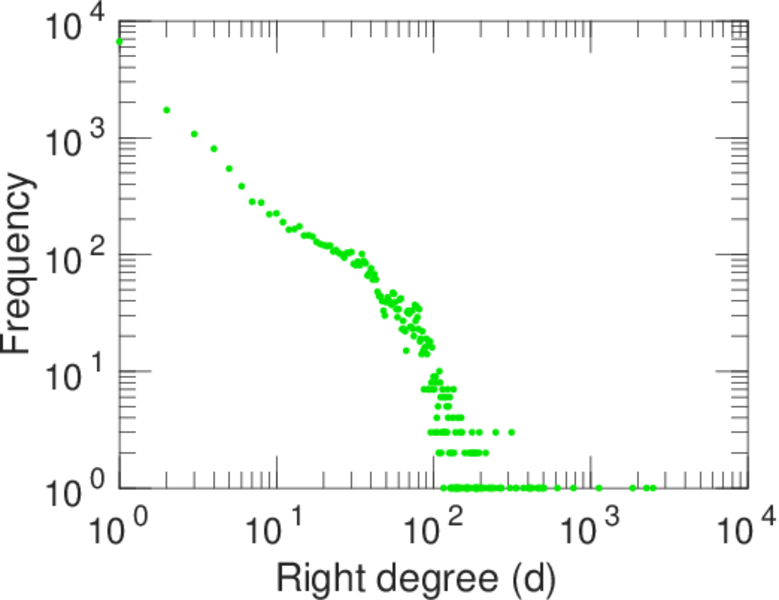
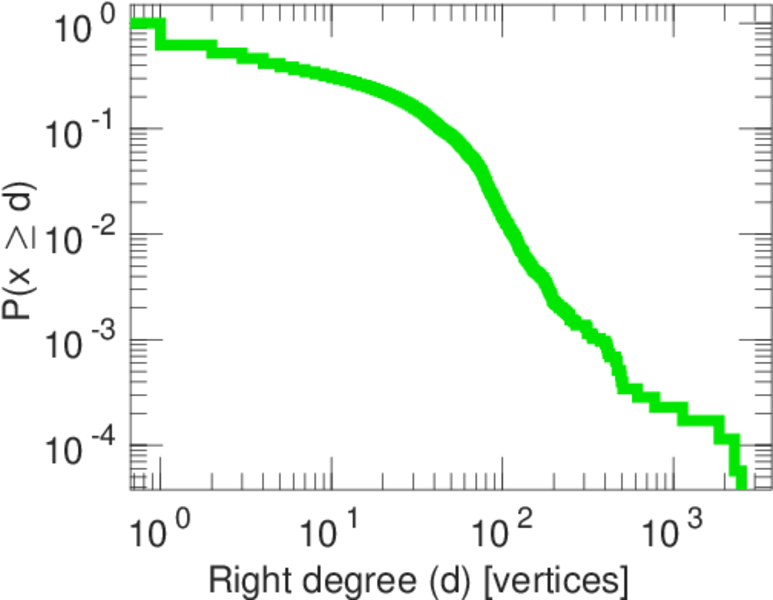
| Maximum right degree | d2max = | 2,498
|
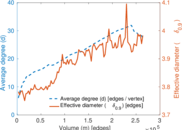
| Average degree | d = | 26.556 9
|
| Average left degree | d1 = | 144.767
|
| Average right degree | d2 = | 14.619 4
|
| Fill | p = | 0.003 382 84
|
| Average edge multiplicity | m̃ = | 2.369 31
|
| Size of LCC | N = | 18,710
|
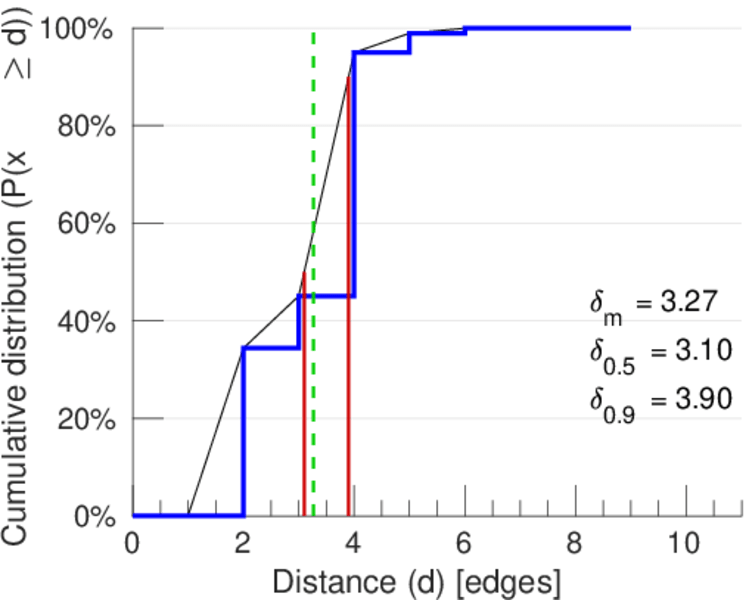
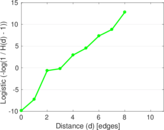
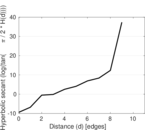
| Diameter | δ = | 11
|
| 50-Percentile effective diameter | δ0.5 = | 3.098 52
|
| 90-Percentile effective diameter | δ0.9 = | 3.900 59
|
| Median distance | δM = | 4
|
| Mean distance | δm = | 3.266 63
|
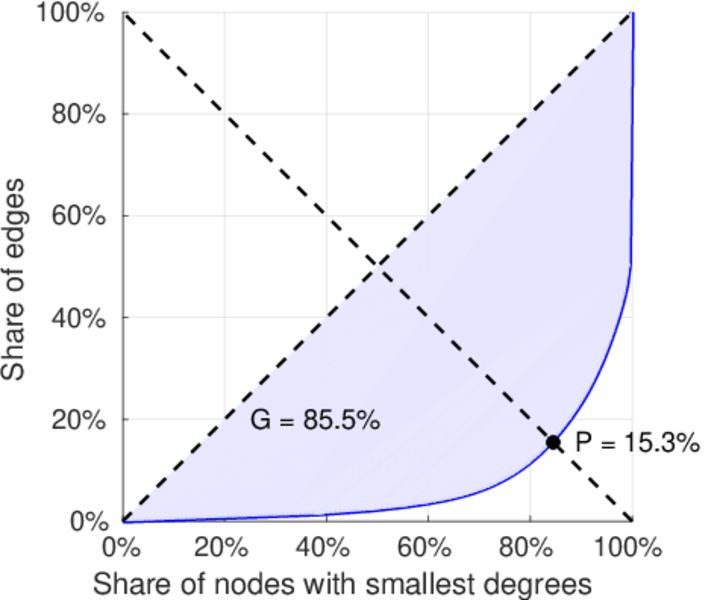
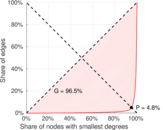
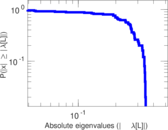
| Gini coefficient | G = | 0.849 445
|
| Balanced inequality ratio | P = | 0.159 272
|
| Left balanced inequality ratio | P1 = | 0.047 649 2
|
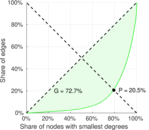
| Right balanced inequality ratio | P2 = | 0.204 900
|
| Relative edge distribution entropy | Her = | 0.757 231
|
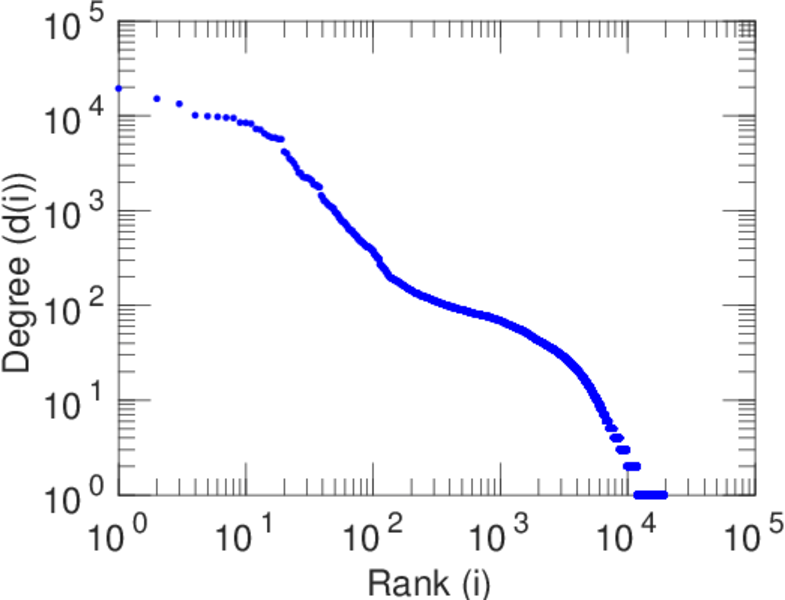
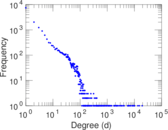
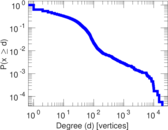
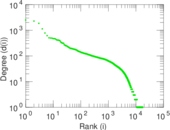
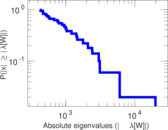
| Power law exponent | γ = | 1.950 95
|
| Tail power law exponent | γt = | 1.651 00
|
| Tail power law exponent with p | γ3 = | 1.651 00
|
| p-value | p = | 0.000 00
|
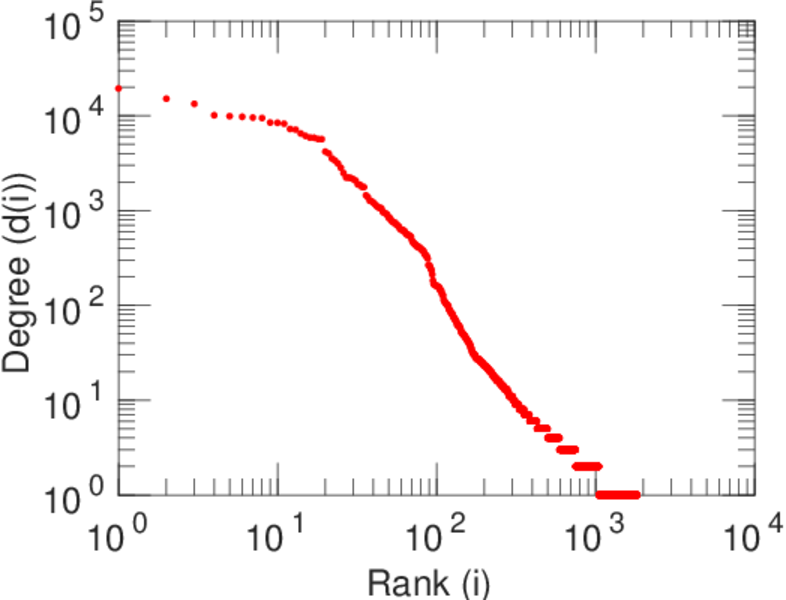
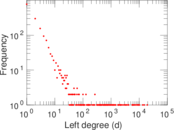
| Left tail power law exponent with p | γ3,1 = | 1.711 00
|
| Left p-value | p1 = | 0.000 00
|
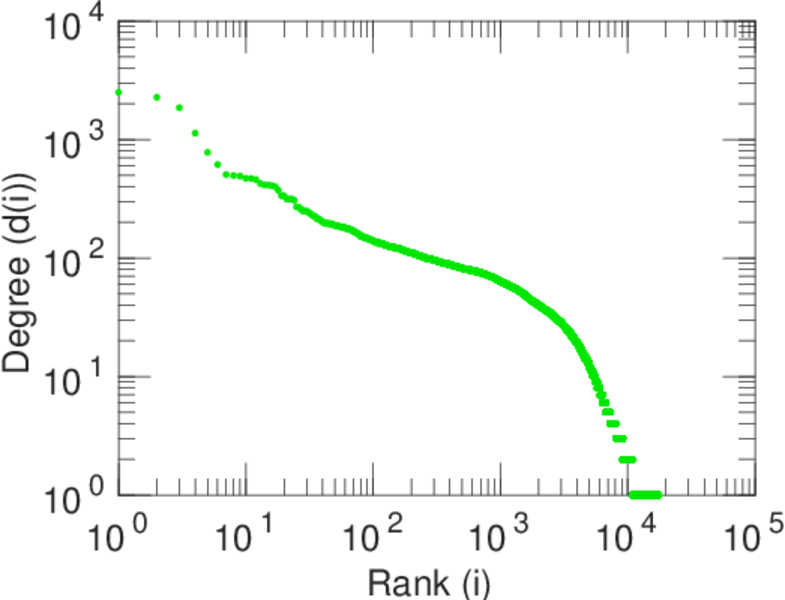
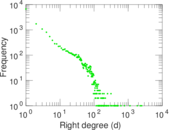
| Right tail power law exponent with p | γ3,2 = | 6.991 00
|
| Right p-value | p2 = | 0.568 000
|
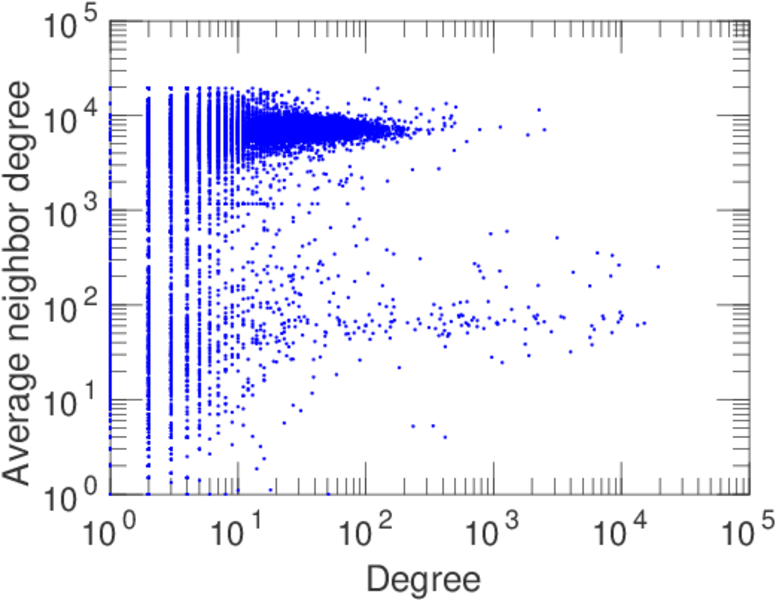
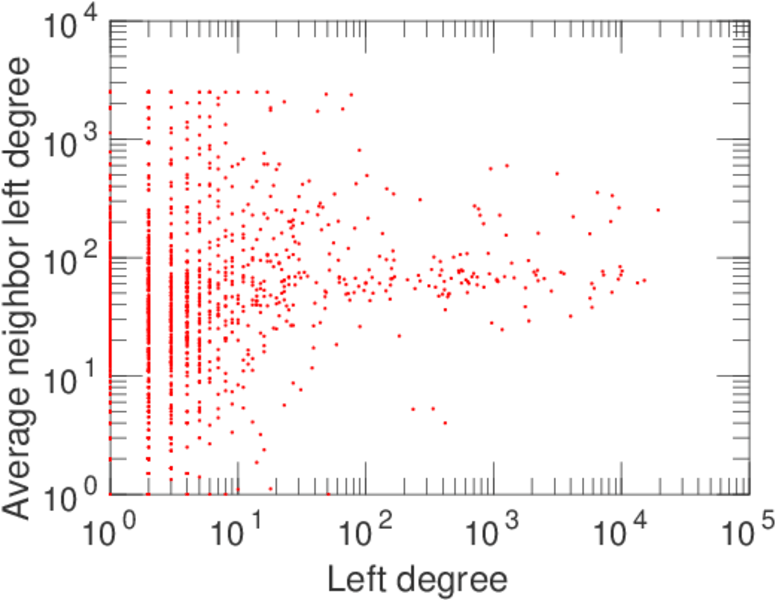
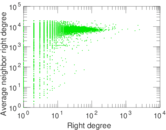
| Degree assortativity | ρ = | −0.211 735
|
| Degree assortativity p-value | pρ = | 0.000 00
|
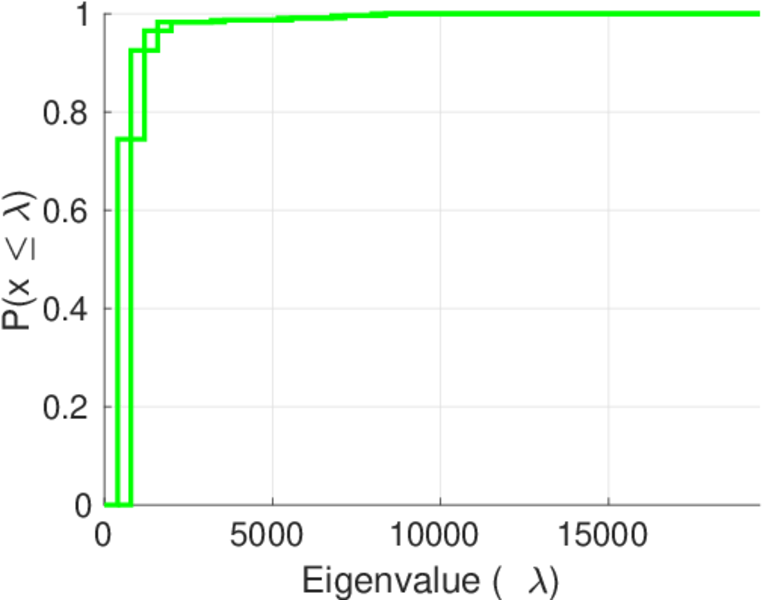
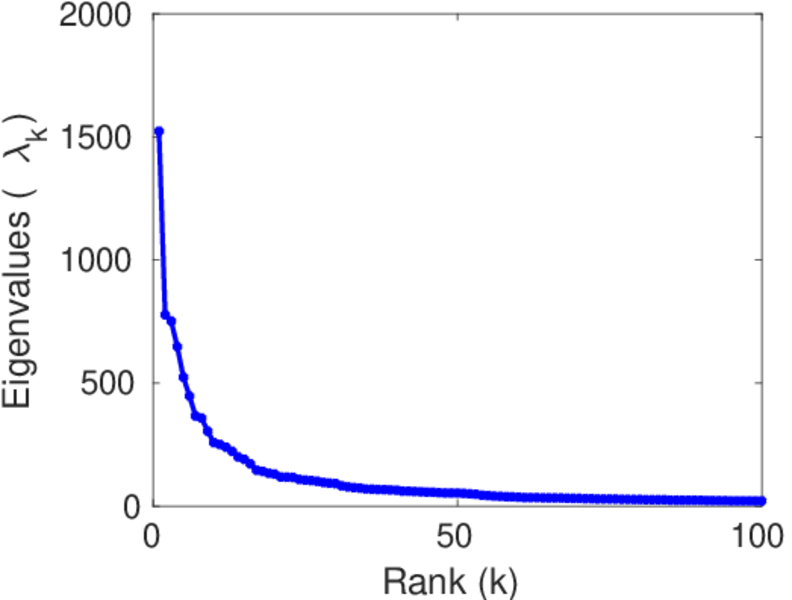
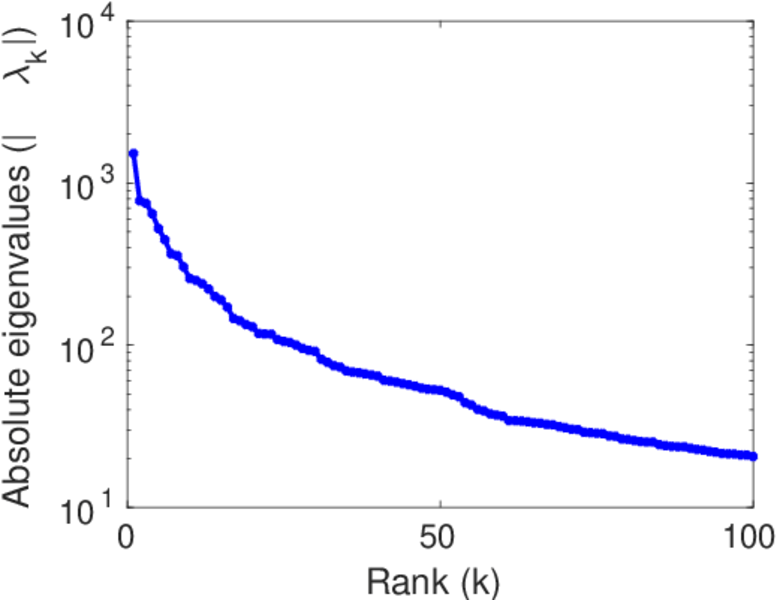
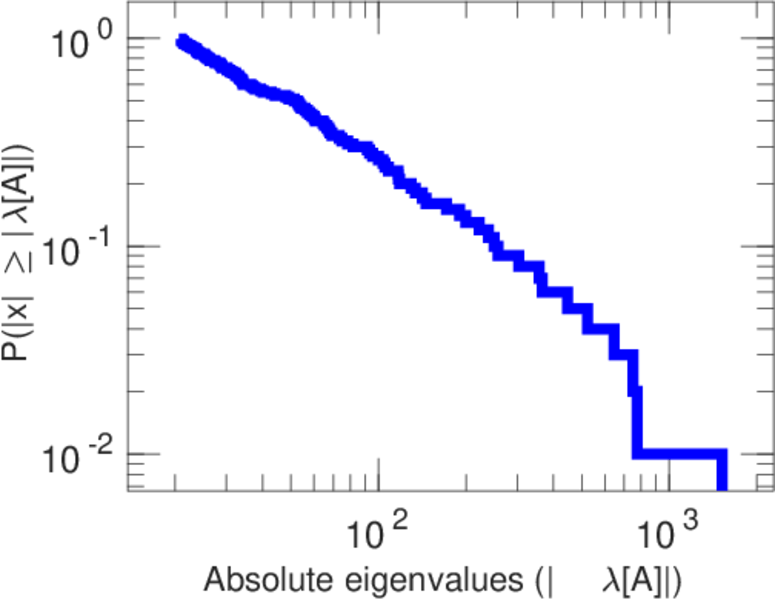
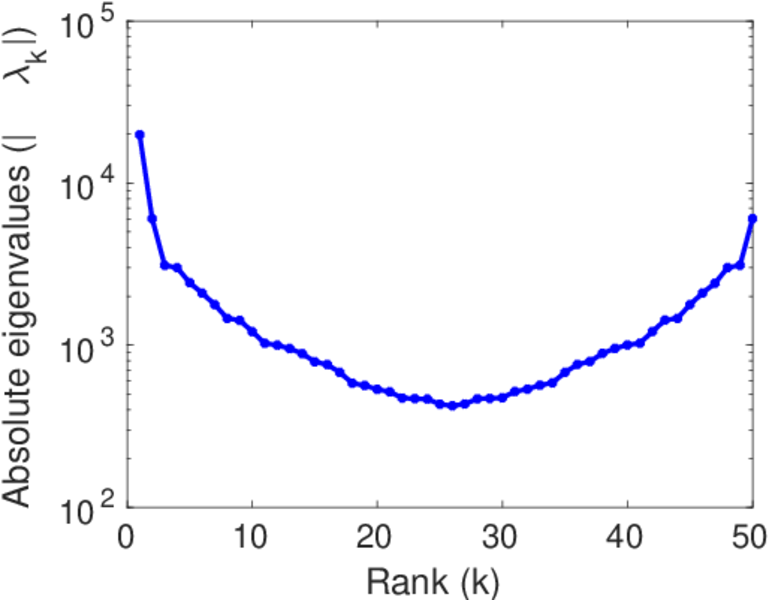
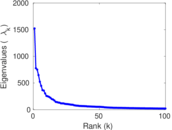
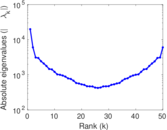
| Spectral norm | α = | 1,522.04
|
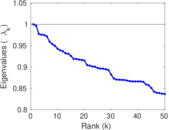
| Algebraic connectivity | a = | 0.039 284 4
|
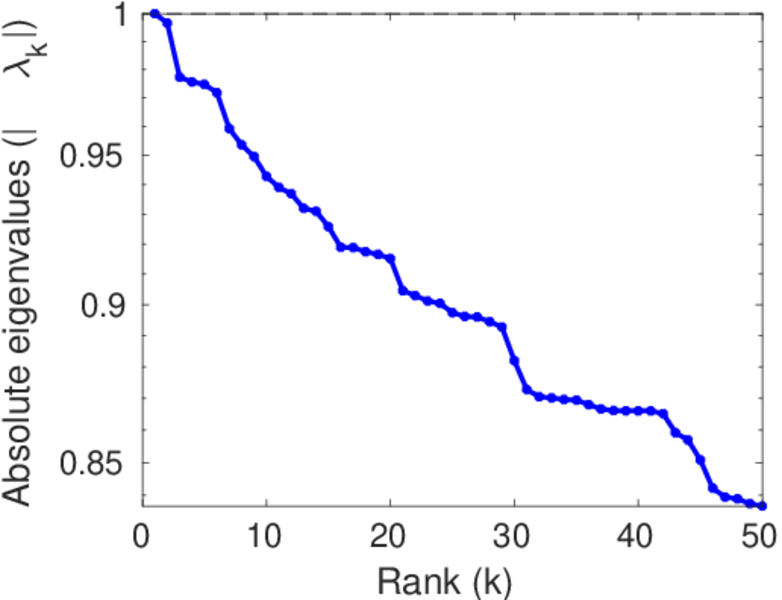
| Spectral separation | |λ1[A] / λ2[A]| = | 1.959 09
|
| Controllability | C = | 16,063
|
| Relative controllability | Cr = | 0.830 816
|
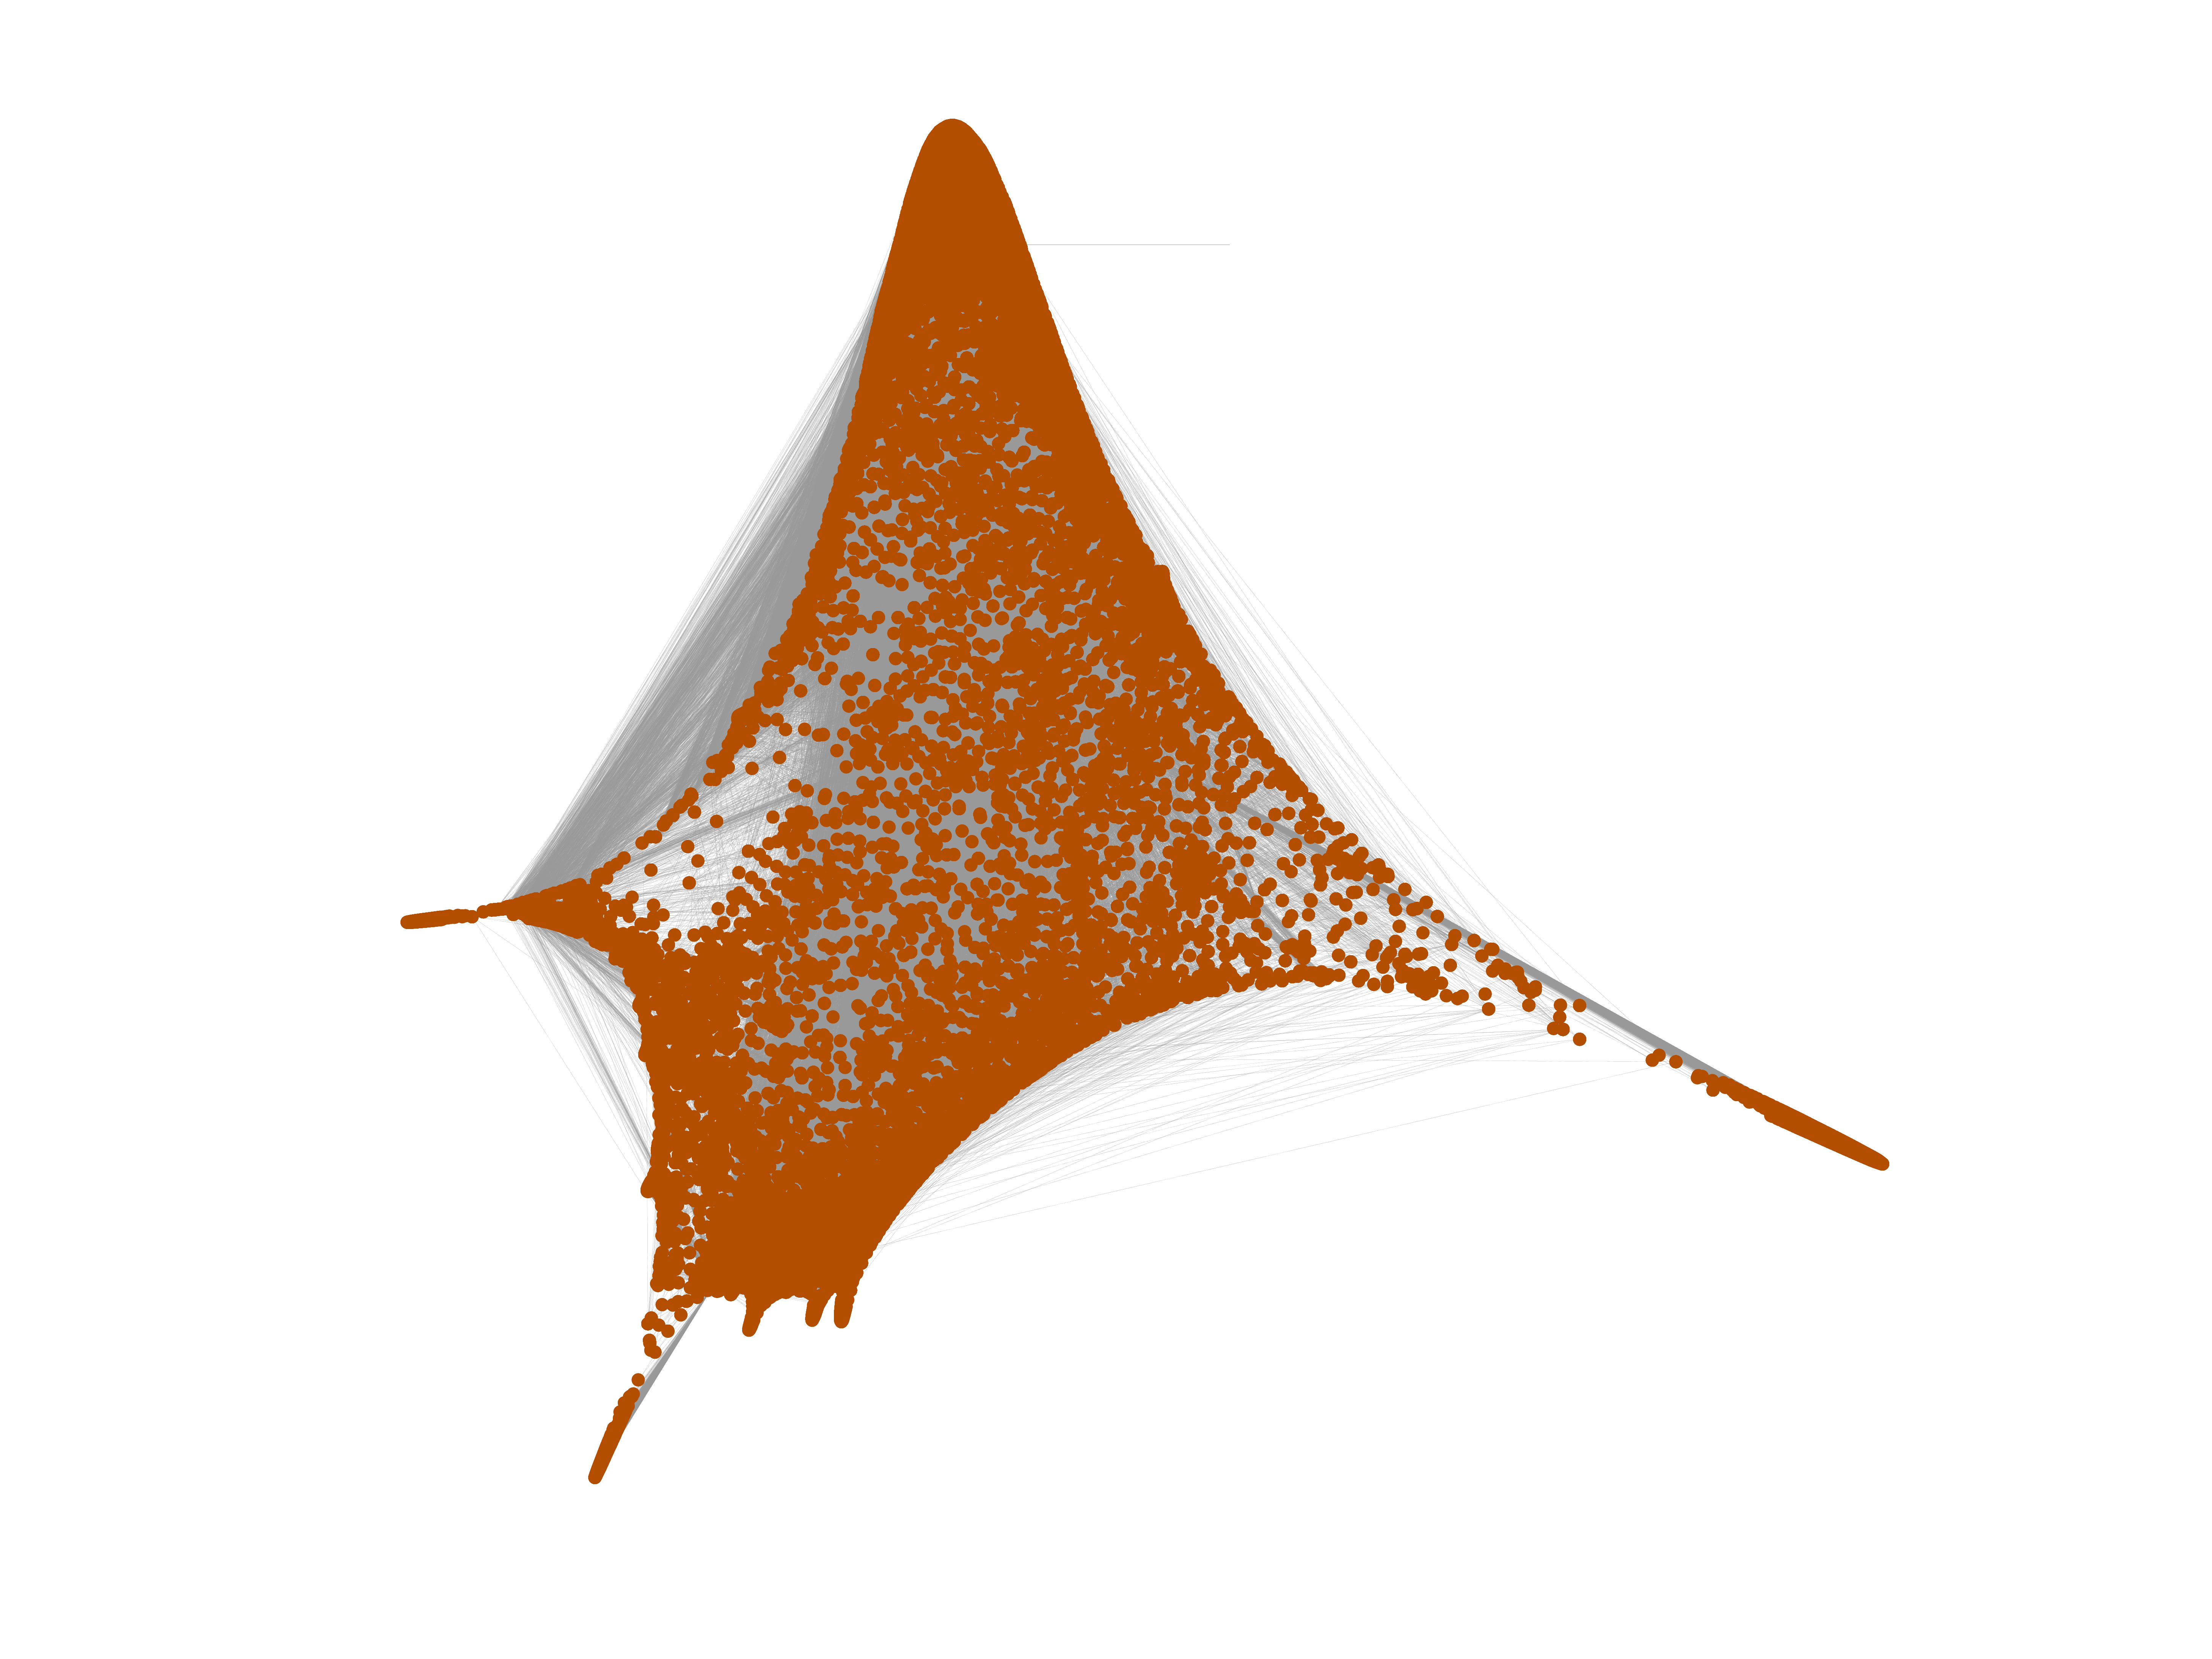
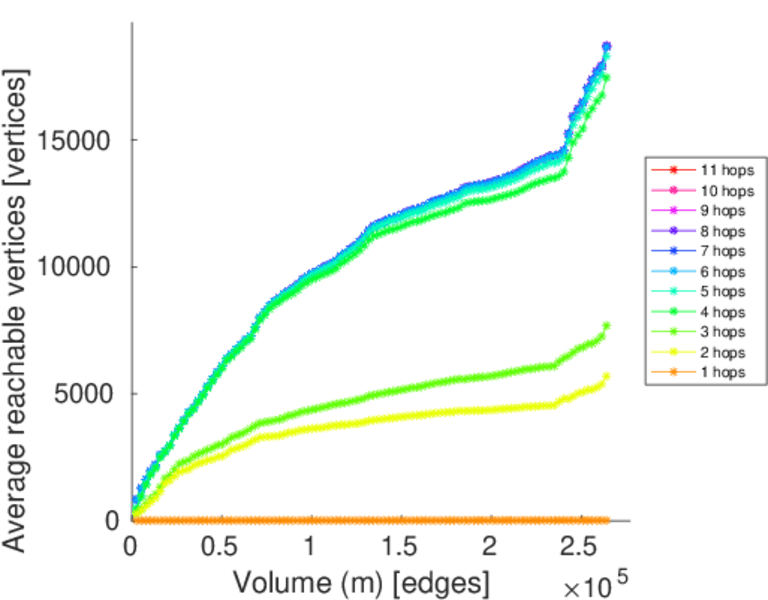
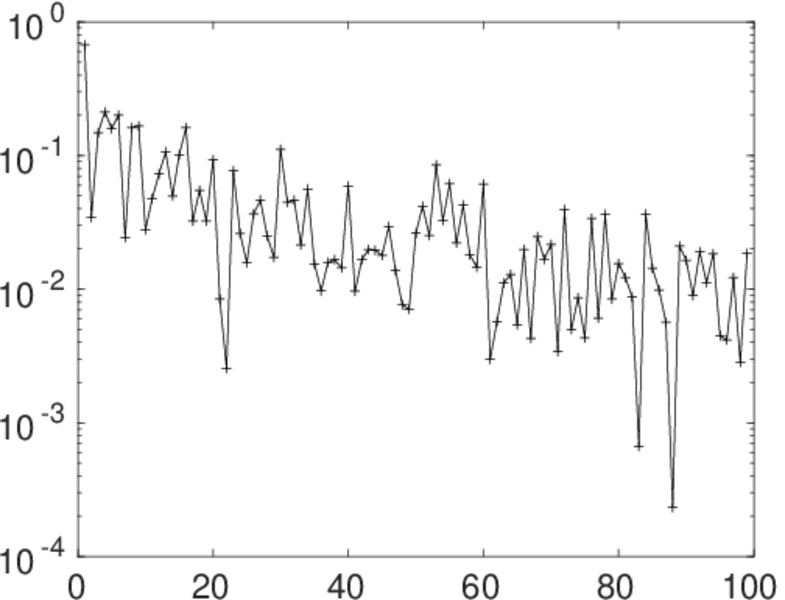
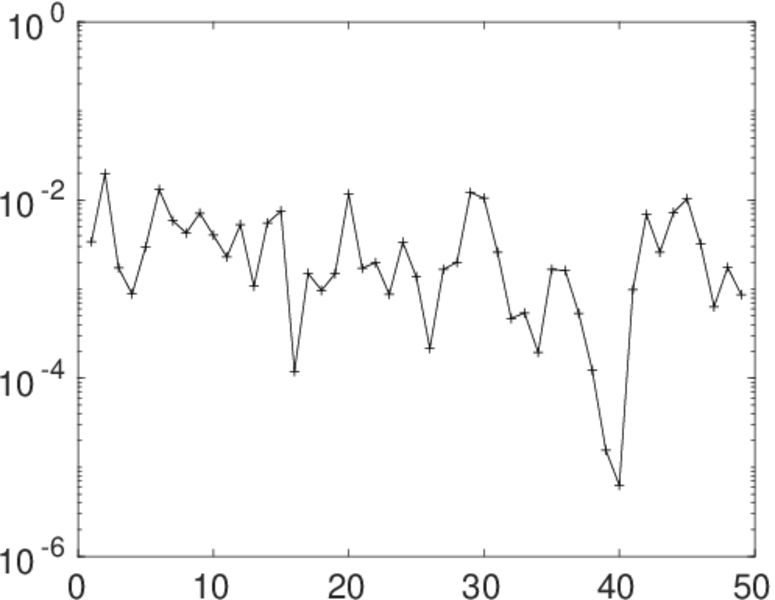
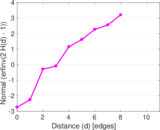
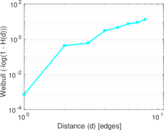
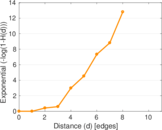
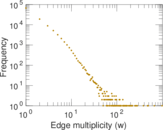
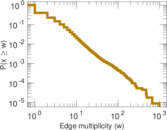
Plots


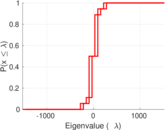
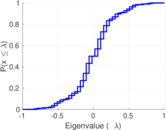


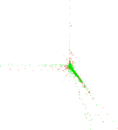
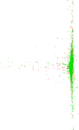


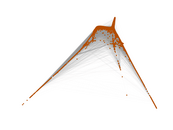


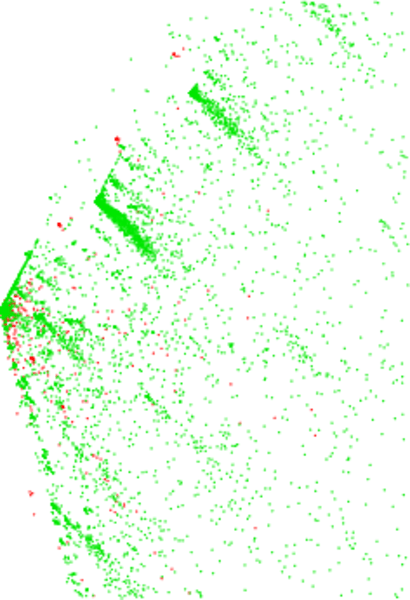
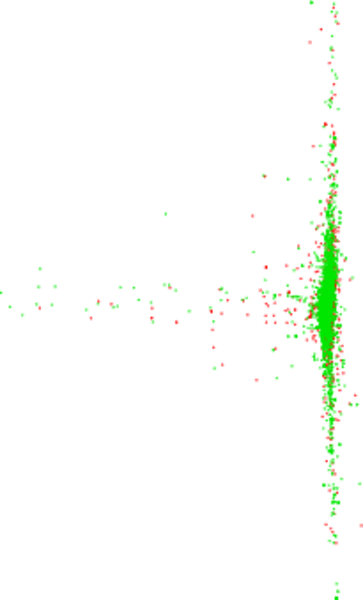
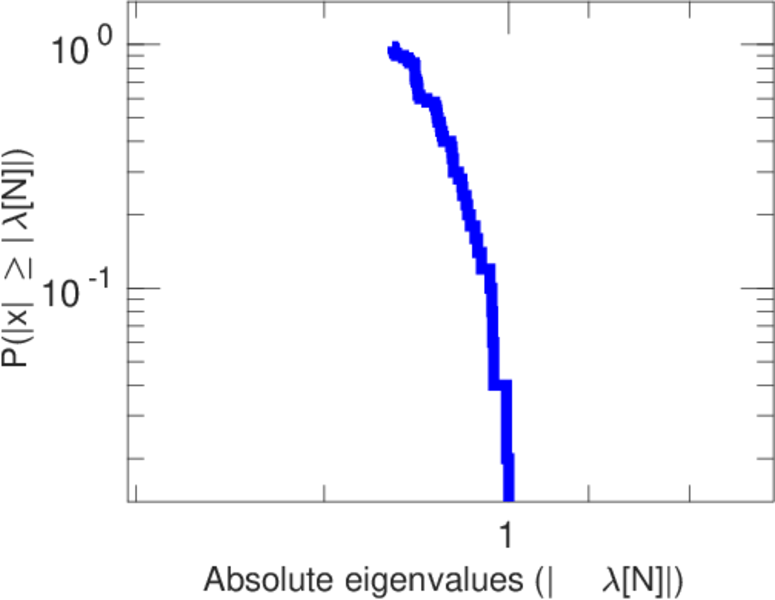
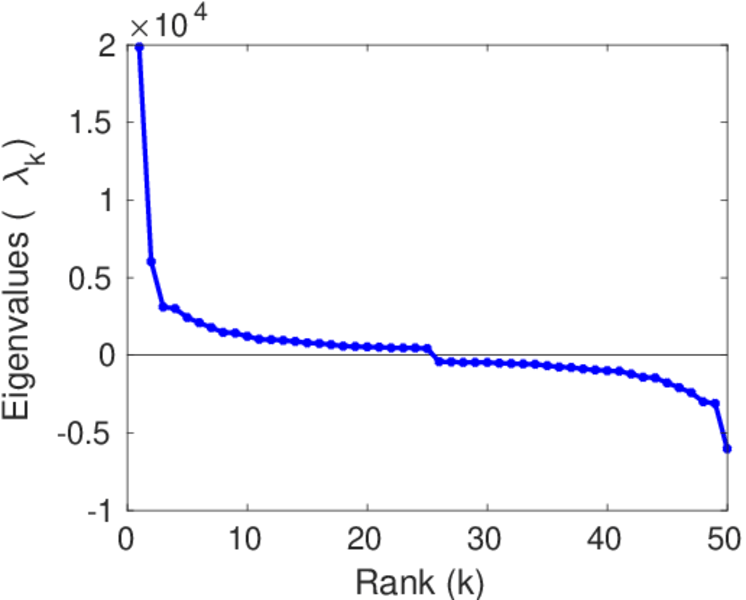
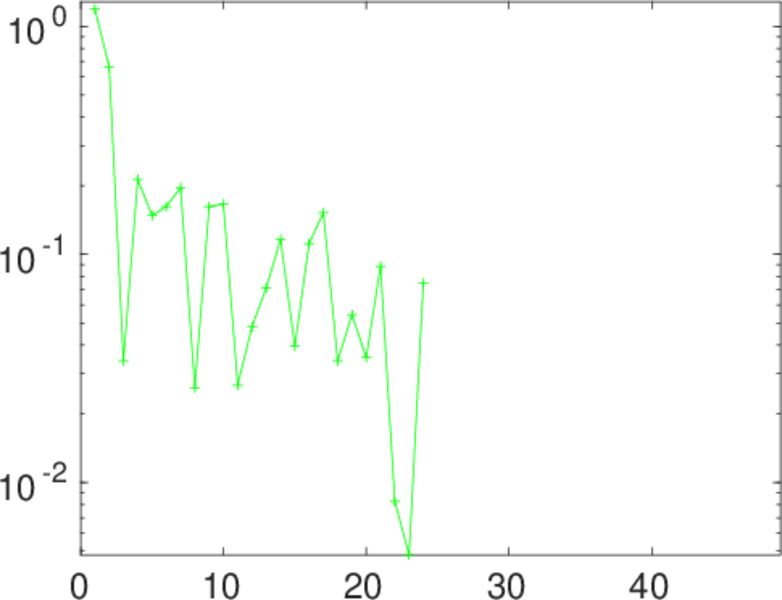
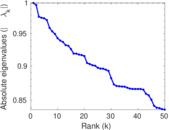
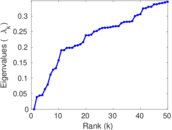
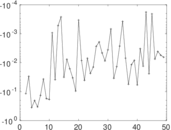
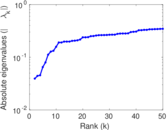
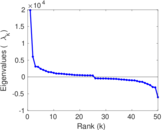
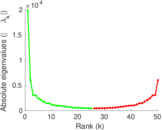
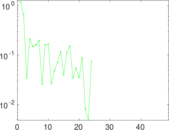
Matrix decompositions plots


Downloads
References
|
[1]
|
Jérôme Kunegis.
KONECT – The Koblenz Network Collection.
In Proc. Int. Conf. on World Wide Web Companion, pages
1343–1350, 2013.
[ http ]
|
|
[2]
|
Wikimedia Foundation.
Wikimedia downloads.
http://dumps.wikimedia.org/, January 2010.
|
 KONECT ‣ Networks ‣
Buy Me a Coffee
KONECT ‣ Networks ‣
Buy Me a Coffee