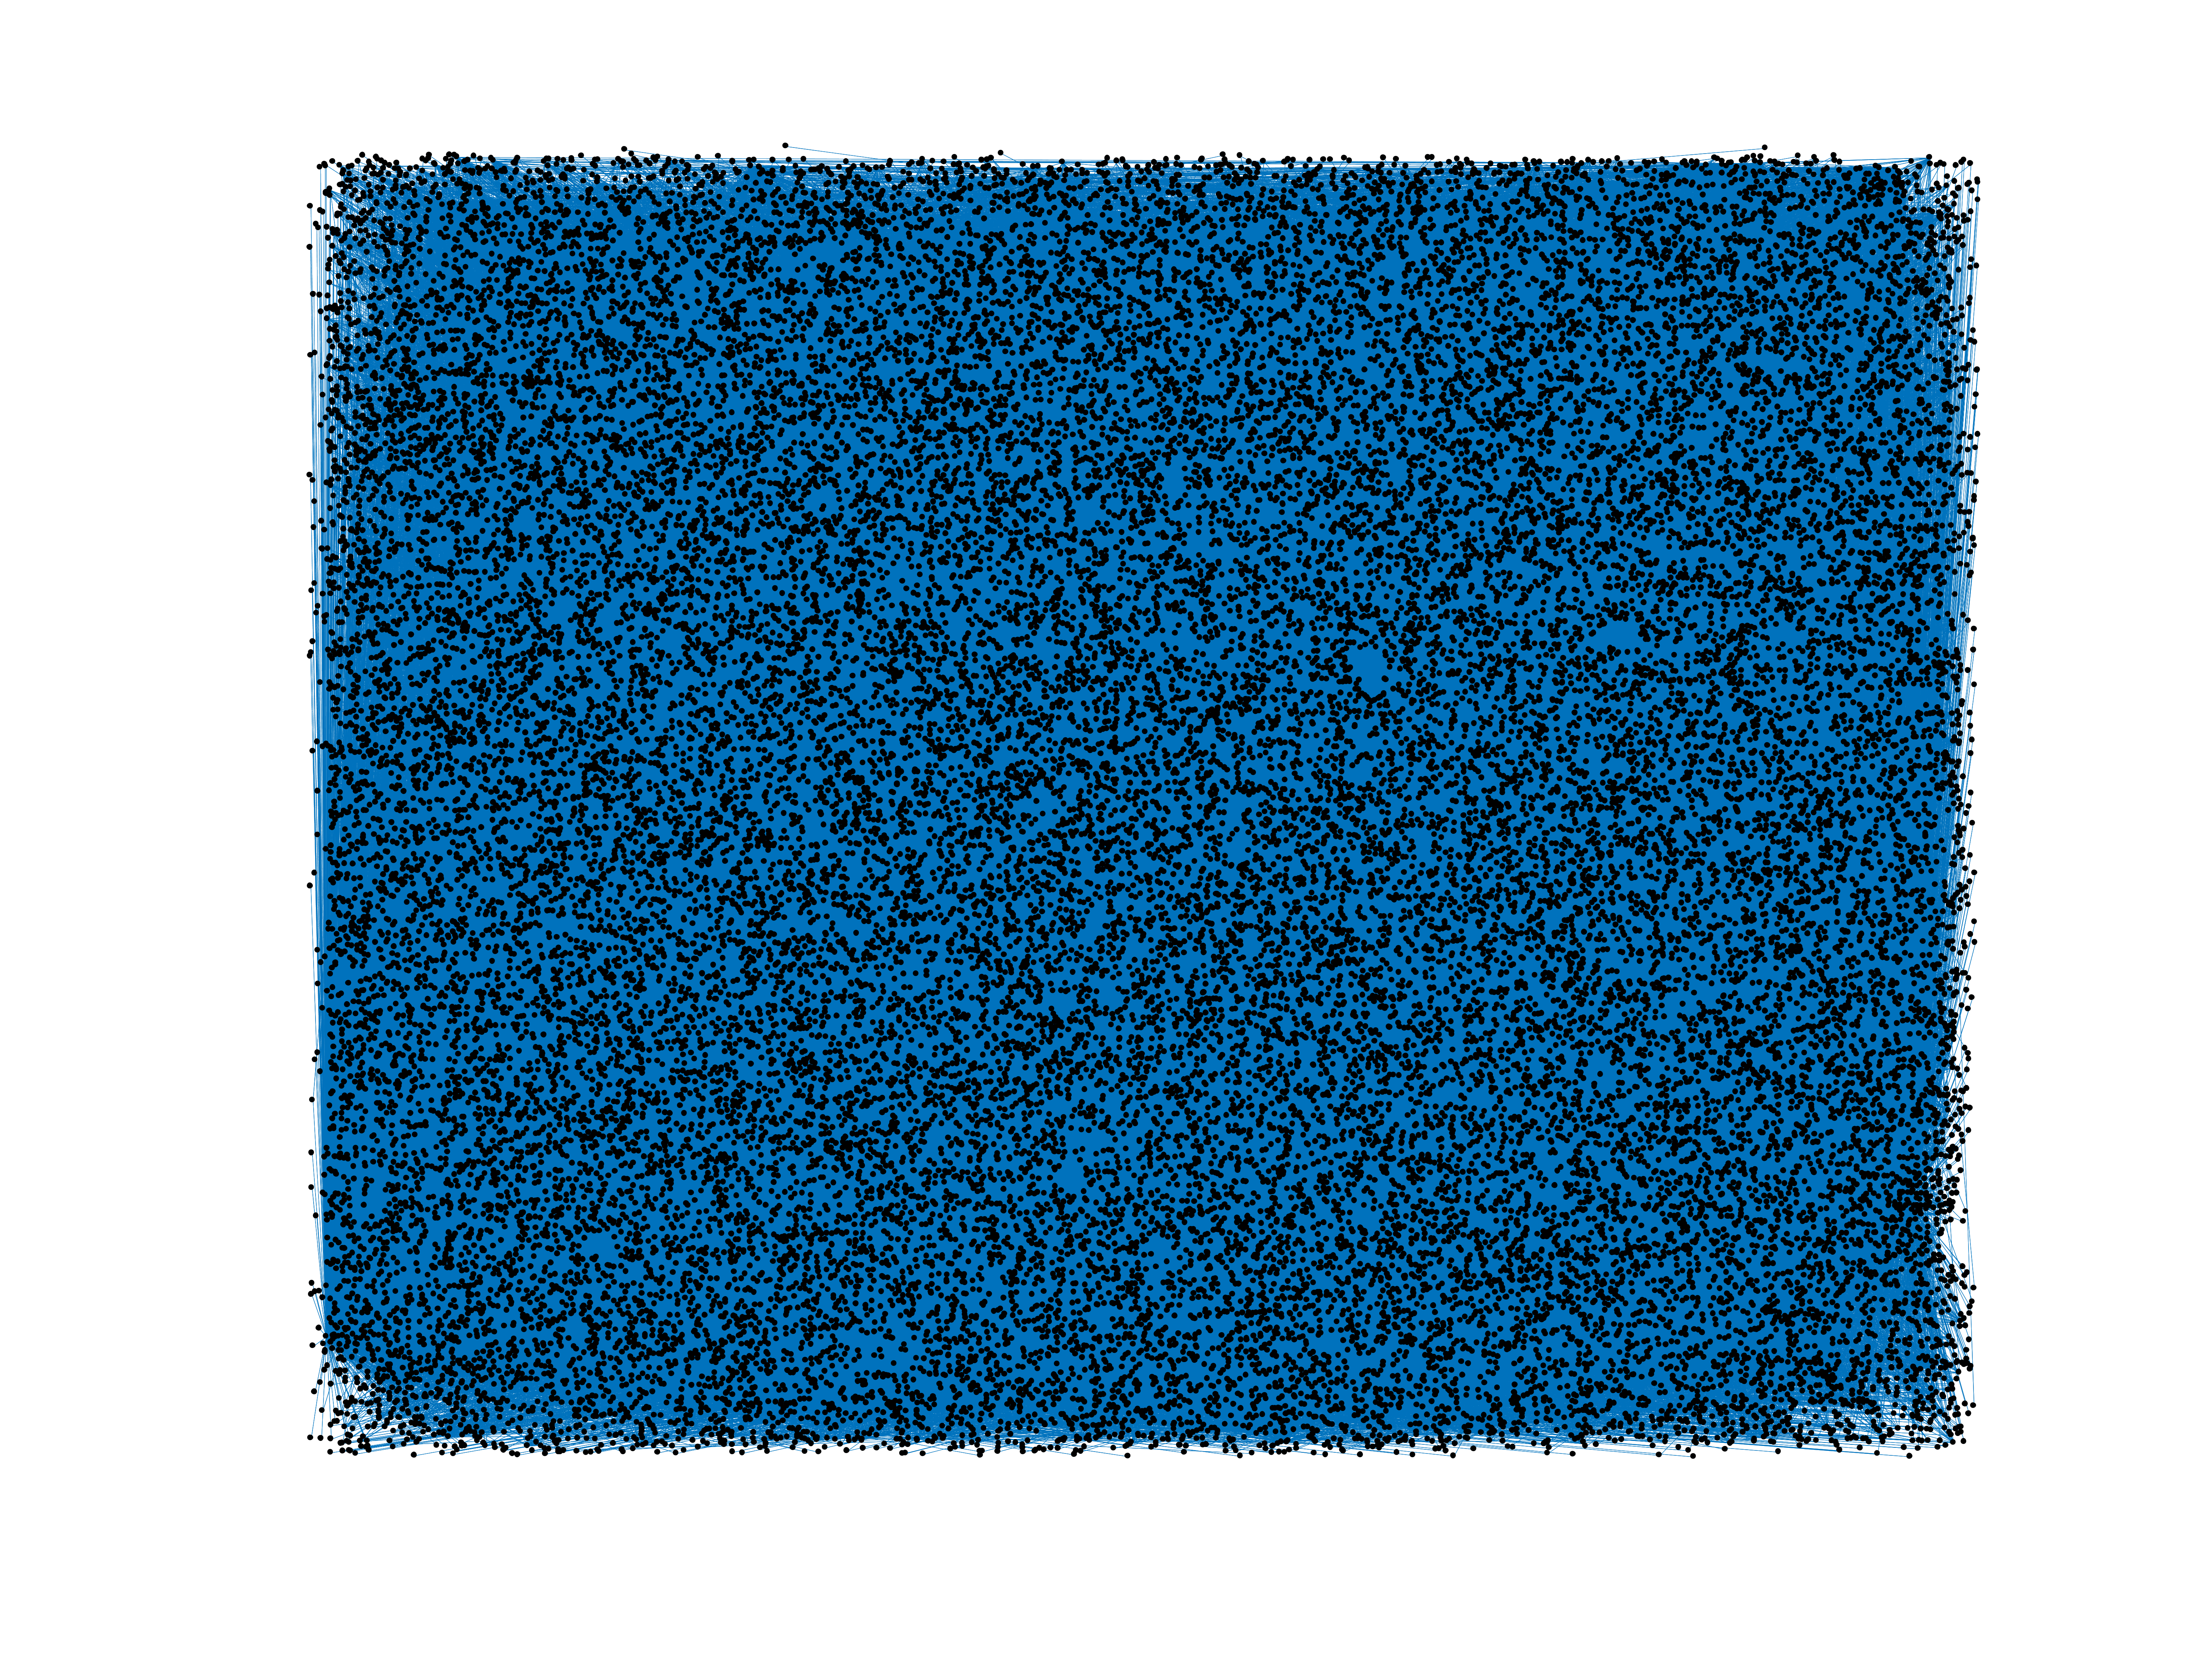
Wikipedia edits (wa)
This is the bipartite edit network of the Walloon Wikipedia. It contains users
and pages from the Walloon Wikipedia, connected by edit events. Each edge
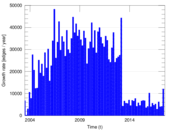
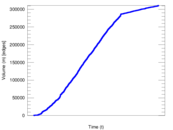
represents an edit. The dataset includes the timestamp of each edit.
Metadata
Statistics
| Size | n = | 38,946
|
| Left size | n1 = | 1,455
|
| Right size | n2 = | 37,491
|
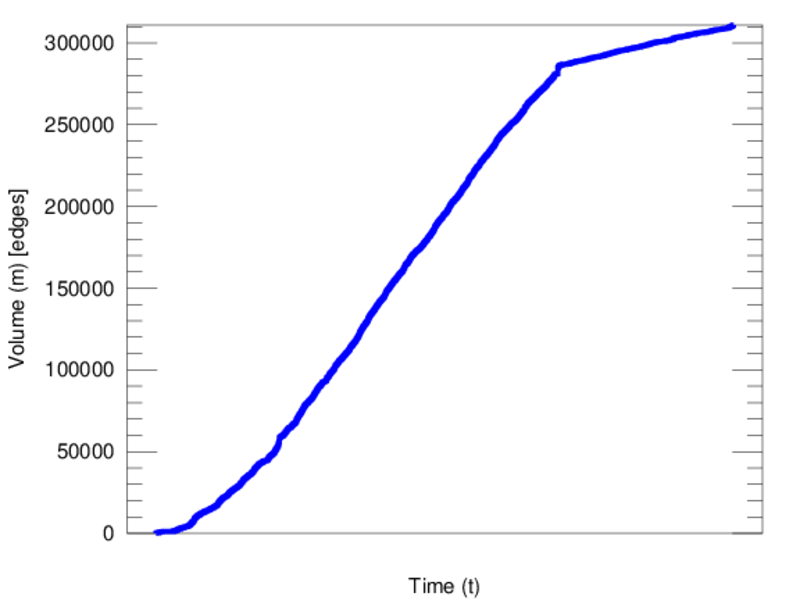
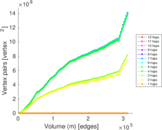
| Volume | m = | 311,049
|
| Unique edge count | m̿ = | 130,189
|
| Wedge count | s = | 465,986,386
|
| Claw count | z = | 2,820,387,115,733
|
| Cross count | x = | 15,333,838,425,572,086
|
| Square count | q = | 394,927,900
|
| 4-Tour count | T4 = | 5,023,698,818
|
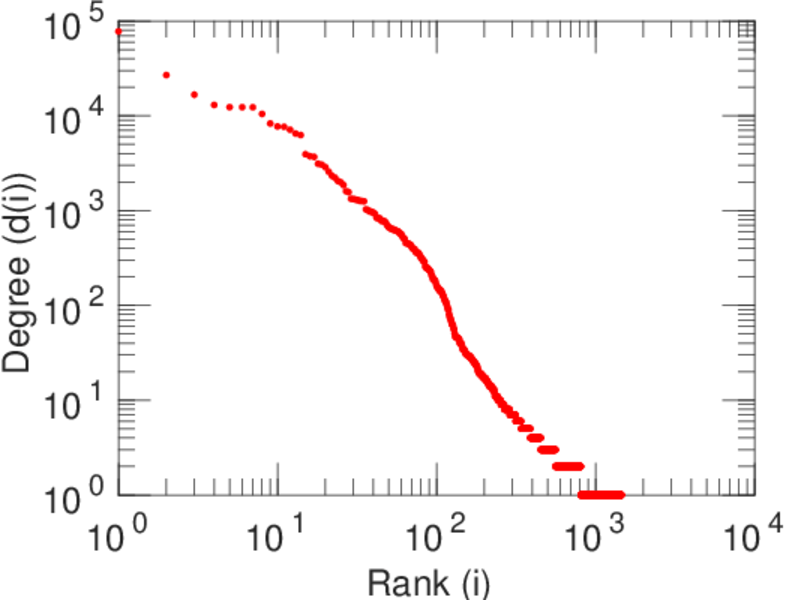
| Maximum degree | dmax = | 77,710
|
| Maximum left degree | d1max = | 77,710
|
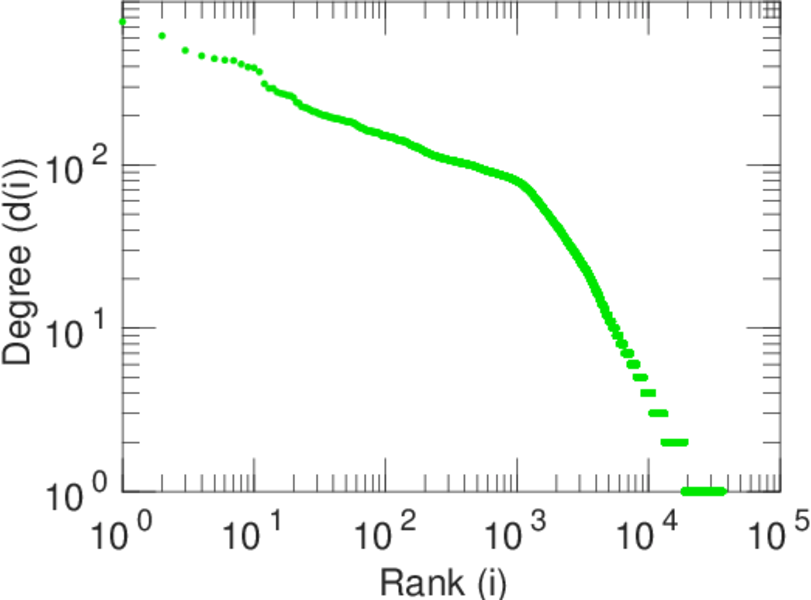
| Maximum right degree | d2max = | 752
|
| Average degree | d = | 15.973 3
|
| Average left degree | d1 = | 213.779
|
| Average right degree | d2 = | 8.296 63
|
| Fill | p = | 0.002 386 63
|
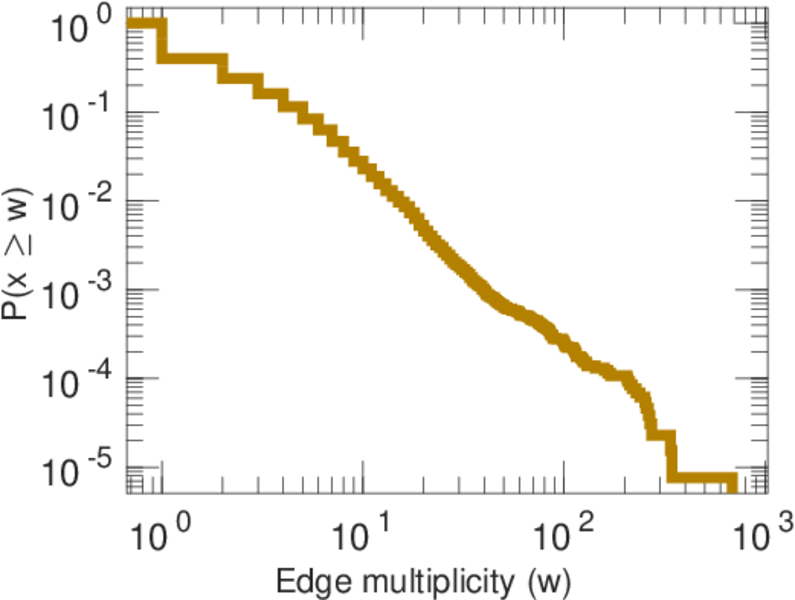
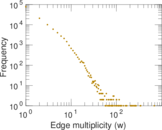
| Average edge multiplicity | m̃ = | 2.389 21
|
| Size of LCC | N = | 37,501
|
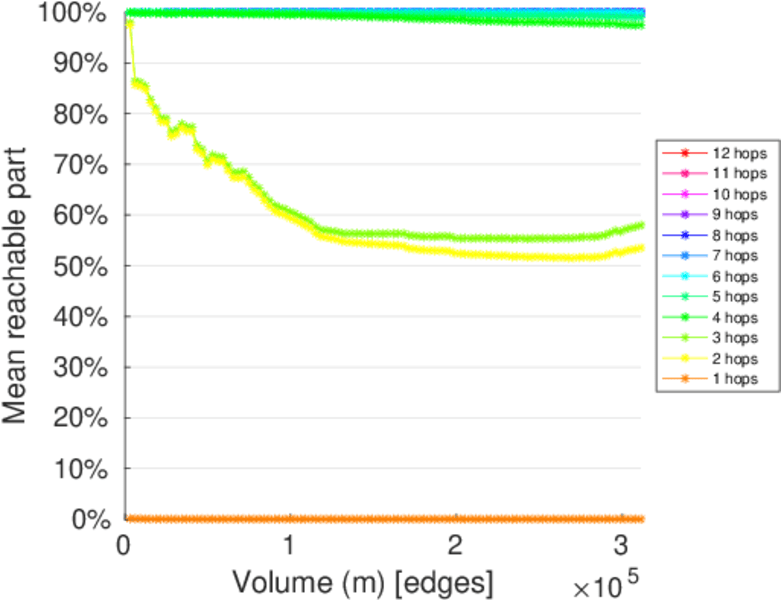
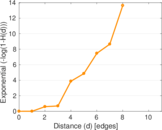
| Diameter | δ = | 12
|
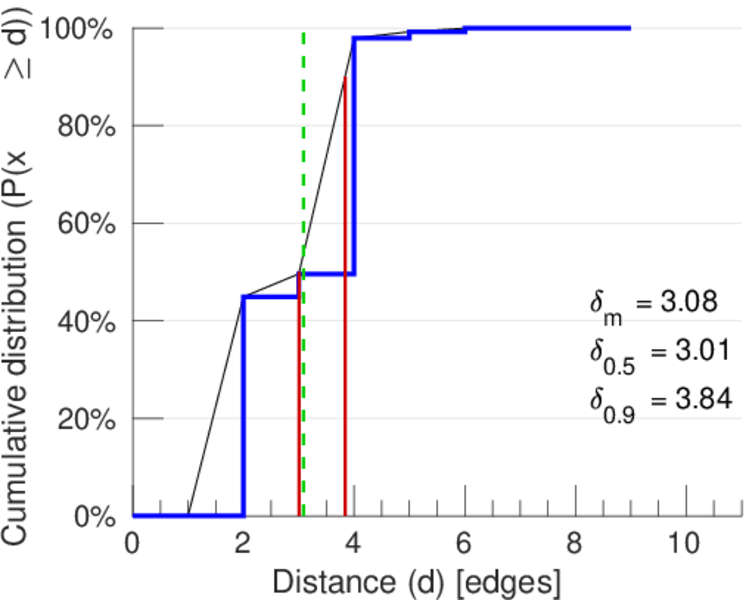
| 50-Percentile effective diameter | δ0.5 = | 3.008 22
|
| 90-Percentile effective diameter | δ0.9 = | 3.836 08
|
| Median distance | δM = | 4
|
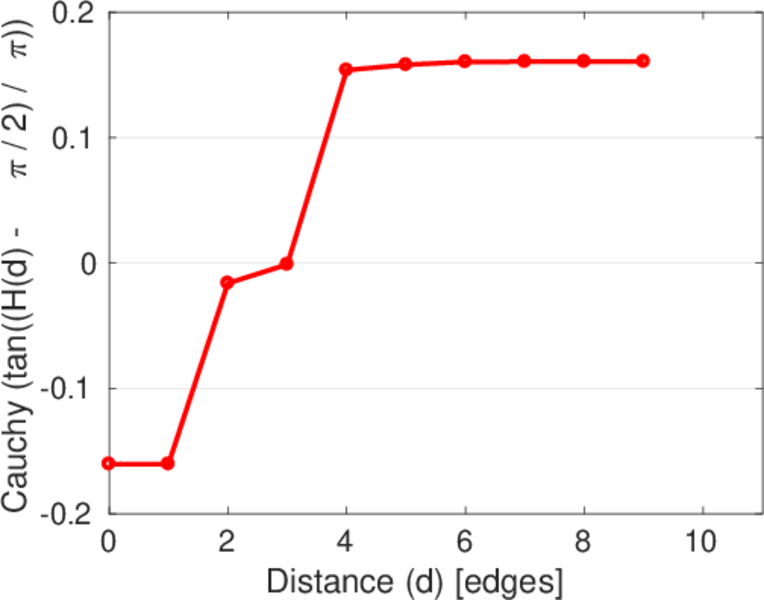
| Mean distance | δm = | 3.084 15
|
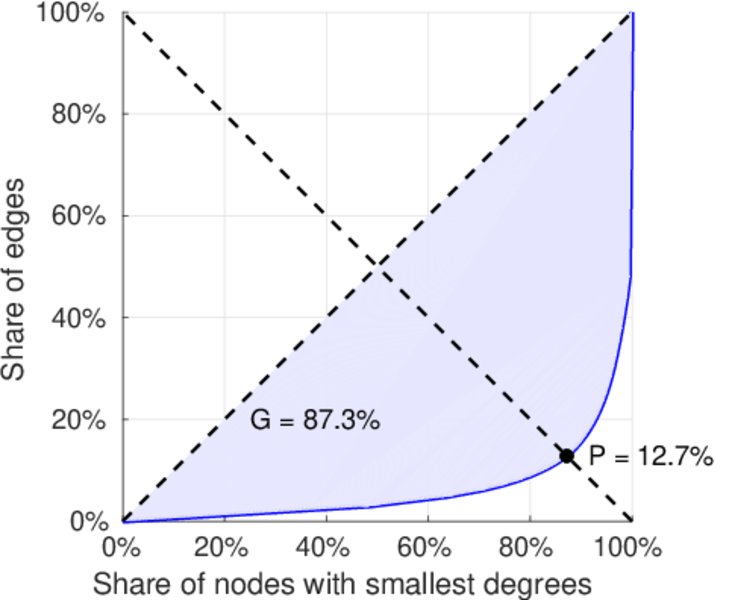
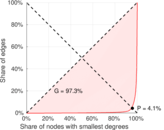
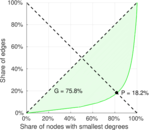
| Gini coefficient | G = | 0.872 798
|
| Balanced inequality ratio | P = | 0.128 311
|
| Left balanced inequality ratio | P1 = | 0.040 819 9
|
| Right balanced inequality ratio | P2 = | 0.182 036
|
| Relative edge distribution entropy | Her = | 0.709 855
|
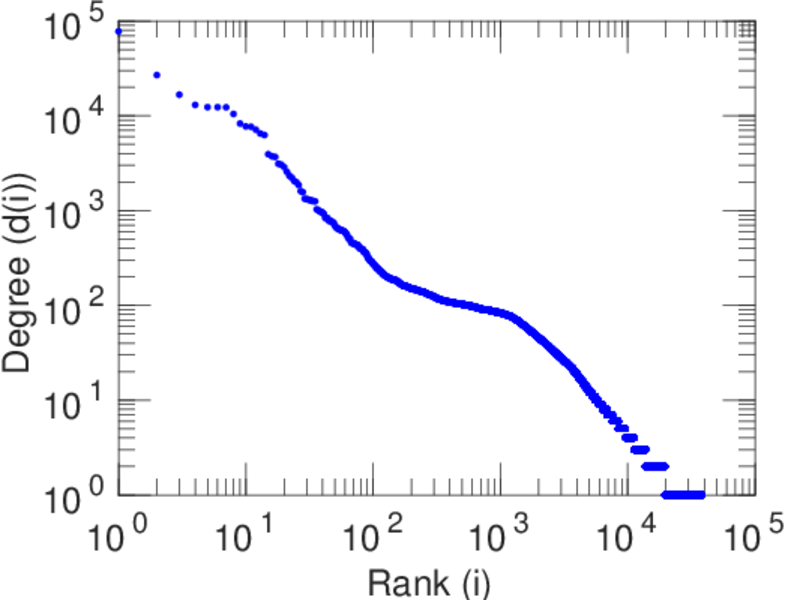
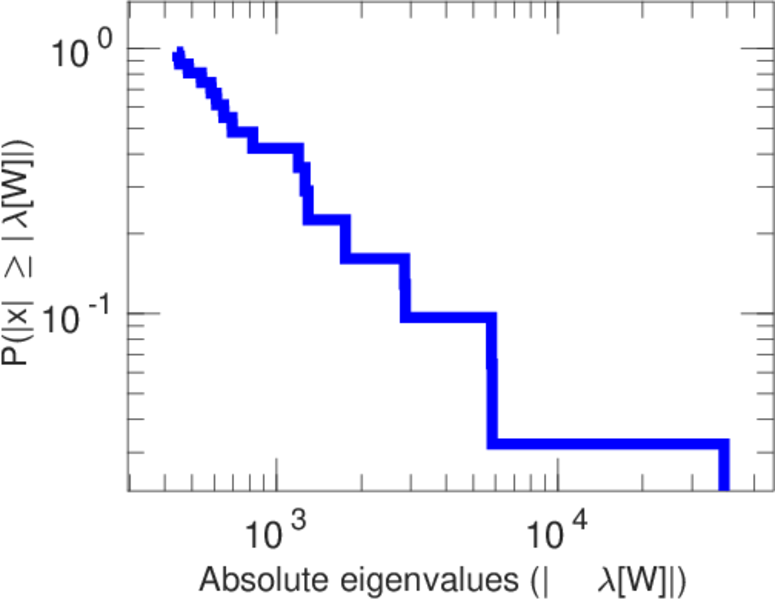
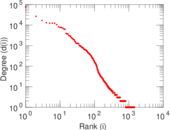
| Power law exponent | γ = | 2.770 12
|
| Tail power law exponent | γt = | 2.001 00
|
| Tail power law exponent with p | γ3 = | 2.001 00
|
| p-value | p = | 0.000 00
|
| Left tail power law exponent with p | γ3,1 = | 1.651 00
|
| Left p-value | p1 = | 0.000 00
|
| Right tail power law exponent with p | γ3,2 = | 8.911 00
|
| Right p-value | p2 = | 0.041 000 0
|
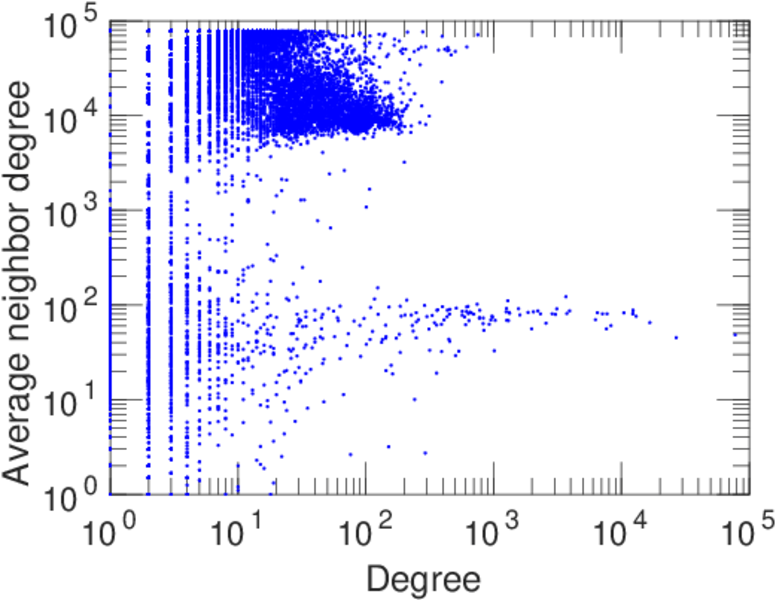
| Degree assortativity | ρ = | −0.558 263
|
| Degree assortativity p-value | pρ = | 0.000 00
|
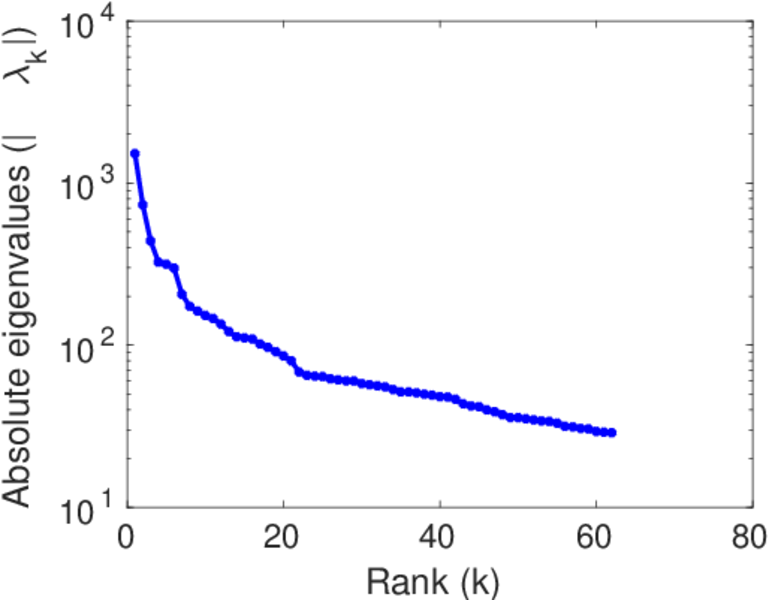
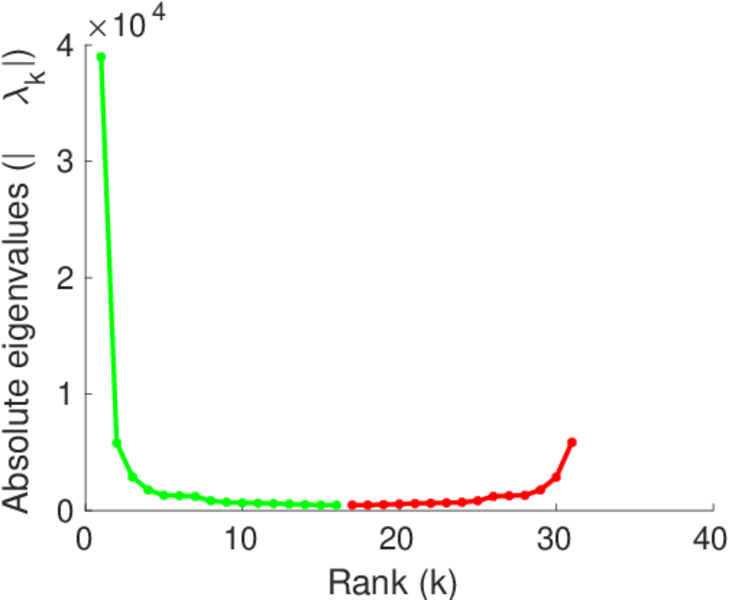
| Spectral norm | α = | 1,517.15
|
| Algebraic connectivity | a = | 0.045 688 1
|
| Spectral separation | |λ1[A] / λ2[A]| = | 2.067 05
|
| Controllability | C = | 35,462
|
| Relative controllability | Cr = | 0.928 665
|
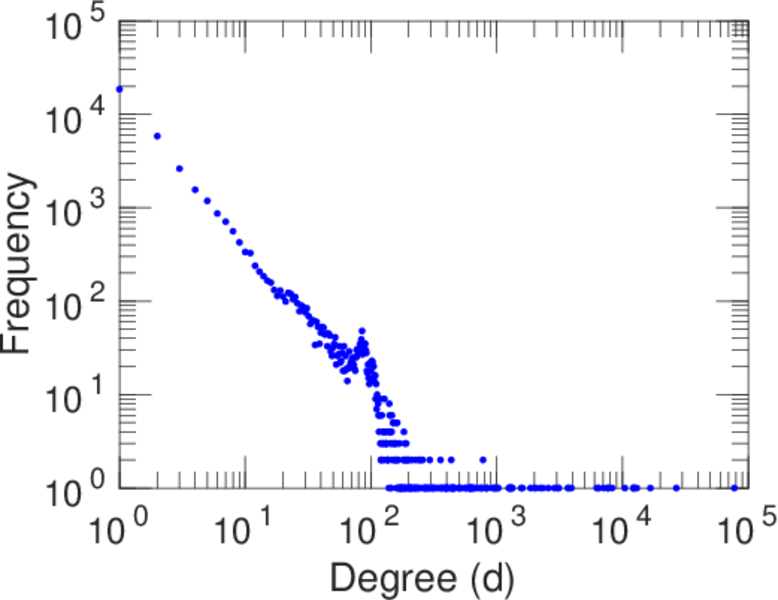
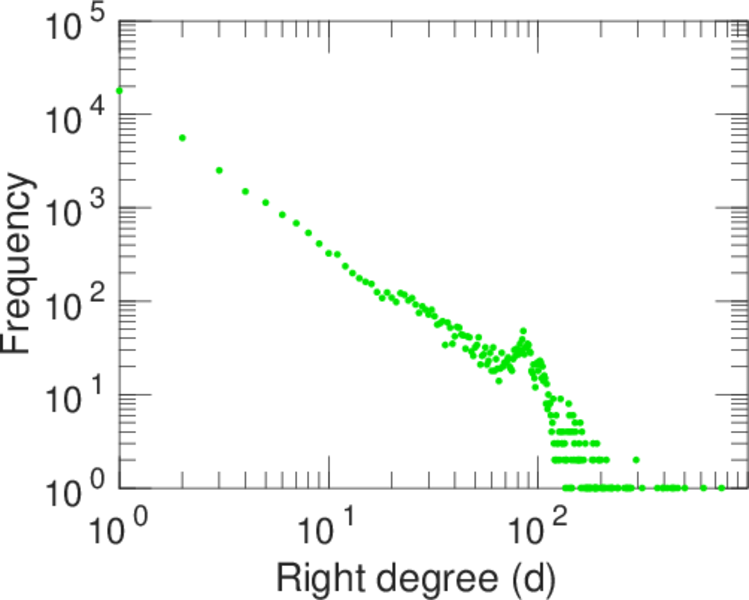
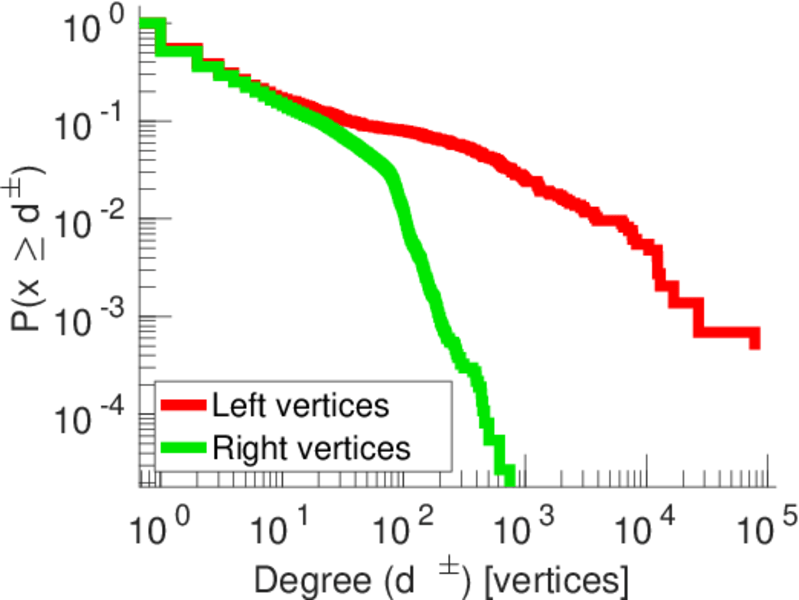
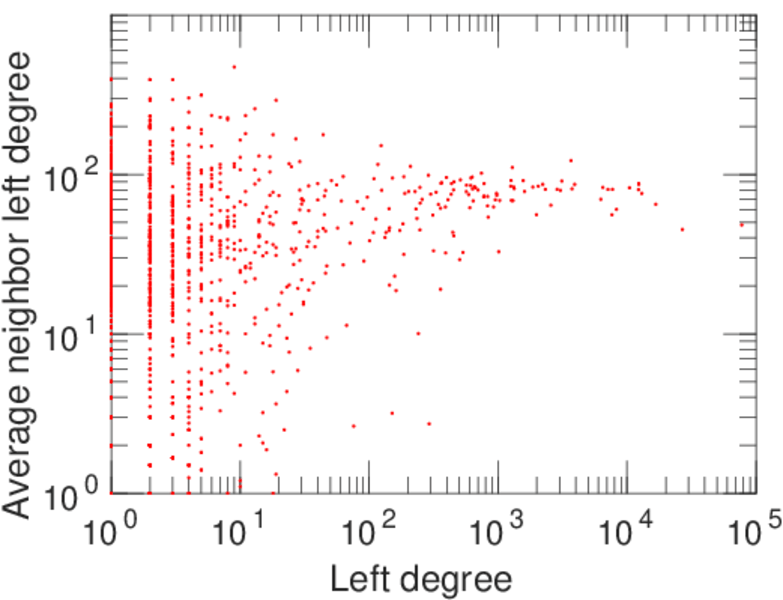
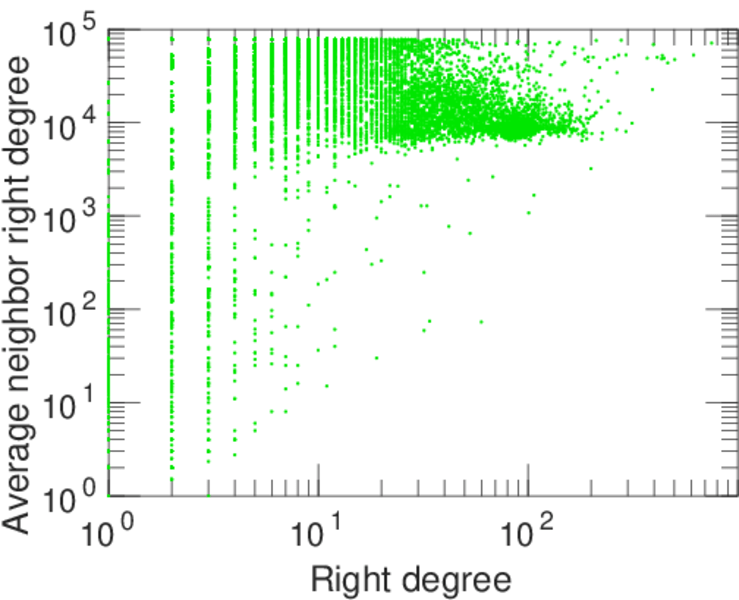
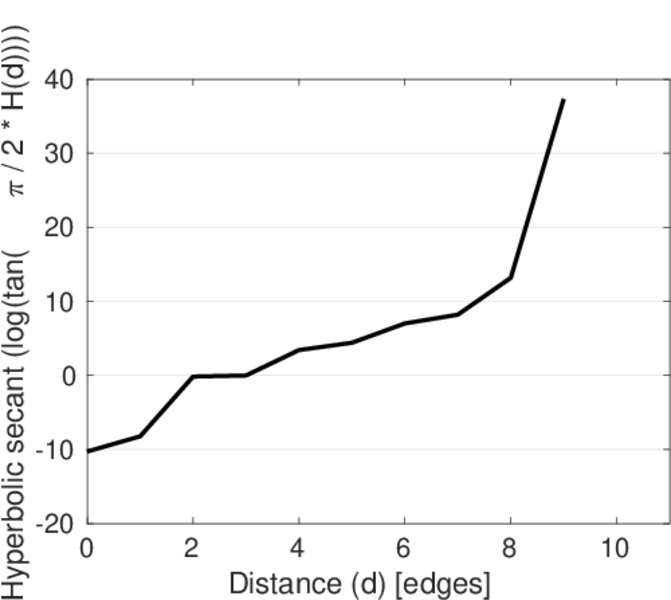
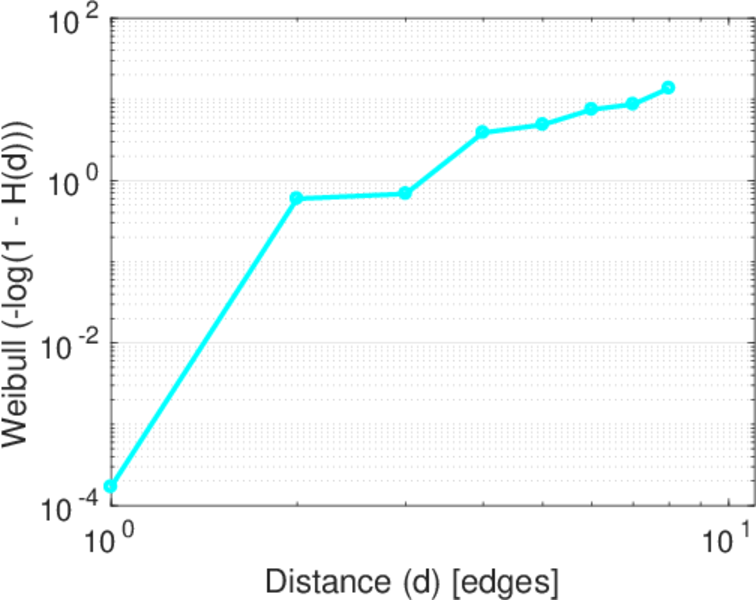
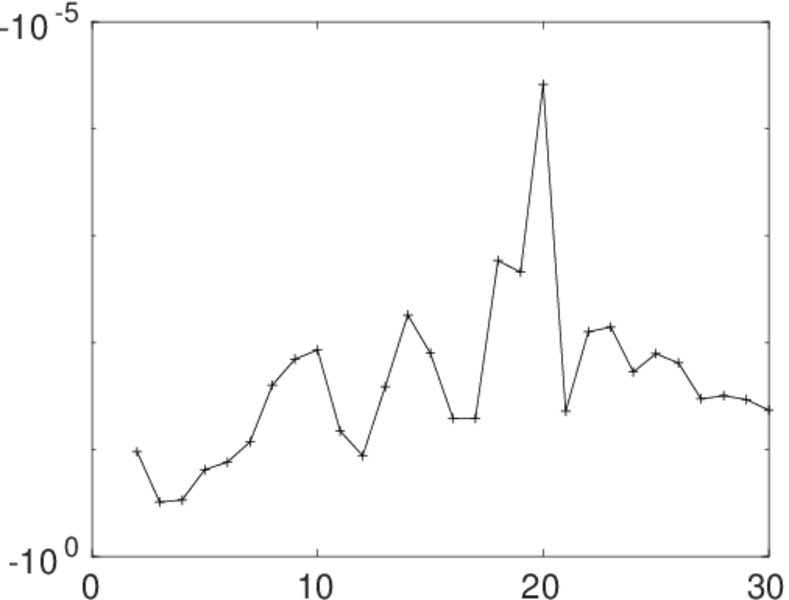
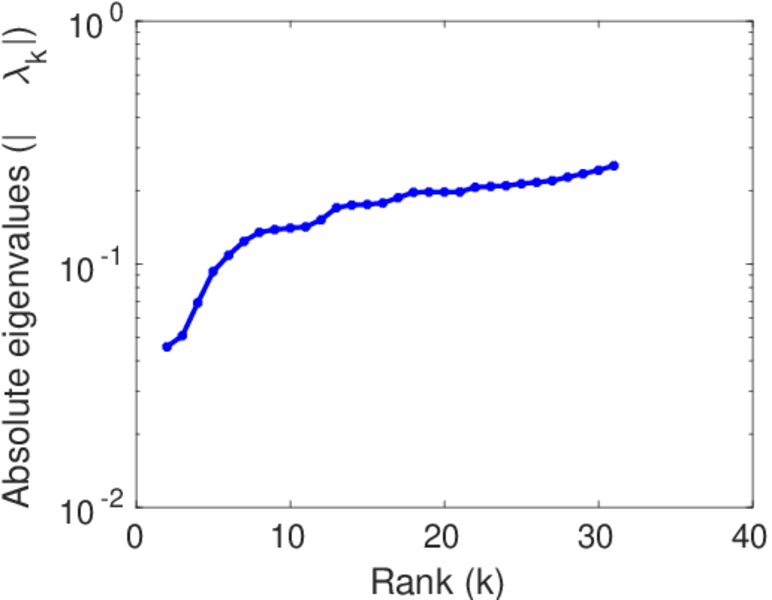
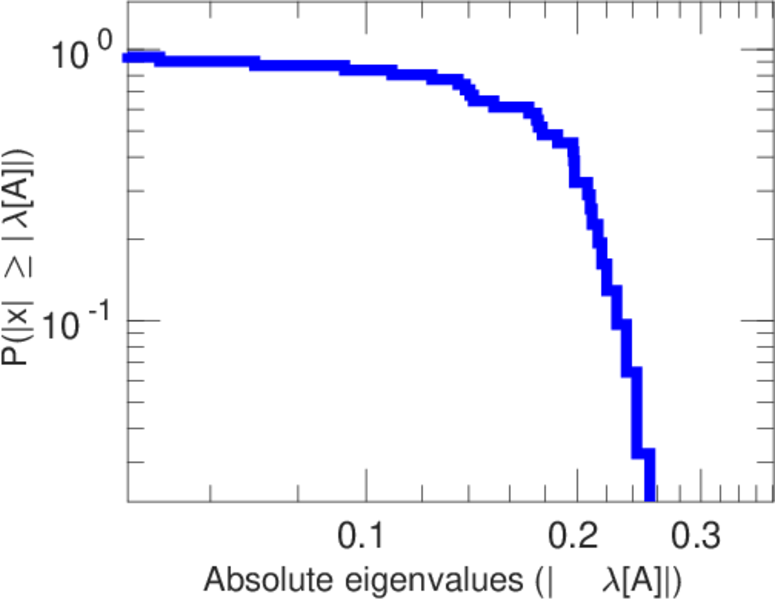
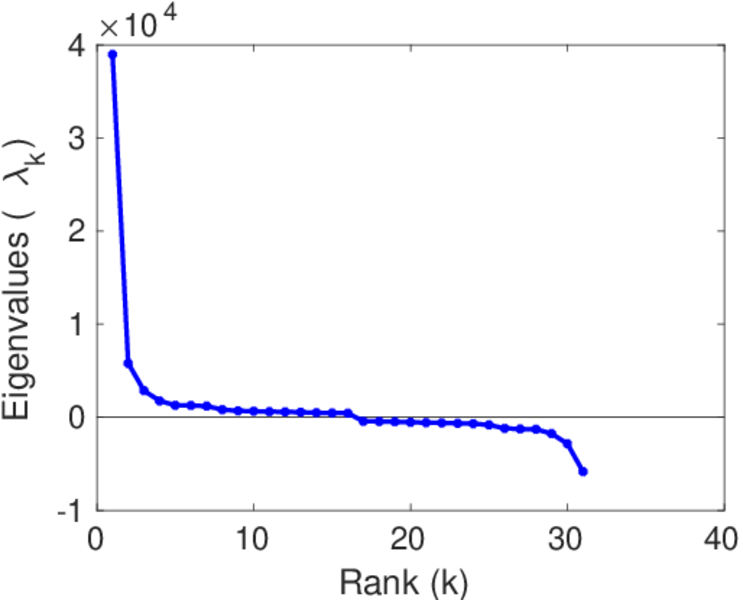
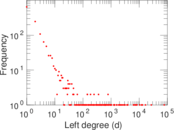
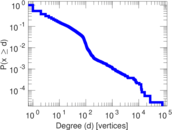
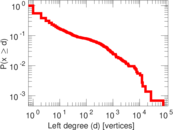
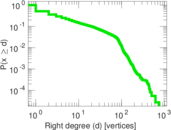
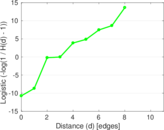
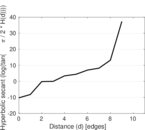
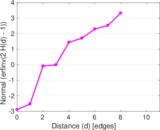
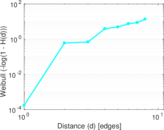
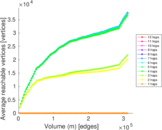
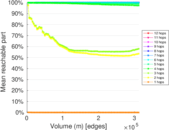
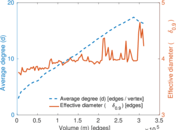
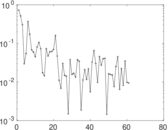
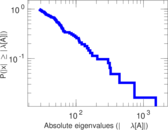
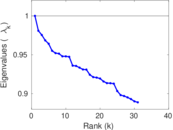
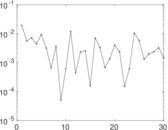
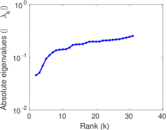
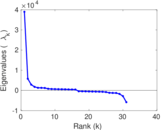
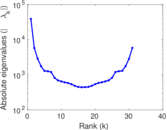
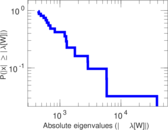
Plots


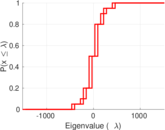
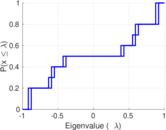

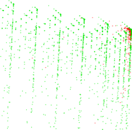
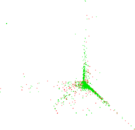
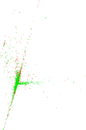


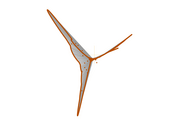
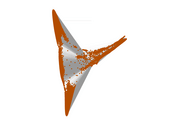


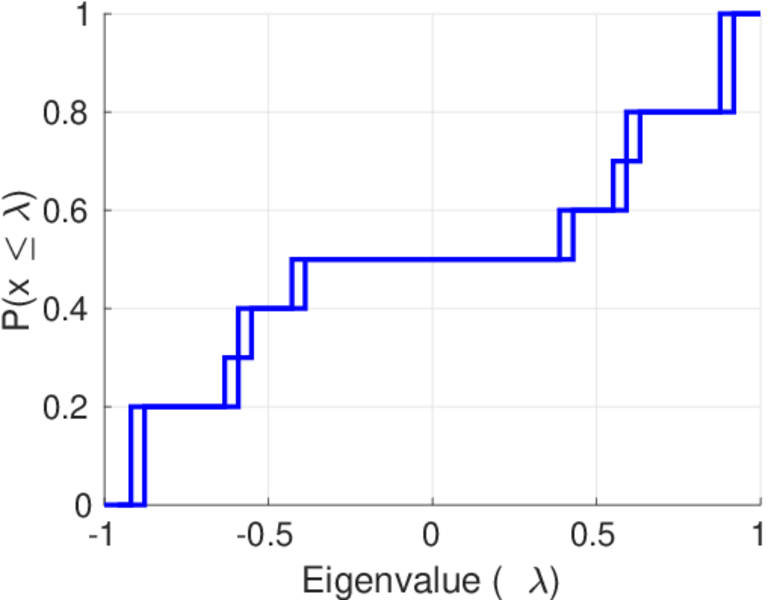
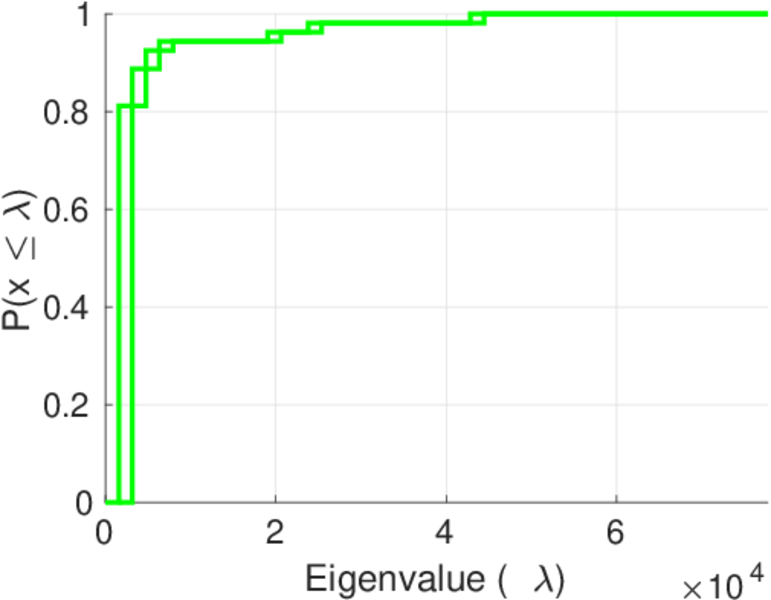
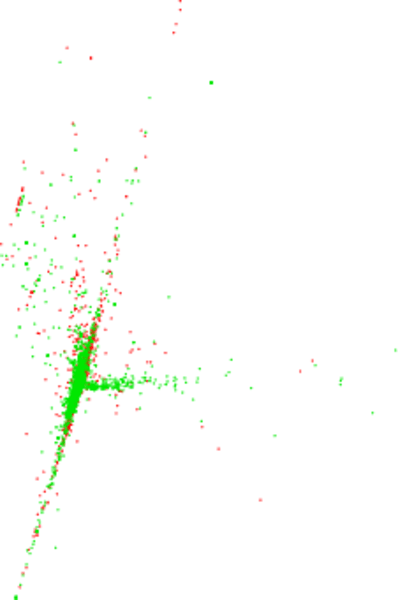
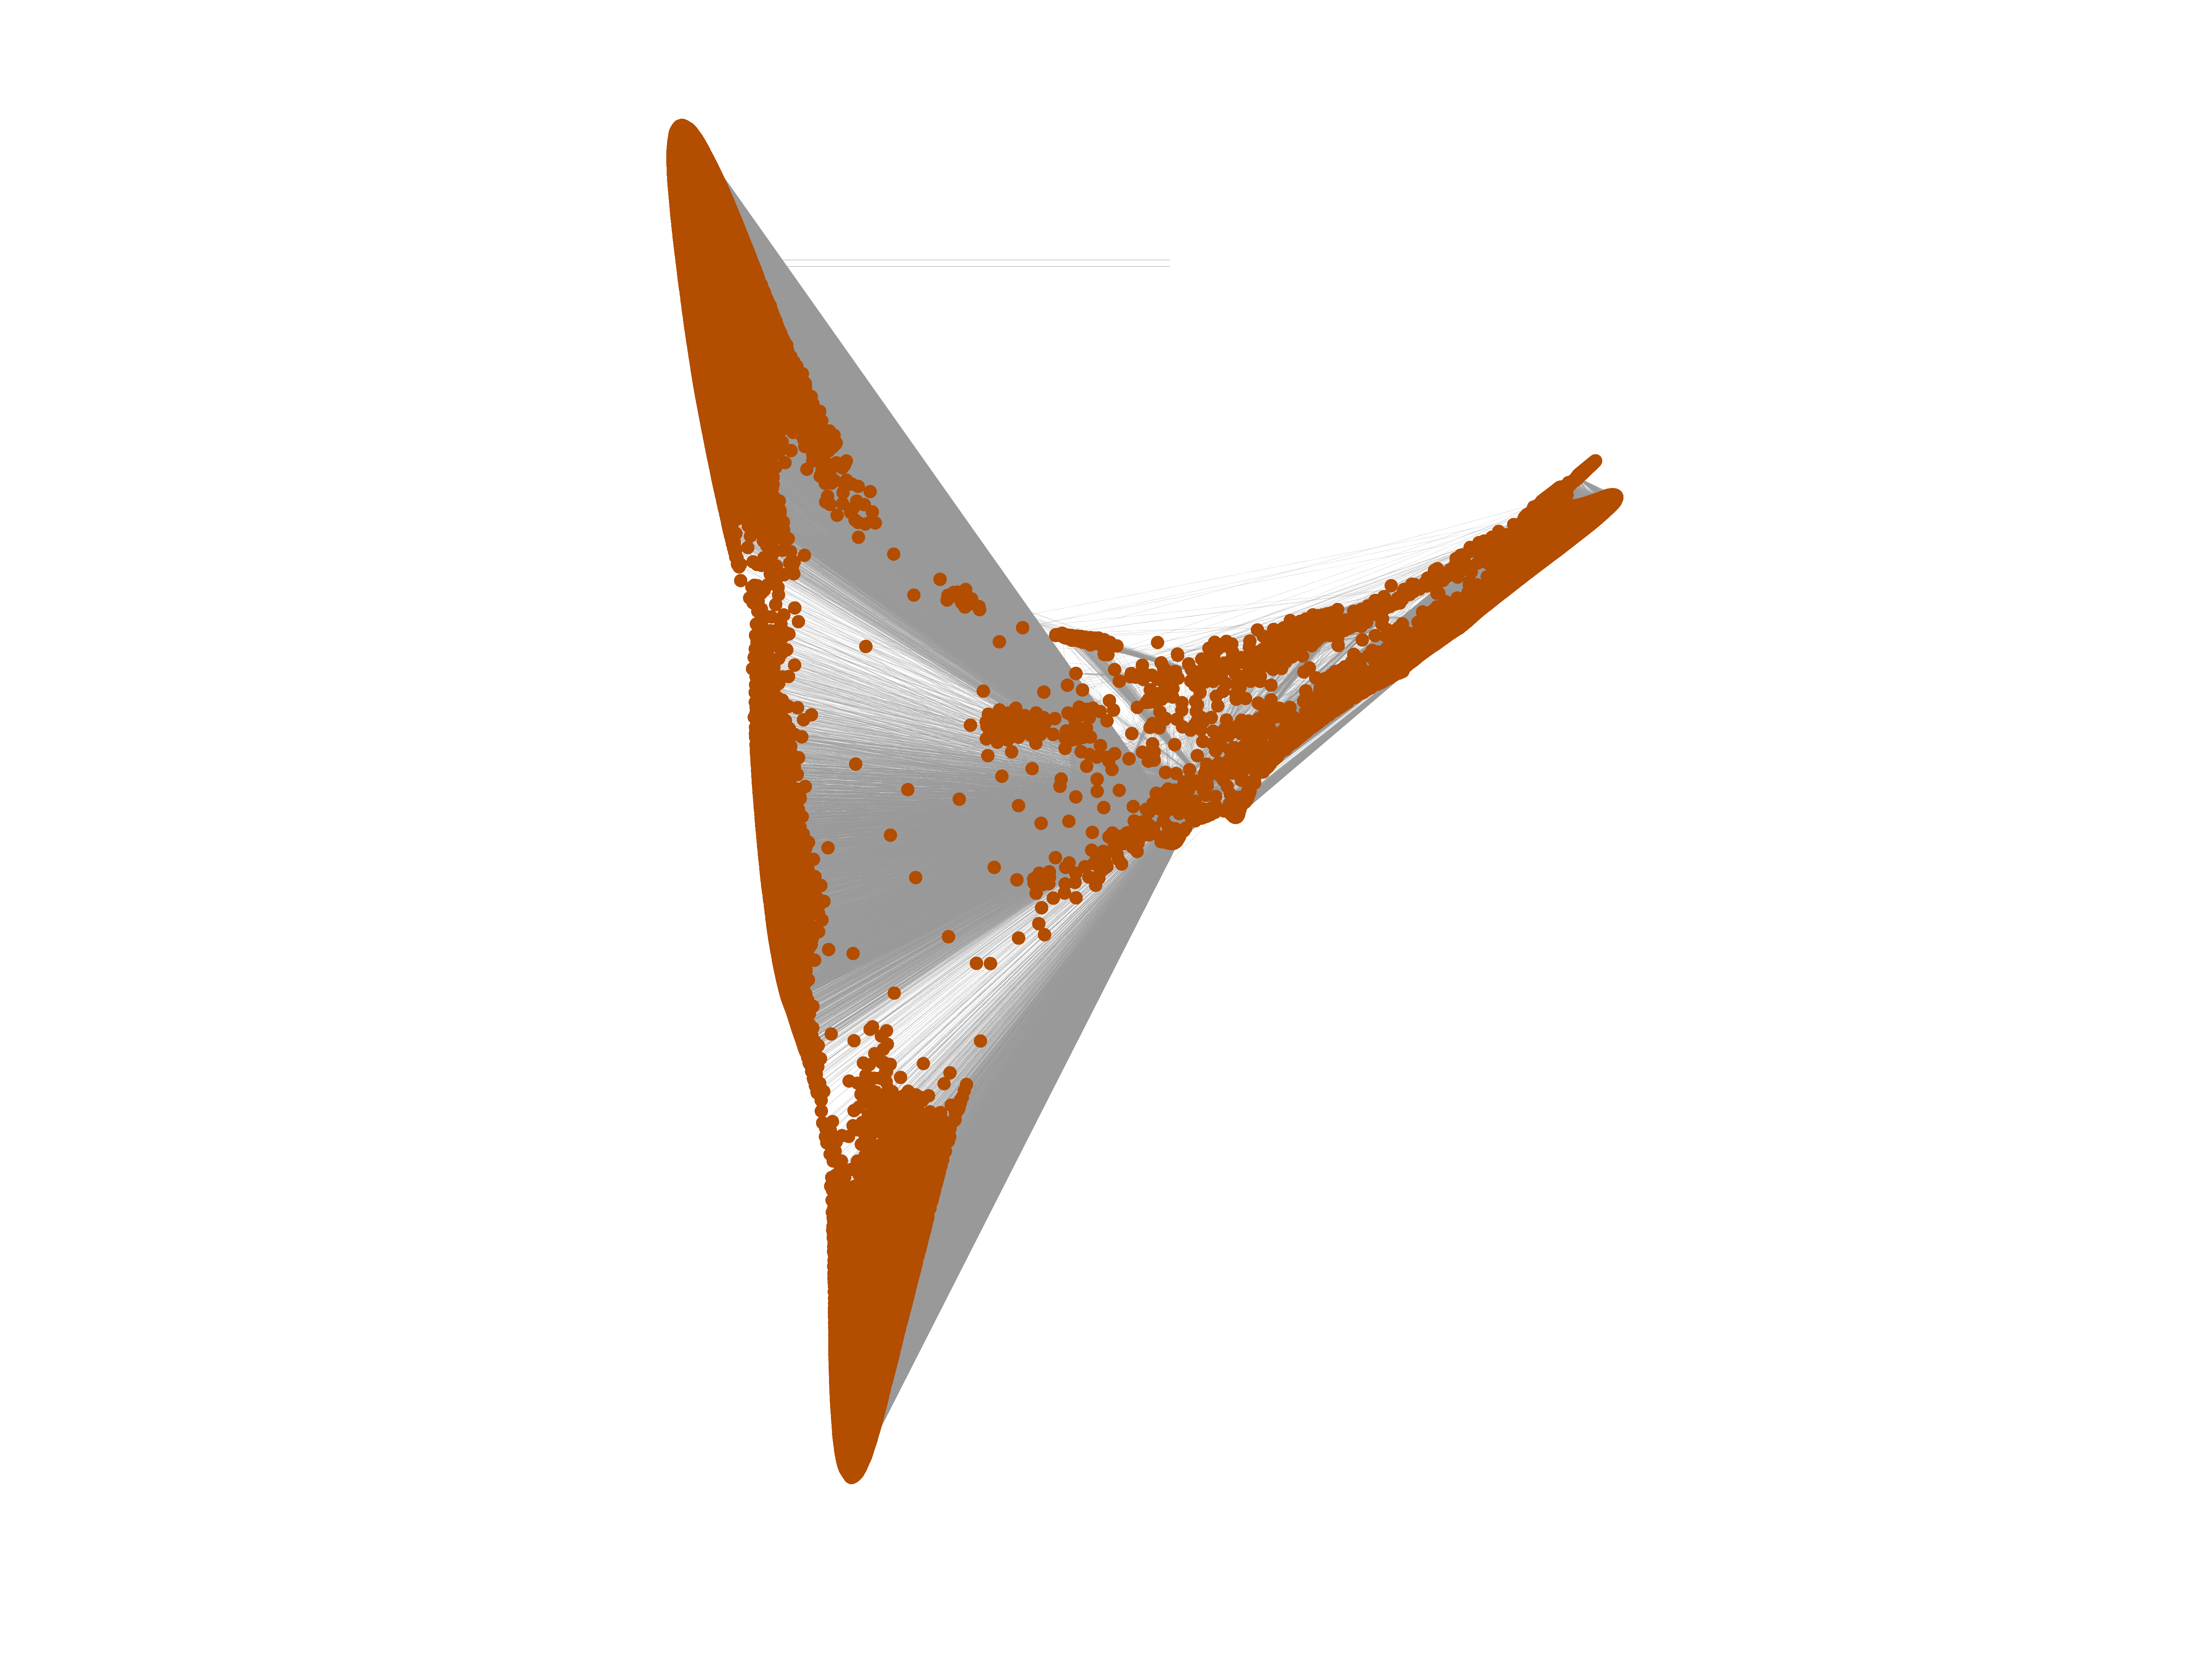
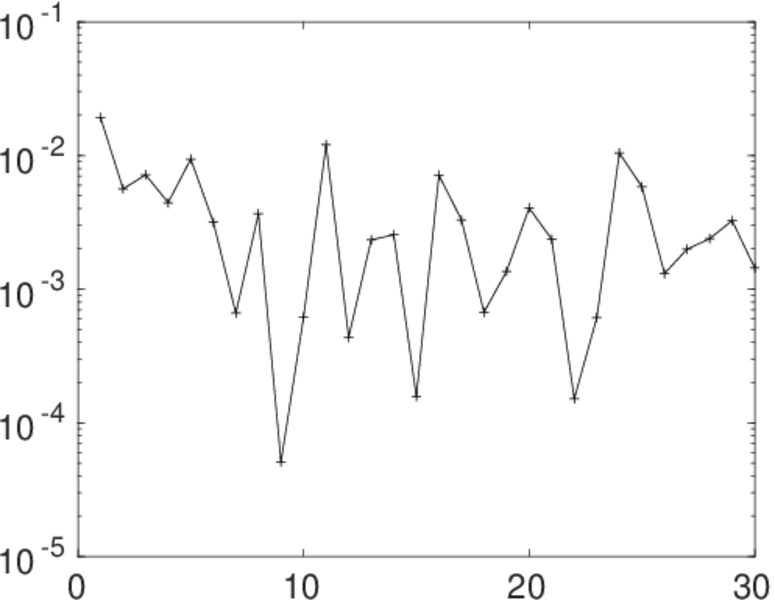
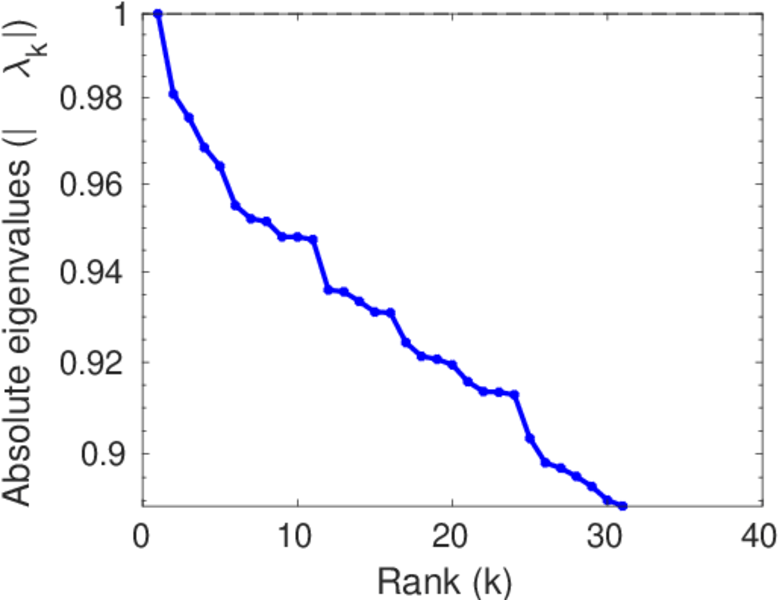
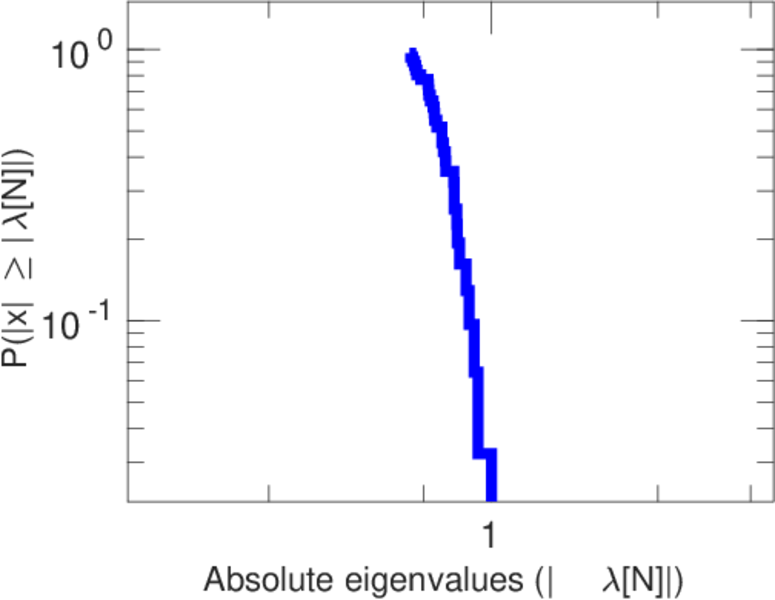
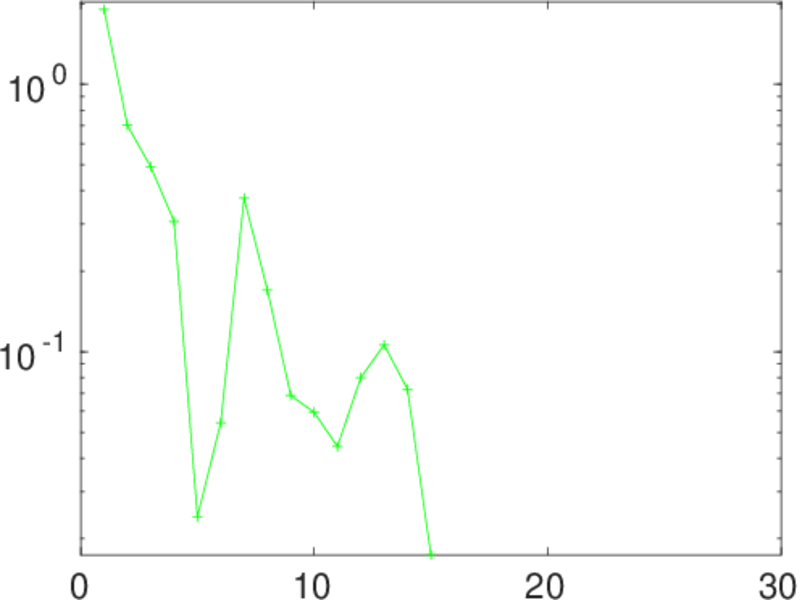
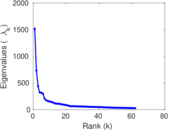
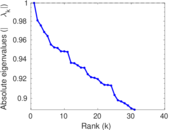
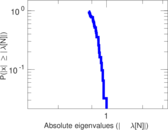
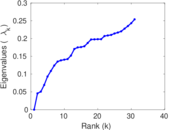
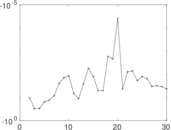
Matrix decompositions plots


Downloads
References
|
[1]
|
Jérôme Kunegis.
KONECT – The Koblenz Network Collection.
In Proc. Int. Conf. on World Wide Web Companion, pages
1343–1350, 2013.
[ http ]
|
|
[2]
|
Wikimedia Foundation.
Wikimedia downloads.
http://dumps.wikimedia.org/, January 2010.
|
 KONECT ‣ Networks ‣
Buy Me a Coffee
KONECT ‣ Networks ‣
Buy Me a Coffee