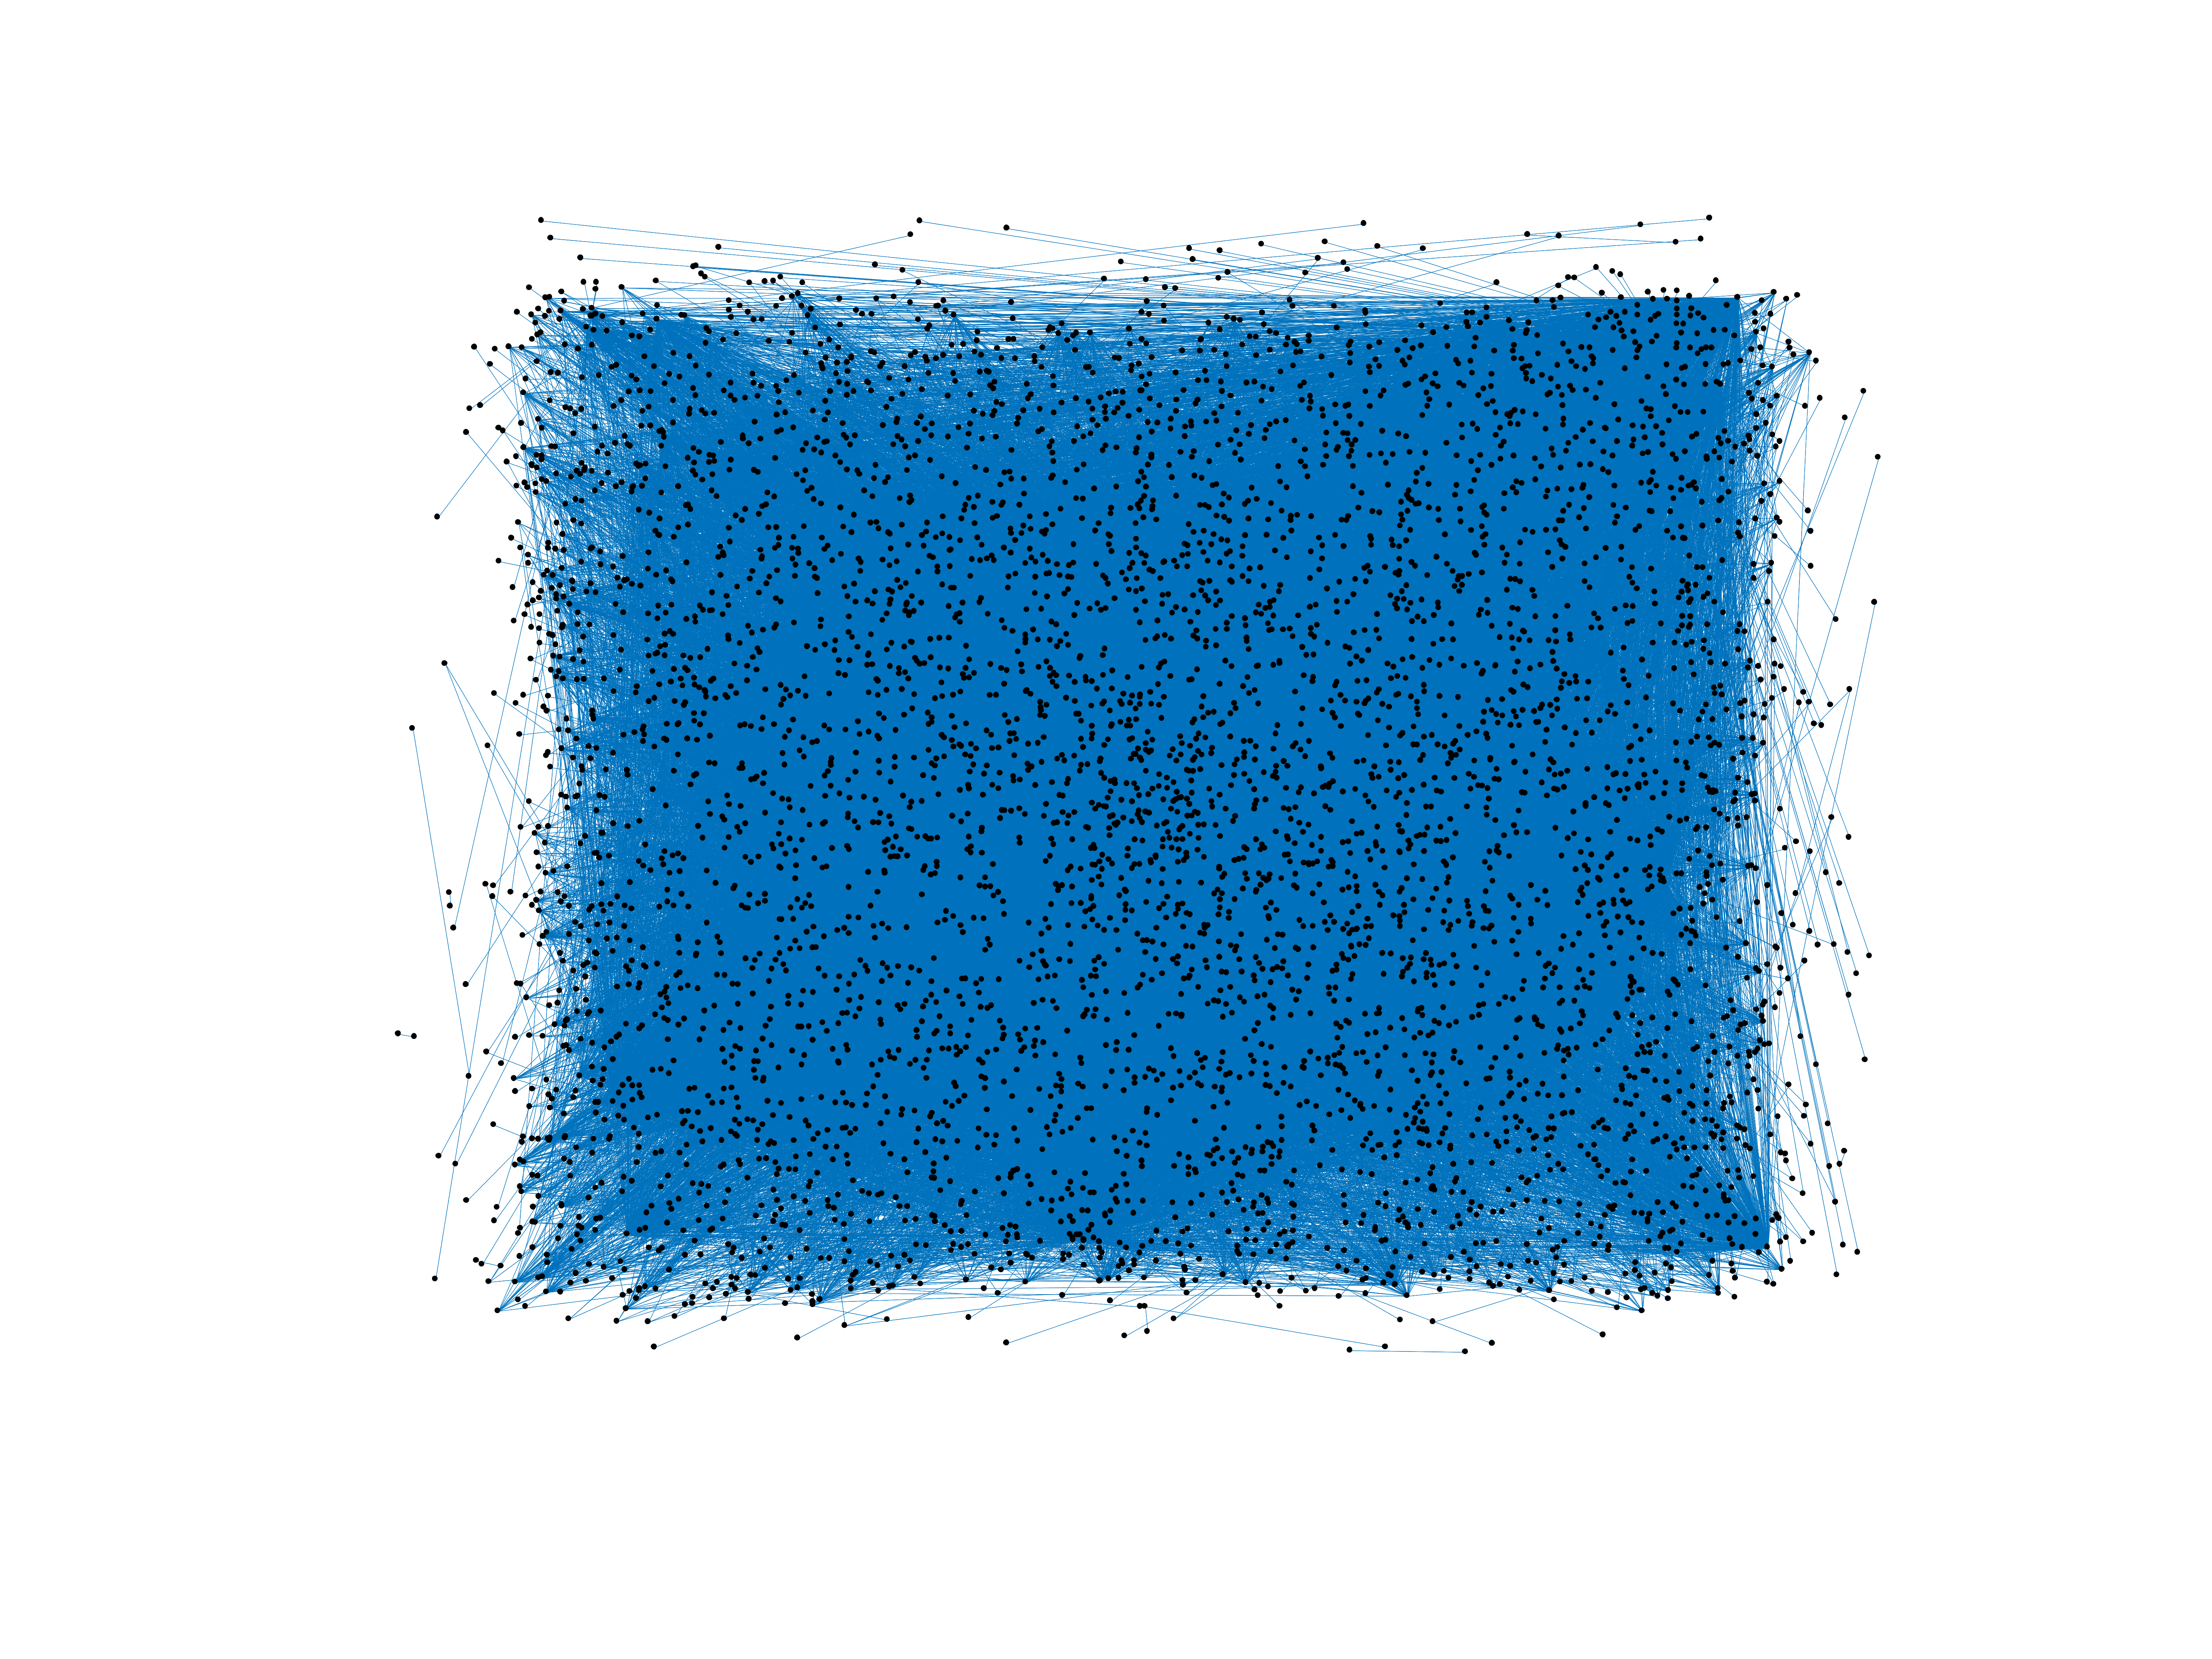
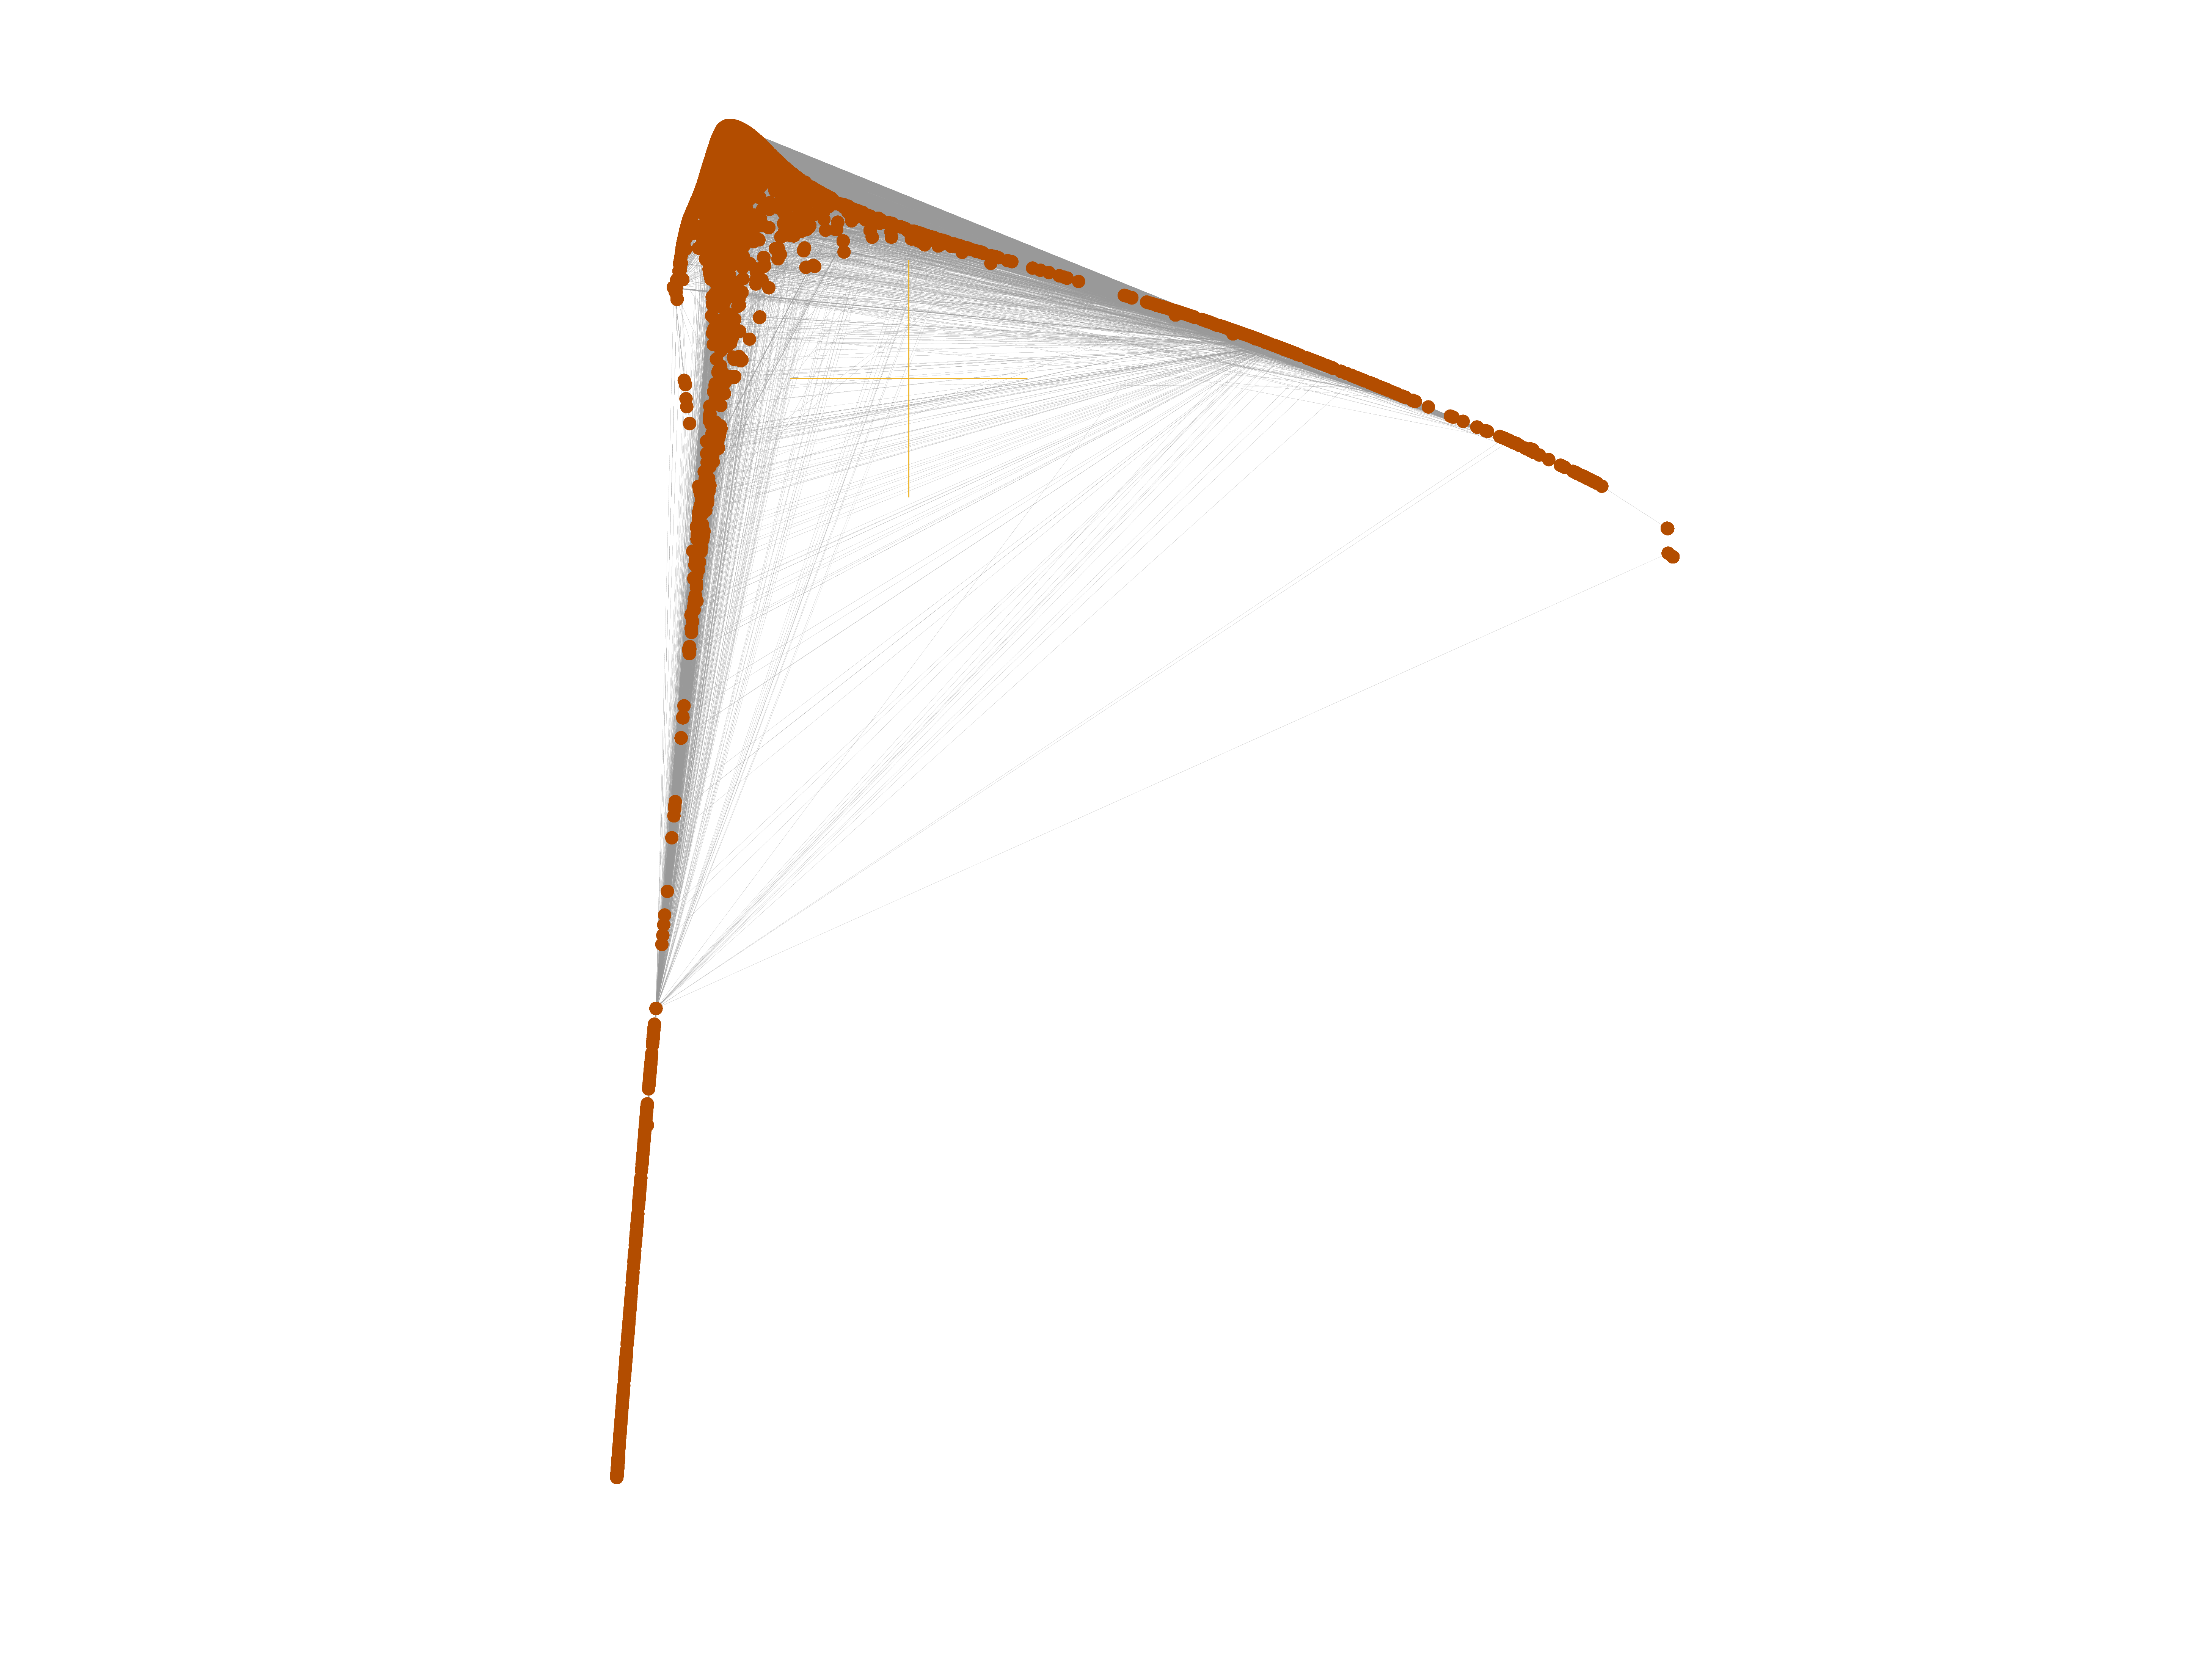
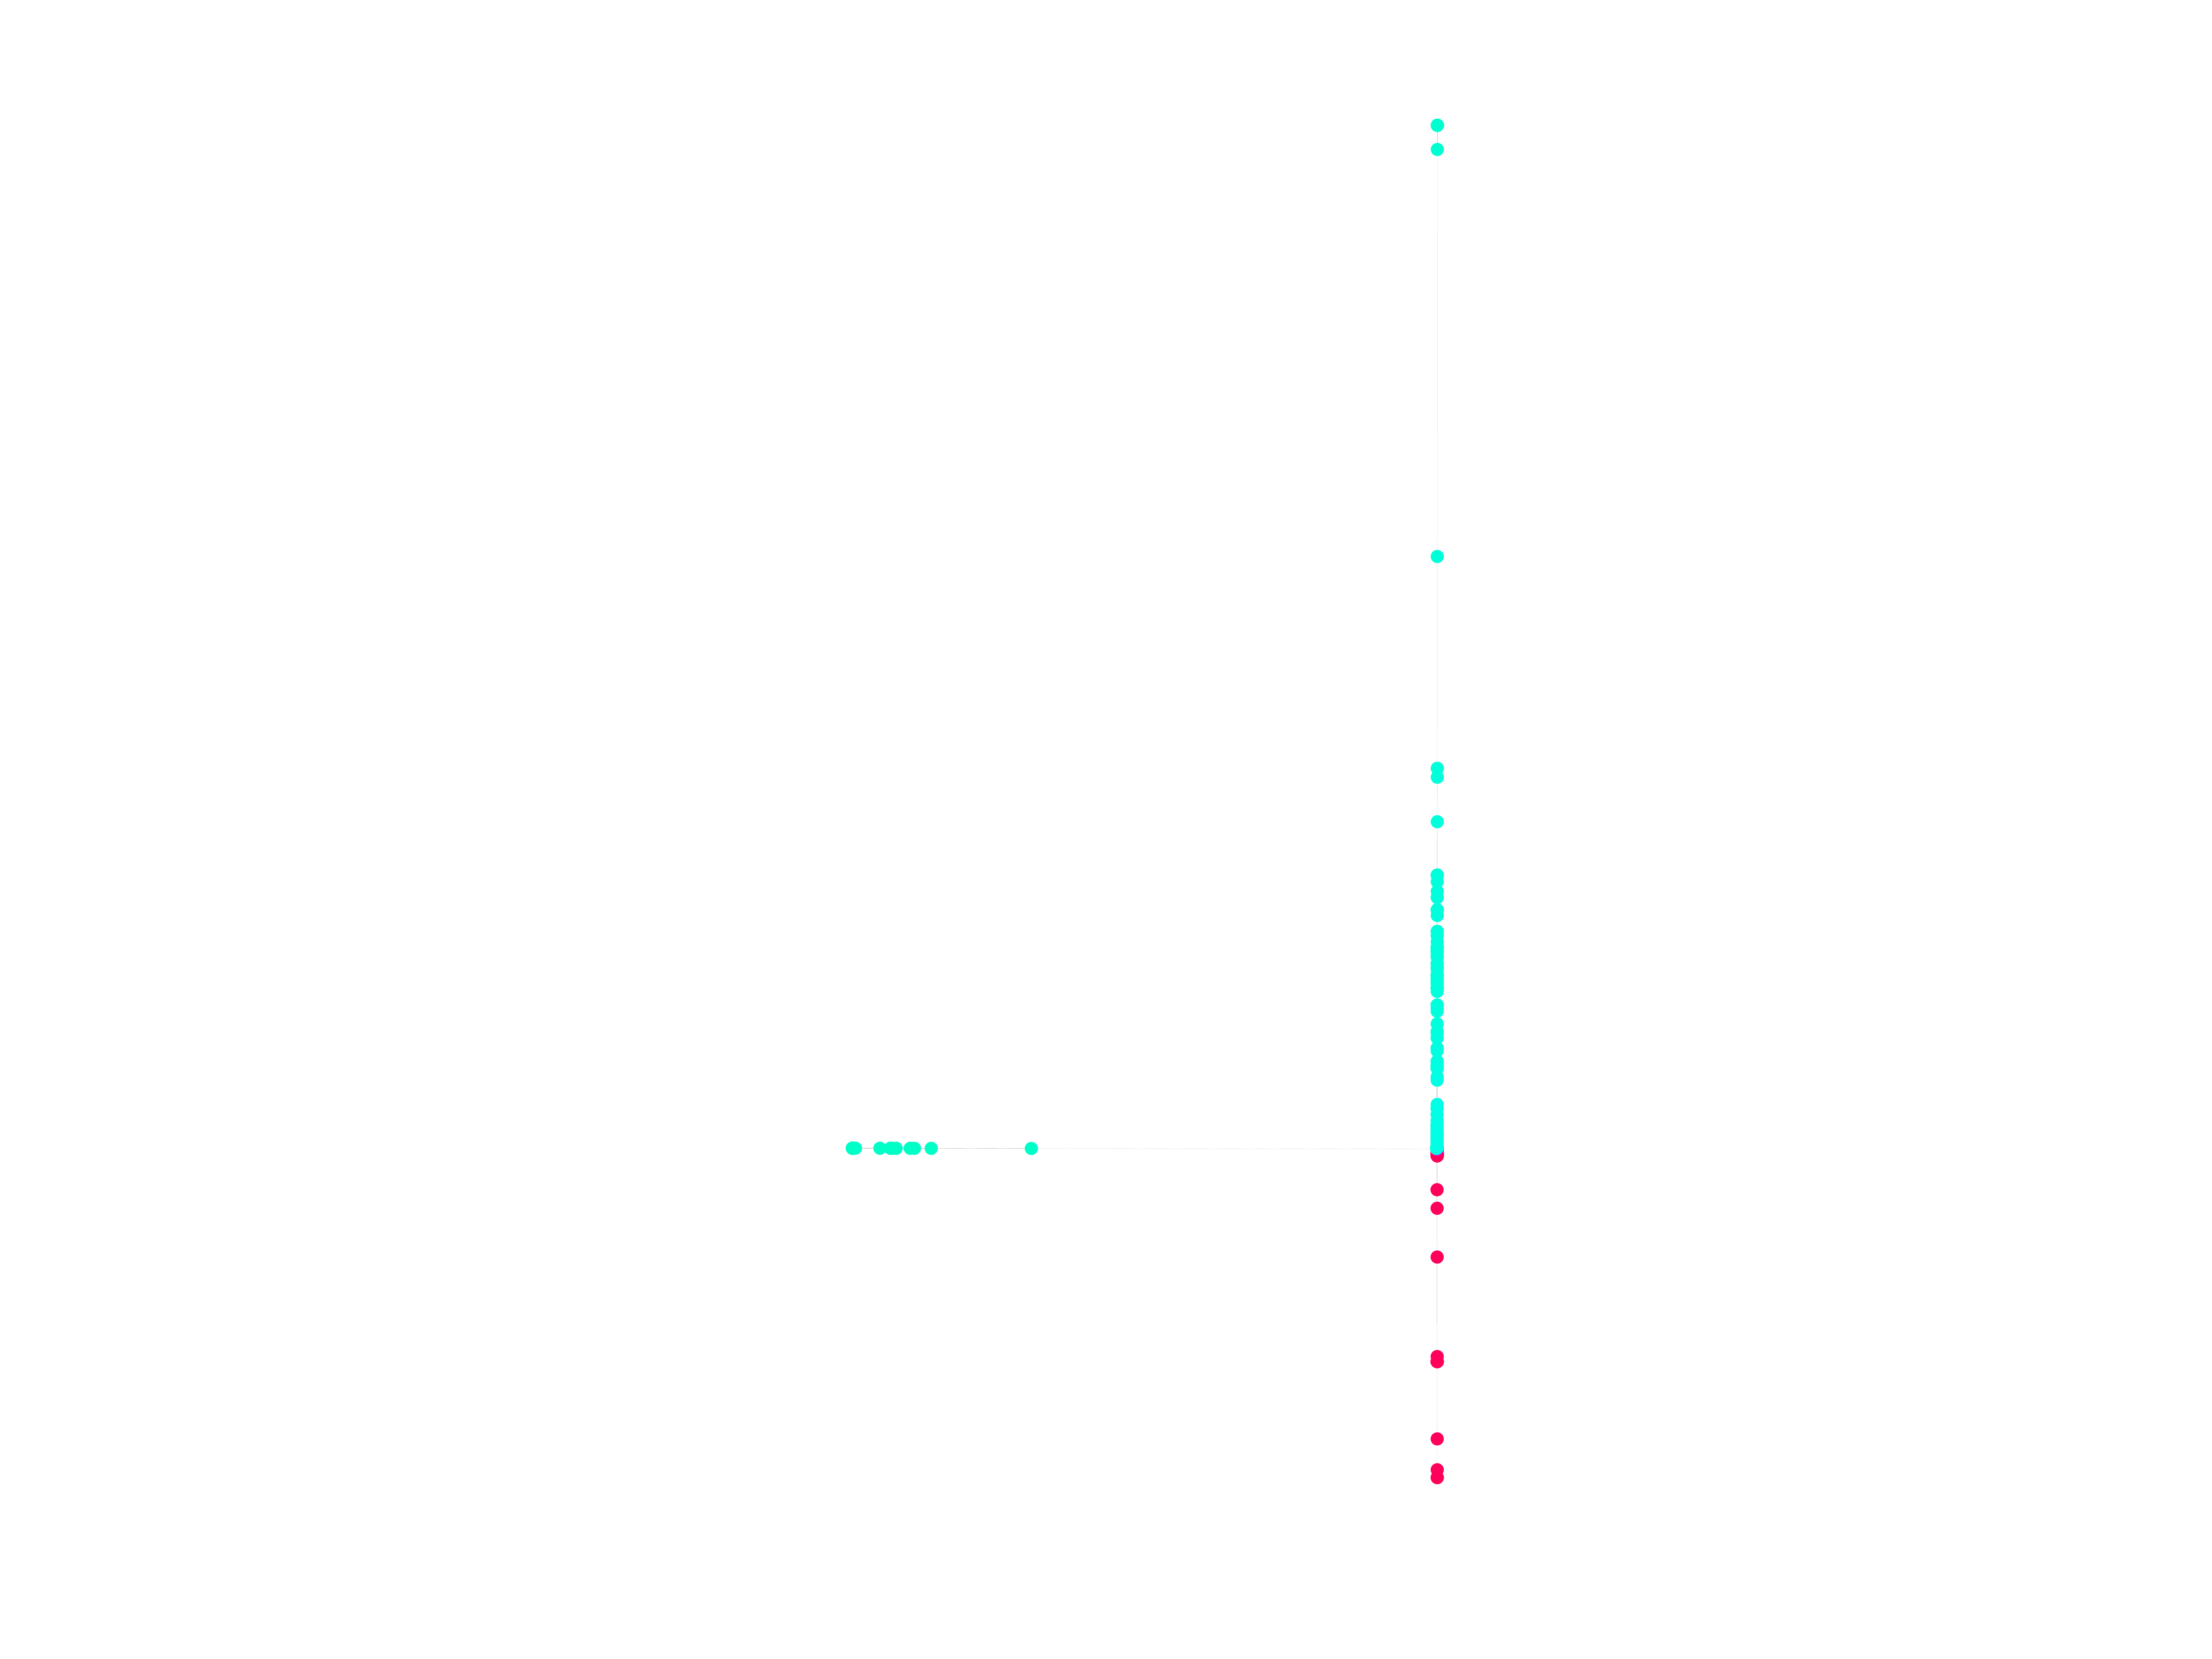
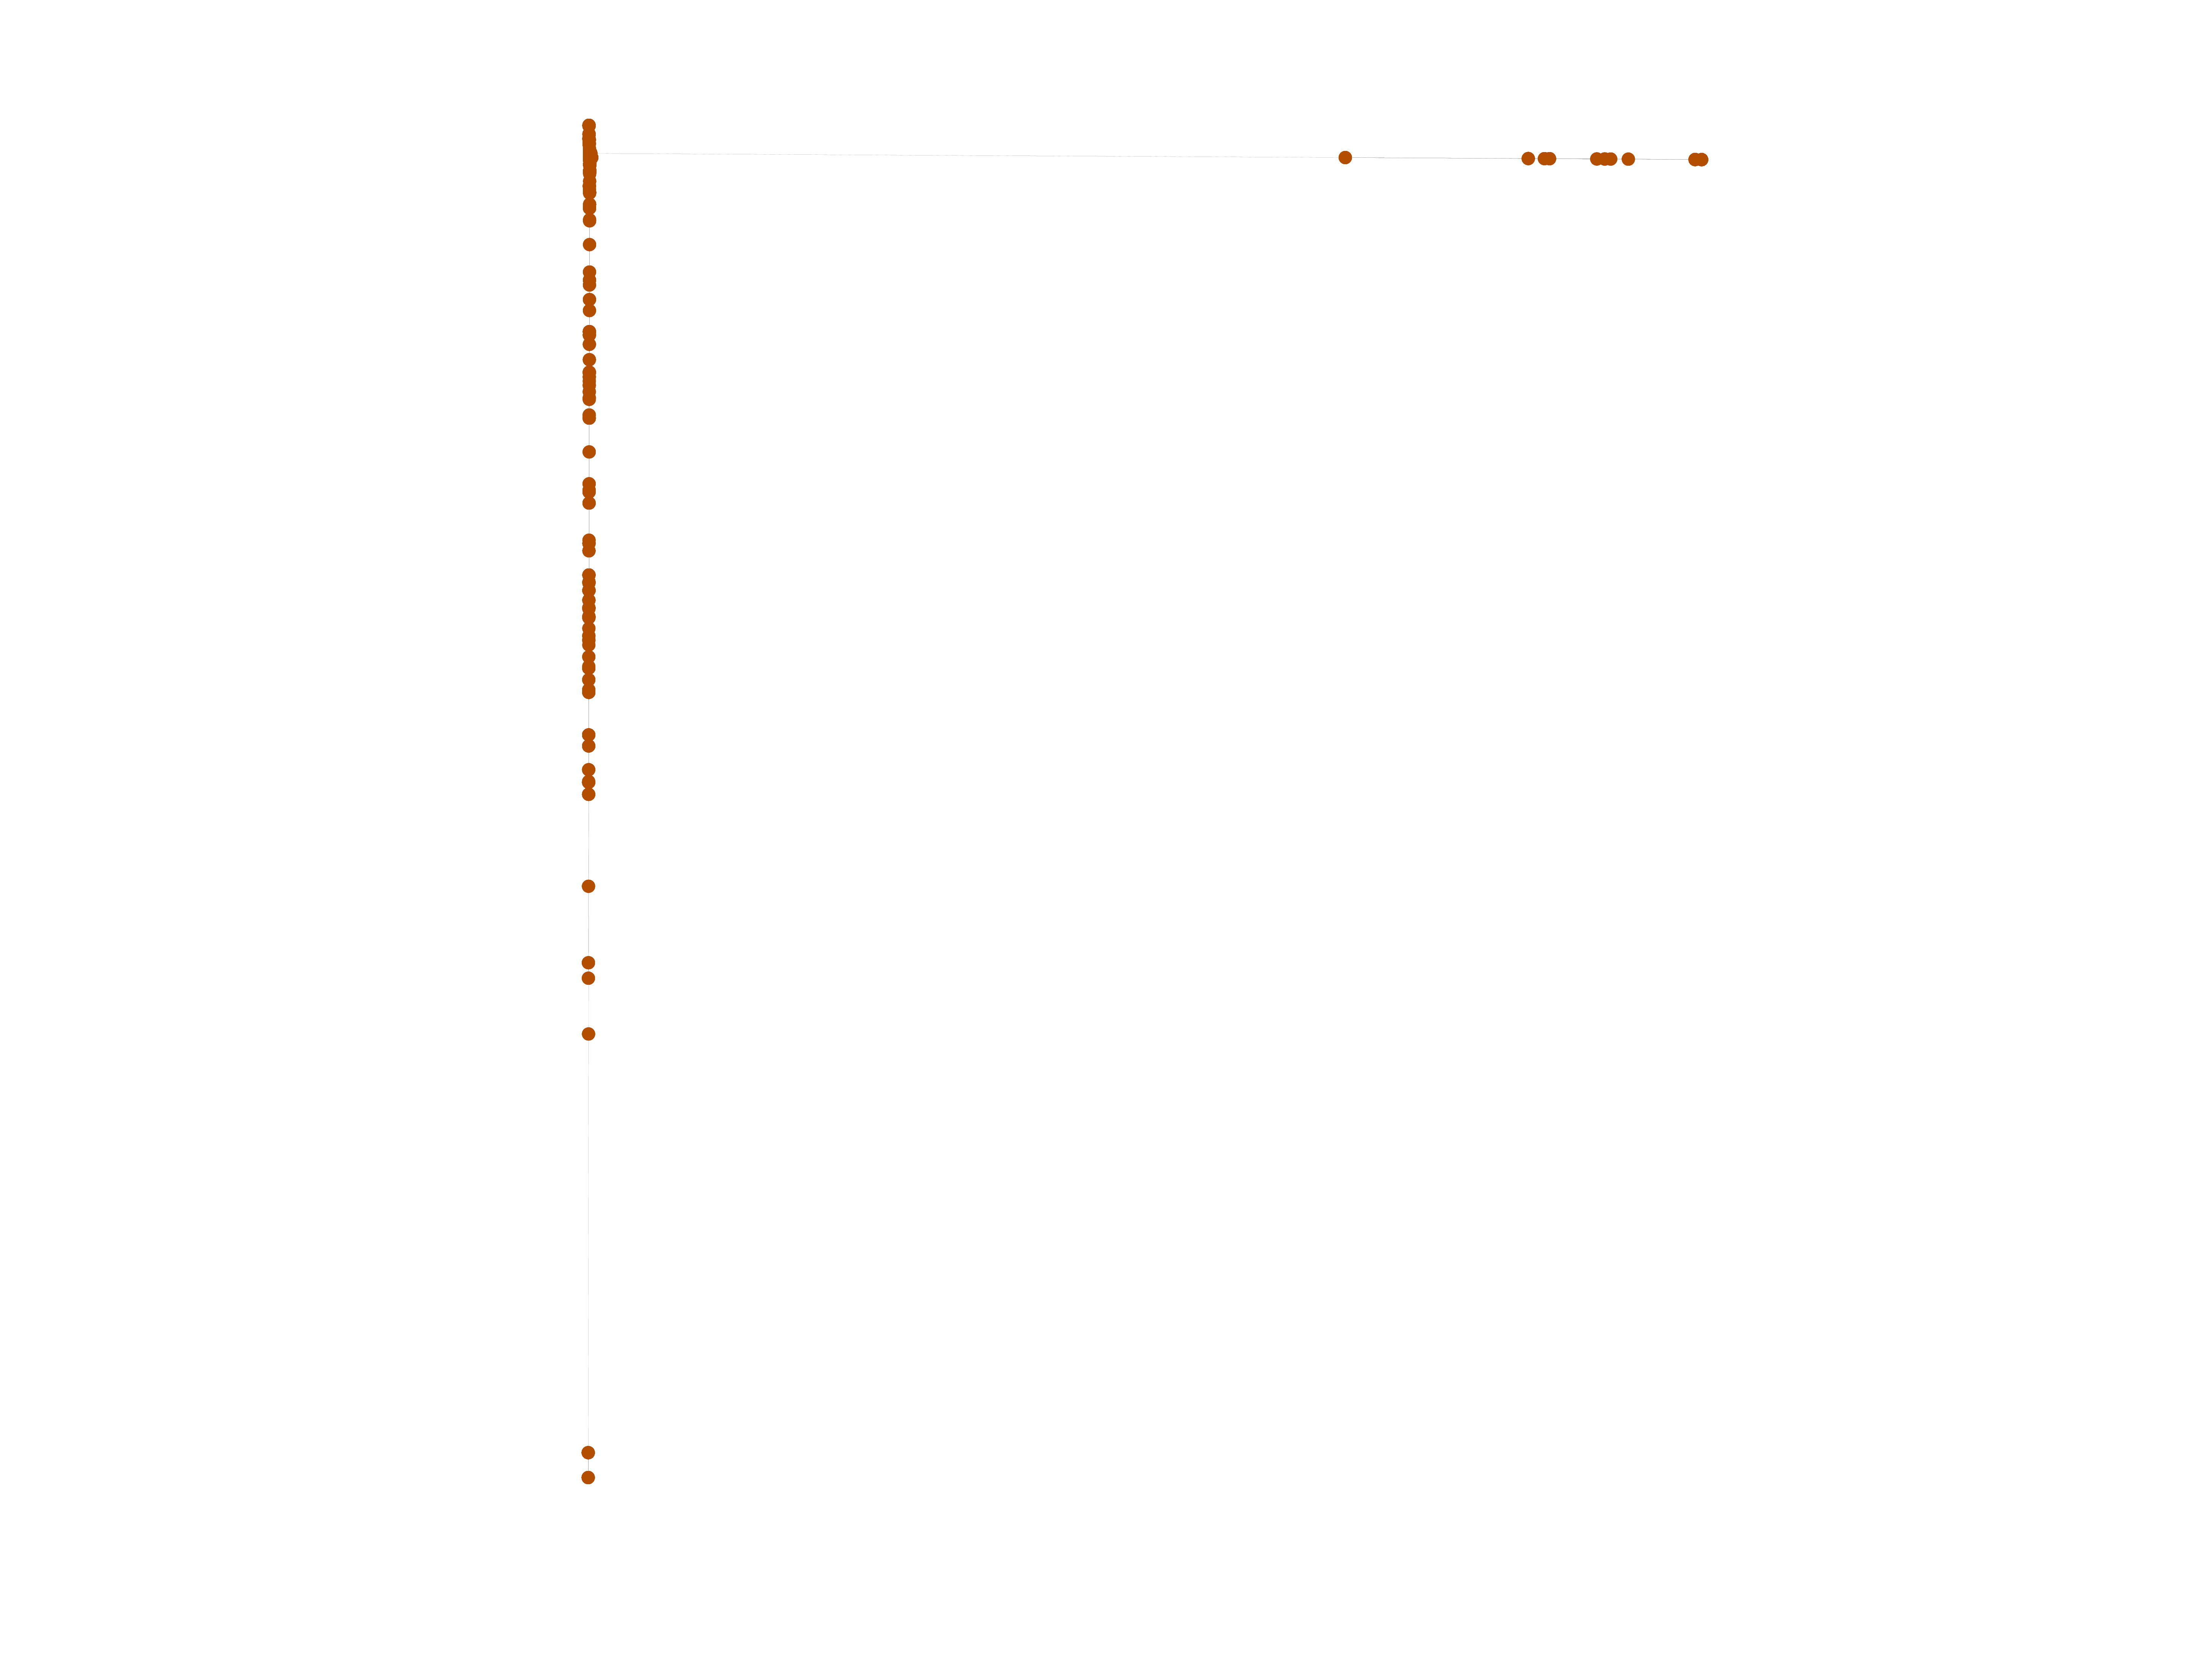
Wikipedia edits (wo)
This is the bipartite edit network of the Wolof Wikipedia. It contains users
and pages from the Wolof Wikipedia, connected by edit events. Each edge
represents an edit. The dataset includes the timestamp of each edit.
Metadata
Statistics
| Size | n = | 5,292
|
| Left size | n1 = | 854
|
| Right size | n2 = | 4,438
|
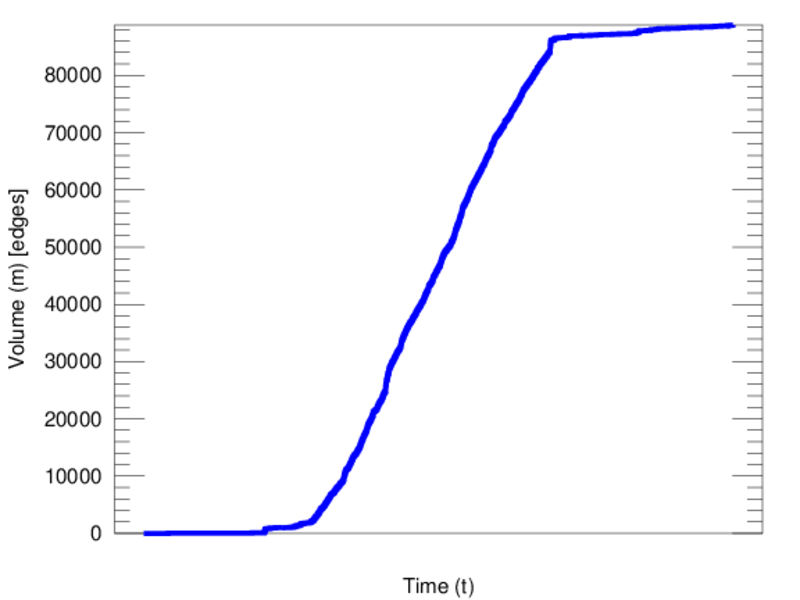
| Volume | m = | 88,797
|
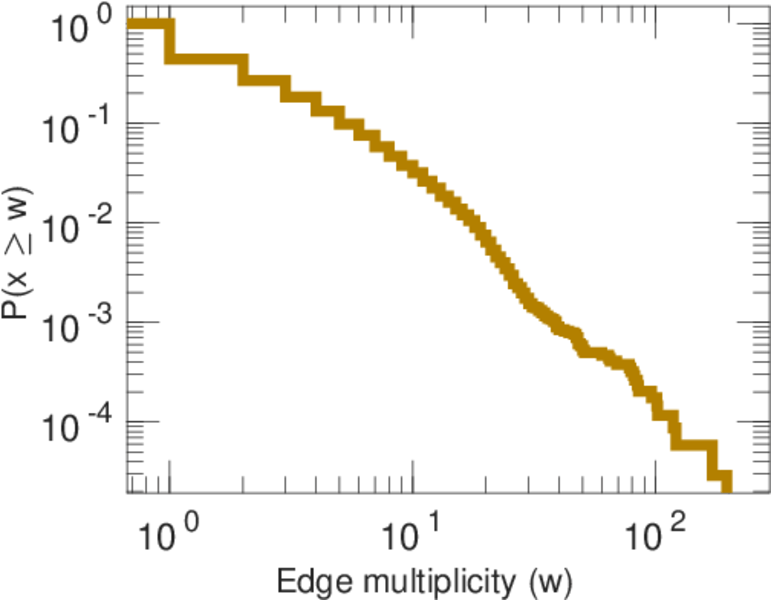
| Unique edge count | m̿ = | 34,311
|
| Wedge count | s = | 11,799,091
|
| Claw count | z = | 4,005,063,919
|
| Cross count | x = | 1,253,096,003,523
|
| Square count | q = | 51,614,150
|
| 4-Tour count | T4 = | 460,206,662
|
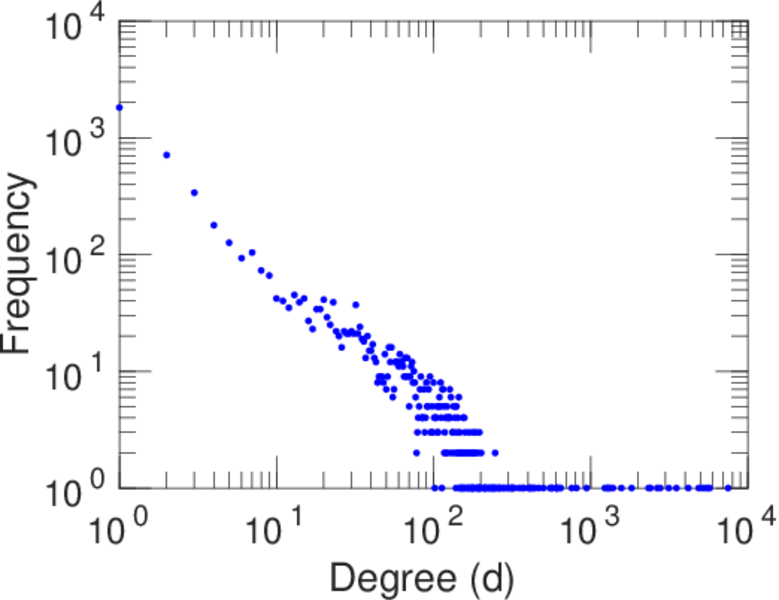
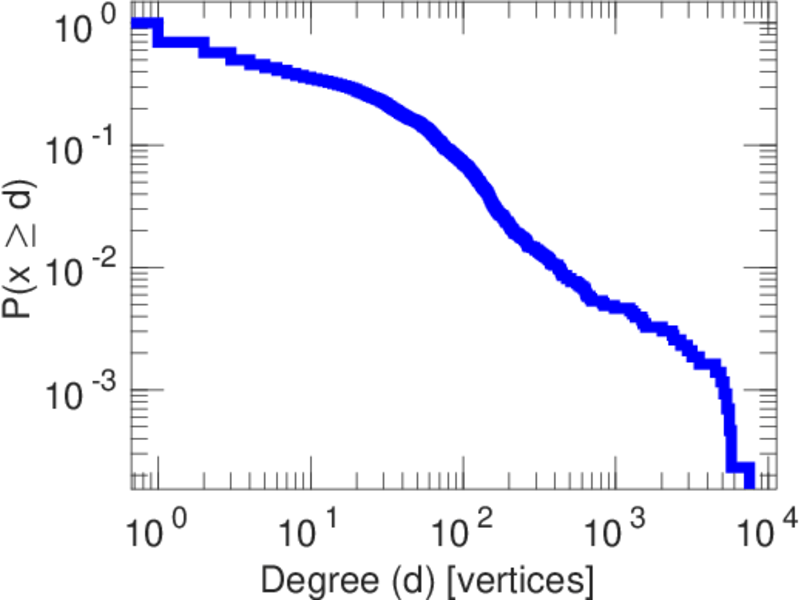
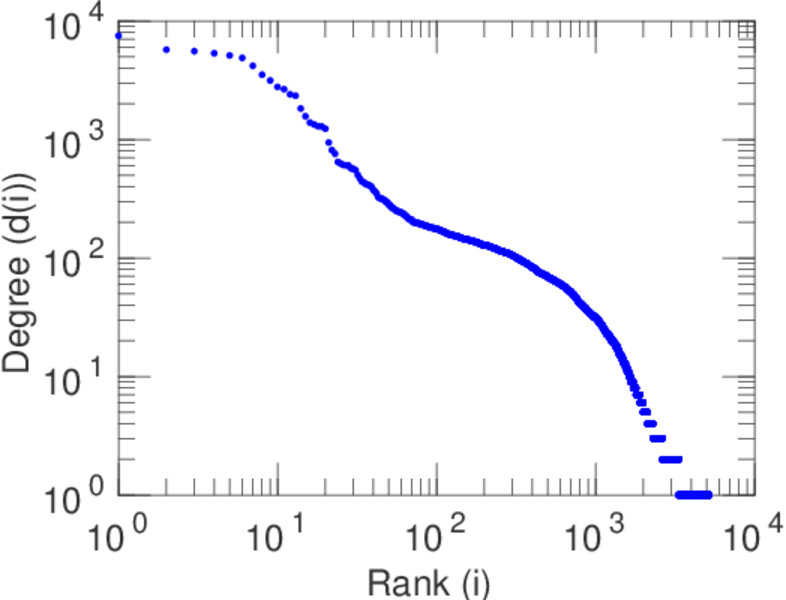
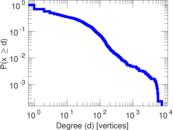
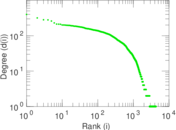
| Maximum degree | dmax = | 7,513
|
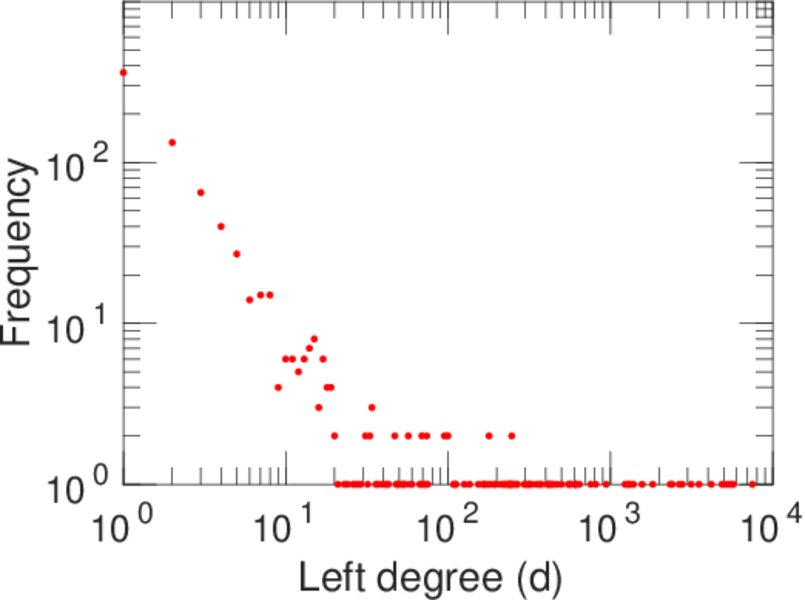
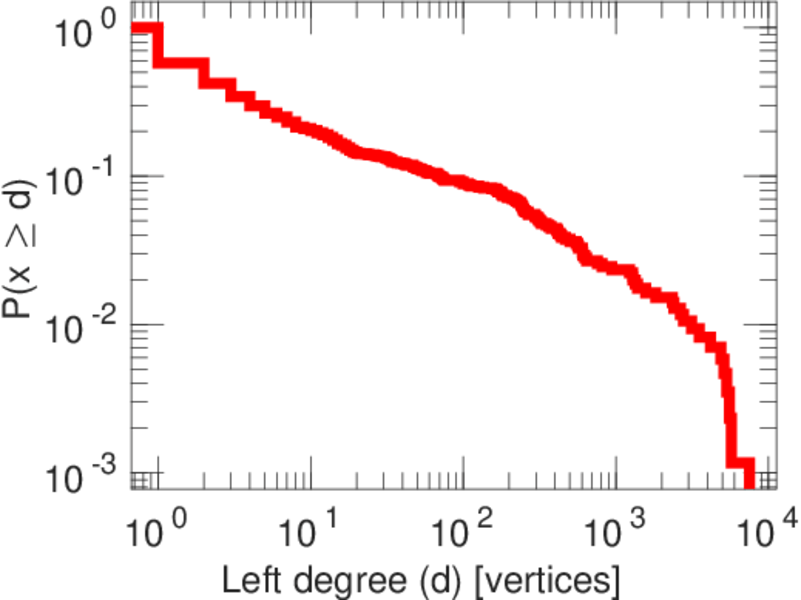
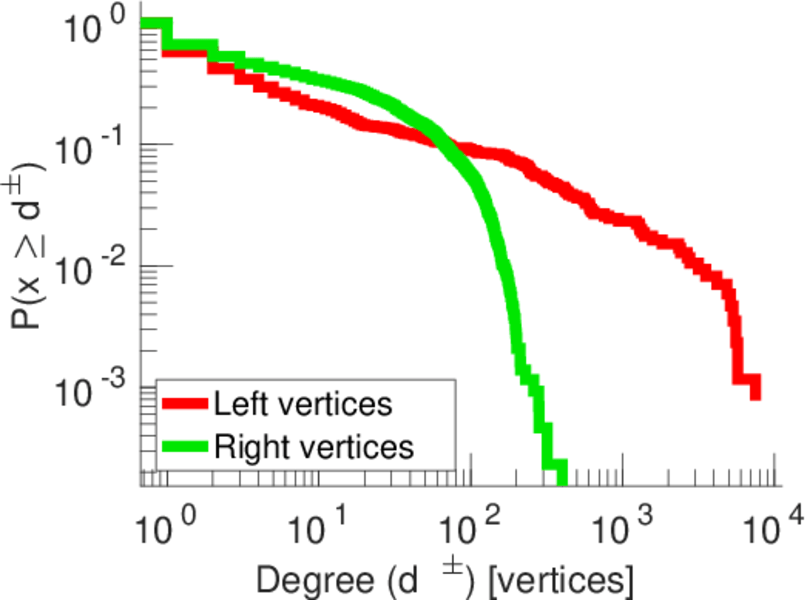
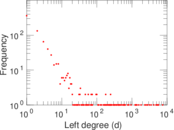
| Maximum left degree | d1max = | 7,513
|
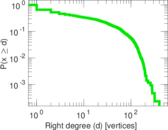
| Maximum right degree | d2max = | 400
|
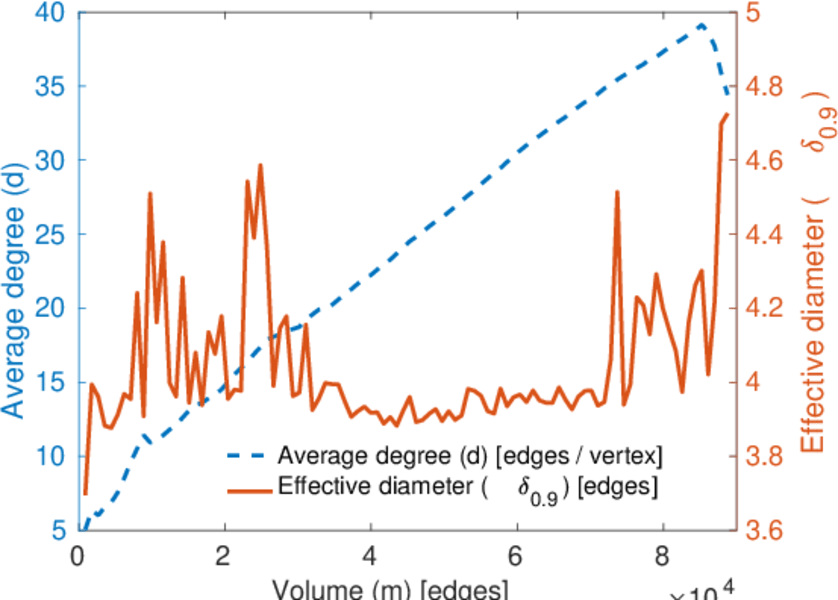
| Average degree | d = | 33.559 0
|
| Average left degree | d1 = | 103.978
|
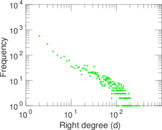
| Average right degree | d2 = | 20.008 3
|
| Fill | p = | 0.009 052 91
|
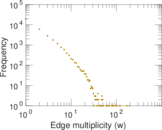
| Average edge multiplicity | m̃ = | 2.588 00
|
| Size of LCC | N = | 4,684
|
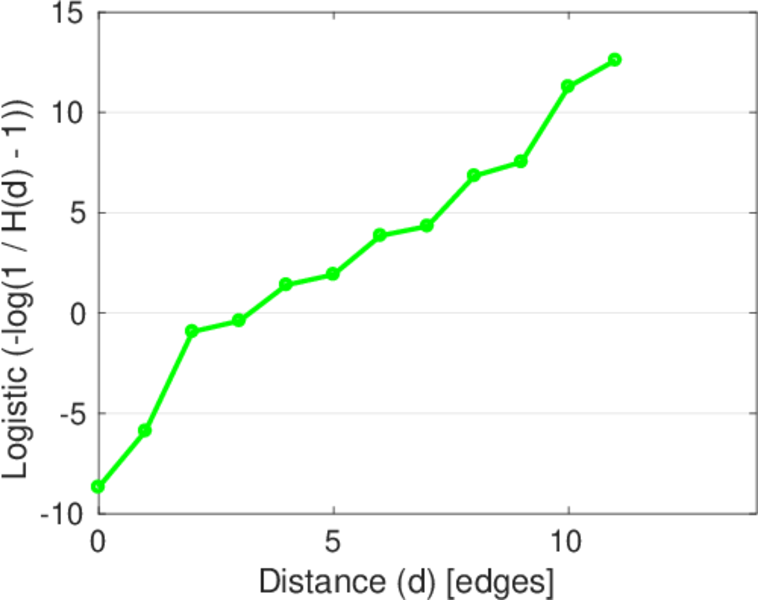
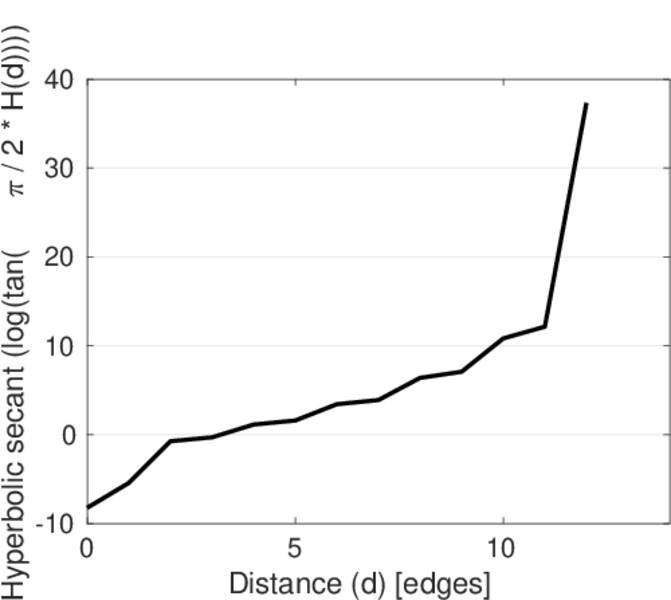
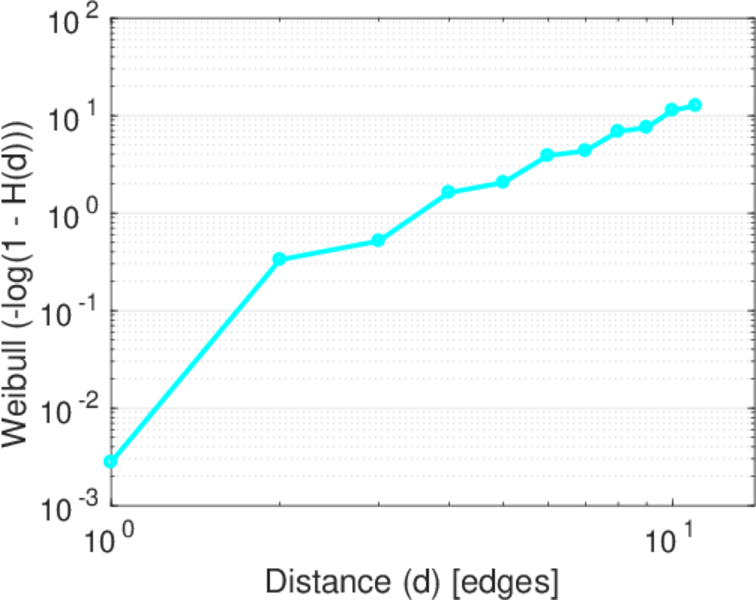
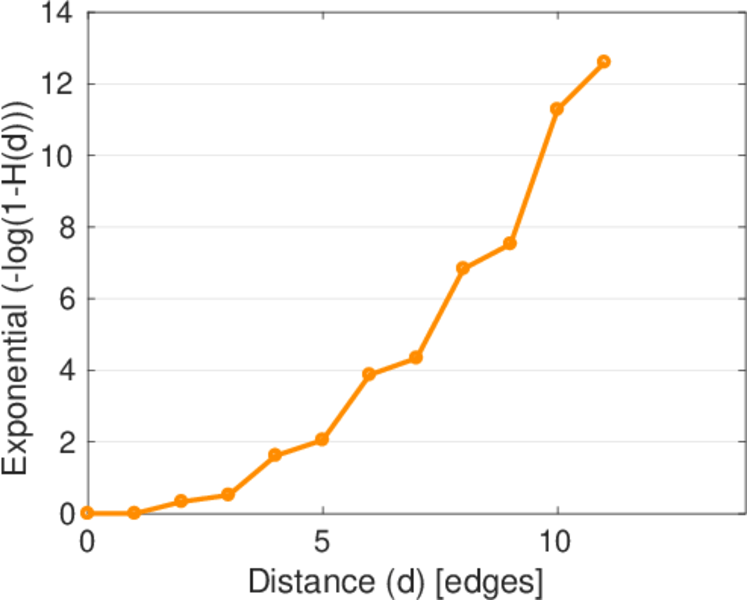
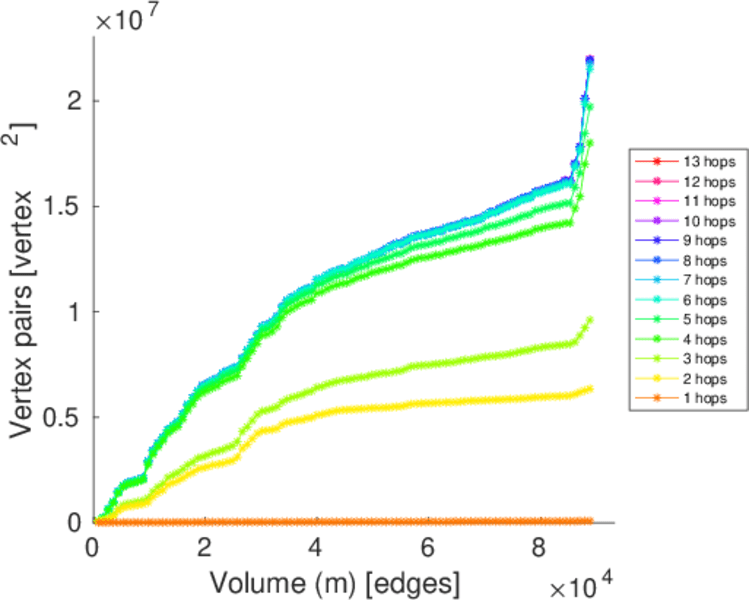
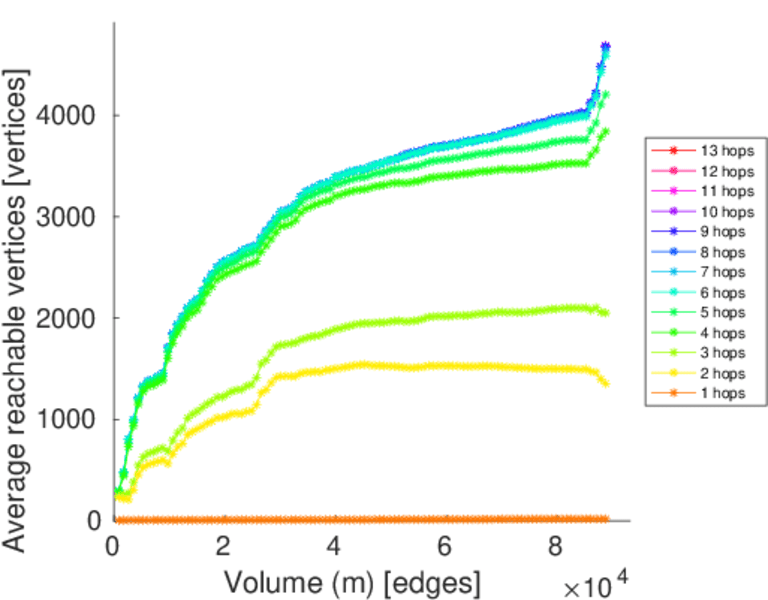
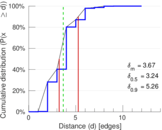
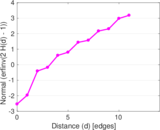
| Diameter | δ = | 13
|
| 50-Percentile effective diameter | δ0.5 = | 3.242 92
|
| 90-Percentile effective diameter | δ0.9 = | 5.264 06
|
| Median distance | δM = | 4
|
| Mean distance | δm = | 3.673 83
|
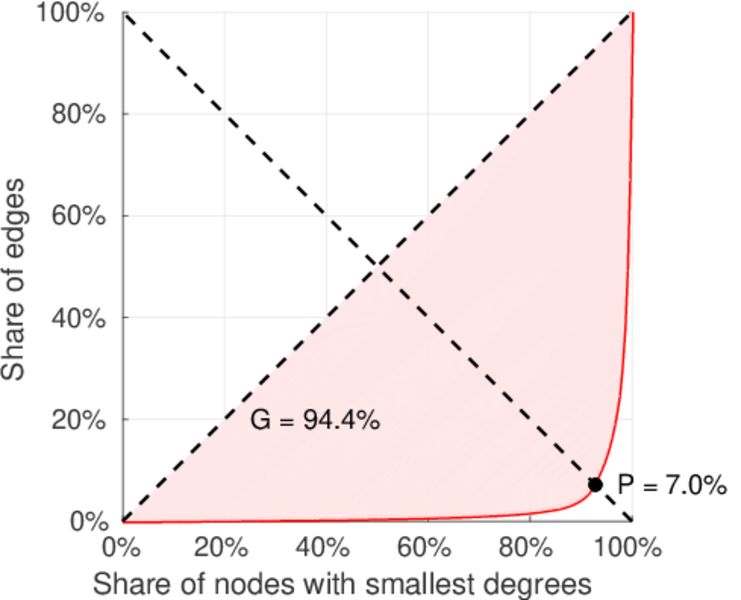
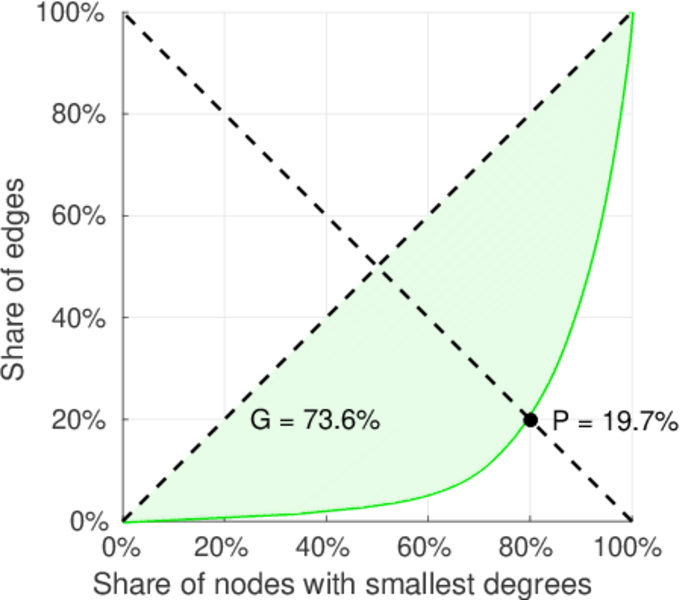
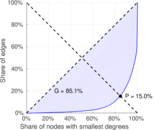
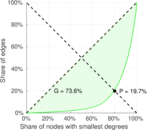
| Gini coefficient | G = | 0.848 851
|
| Balanced inequality ratio | P = | 0.158 541
|
| Left balanced inequality ratio | P1 = | 0.070 115 0
|
| Right balanced inequality ratio | P2 = | 0.197 248
|
| Relative edge distribution entropy | Her = | 0.788 018
|
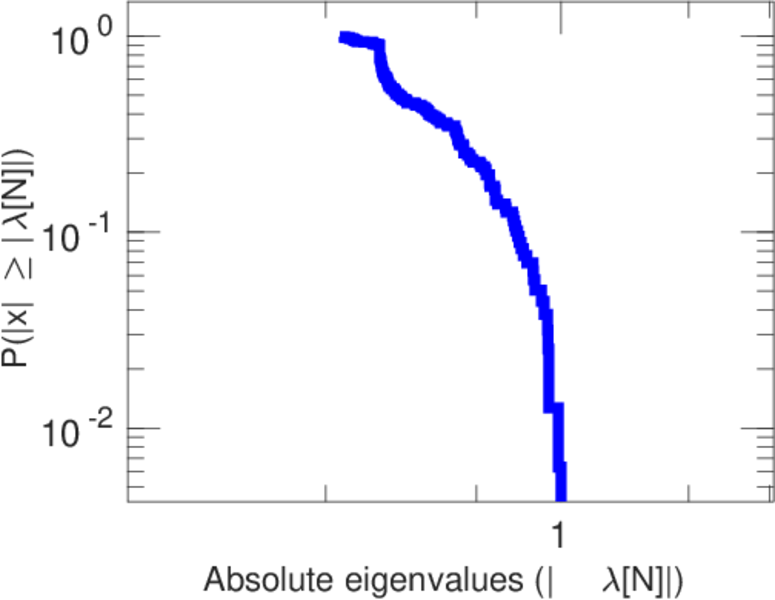
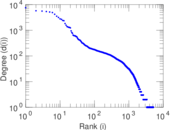
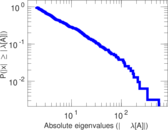
| Power law exponent | γ = | 1.863 10
|
| Tail power law exponent | γt = | 1.611 00
|
| Tail power law exponent with p | γ3 = | 1.611 00
|
| p-value | p = | 0.000 00
|
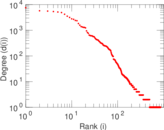
| Left tail power law exponent with p | γ3,1 = | 1.621 00
|
| Left p-value | p1 = | 0.000 00
|
| Right tail power law exponent with p | γ3,2 = | 8.911 00
|
| Right p-value | p2 = | 0.161 000
|
| Degree assortativity | ρ = | −0.192 046
|
| Degree assortativity p-value | pρ = | 2.423 67 × 10−282
|
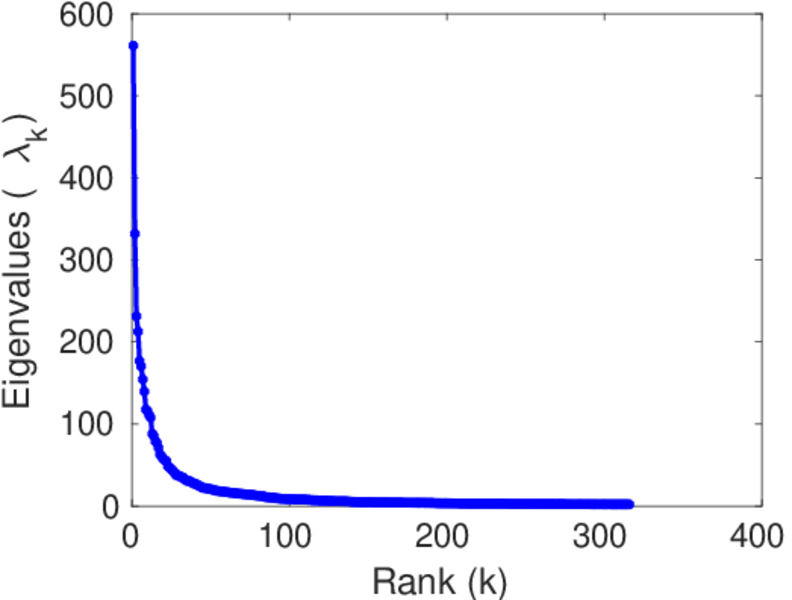
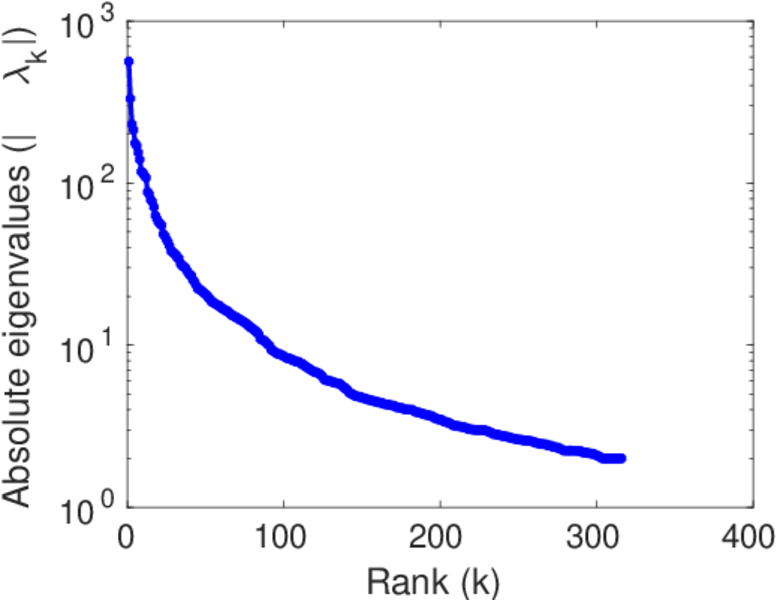
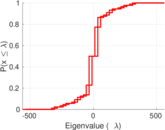
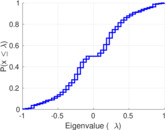
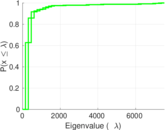
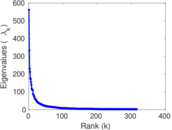
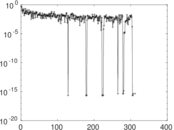
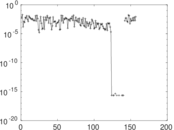
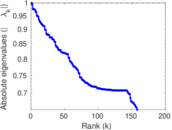
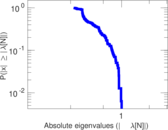
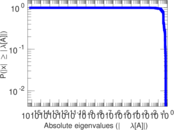
| Spectral norm | α = | 561.033
|
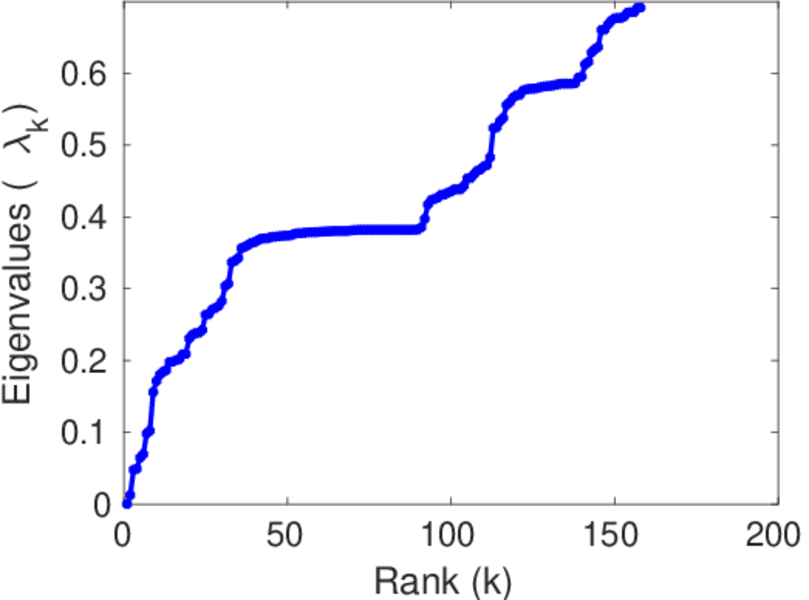
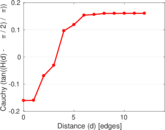
| Algebraic connectivity | a = | 0.012 749 9
|
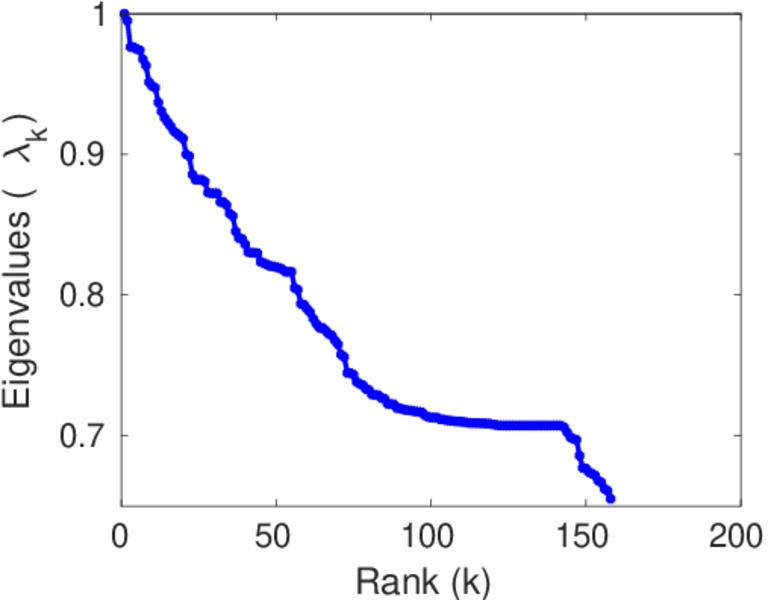
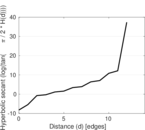
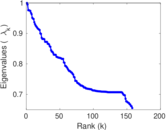
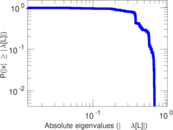
| Spectral separation | |λ1[A] / λ2[A]| = | 1.690 99
|
| Controllability | C = | 3,570
|
| Relative controllability | Cr = | 0.691 860
|
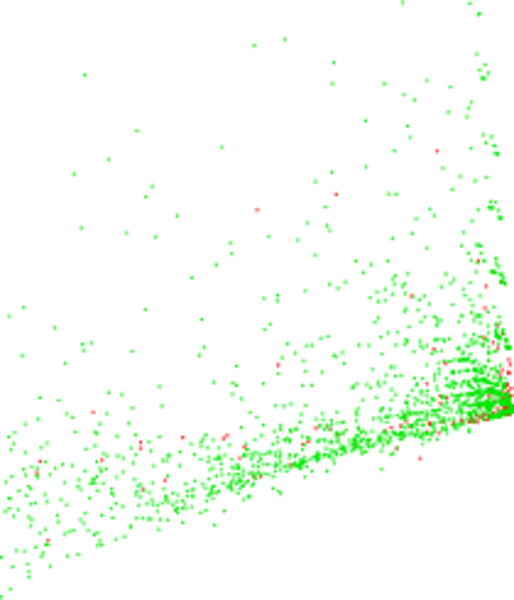
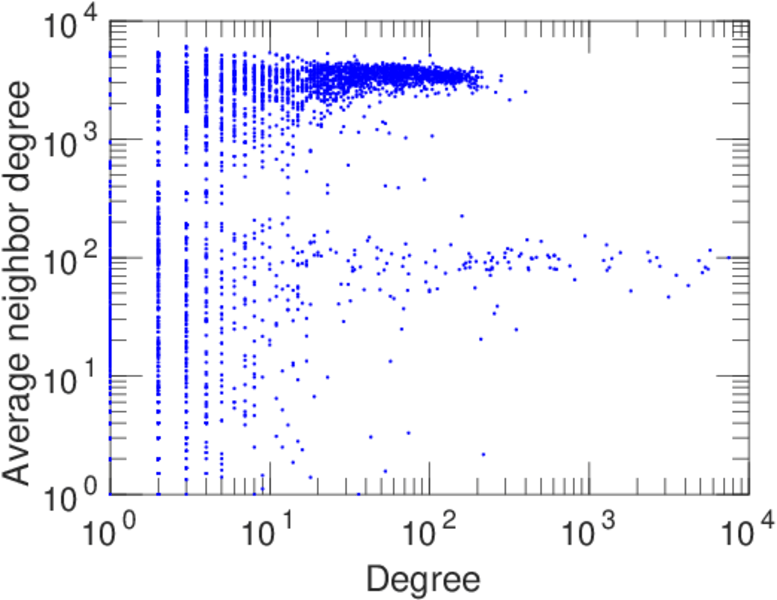
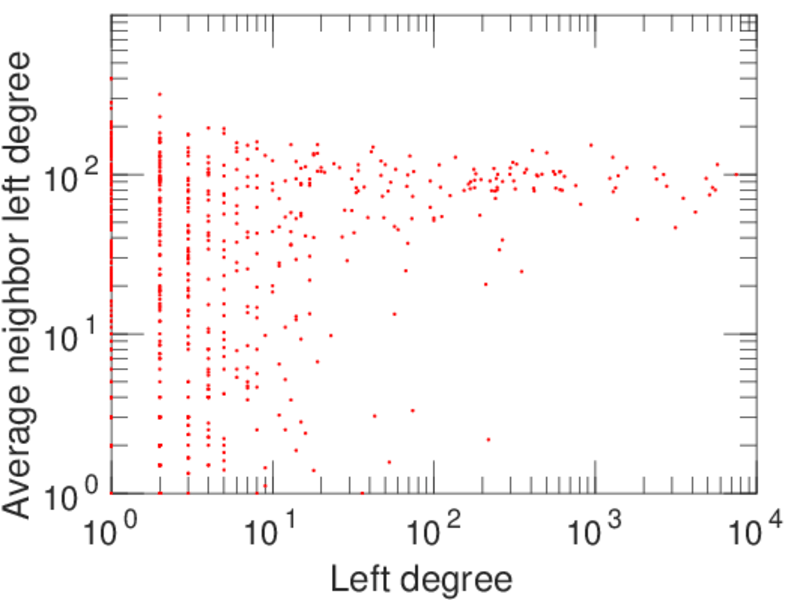
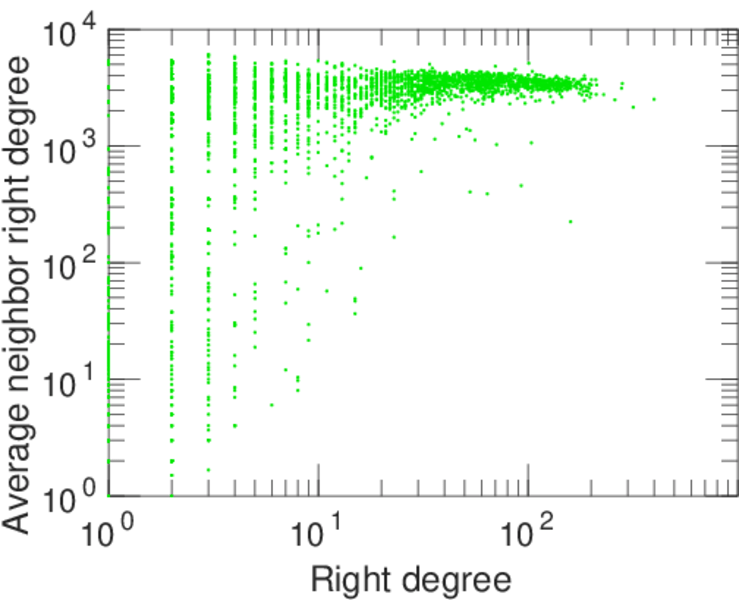
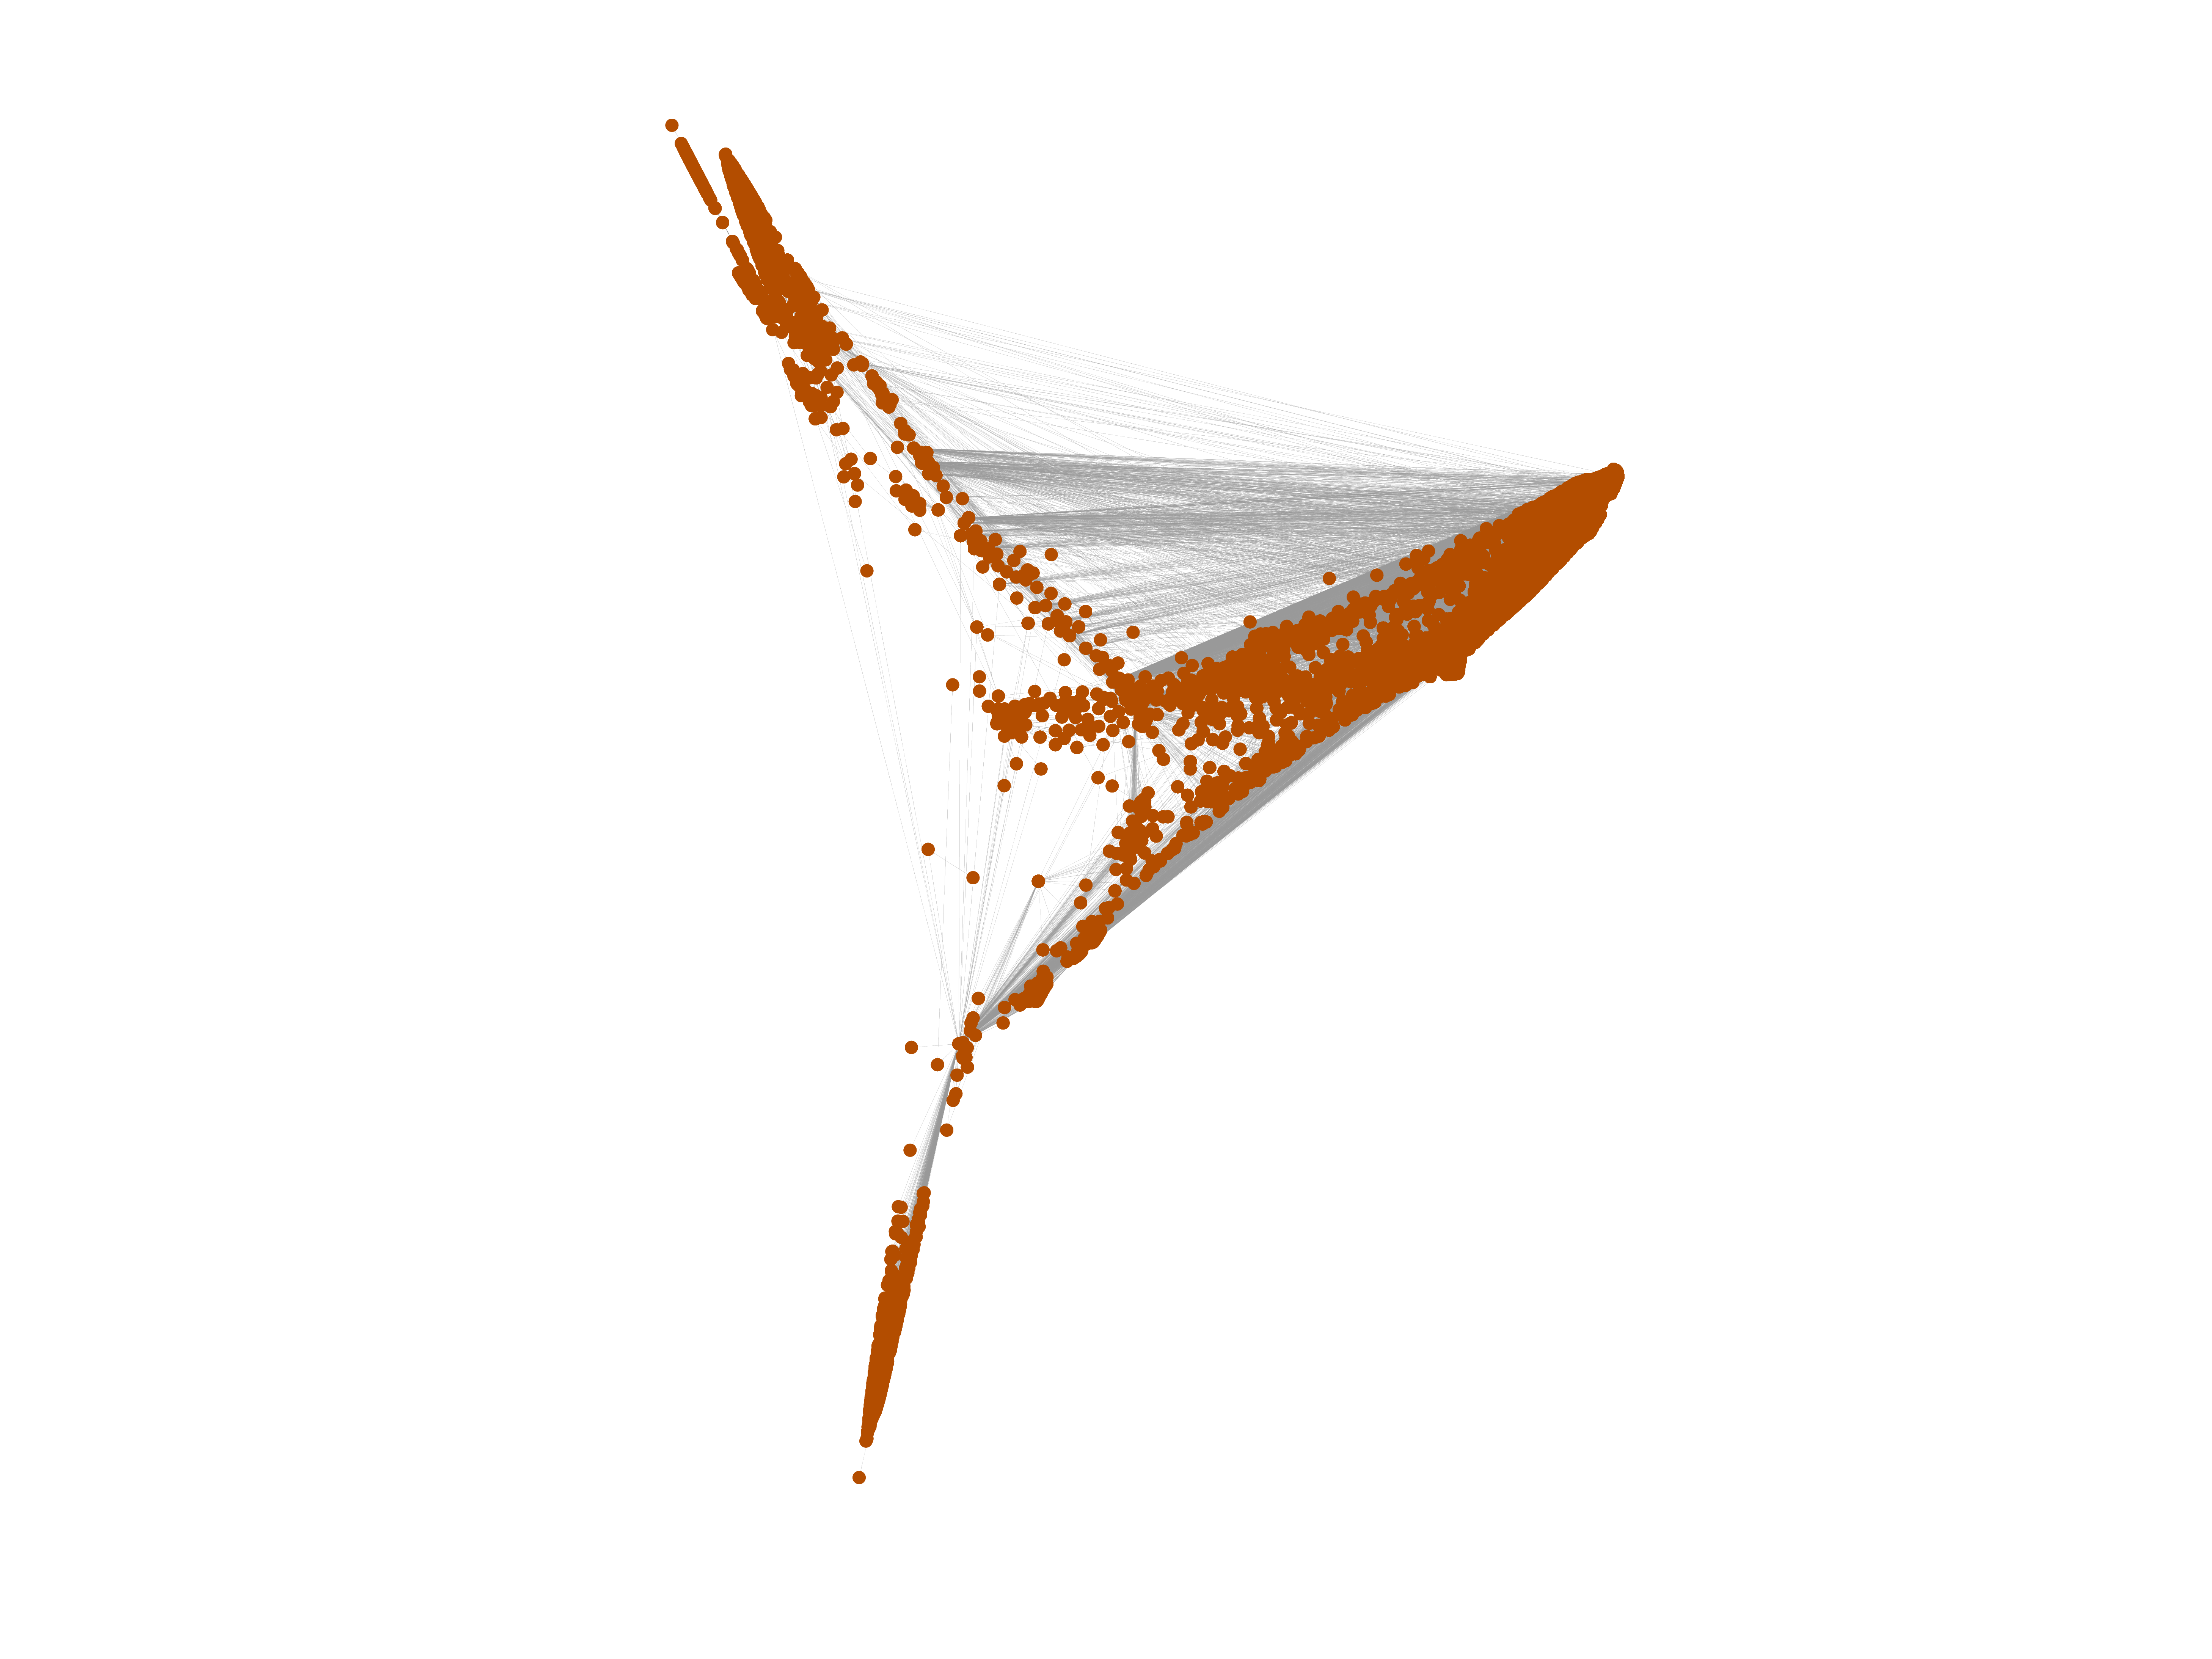
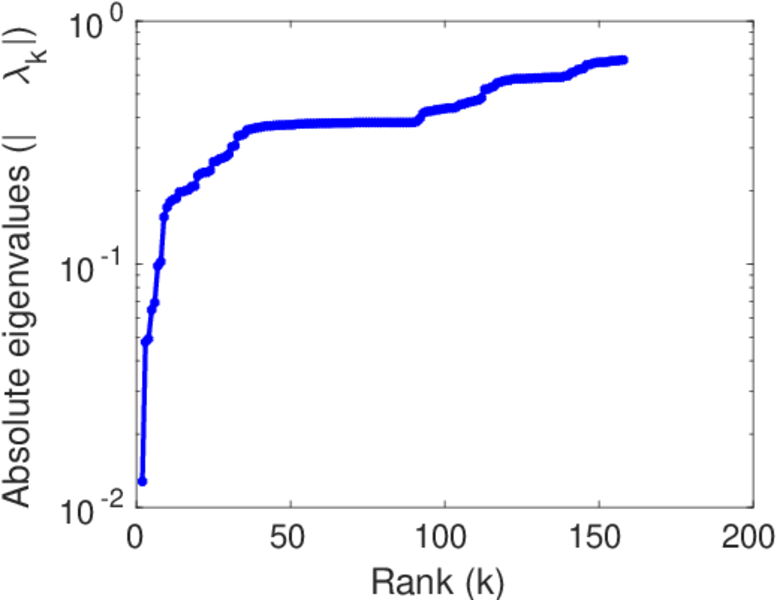
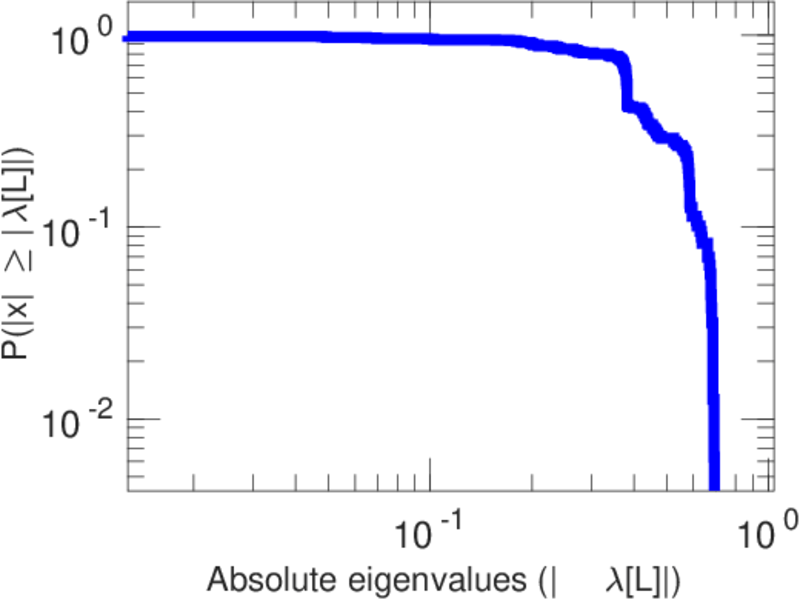
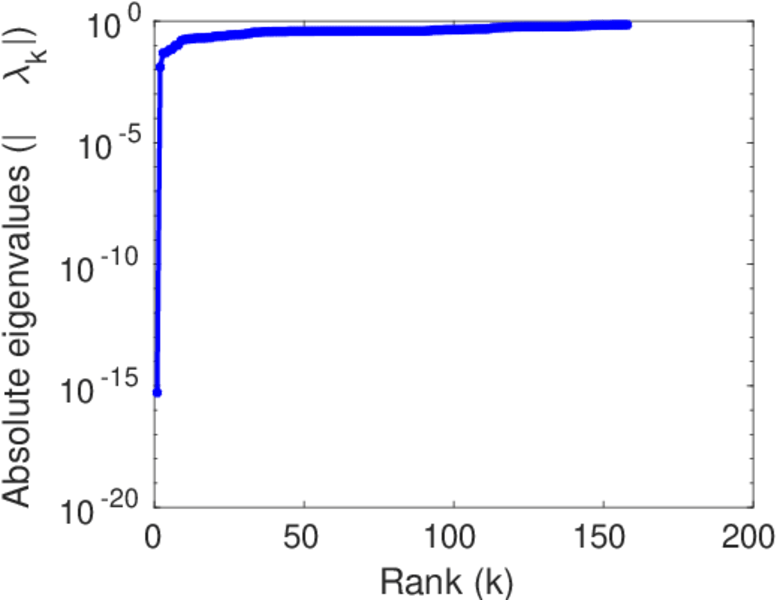
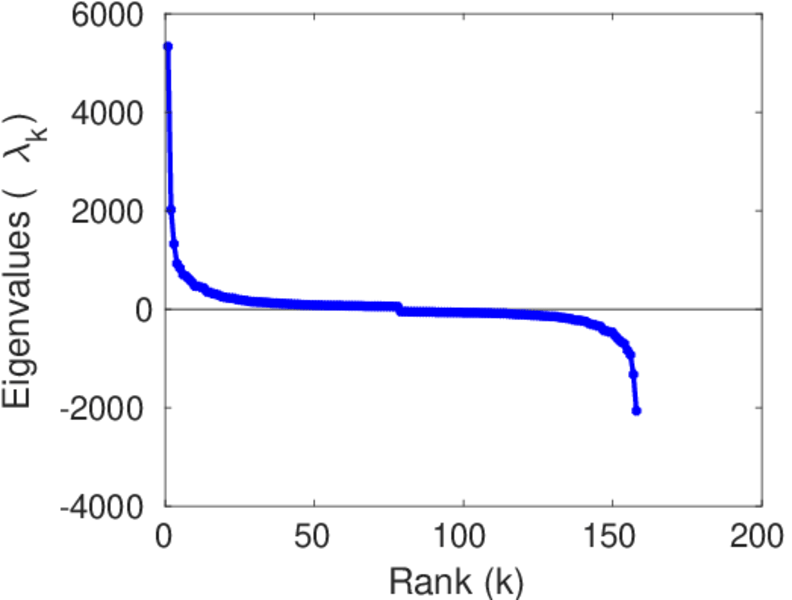
Plots


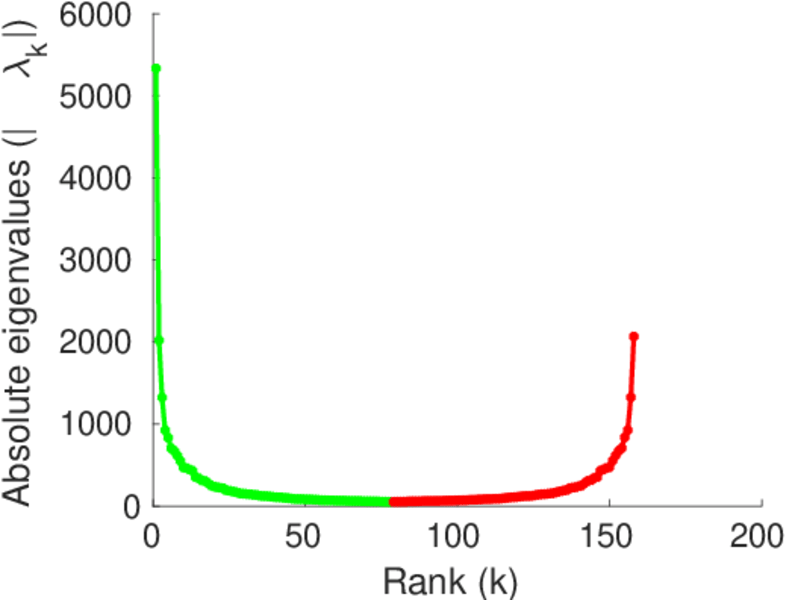
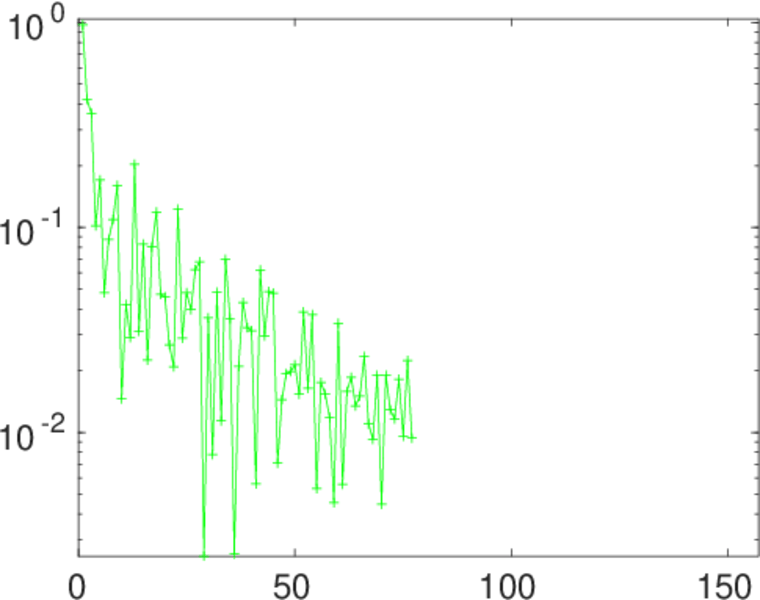
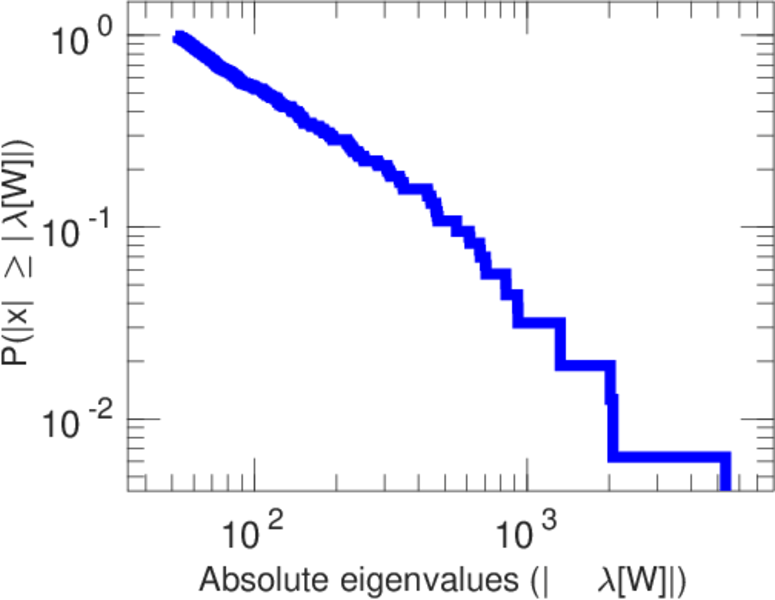
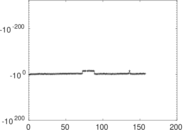
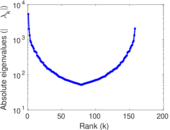
Matrix decompositions plots


Downloads
References
|
[1]
|
Jérôme Kunegis.
KONECT – The Koblenz Network Collection.
In Proc. Int. Conf. on World Wide Web Companion, pages
1343–1350, 2013.
[ http ]
|
|
[2]
|
Wikimedia Foundation.
Wikimedia downloads.
http://dumps.wikimedia.org/, January 2010.
|
 KONECT ‣ Networks ‣
Buy Me a Coffee
KONECT ‣ Networks ‣
Buy Me a Coffee