Wikipedia edits (xal)
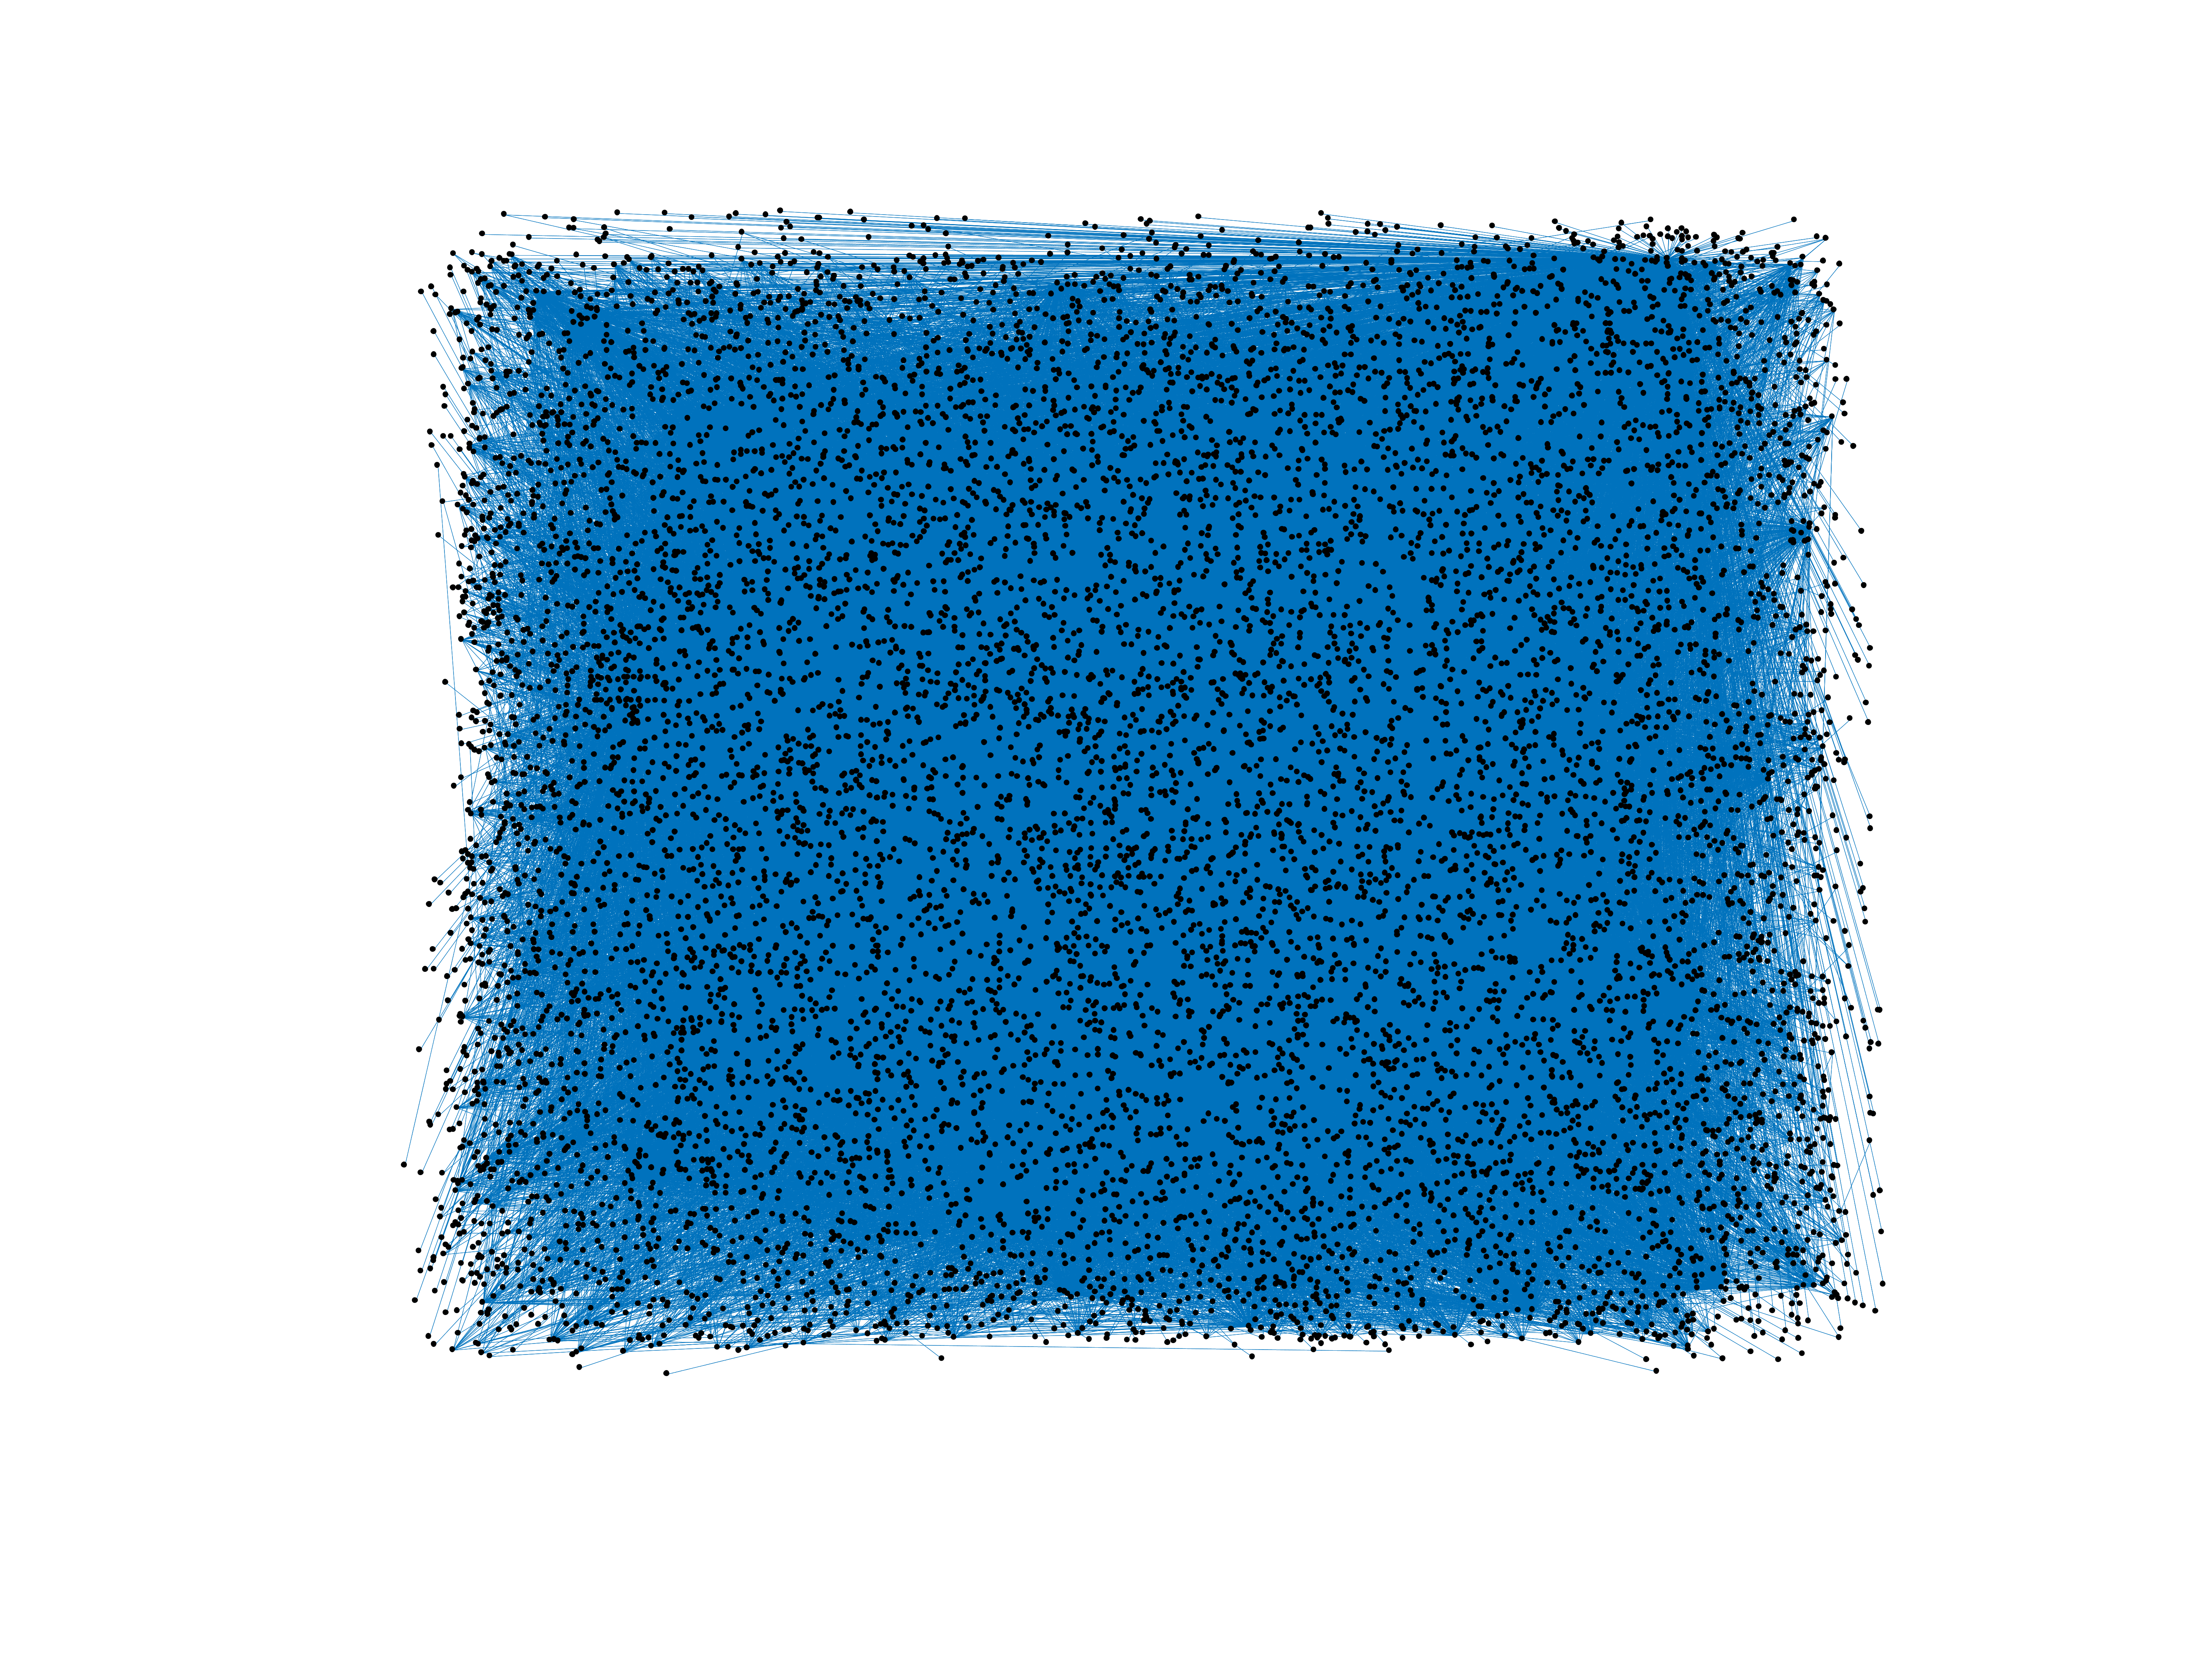
This is the bipartite edit network of the Kalmyk Wikipedia. It contains users
and pages from the Kalmyk Wikipedia, connected by edit events. Each edge
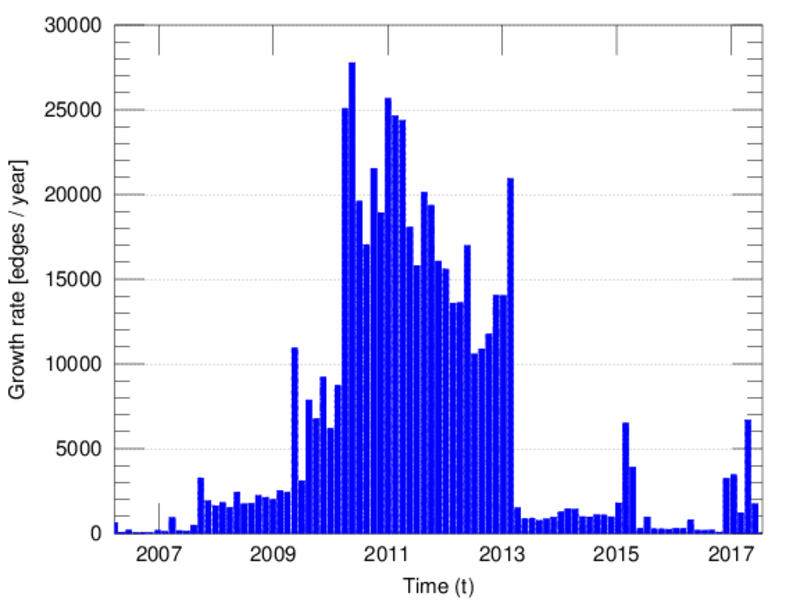
represents an edit. The dataset includes the timestamp of each edit.
Metadata
Statistics
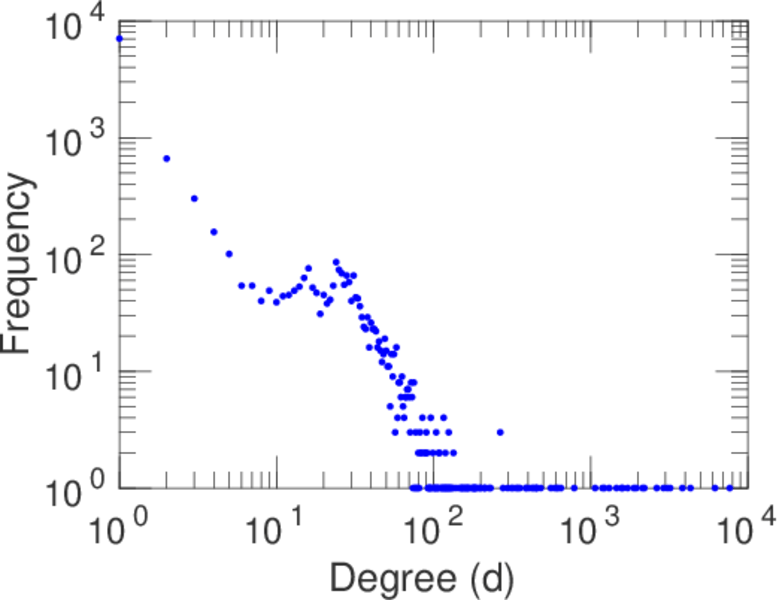
| Size | n = | 10,532
|
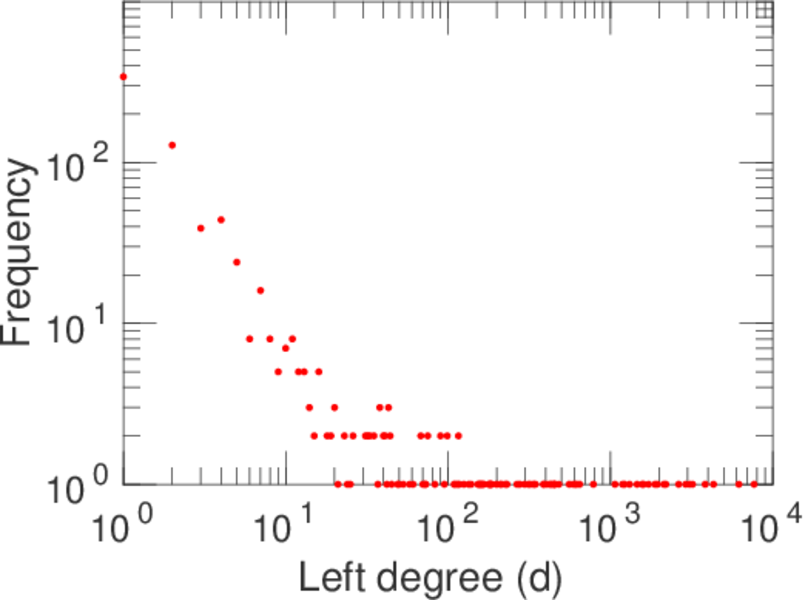
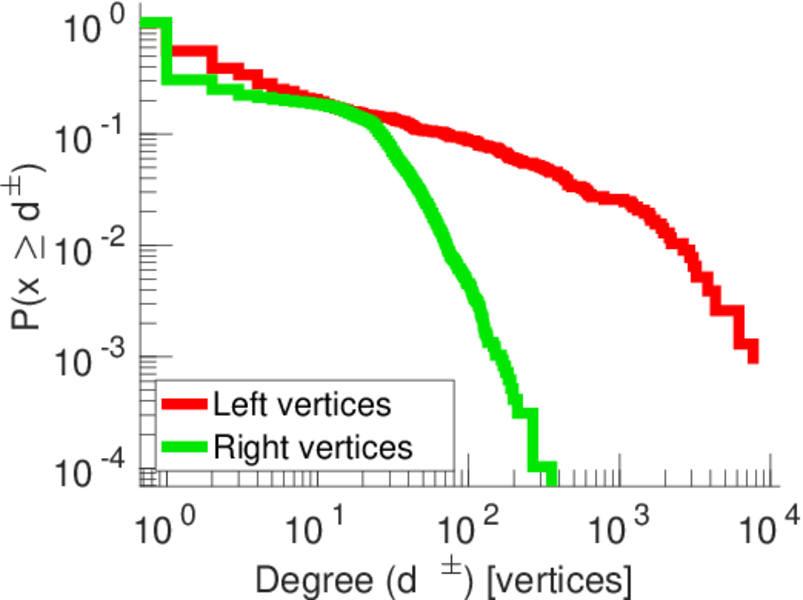
| Left size | n1 = | 770
|
| Right size | n2 = | 9,762
|
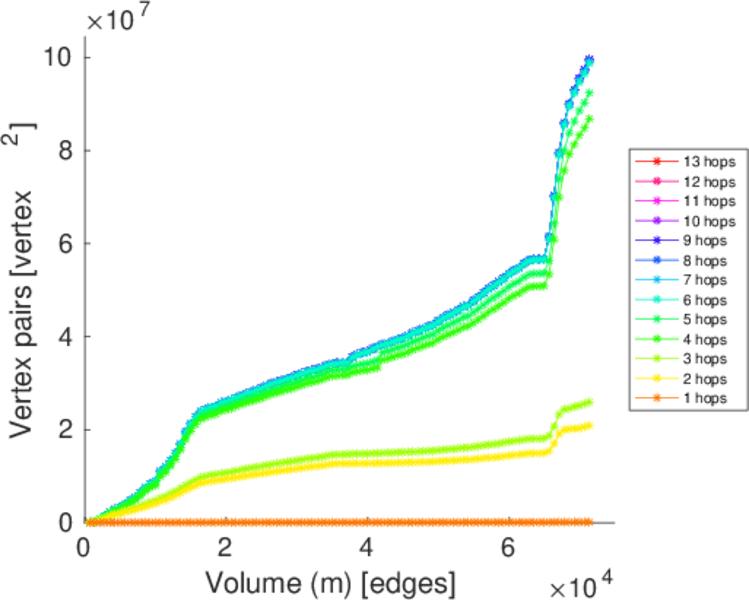
| Volume | m = | 71,329
|
| Unique edge count | m̿ = | 38,659
|
| Wedge count | s = | 21,437,529
|
| Claw count | z = | 12,350,689,295
|
| Cross count | x = | 6,487,268,859,885
|
| Square count | q = | 47,447,721
|
| 4-Tour count | T4 = | 465,411,138
|
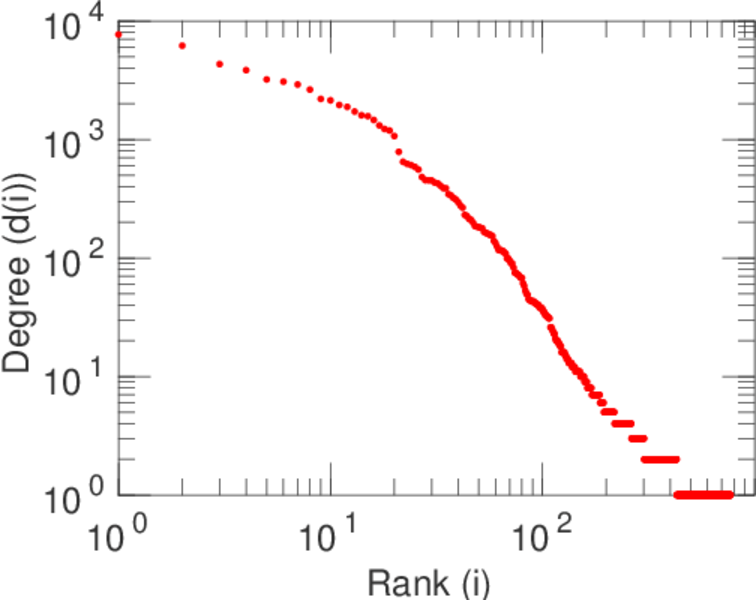
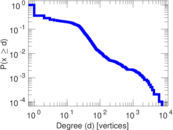
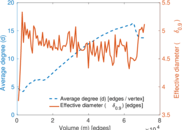
| Maximum degree | dmax = | 7,689
|
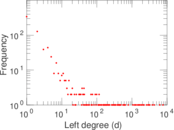
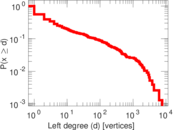
| Maximum left degree | d1max = | 7,689
|
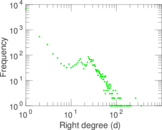
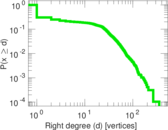
| Maximum right degree | d2max = | 355
|
| Average degree | d = | 13.545 2
|
| Average left degree | d1 = | 92.635 1
|
| Average right degree | d2 = | 7.306 80
|
| Fill | p = | 0.005 143 05
|
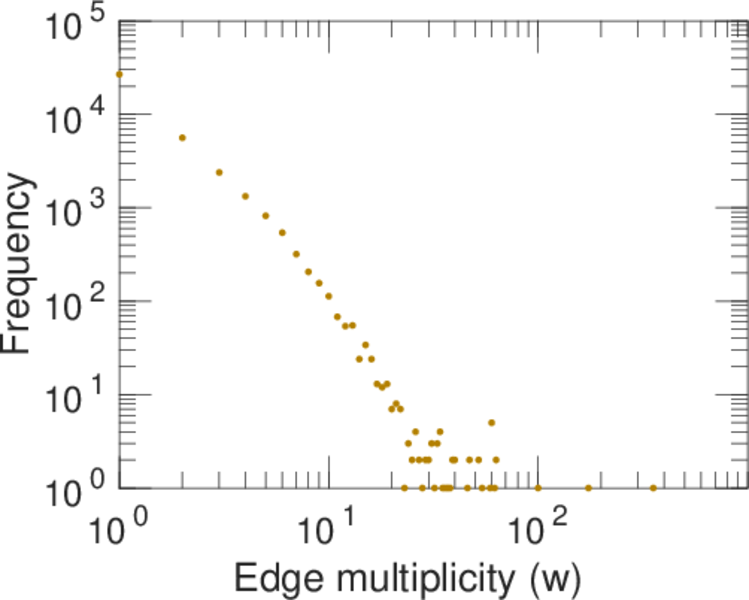
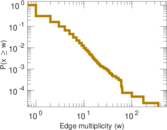
| Average edge multiplicity | m̃ = | 1.845 08
|
| Size of LCC | N = | 9,976
|
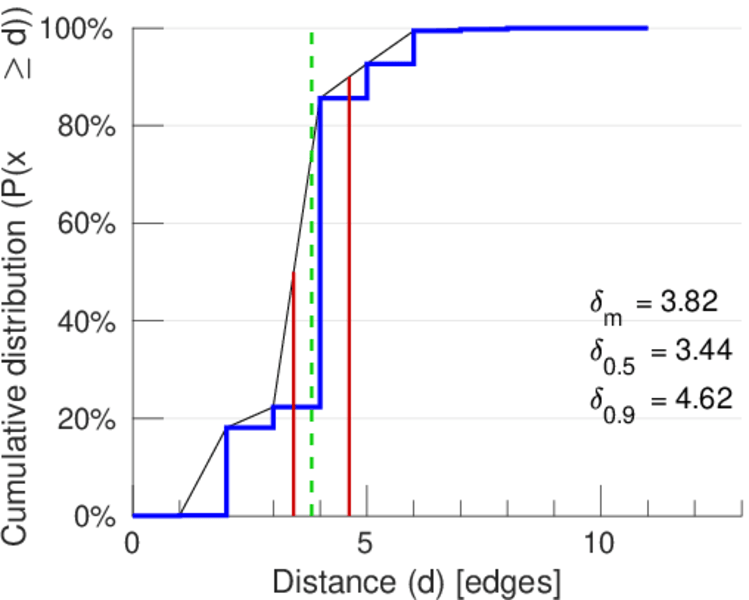
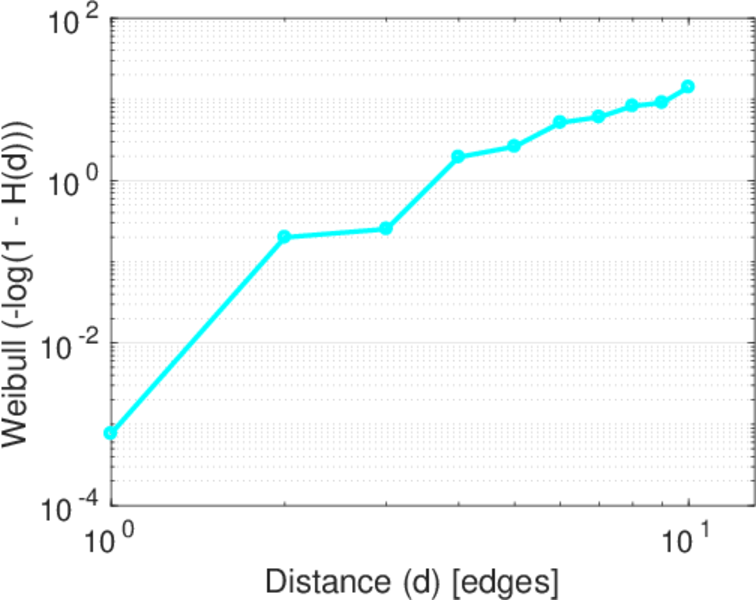
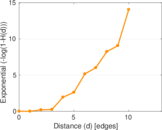
| Diameter | δ = | 13
|
| 50-Percentile effective diameter | δ0.5 = | 3.437 45
|
| 90-Percentile effective diameter | δ0.9 = | 4.622 04
|
| Median distance | δM = | 4
|
| Mean distance | δm = | 3.821 07
|
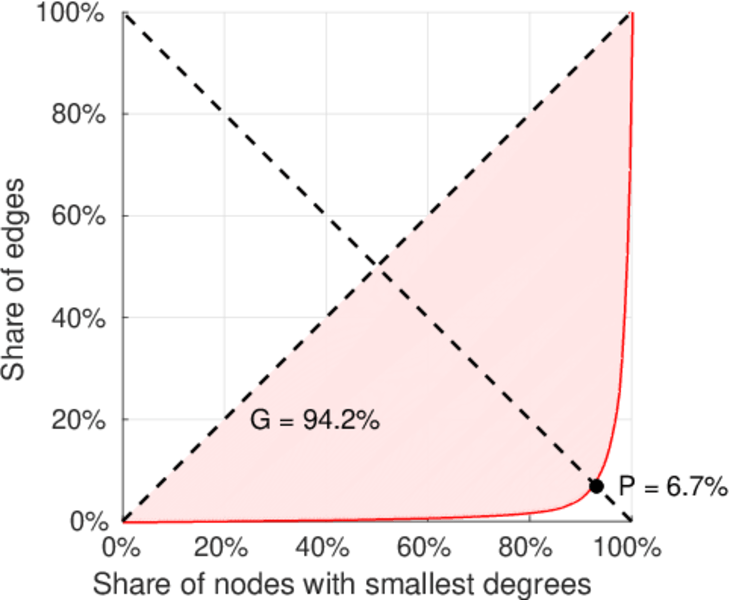
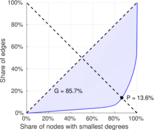
| Gini coefficient | G = | 0.857 058
|
| Balanced inequality ratio | P = | 0.137 349
|
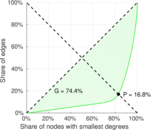
| Left balanced inequality ratio | P1 = | 0.067 153 6
|
| Right balanced inequality ratio | P2 = | 0.167 884
|
| Relative edge distribution entropy | Her = | 0.747 779
|
| Power law exponent | γ = | 2.622 72
|
| Tail power law exponent | γt = | 2.871 00
|
| Tail power law exponent with p | γ3 = | 2.871 00
|
| p-value | p = | 0.000 00
|
| Left tail power law exponent with p | γ3,1 = | 1.481 00
|
| Left p-value | p1 = | 0.006 000 00
|
| Right tail power law exponent with p | γ3,2 = | 5.221 00
|
| Right p-value | p2 = | 0.006 000 00
|
| Degree assortativity | ρ = | −0.452 896
|
| Degree assortativity p-value | pρ = | 0.000 00
|
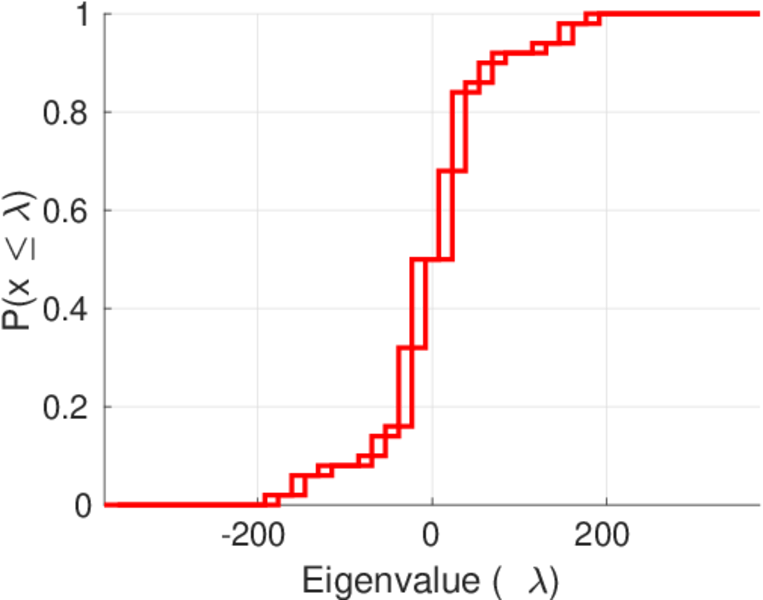
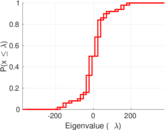
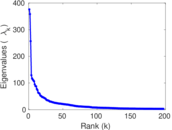
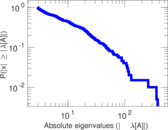
| Spectral norm | α = | 375.939
|
| Algebraic connectivity | a = | 0.009 165 40
|
| Spectral separation | |λ1[A] / λ2[A]| = | 1.049 48
|
| Controllability | C = | 9,044
|
| Relative controllability | Cr = | 0.865 703
|
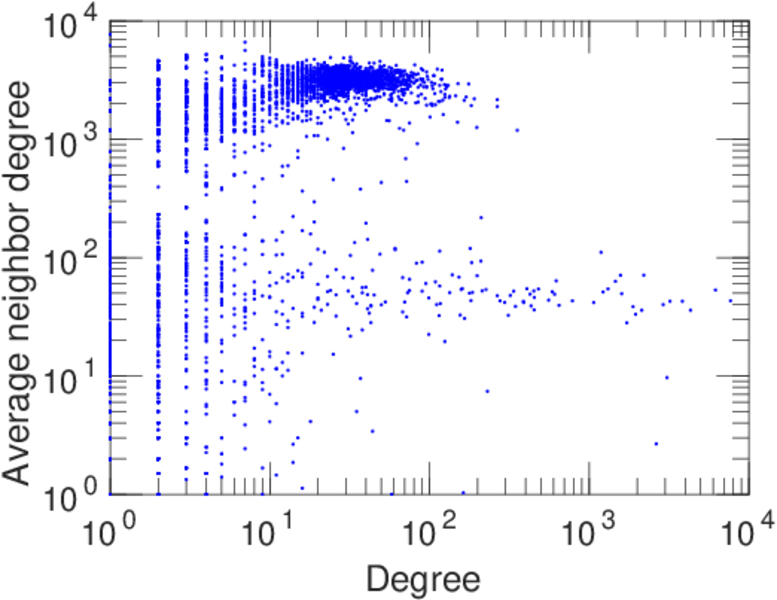
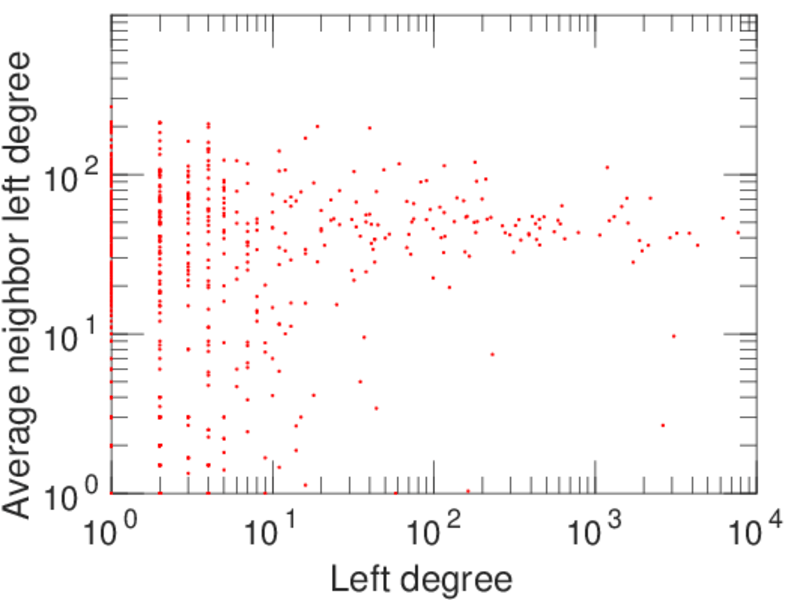
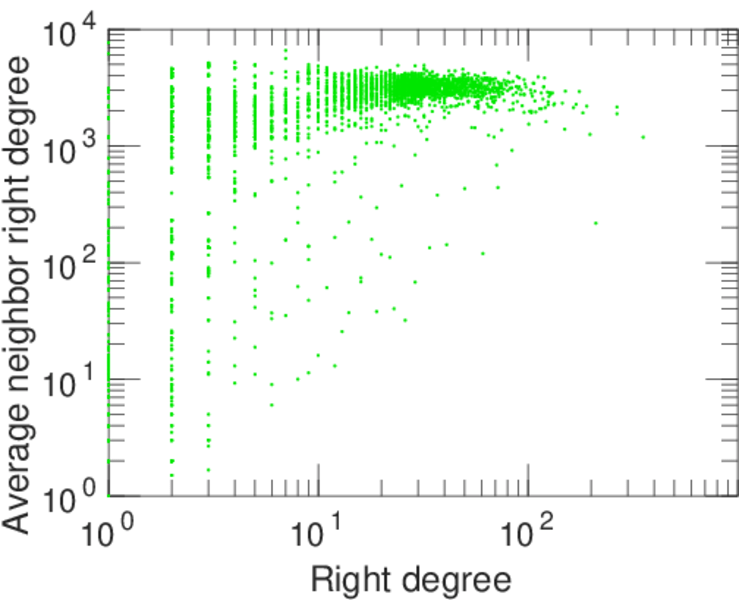
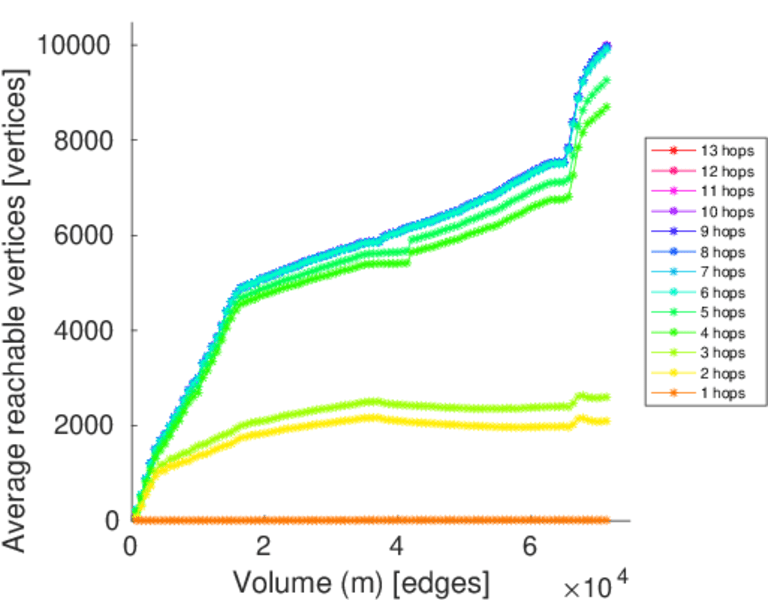
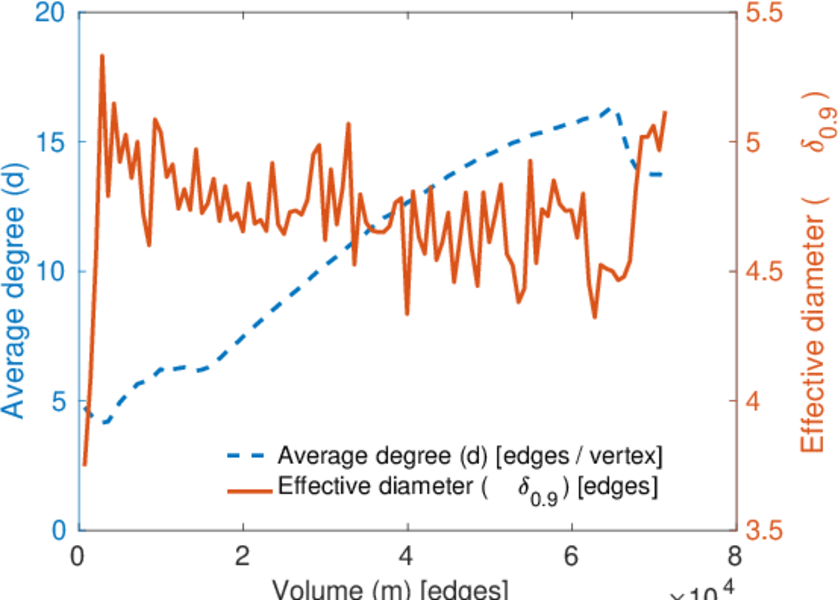
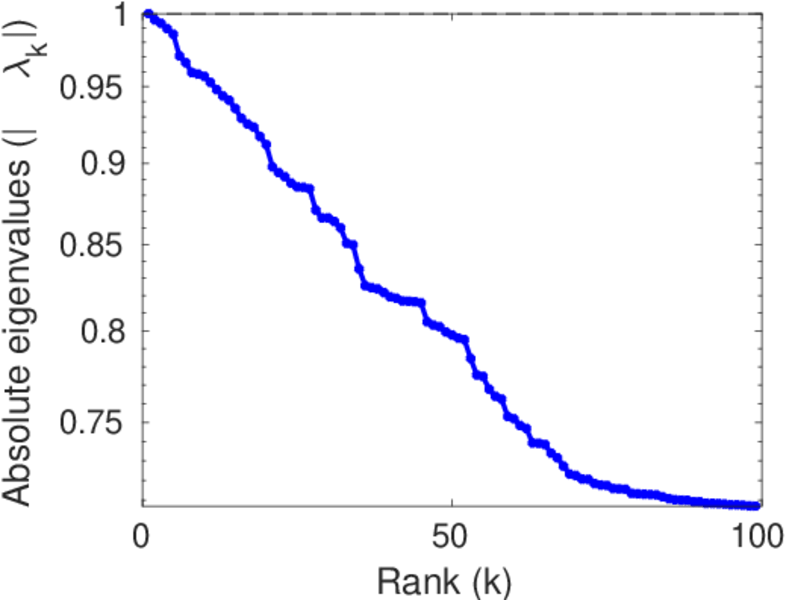
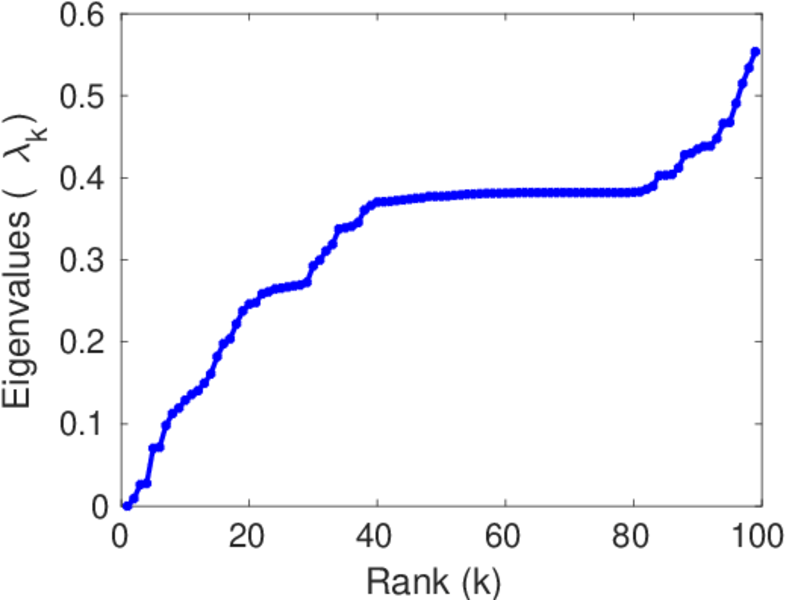
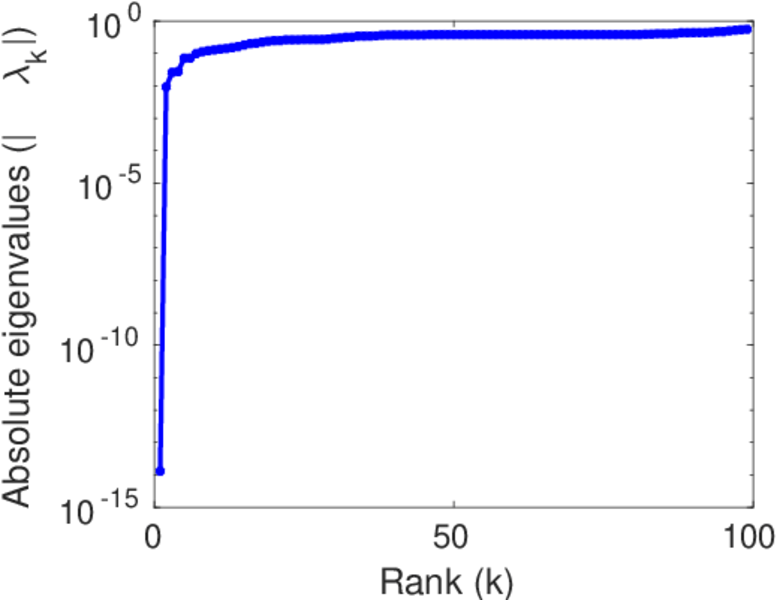
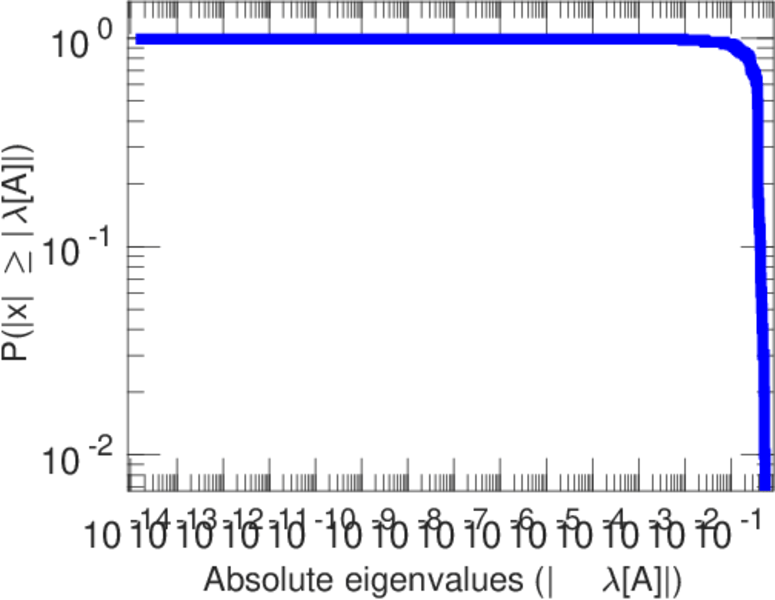
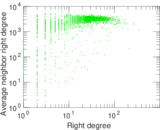
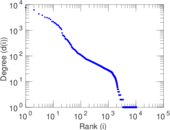
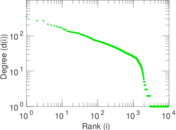
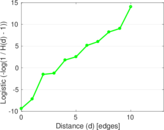
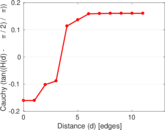
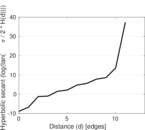
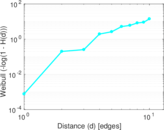
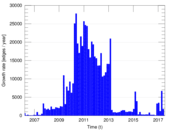
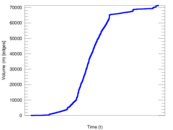
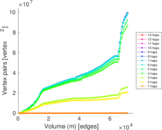
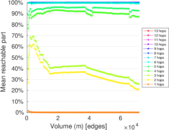
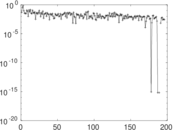
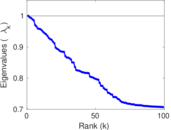
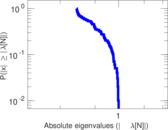
Plots


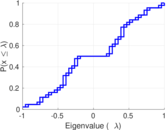
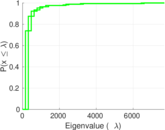


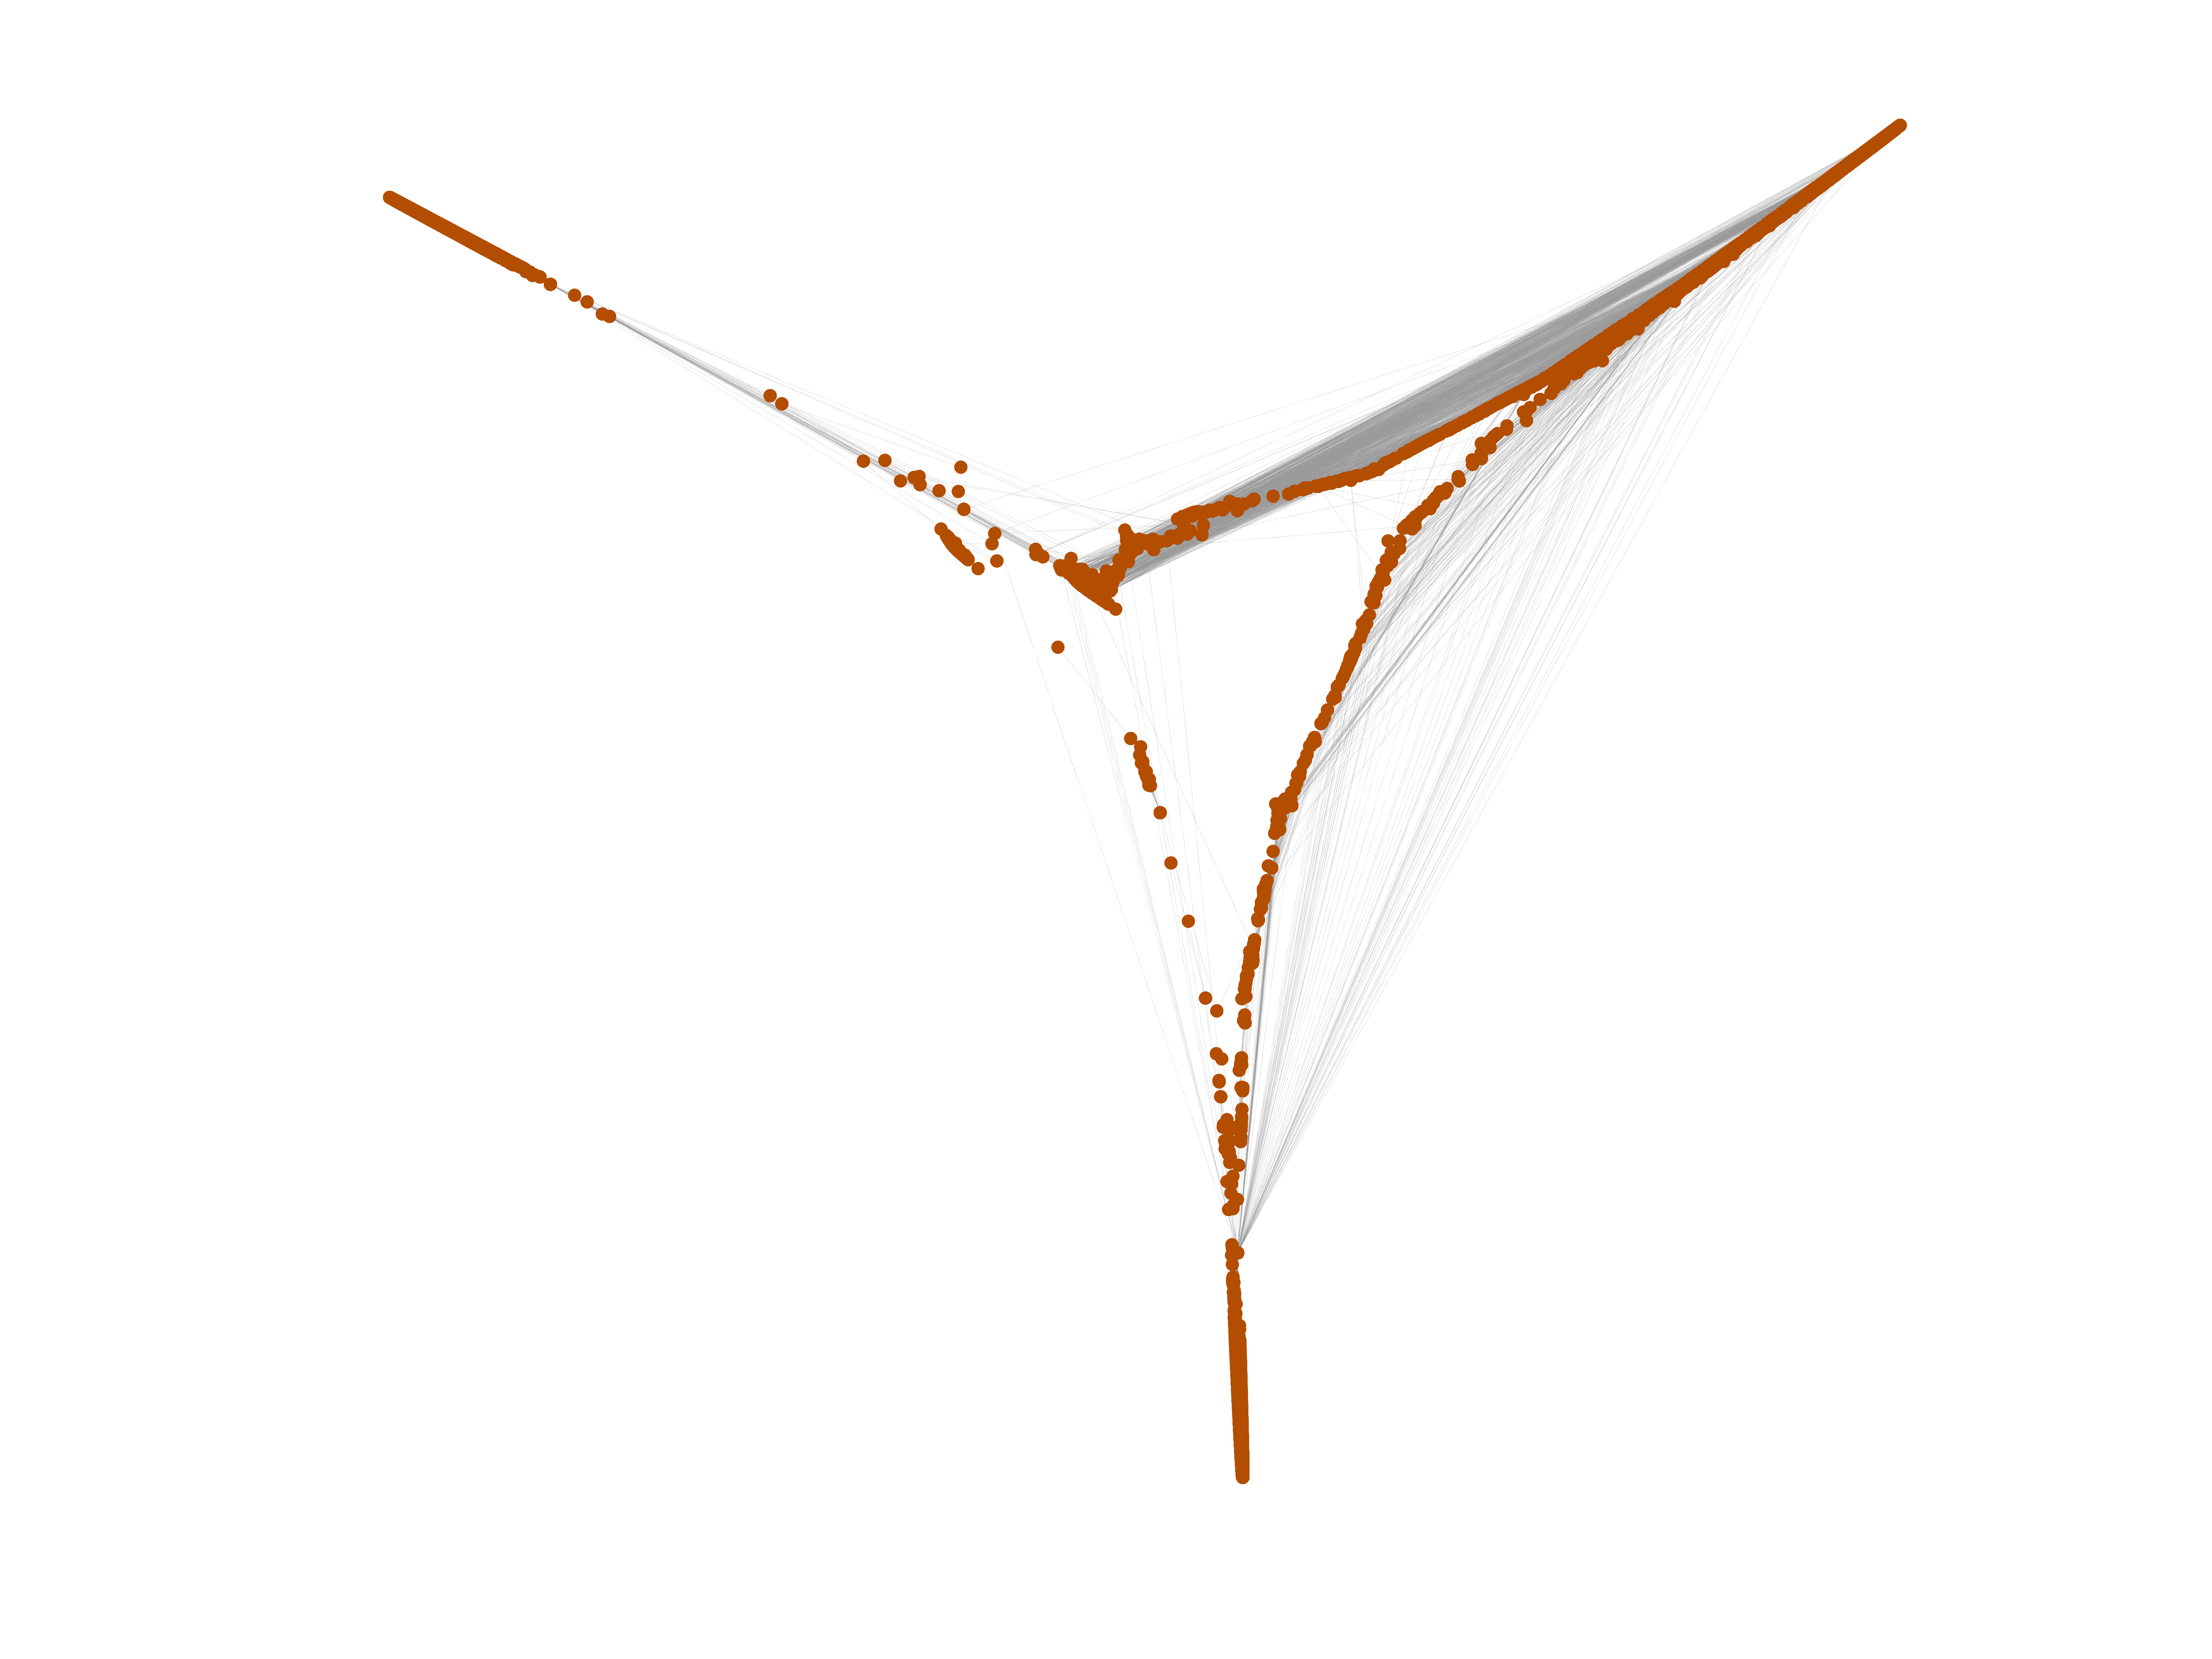
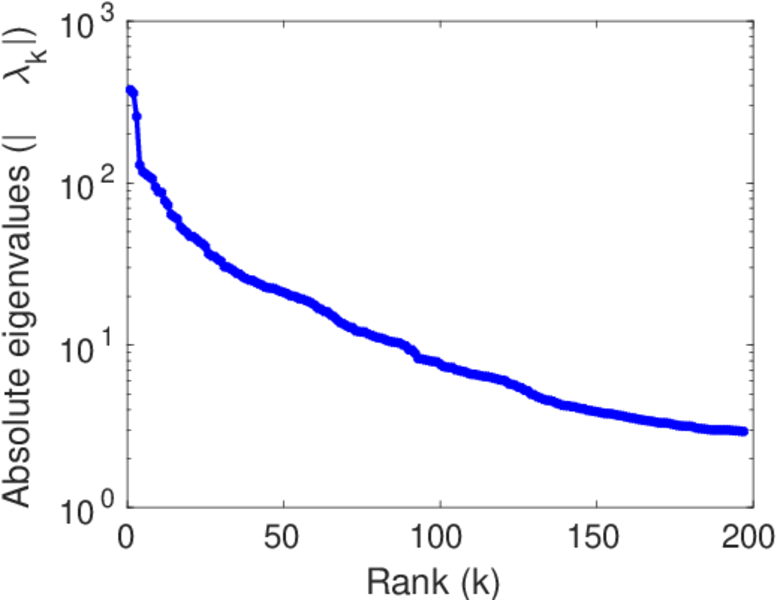
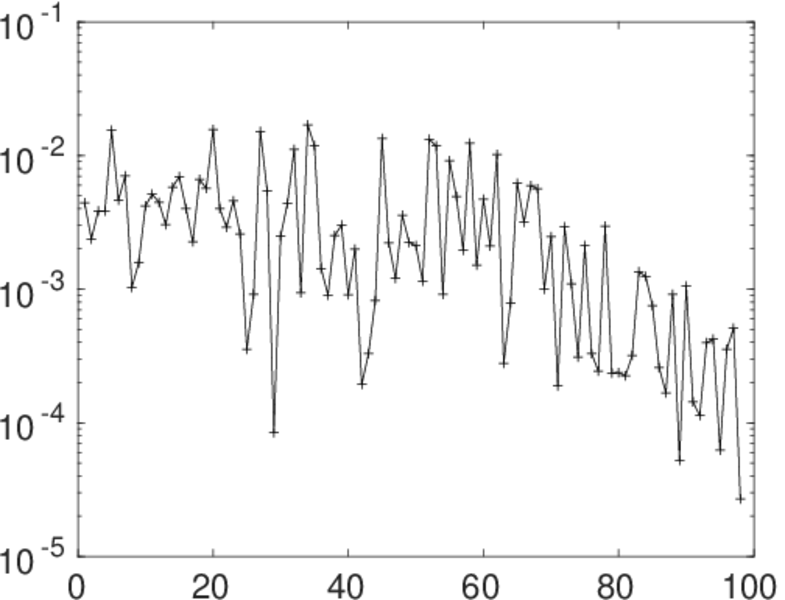
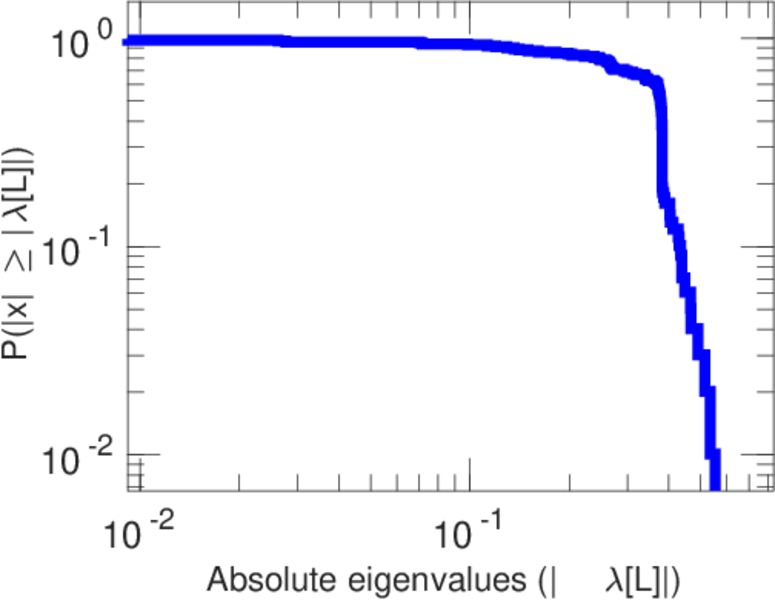
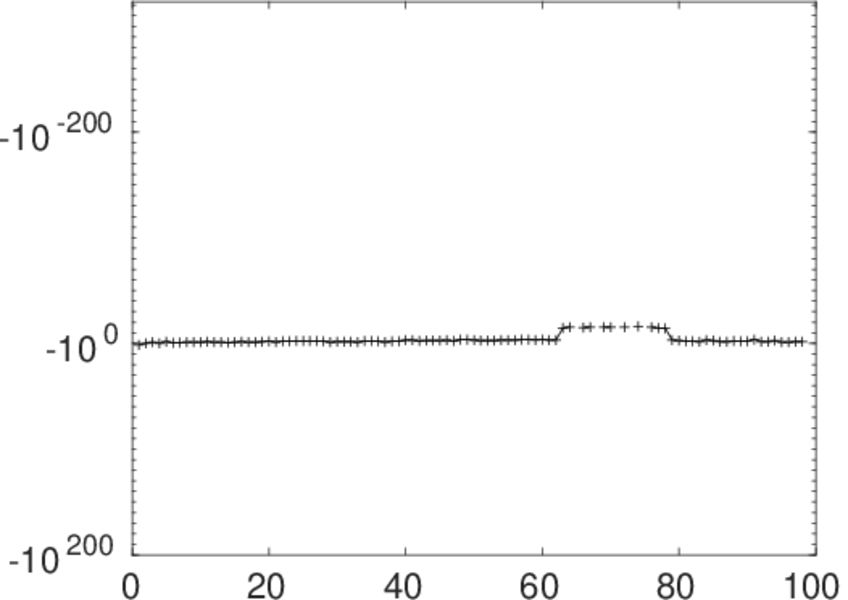
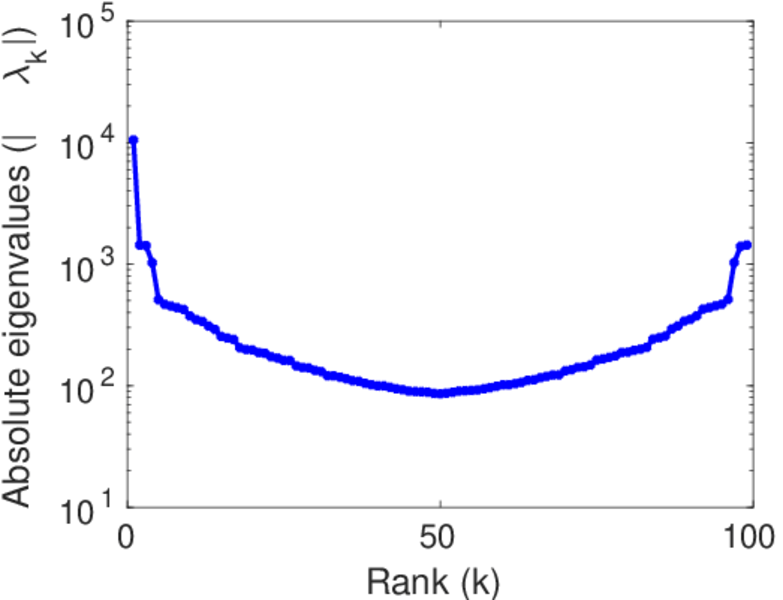
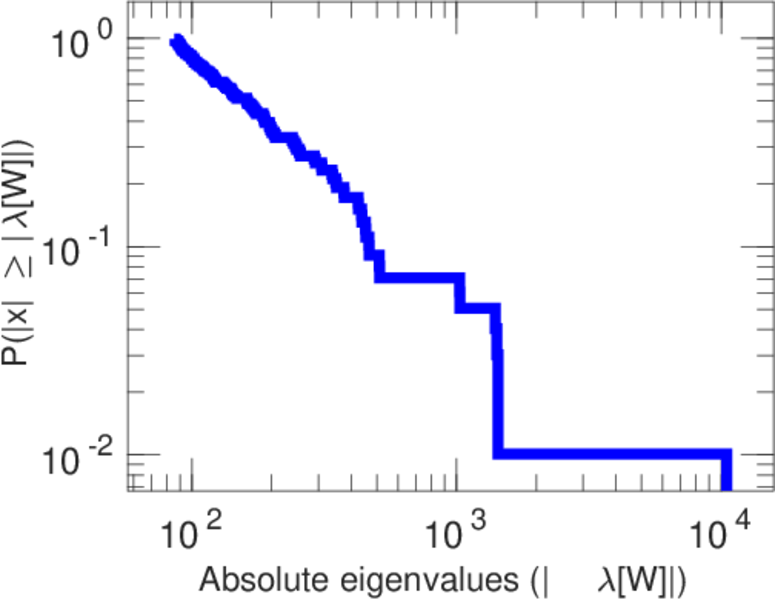
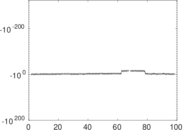
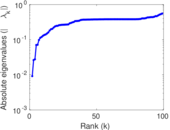
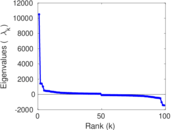
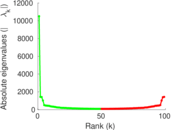
Matrix decompositions plots


Downloads
References
|
[1]
|
Jérôme Kunegis.
KONECT – The Koblenz Network Collection.
In Proc. Int. Conf. on World Wide Web Companion, pages
1343–1350, 2013.
[ http ]
|
|
[2]
|
Wikimedia Foundation.
Wikimedia downloads.
http://dumps.wikimedia.org/, January 2010.
|
 KONECT ‣ Networks ‣
Buy Me a Coffee
KONECT ‣ Networks ‣
Buy Me a Coffee