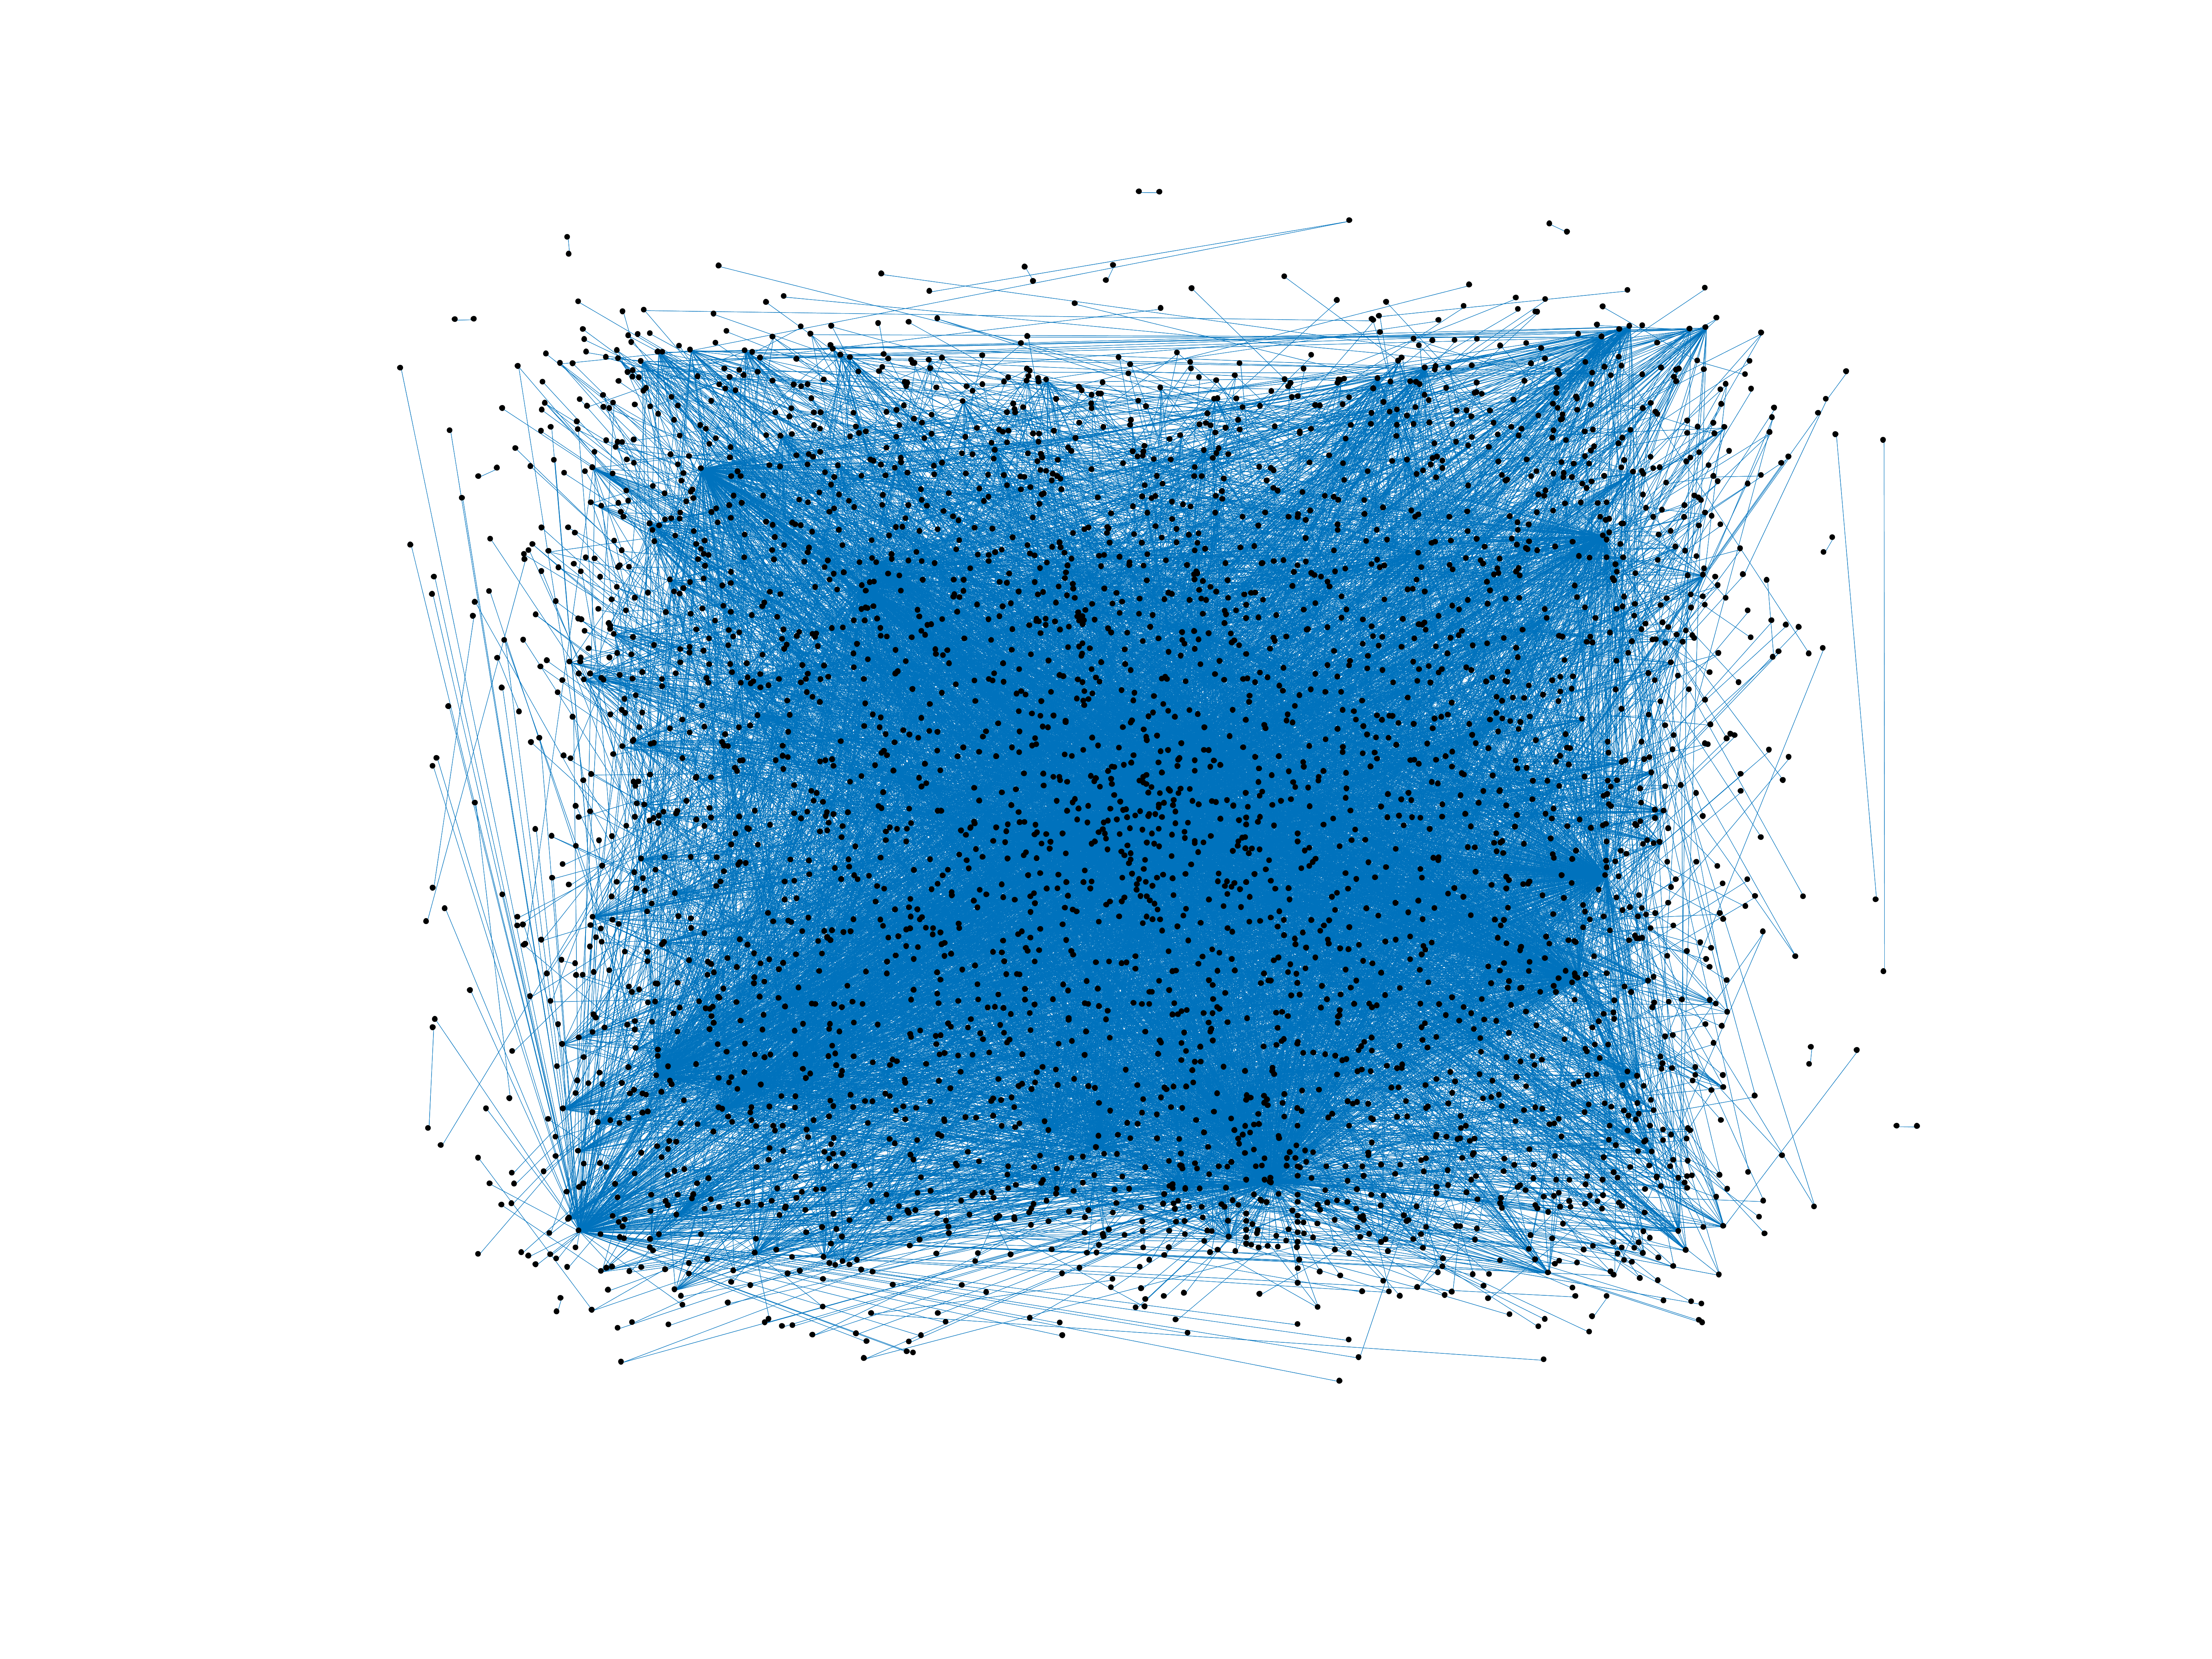
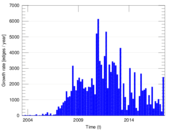
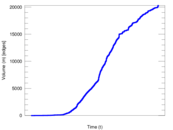
Wikipedia edits (xh)
This is the bipartite edit network of the Xhosa Wikipedia. It contains users
and pages from the Xhosa Wikipedia, connected by edit events. Each edge
represents an edit. The dataset includes the timestamp of each edit.
Metadata
Statistics
| Size | n = | 3,606
|
| Left size | n1 = | 771
|
| Right size | n2 = | 2,835
|
| Volume | m = | 20,309
|
| Unique edge count | m̿ = | 9,082
|
| Wedge count | s = | 721,174
|
| Claw count | z = | 61,944,826
|
| Cross count | x = | 5,776,230,516
|
| Square count | q = | 1,551,339
|
| 4-Tour count | T4 = | 15,321,964
|
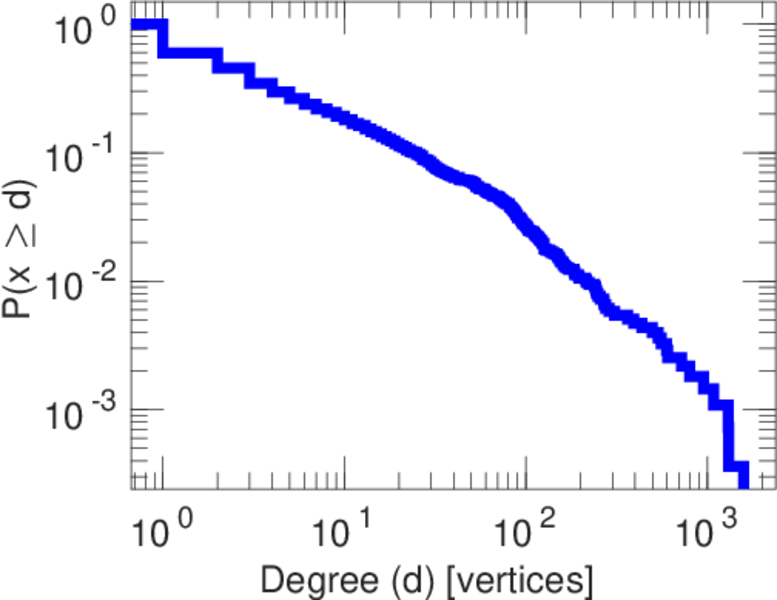
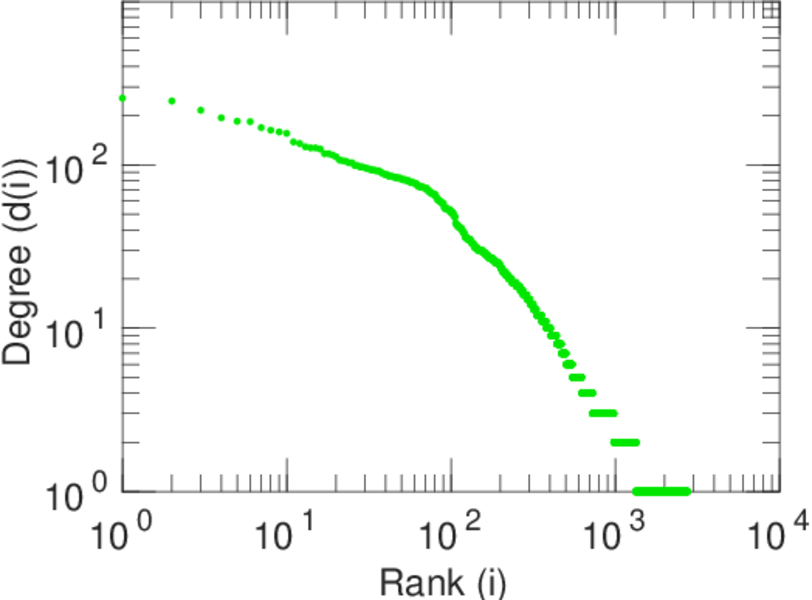
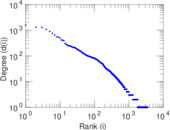
| Maximum degree | dmax = | 1,578
|
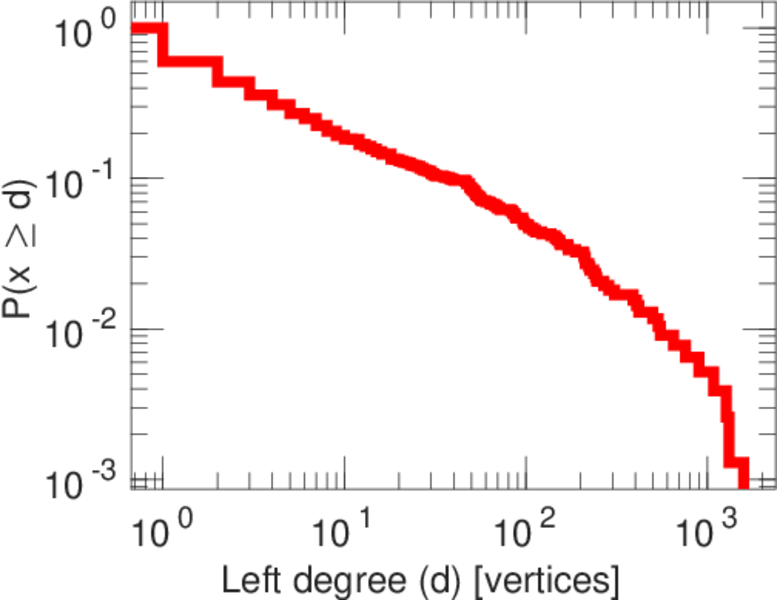
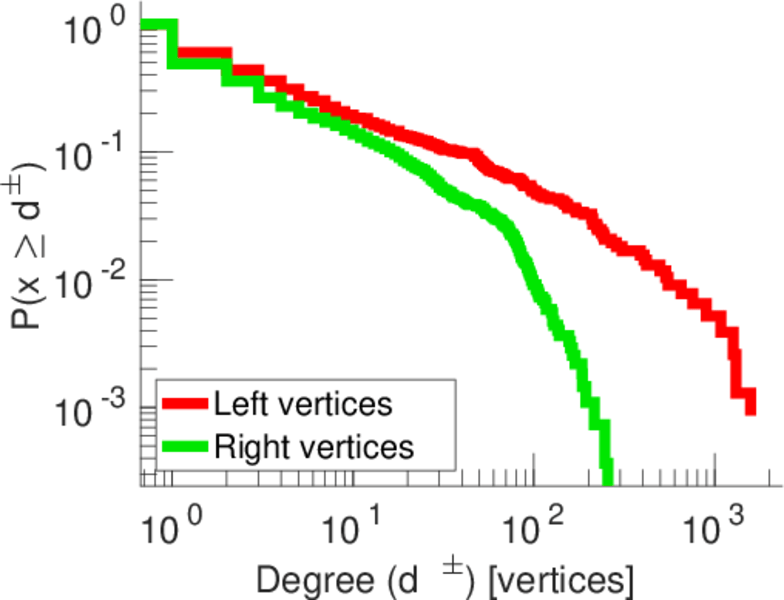
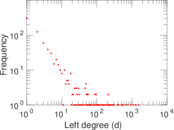
| Maximum left degree | d1max = | 1,578
|
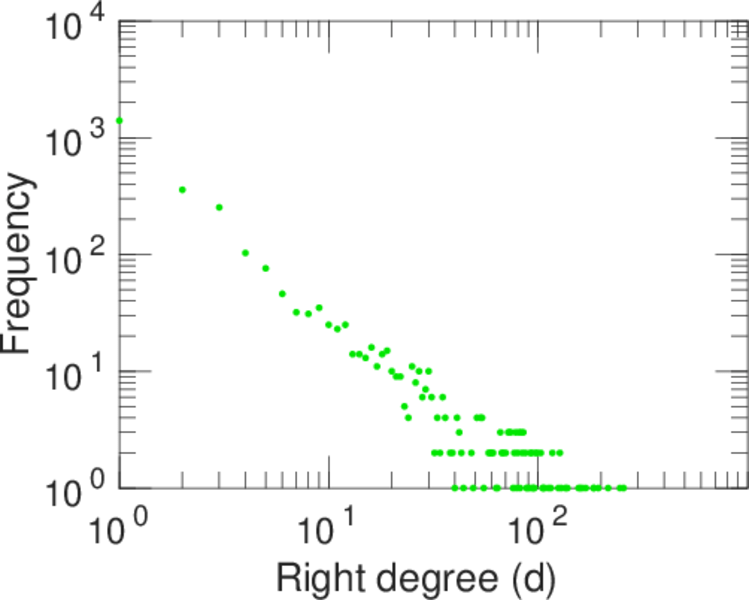
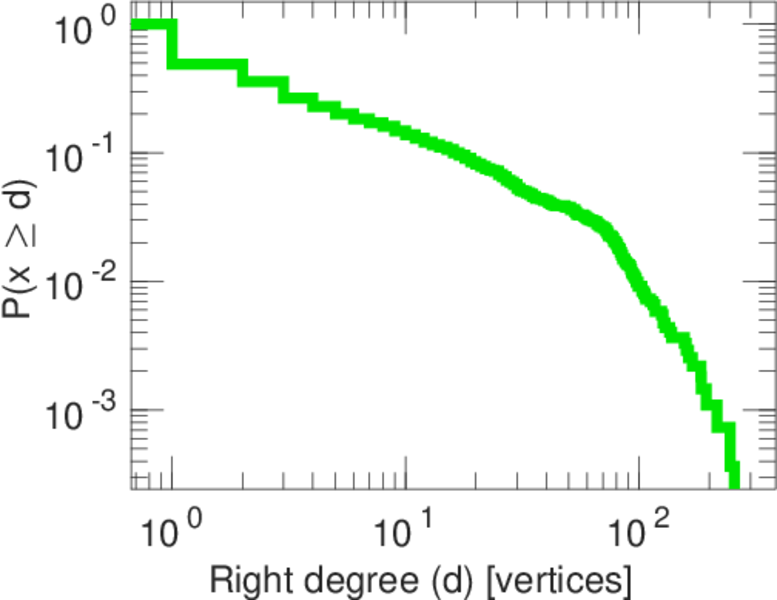
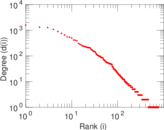
| Maximum right degree | d2max = | 256
|
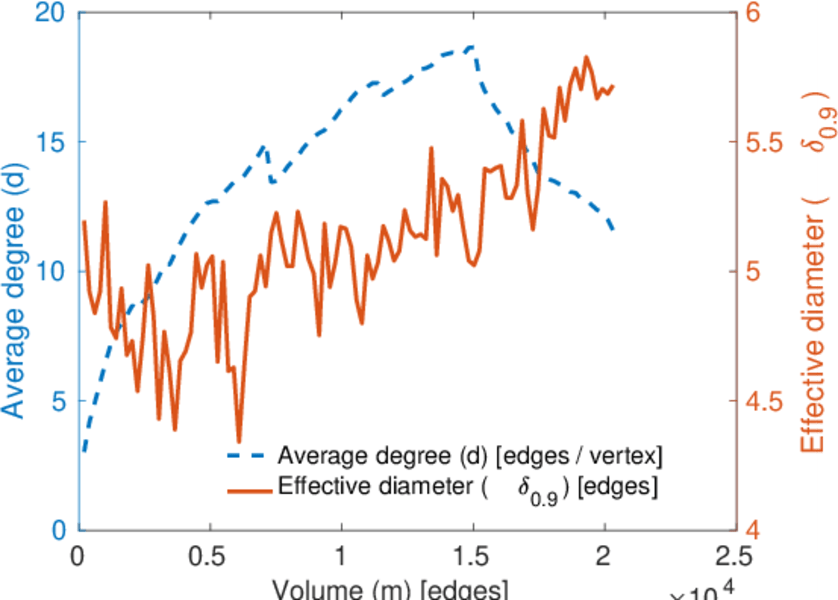
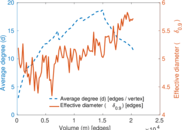
| Average degree | d = | 11.264 0
|
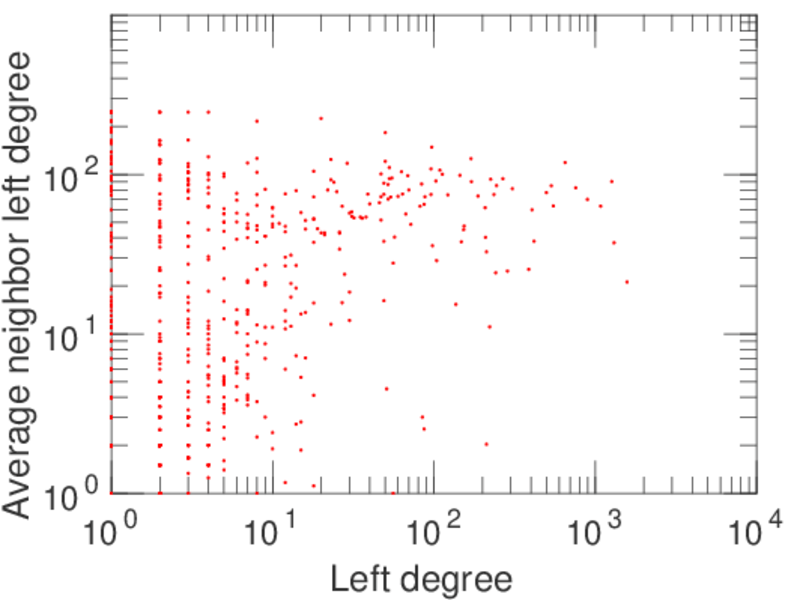
| Average left degree | d1 = | 26.341 1
|
| Average right degree | d2 = | 7.163 67
|
| Fill | p = | 0.004 155 03
|
| Average edge multiplicity | m̃ = | 2.236 18
|
| Size of LCC | N = | 2,901
|
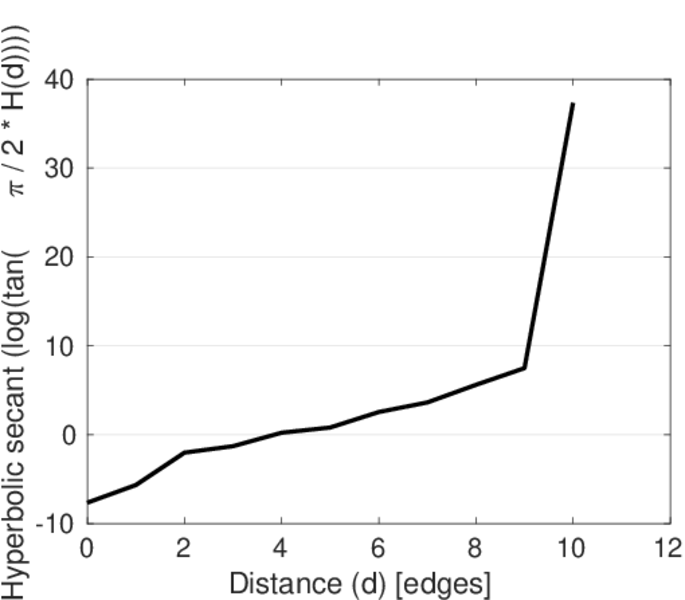
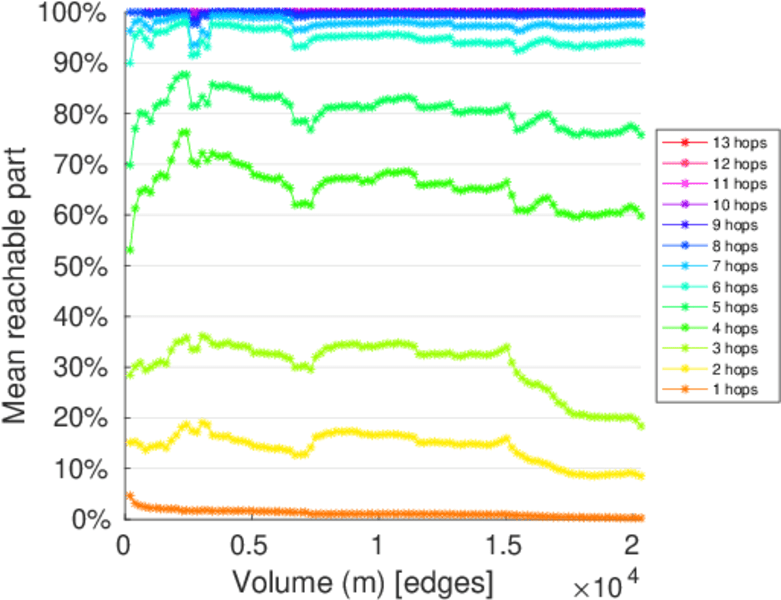
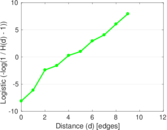
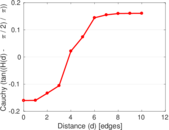
| Diameter | δ = | 13
|
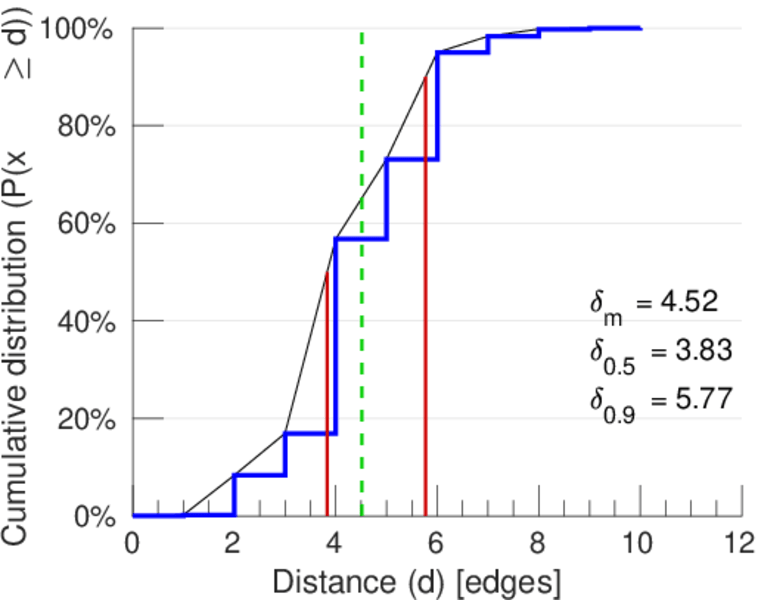
| 50-Percentile effective diameter | δ0.5 = | 3.830 73
|
| 90-Percentile effective diameter | δ0.9 = | 5.771 80
|
| Median distance | δM = | 4
|
| Mean distance | δm = | 4.516 62
|
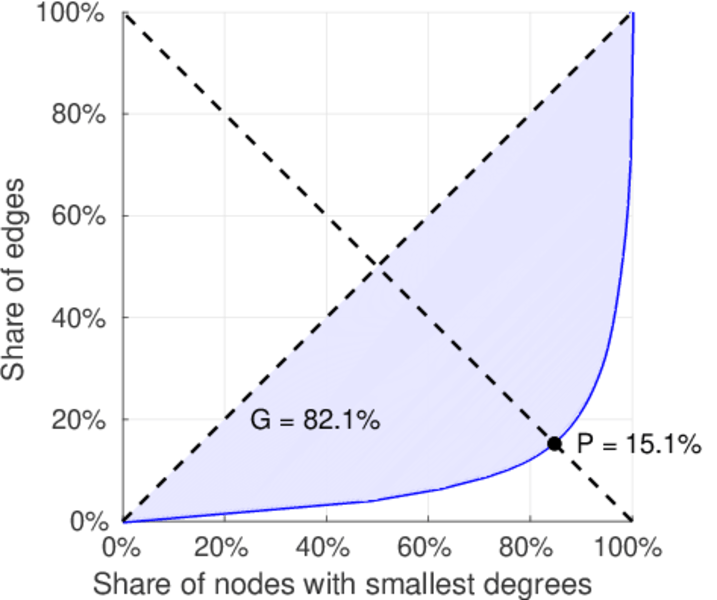
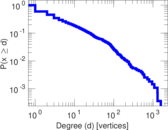
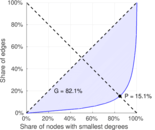
| Gini coefficient | G = | 0.826 546
|
| Balanced inequality ratio | P = | 0.151 878
|
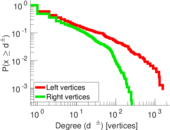
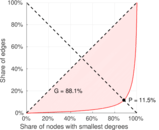
| Left balanced inequality ratio | P1 = | 0.114 924
|
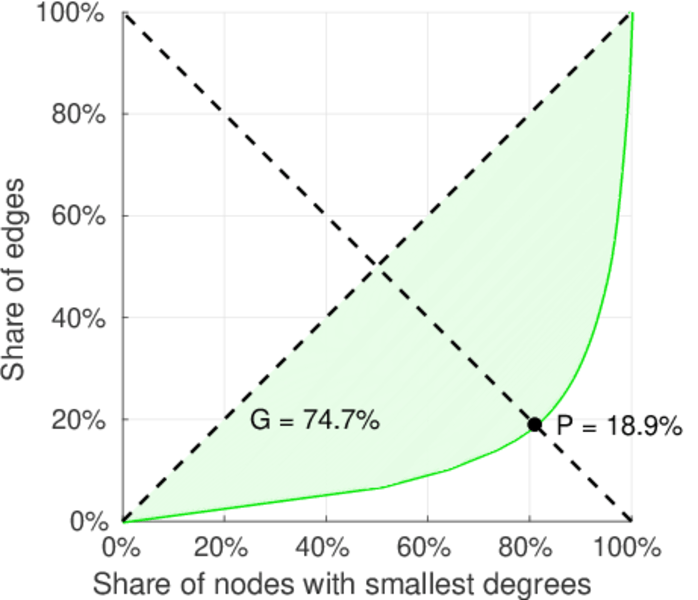
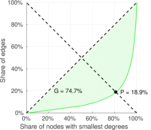
| Right balanced inequality ratio | P2 = | 0.188 537
|
| Relative edge distribution entropy | Her = | 0.814 746
|
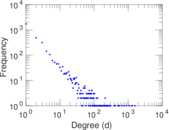
| Power law exponent | γ = | 2.670 98
|
| Tail power law exponent | γt = | 1.971 00
|
| Tail power law exponent with p | γ3 = | 1.971 00
|
| p-value | p = | 0.000 00
|
| Left tail power law exponent with p | γ3,1 = | 1.731 00
|
| Left p-value | p1 = | 0.004 000 00
|
| Right tail power law exponent with p | γ3,2 = | 2.071 00
|
| Right p-value | p2 = | 0.000 00
|
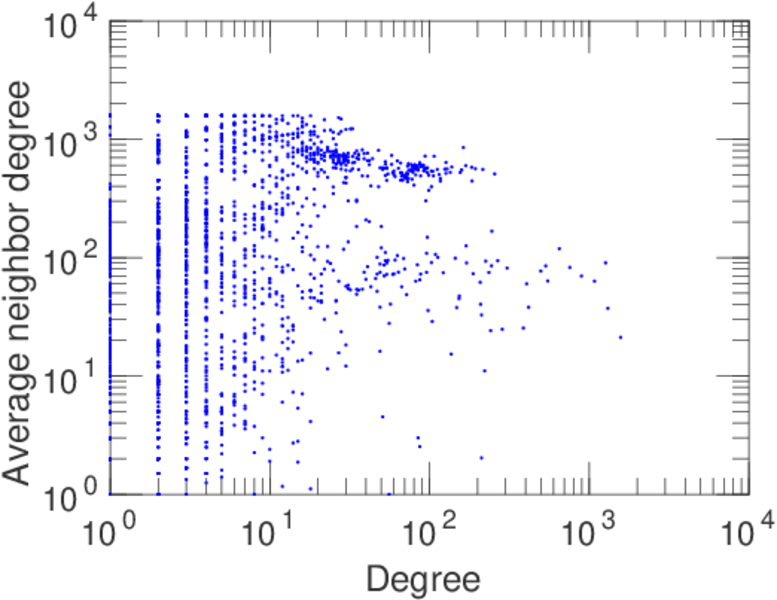
| Degree assortativity | ρ = | −0.194 944
|
| Degree assortativity p-value | pρ = | 1.738 77 × 10−78
|
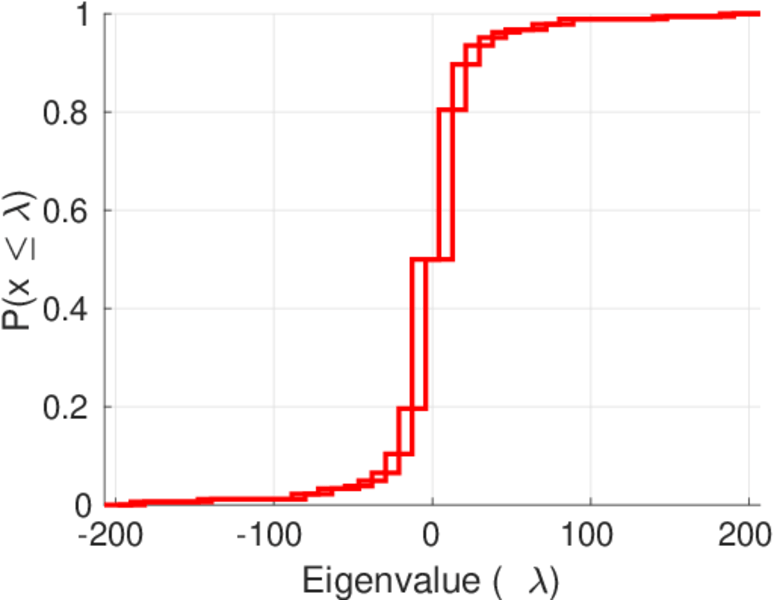
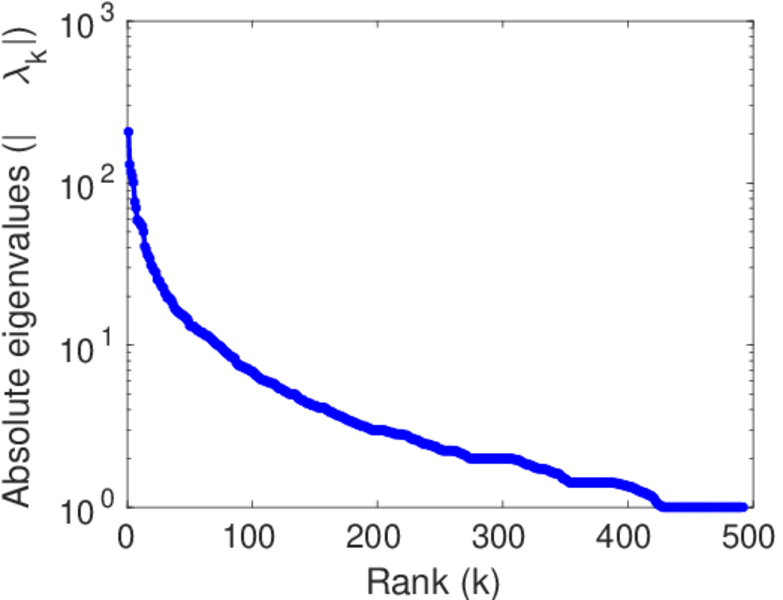
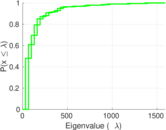
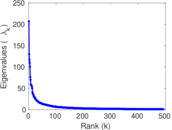
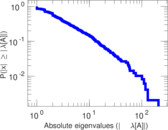
| Spectral norm | α = | 207.063
|
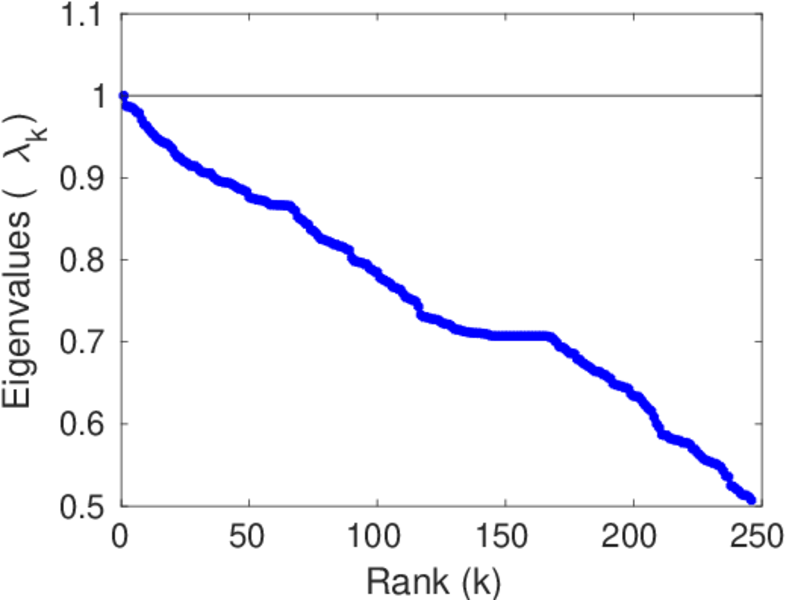
| Algebraic connectivity | a = | 0.024 403 4
|
| Spectral separation | |λ1[A] / λ2[A]| = | 1.592 75
|
| Controllability | C = | 2,135
|
| Relative controllability | Cr = | 0.608 435
|
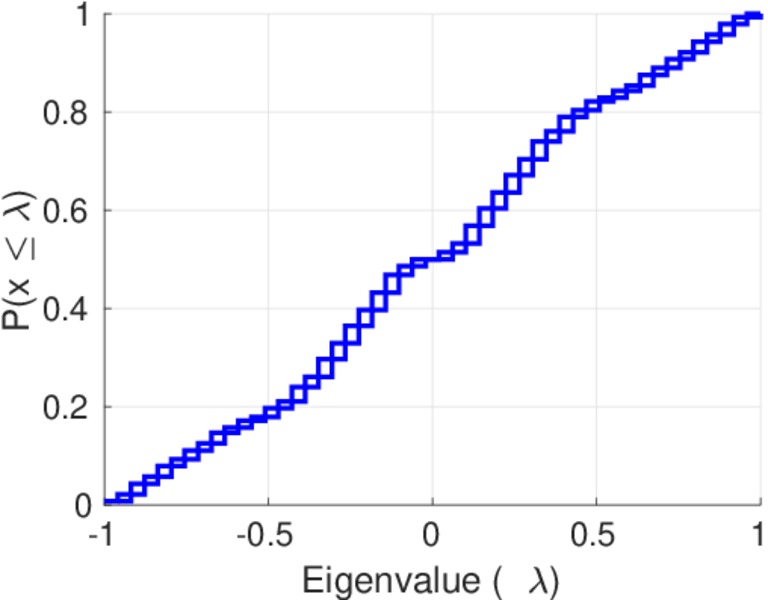
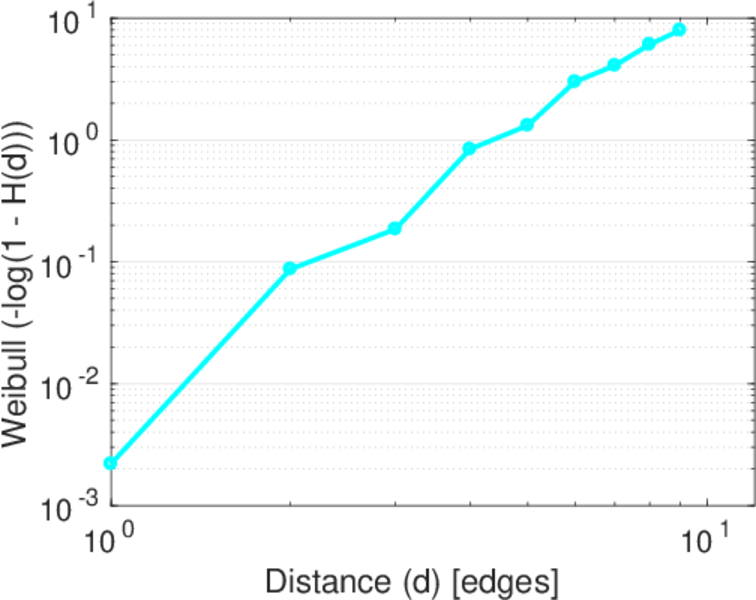
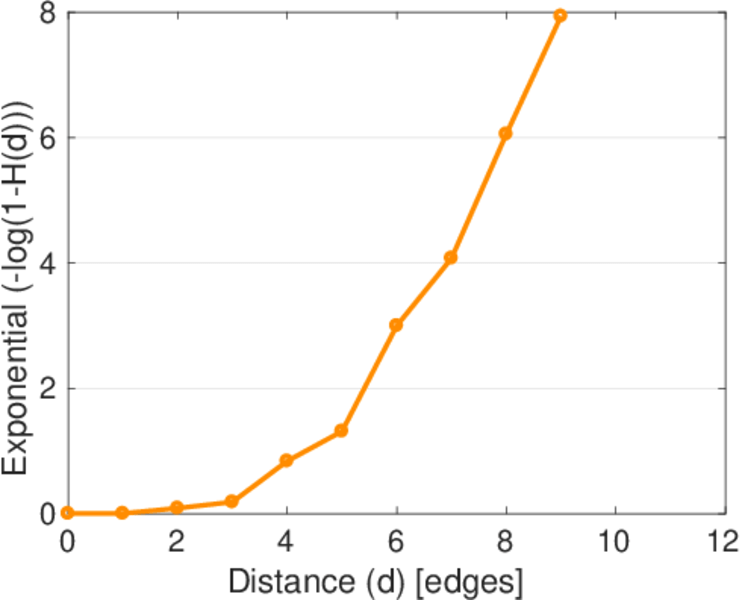
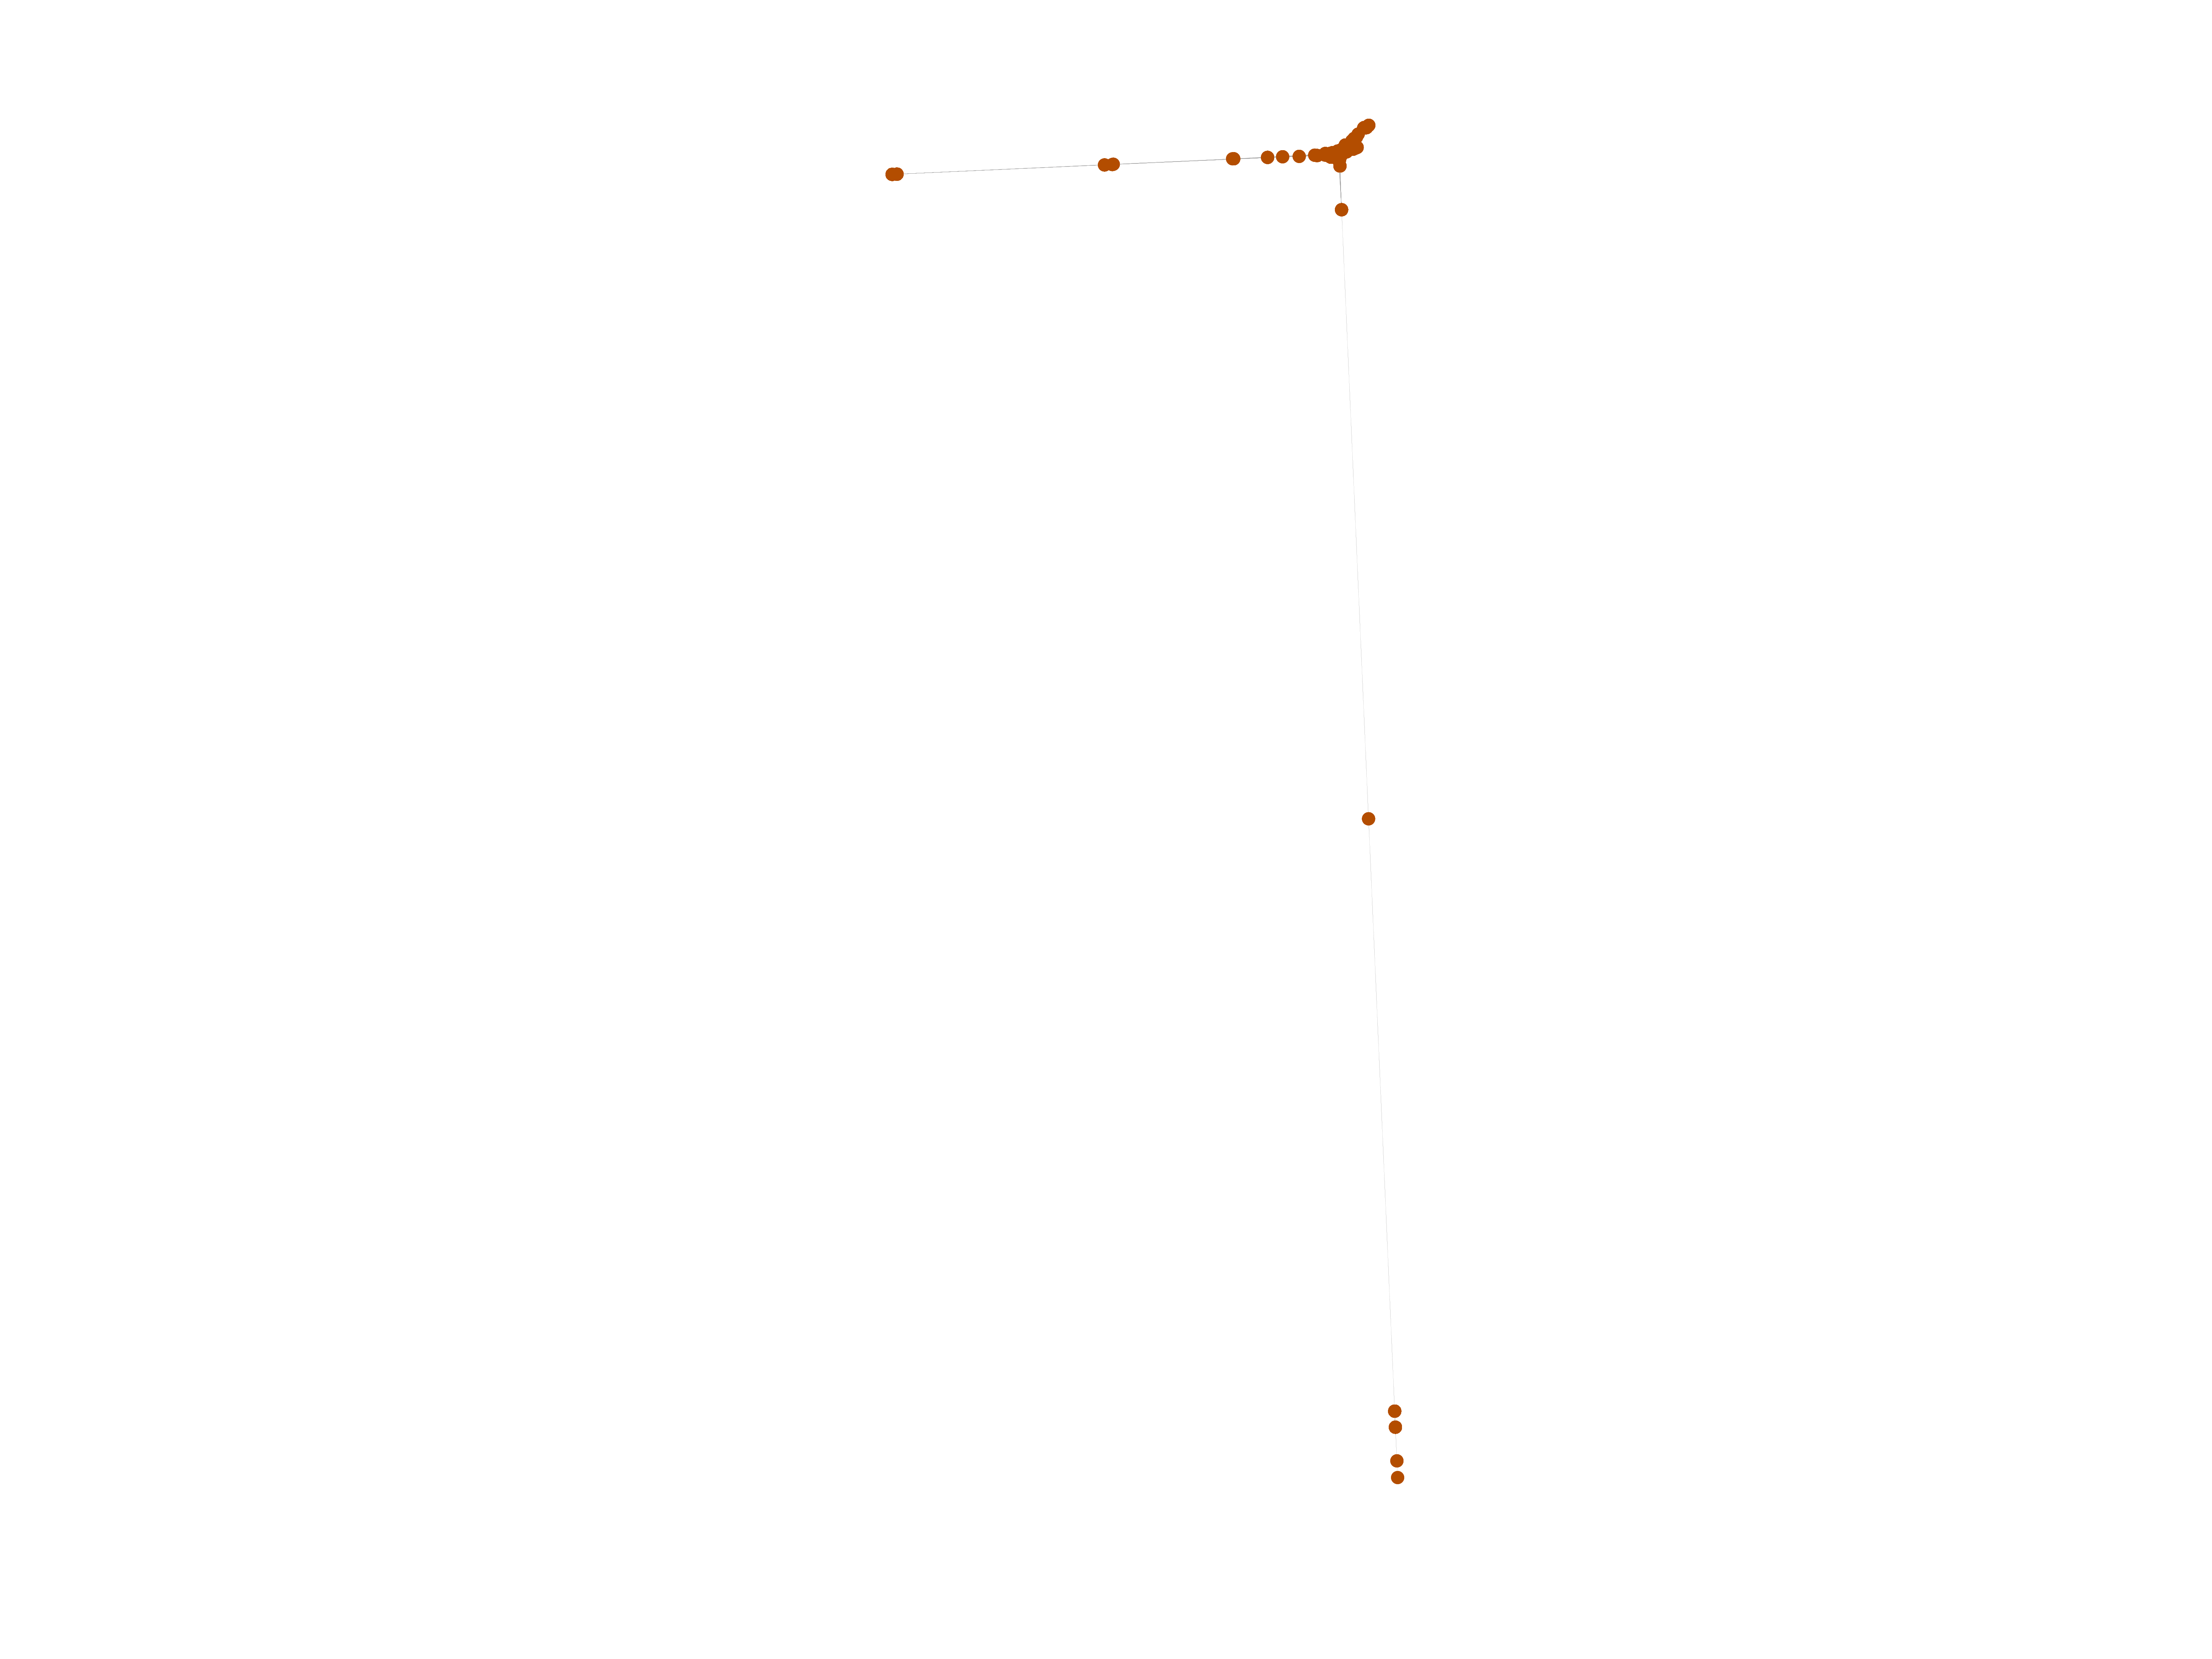
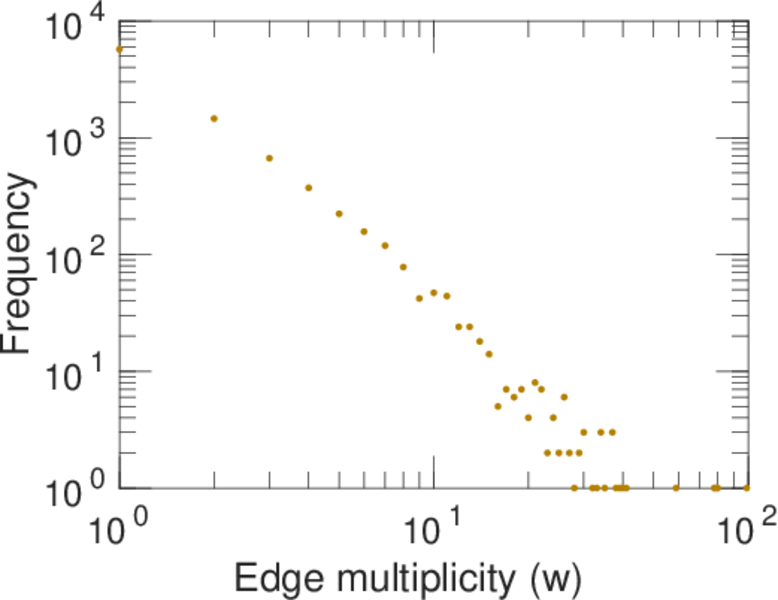
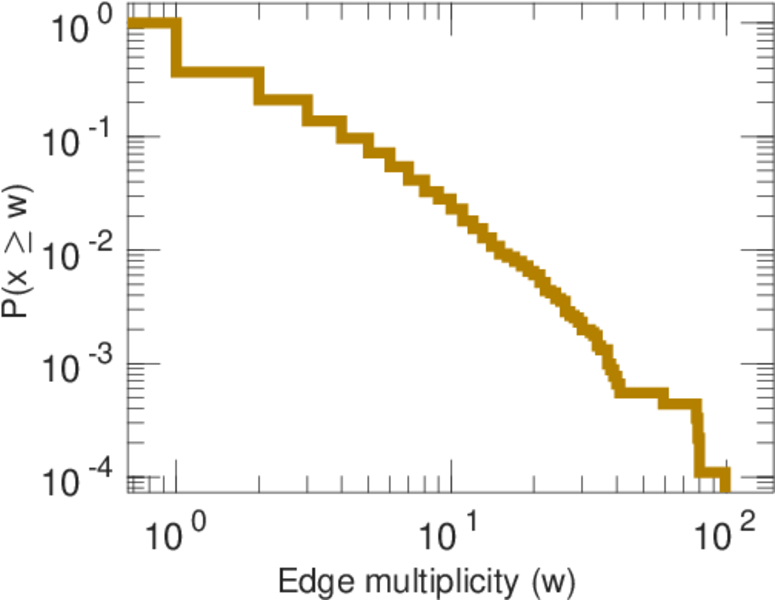
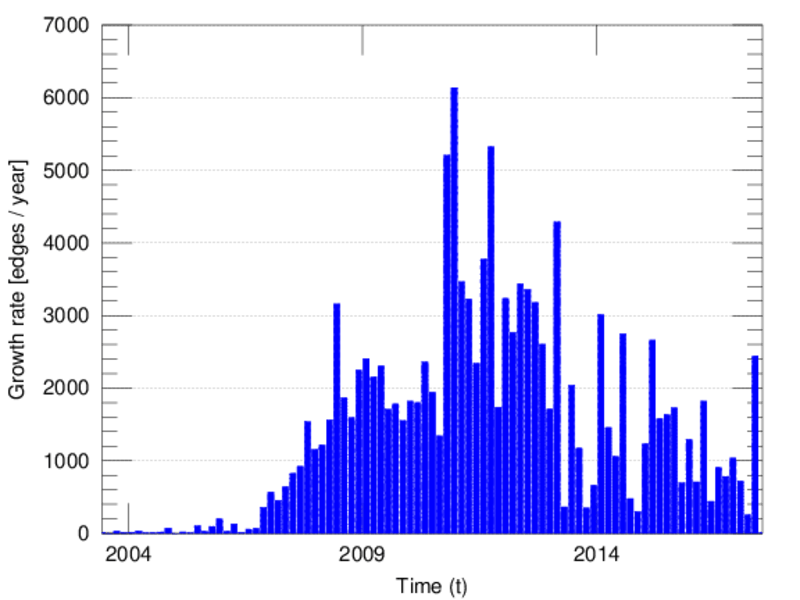
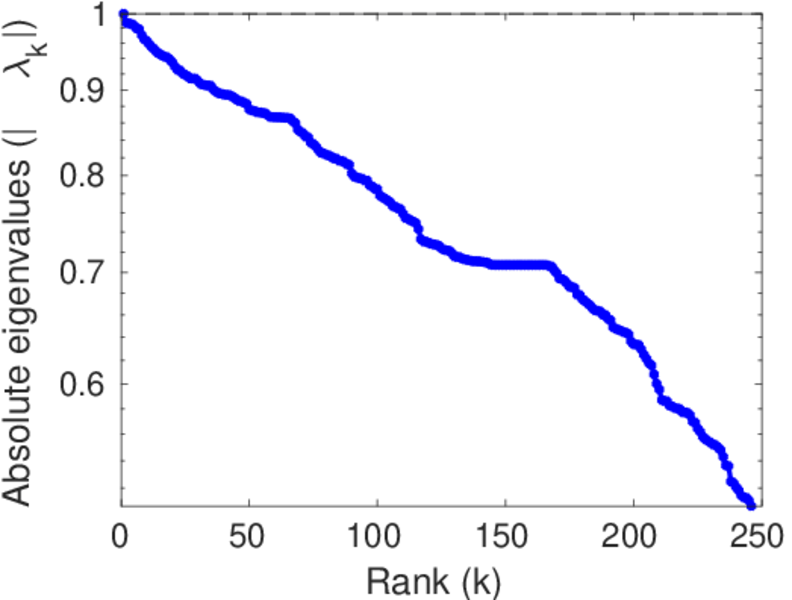
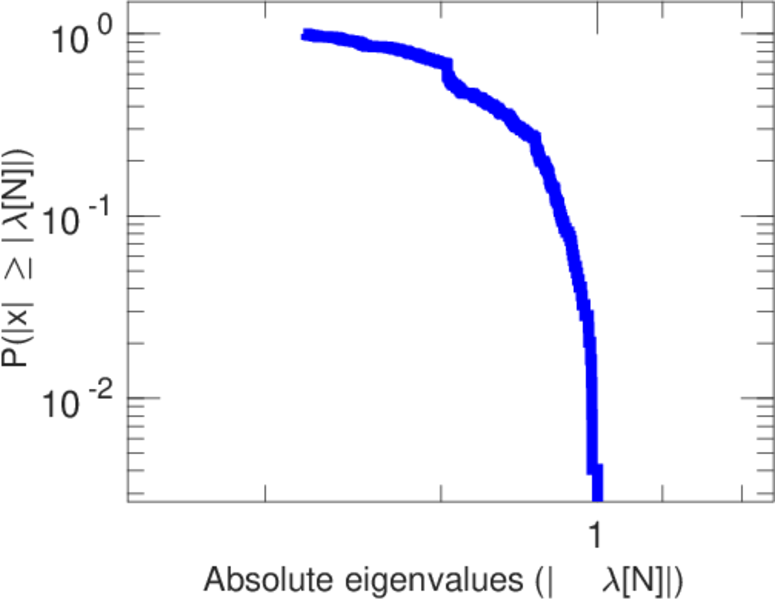
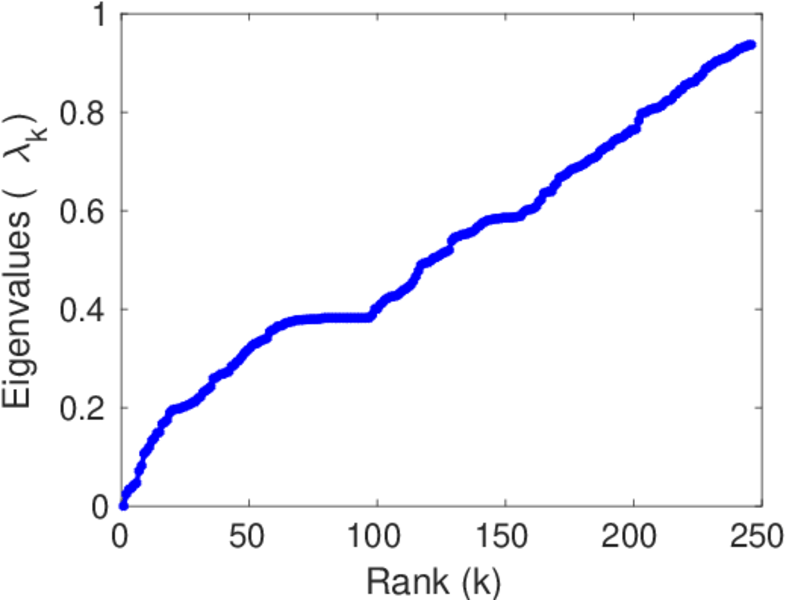
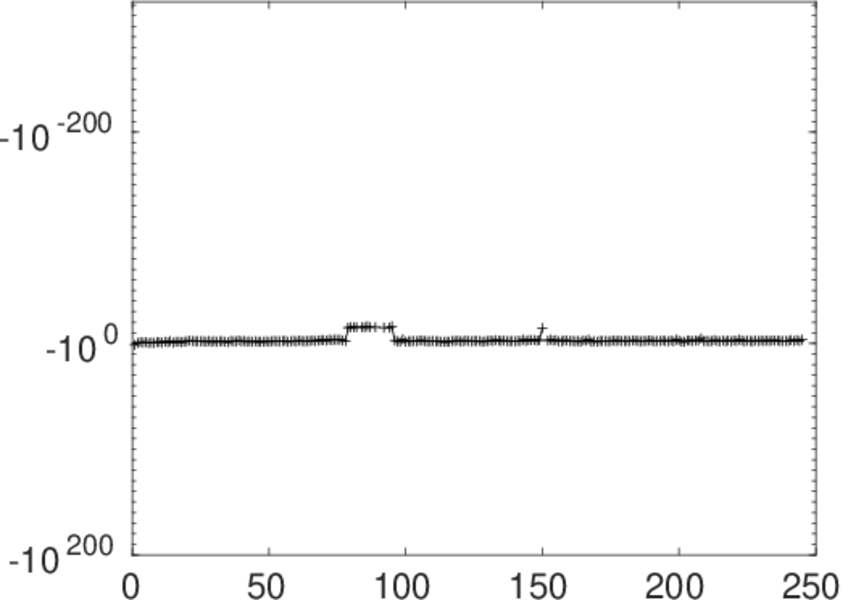
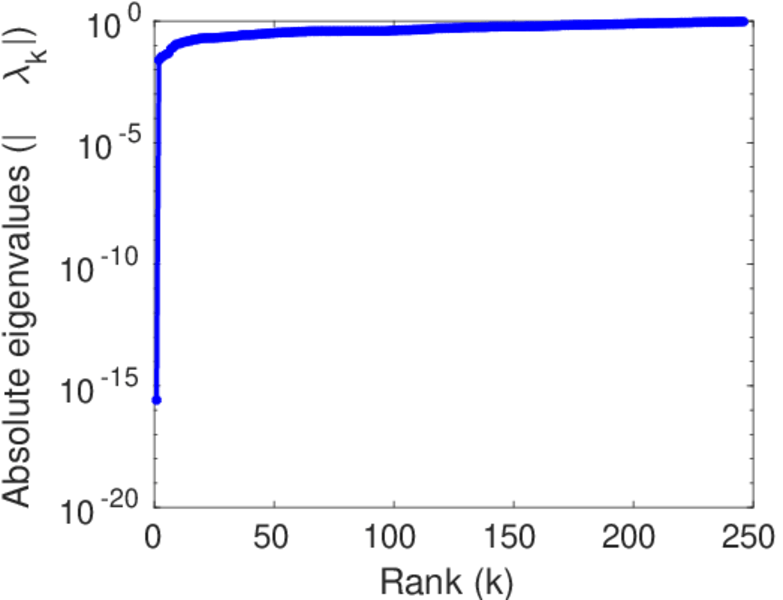
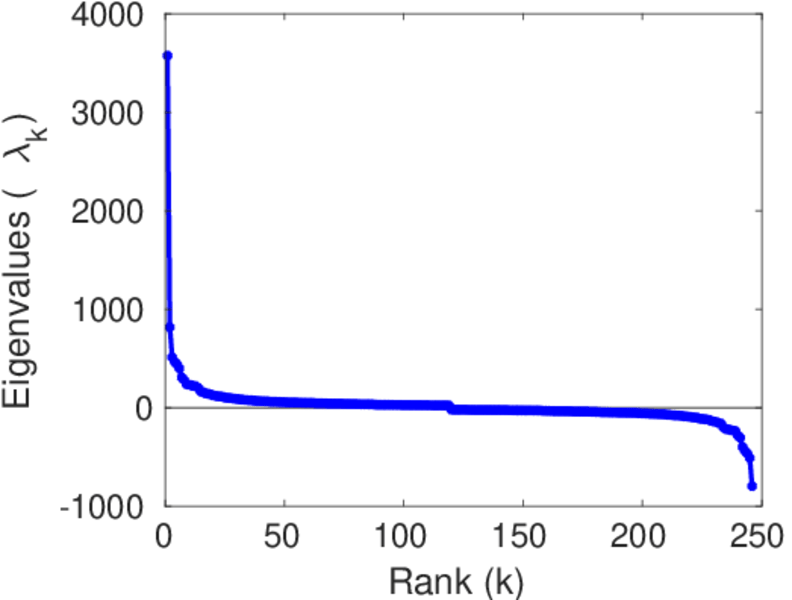
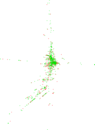
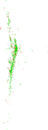
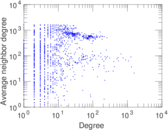
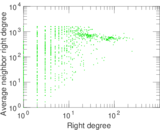
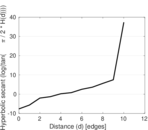
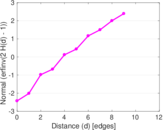
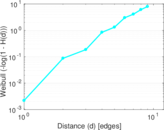
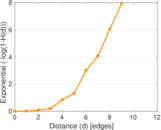
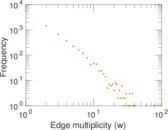
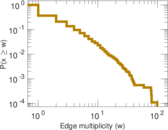
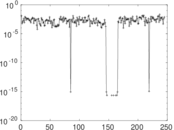
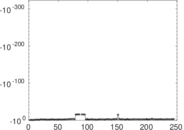
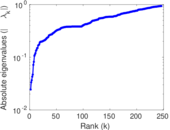
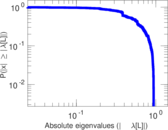
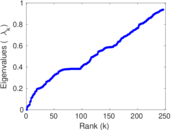
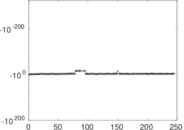
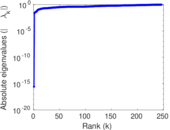
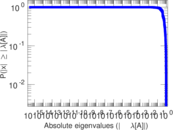
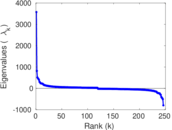
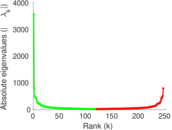
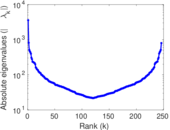
Plots


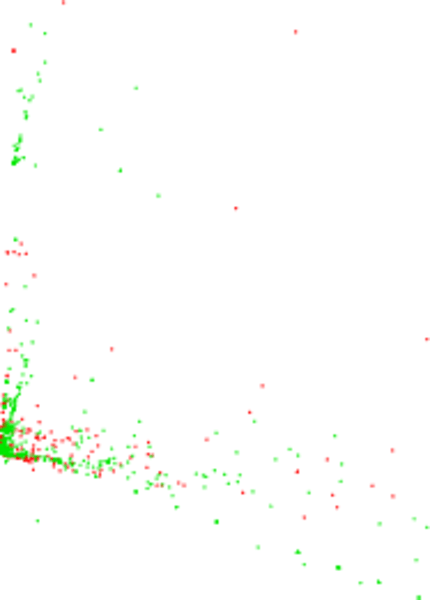
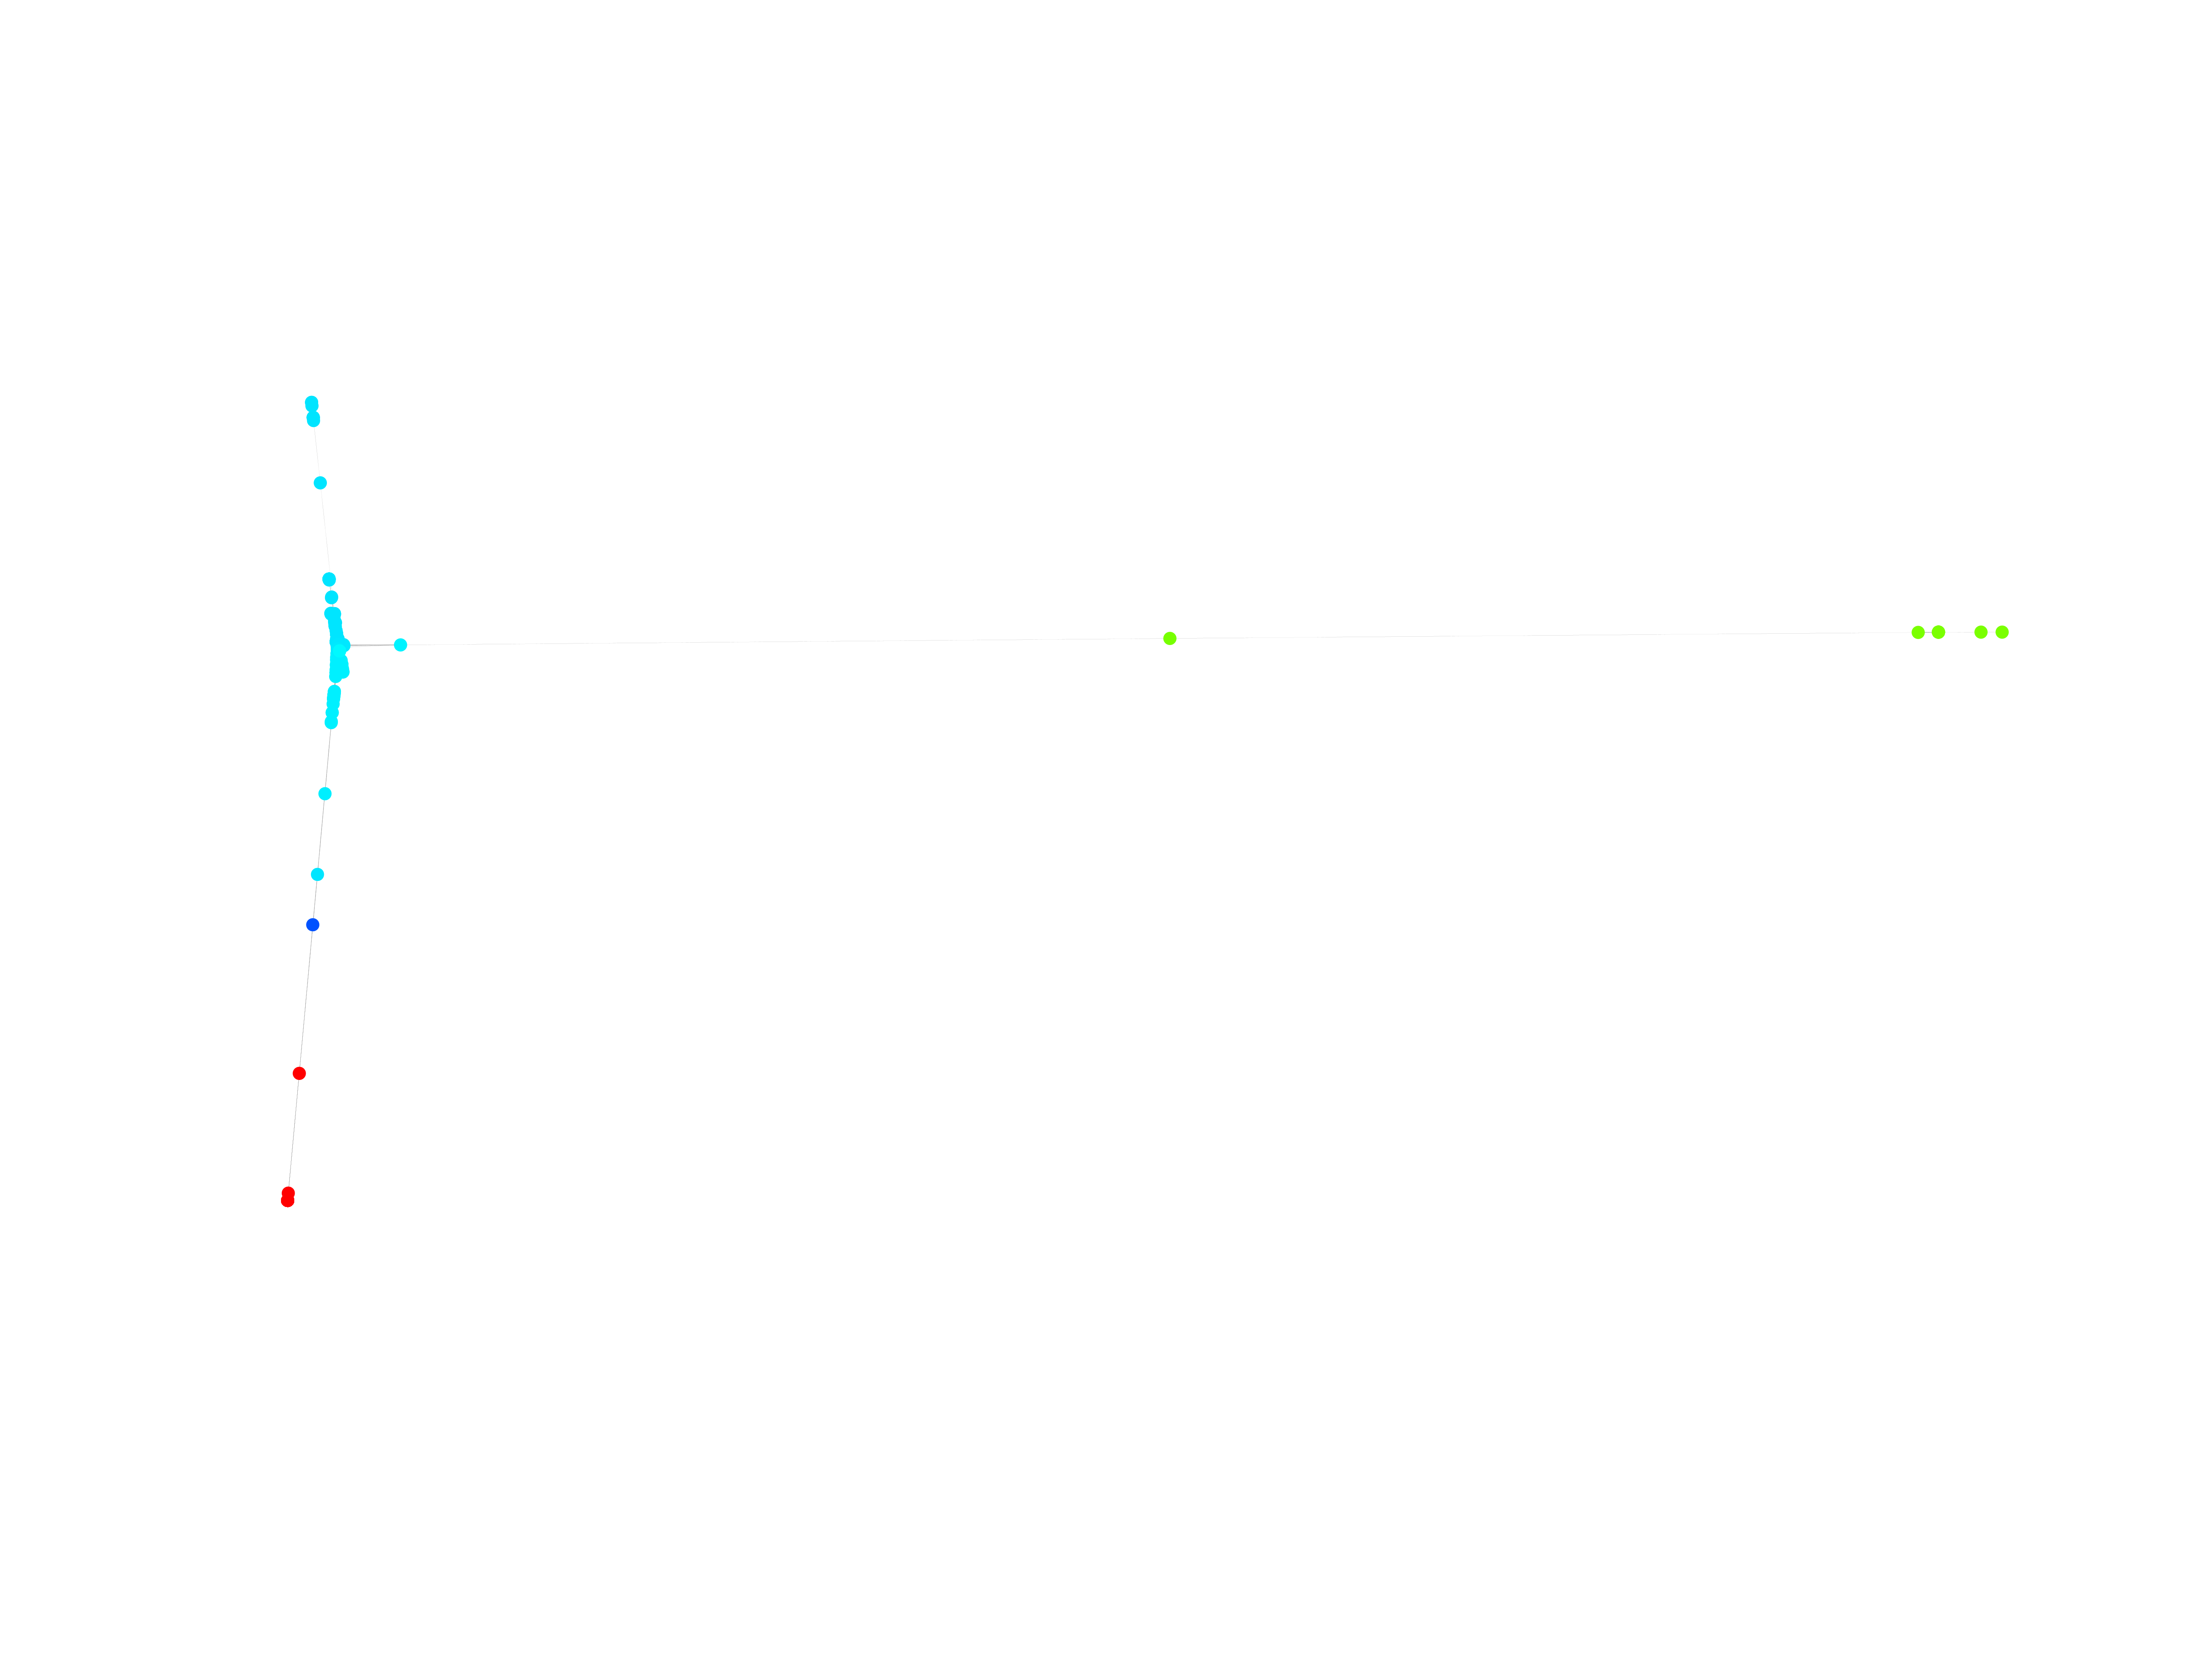
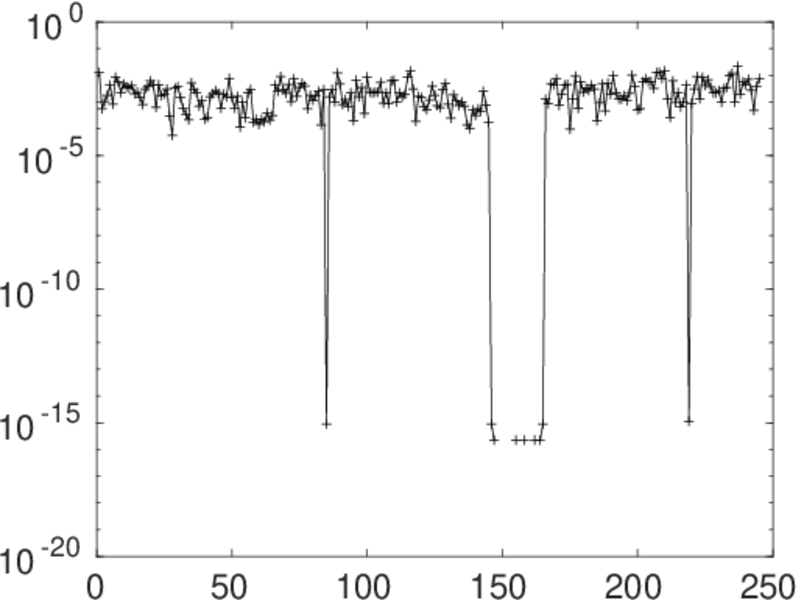
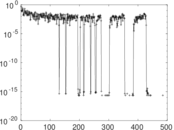
Matrix decompositions plots


Downloads
References
|
[1]
|
Jérôme Kunegis.
KONECT – The Koblenz Network Collection.
In Proc. Int. Conf. on World Wide Web Companion, pages
1343–1350, 2013.
[ http ]
|
|
[2]
|
Wikimedia Foundation.
Wikimedia downloads.
http://dumps.wikimedia.org/, January 2010.
|
 KONECT ‣ Networks ‣
Buy Me a Coffee
KONECT ‣ Networks ‣
Buy Me a Coffee