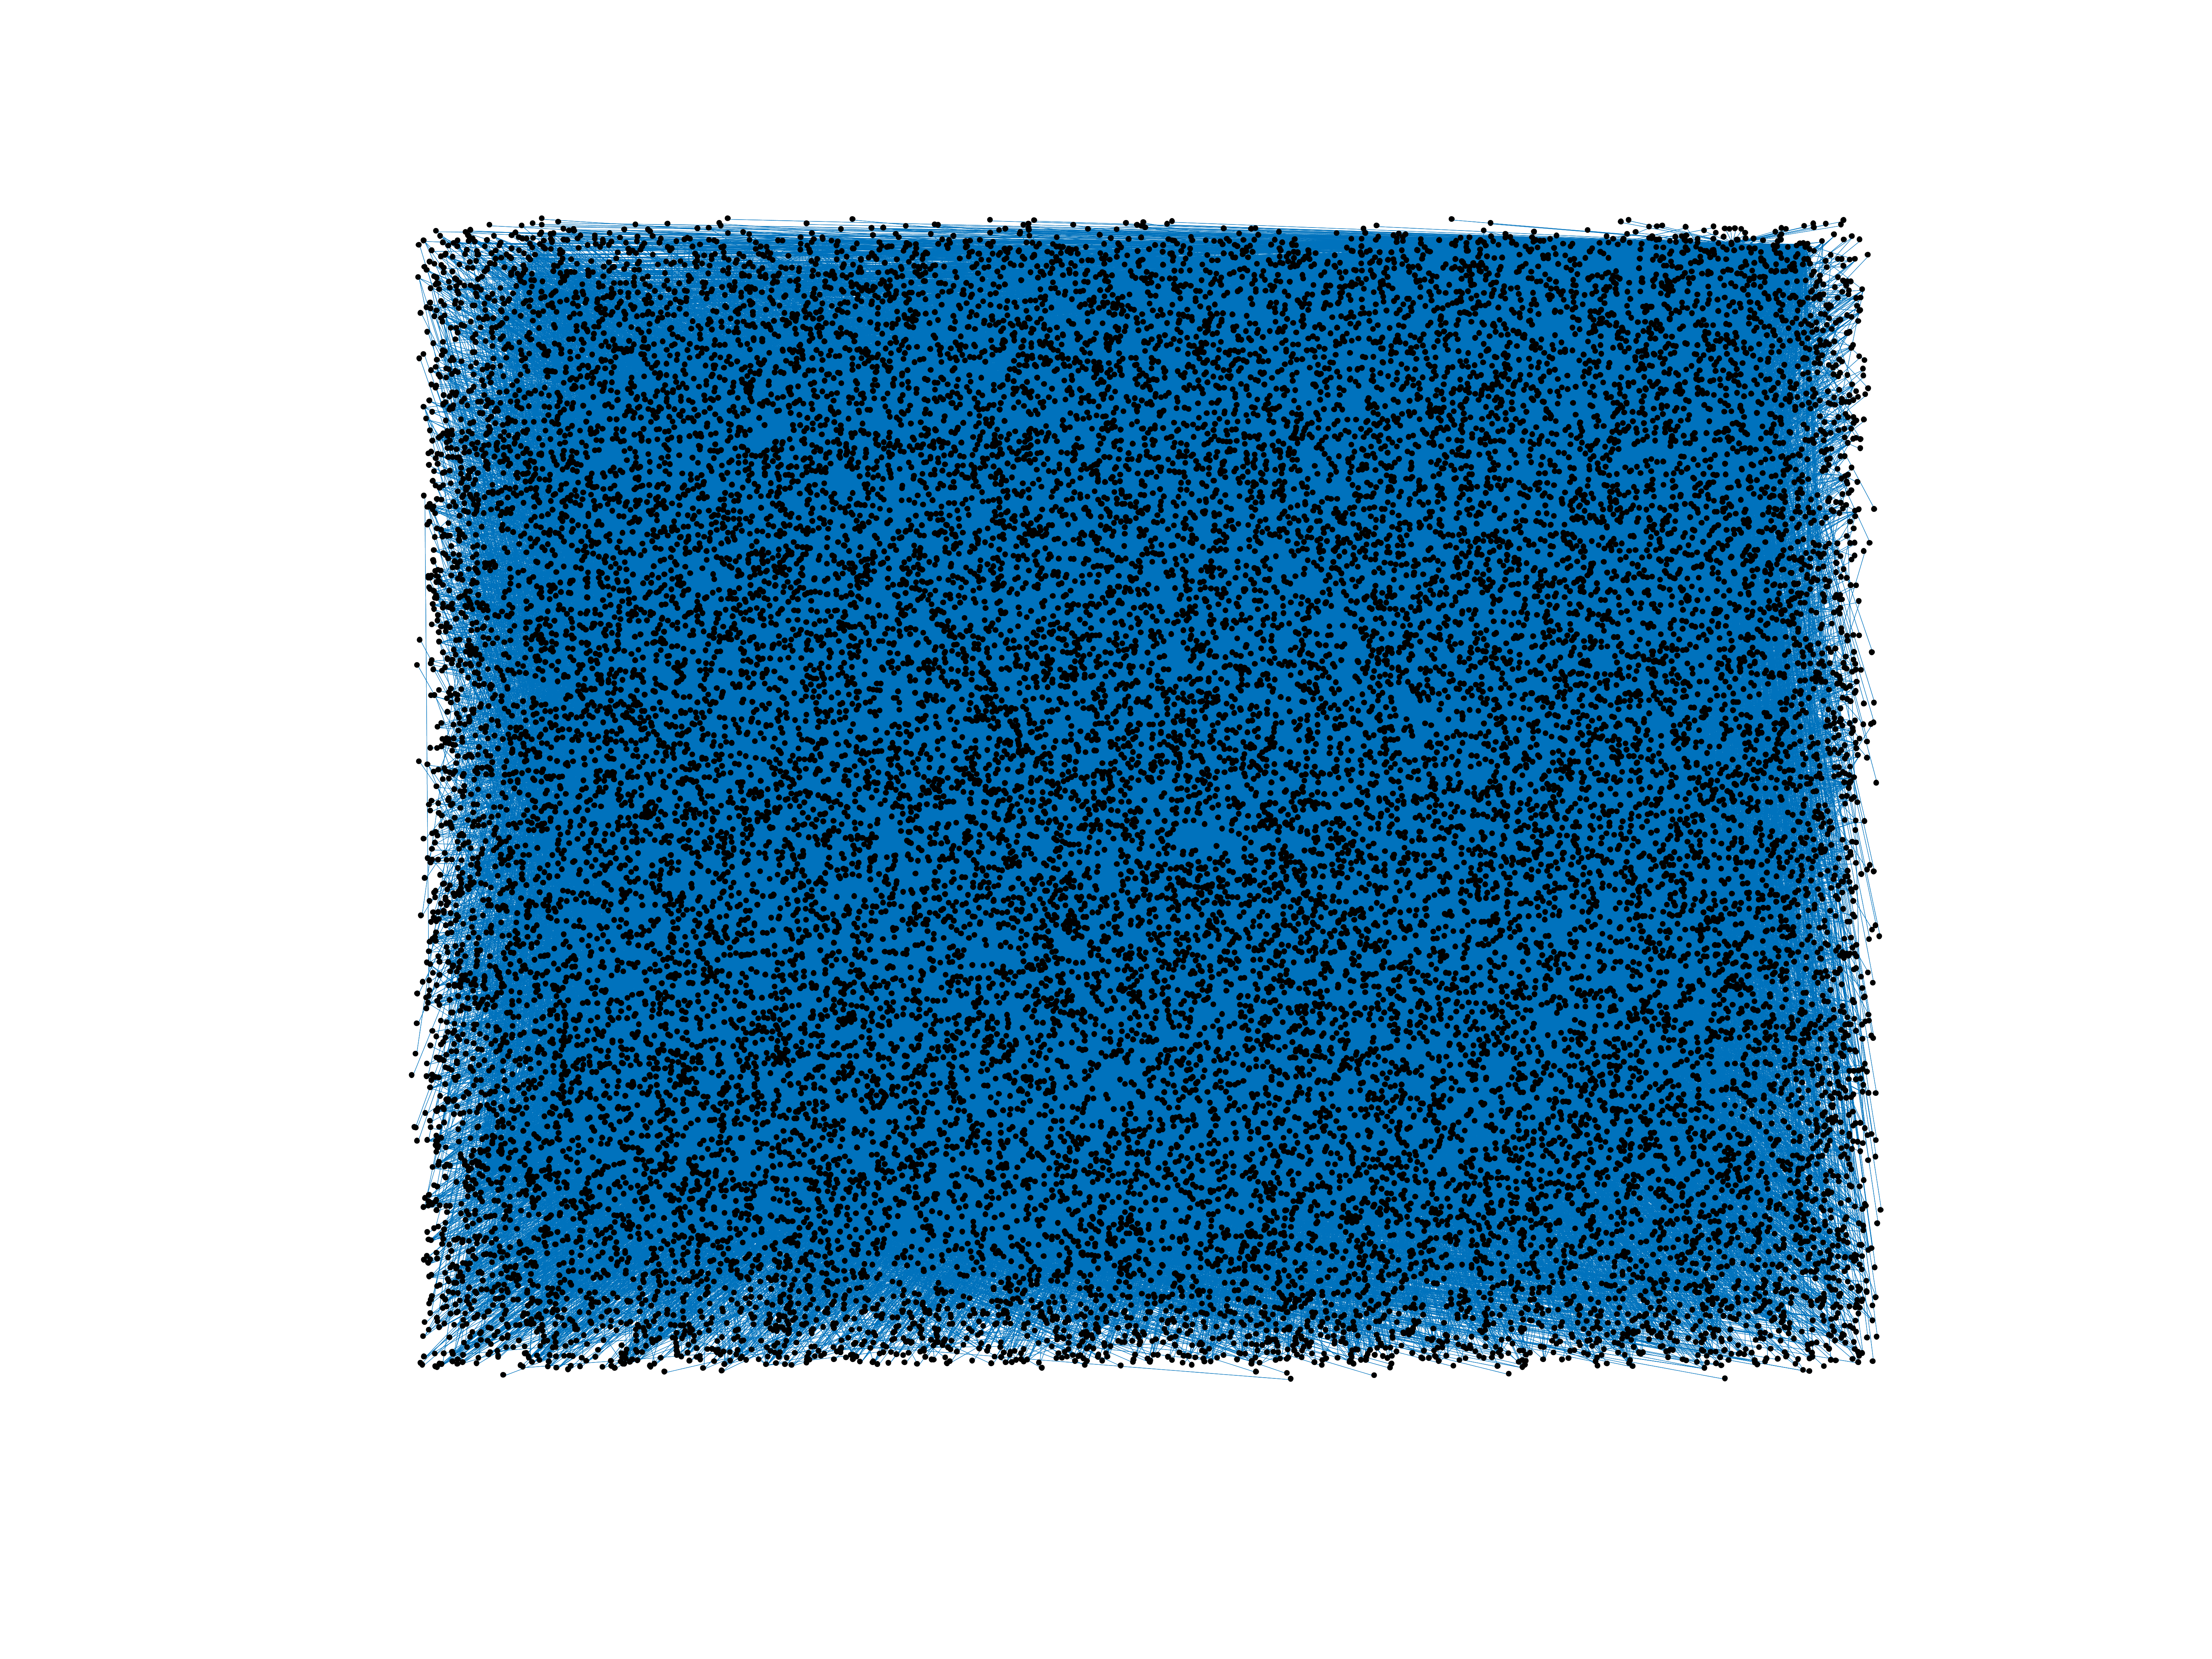
Wikipedia edits (xmf)
This is the bipartite edit network of the Mingrelian Wikipedia. It contains
users and pages from the Mingrelian Wikipedia, connected by edit events. Each
edge represents an edit. The dataset includes the timestamp of each edit.
Metadata
Statistics
| Size | n = | 25,928
|
| Left size | n1 = | 754
|
| Right size | n2 = | 25,174
|
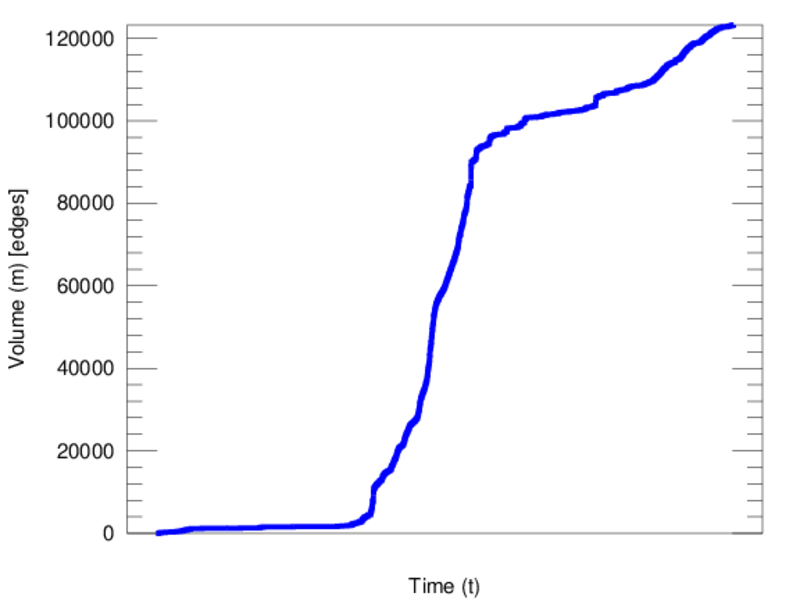
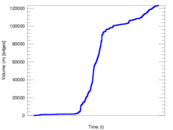
| Volume | m = | 123,243
|
| Unique edge count | m̿ = | 65,531
|
| Wedge count | s = | 178,484,046
|
| Claw count | z = | 519,488,880,810
|
| Cross count | x = | 1,340,293,970,231,490
|
| Square count | q = | 72,502,505
|
| 4-Tour count | T4 = | 1,294,181,214
|
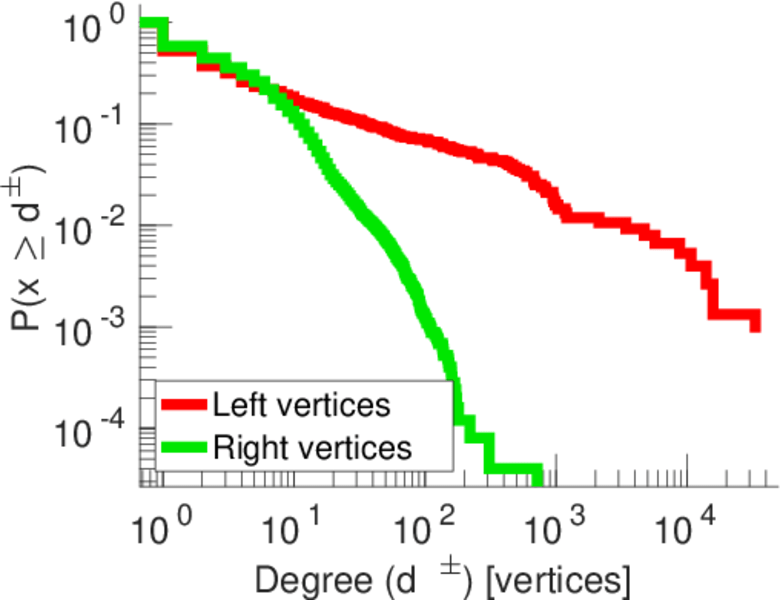
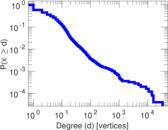
| Maximum degree | dmax = | 33,204
|
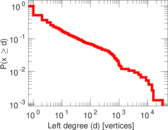
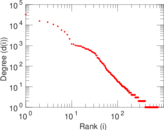
| Maximum left degree | d1max = | 33,204
|
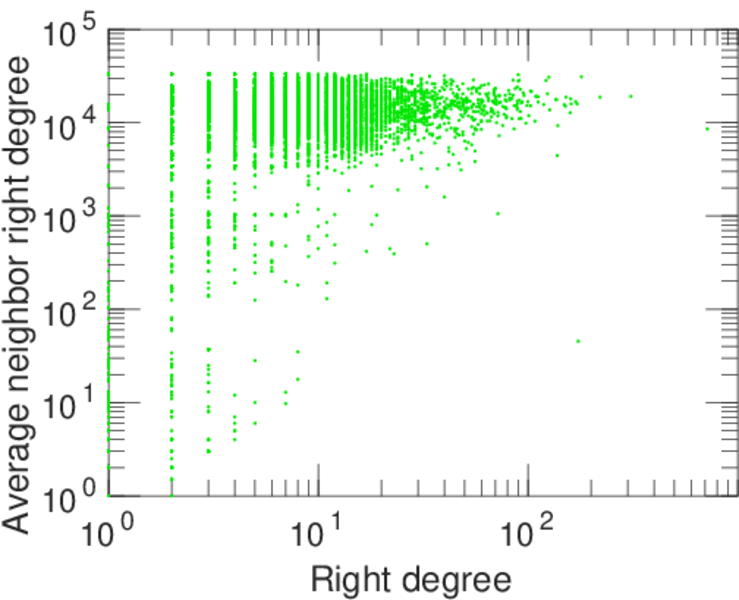
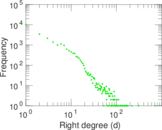
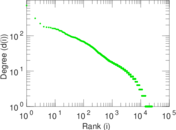
| Maximum right degree | d2max = | 717
|
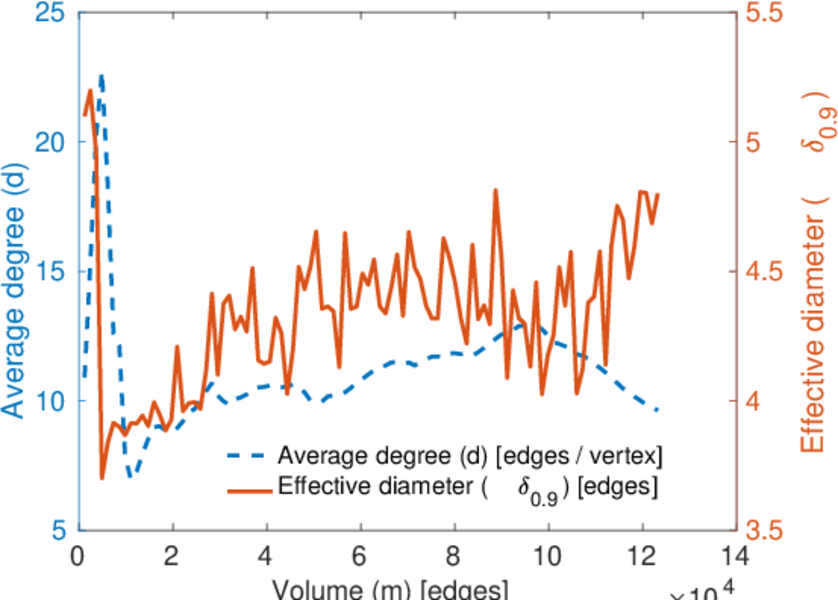
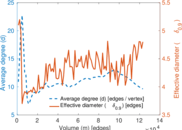
| Average degree | d = | 9.506 56
|
| Average left degree | d1 = | 163.452
|
| Average right degree | d2 = | 4.895 65
|
| Fill | p = | 0.003 452 42
|
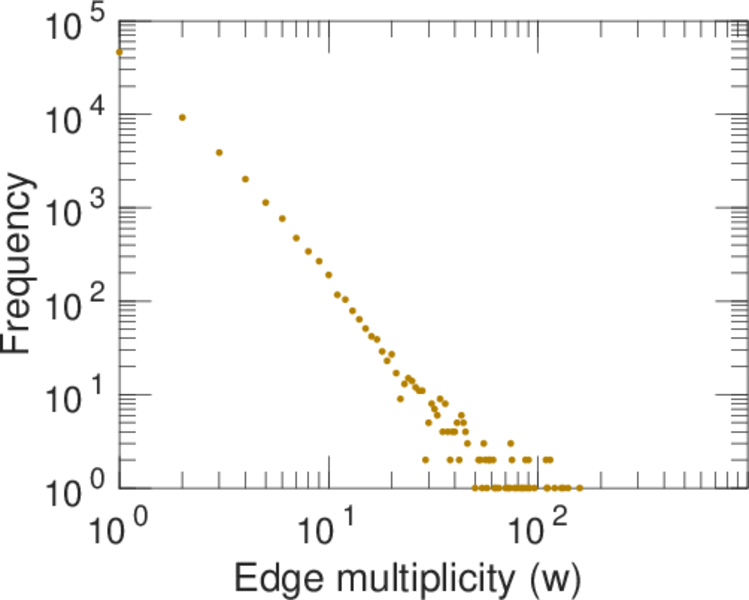
| Average edge multiplicity | m̃ = | 1.880 68
|
| Size of LCC | N = | 25,232
|
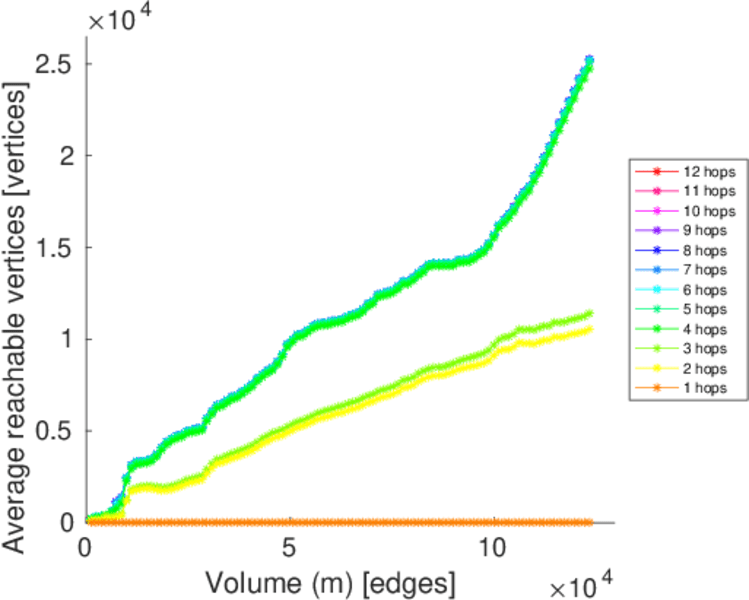
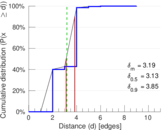
| Diameter | δ = | 11
|
| 50-Percentile effective diameter | δ0.5 = | 3.129 31
|
| 90-Percentile effective diameter | δ0.9 = | 3.847 36
|
| Median distance | δM = | 4
|
| Mean distance | δm = | 3.190 36
|
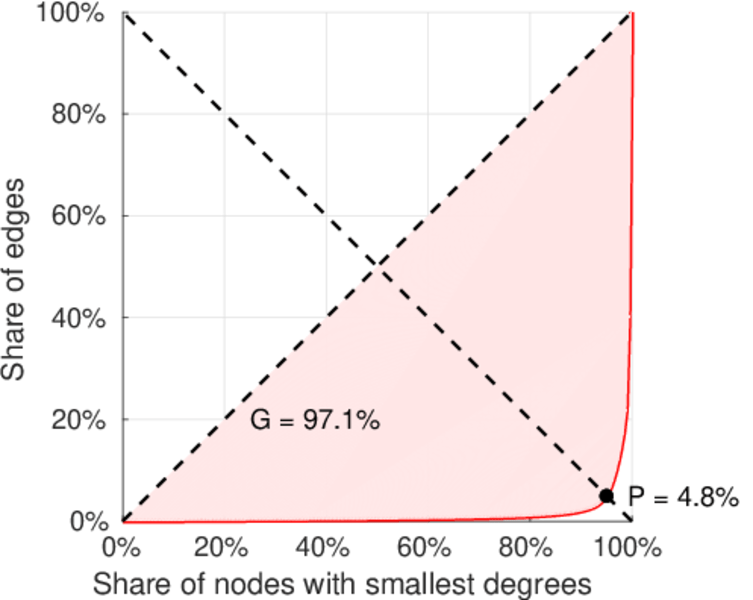
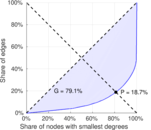
| Gini coefficient | G = | 0.794 542
|
| Balanced inequality ratio | P = | 0.188 112
|
| Left balanced inequality ratio | P1 = | 0.048 189 3
|
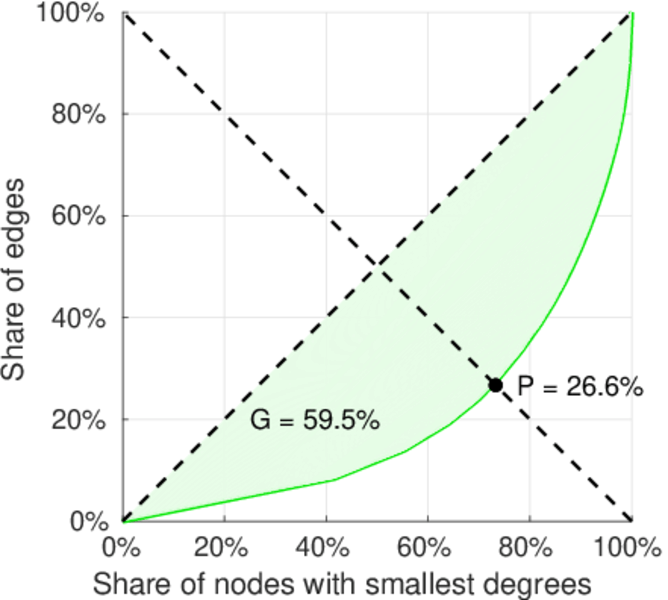
| Right balanced inequality ratio | P2 = | 0.265 605
|
| Relative edge distribution entropy | Her = | 0.707 074
|
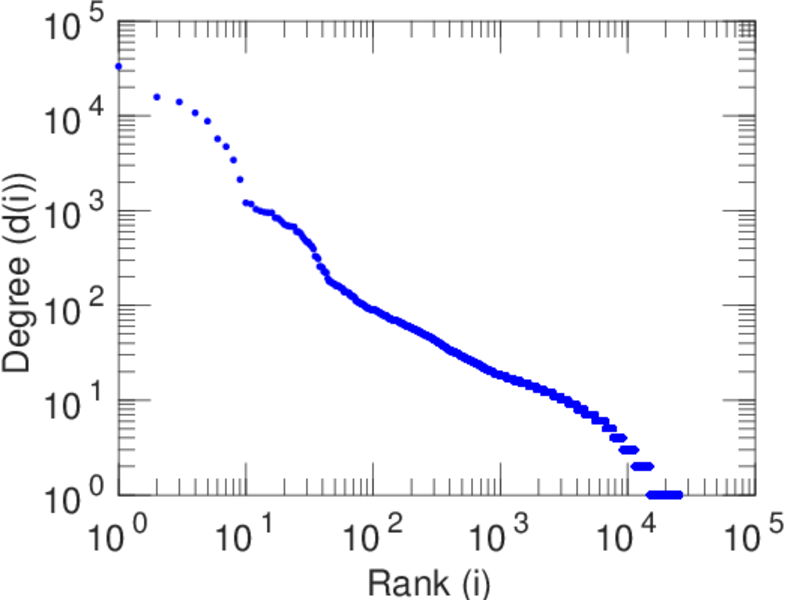
| Power law exponent | γ = | 2.518 56
|
| Tail power law exponent | γt = | 3.221 00
|
| Tail power law exponent with p | γ3 = | 3.221 00
|
| p-value | p = | 0.000 00
|
| Left tail power law exponent with p | γ3,1 = | 1.511 00
|
| Left p-value | p1 = | 0.008 000 00
|
| Right tail power law exponent with p | γ3,2 = | 4.551 00
|
| Right p-value | p2 = | 0.002 000 00
|
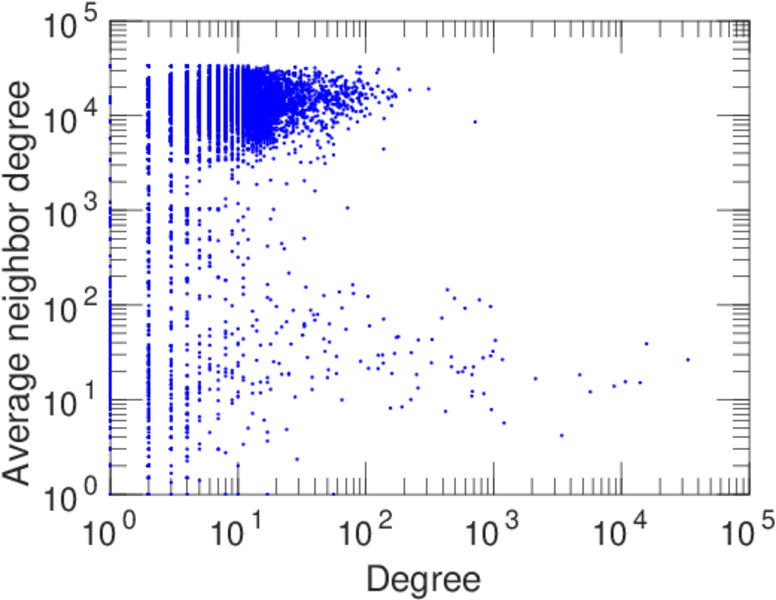
| Degree assortativity | ρ = | −0.314 150
|
| Degree assortativity p-value | pρ = | 0.000 00
|
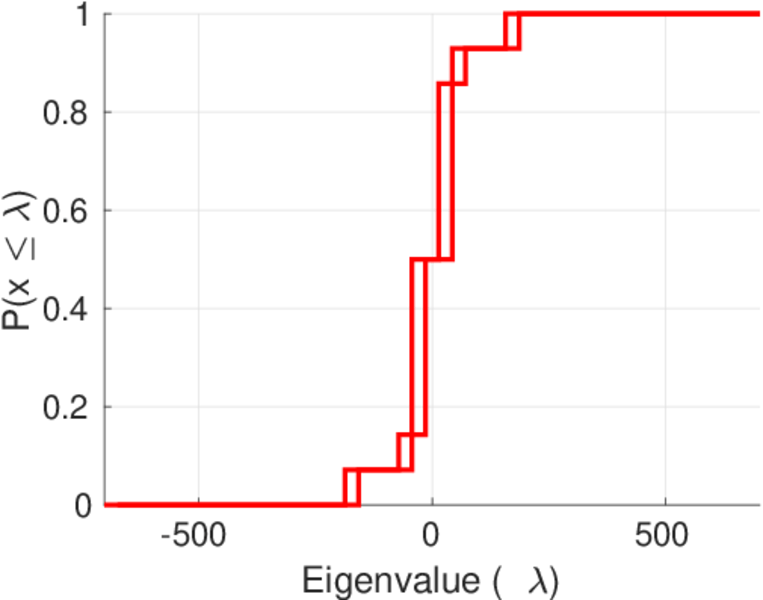
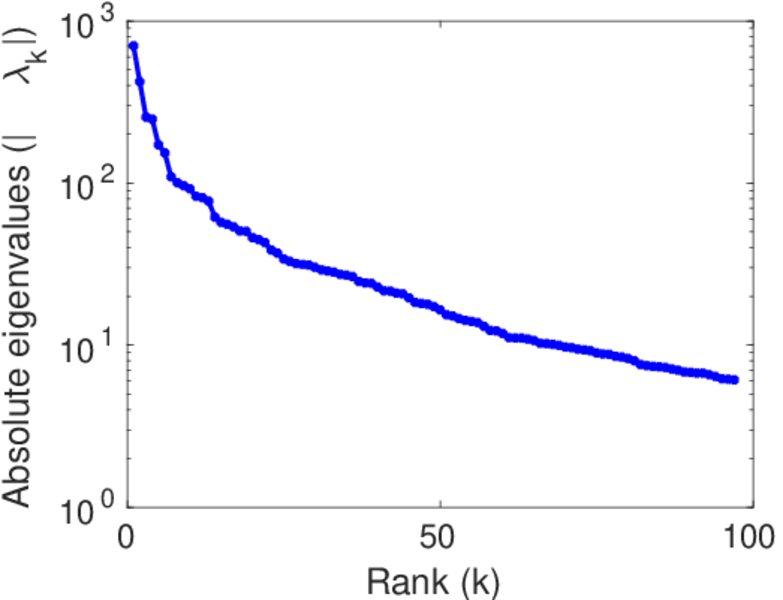
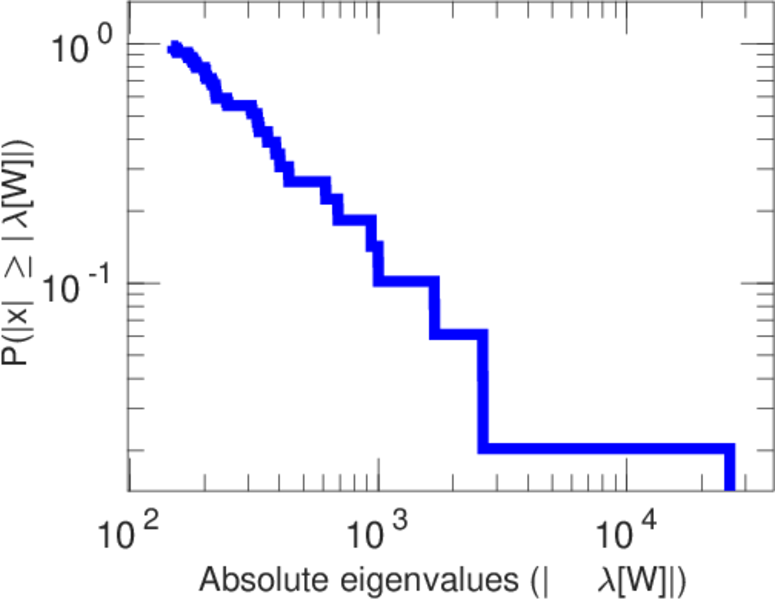
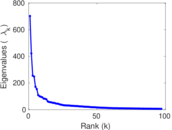
| Spectral norm | α = | 701.899
|
| Algebraic connectivity | a = | 0.060 732 9
|
| Spectral separation | |λ1[A] / λ2[A]| = | 1.664 25
|
| Controllability | C = | 24,246
|
| Relative controllability | Cr = | 0.946 740
|
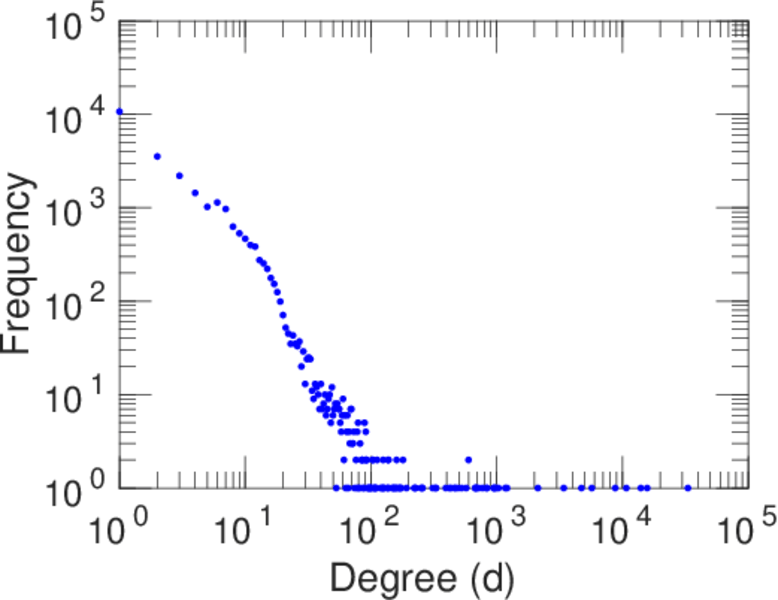
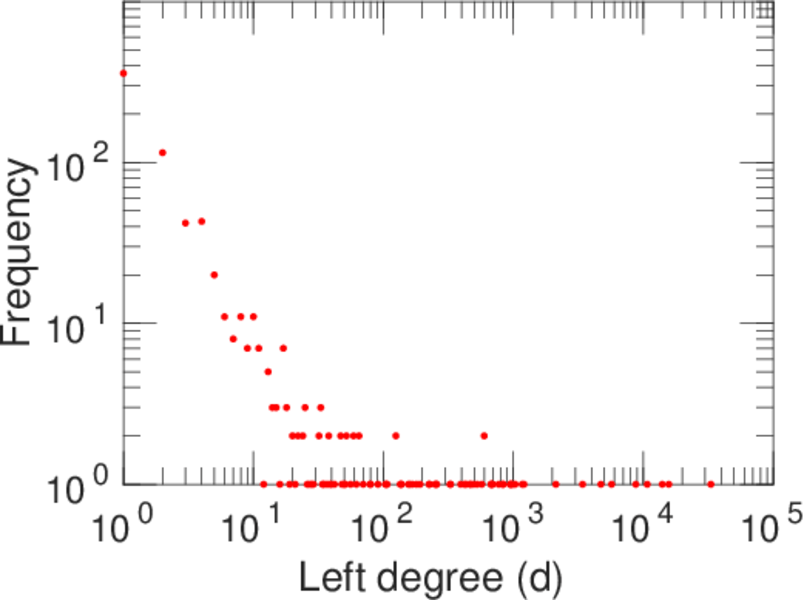
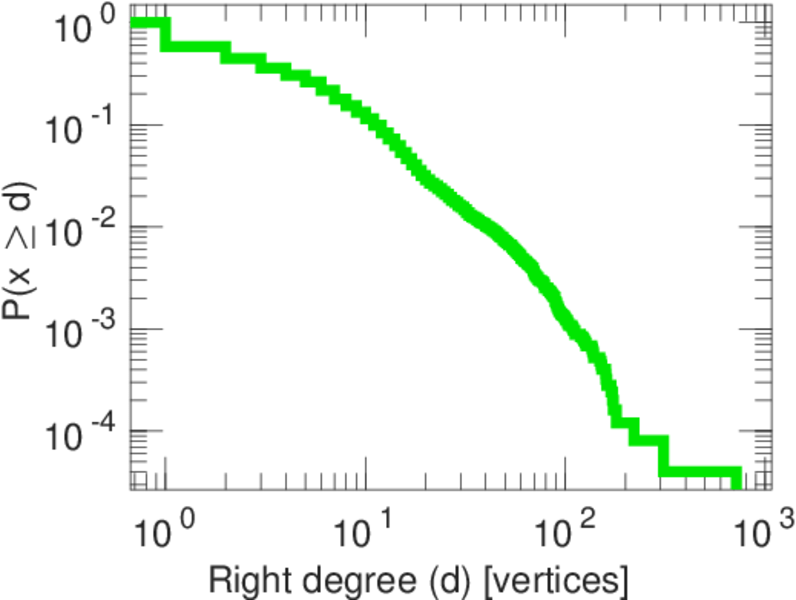
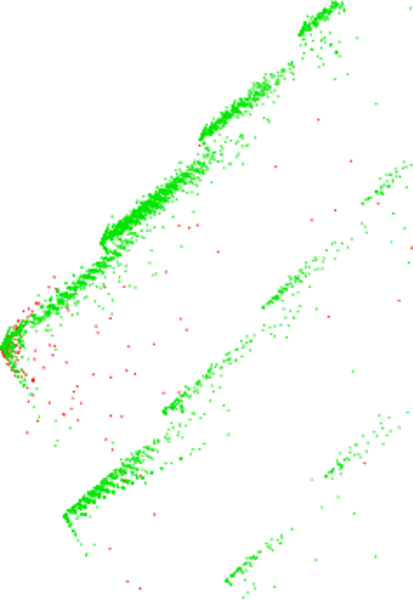
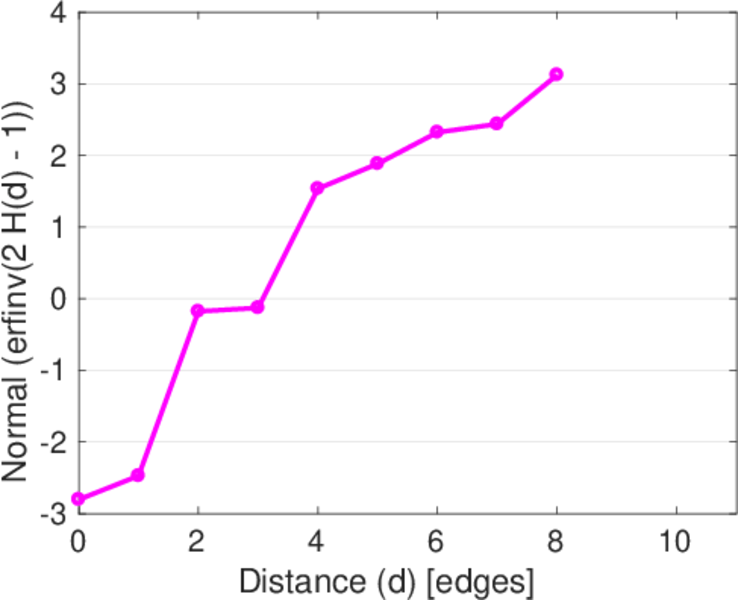
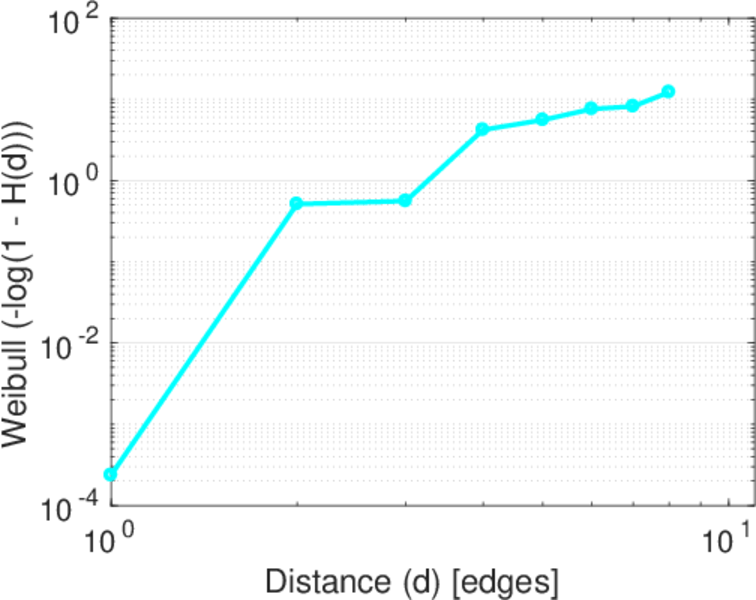
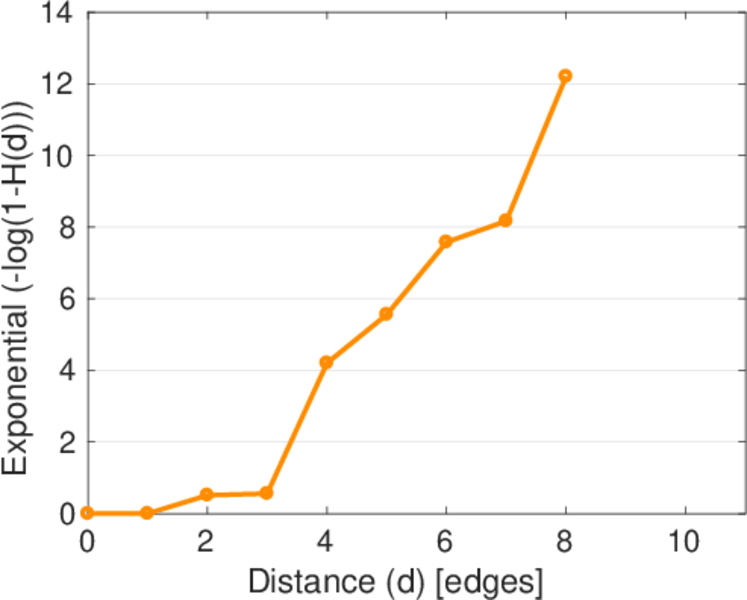
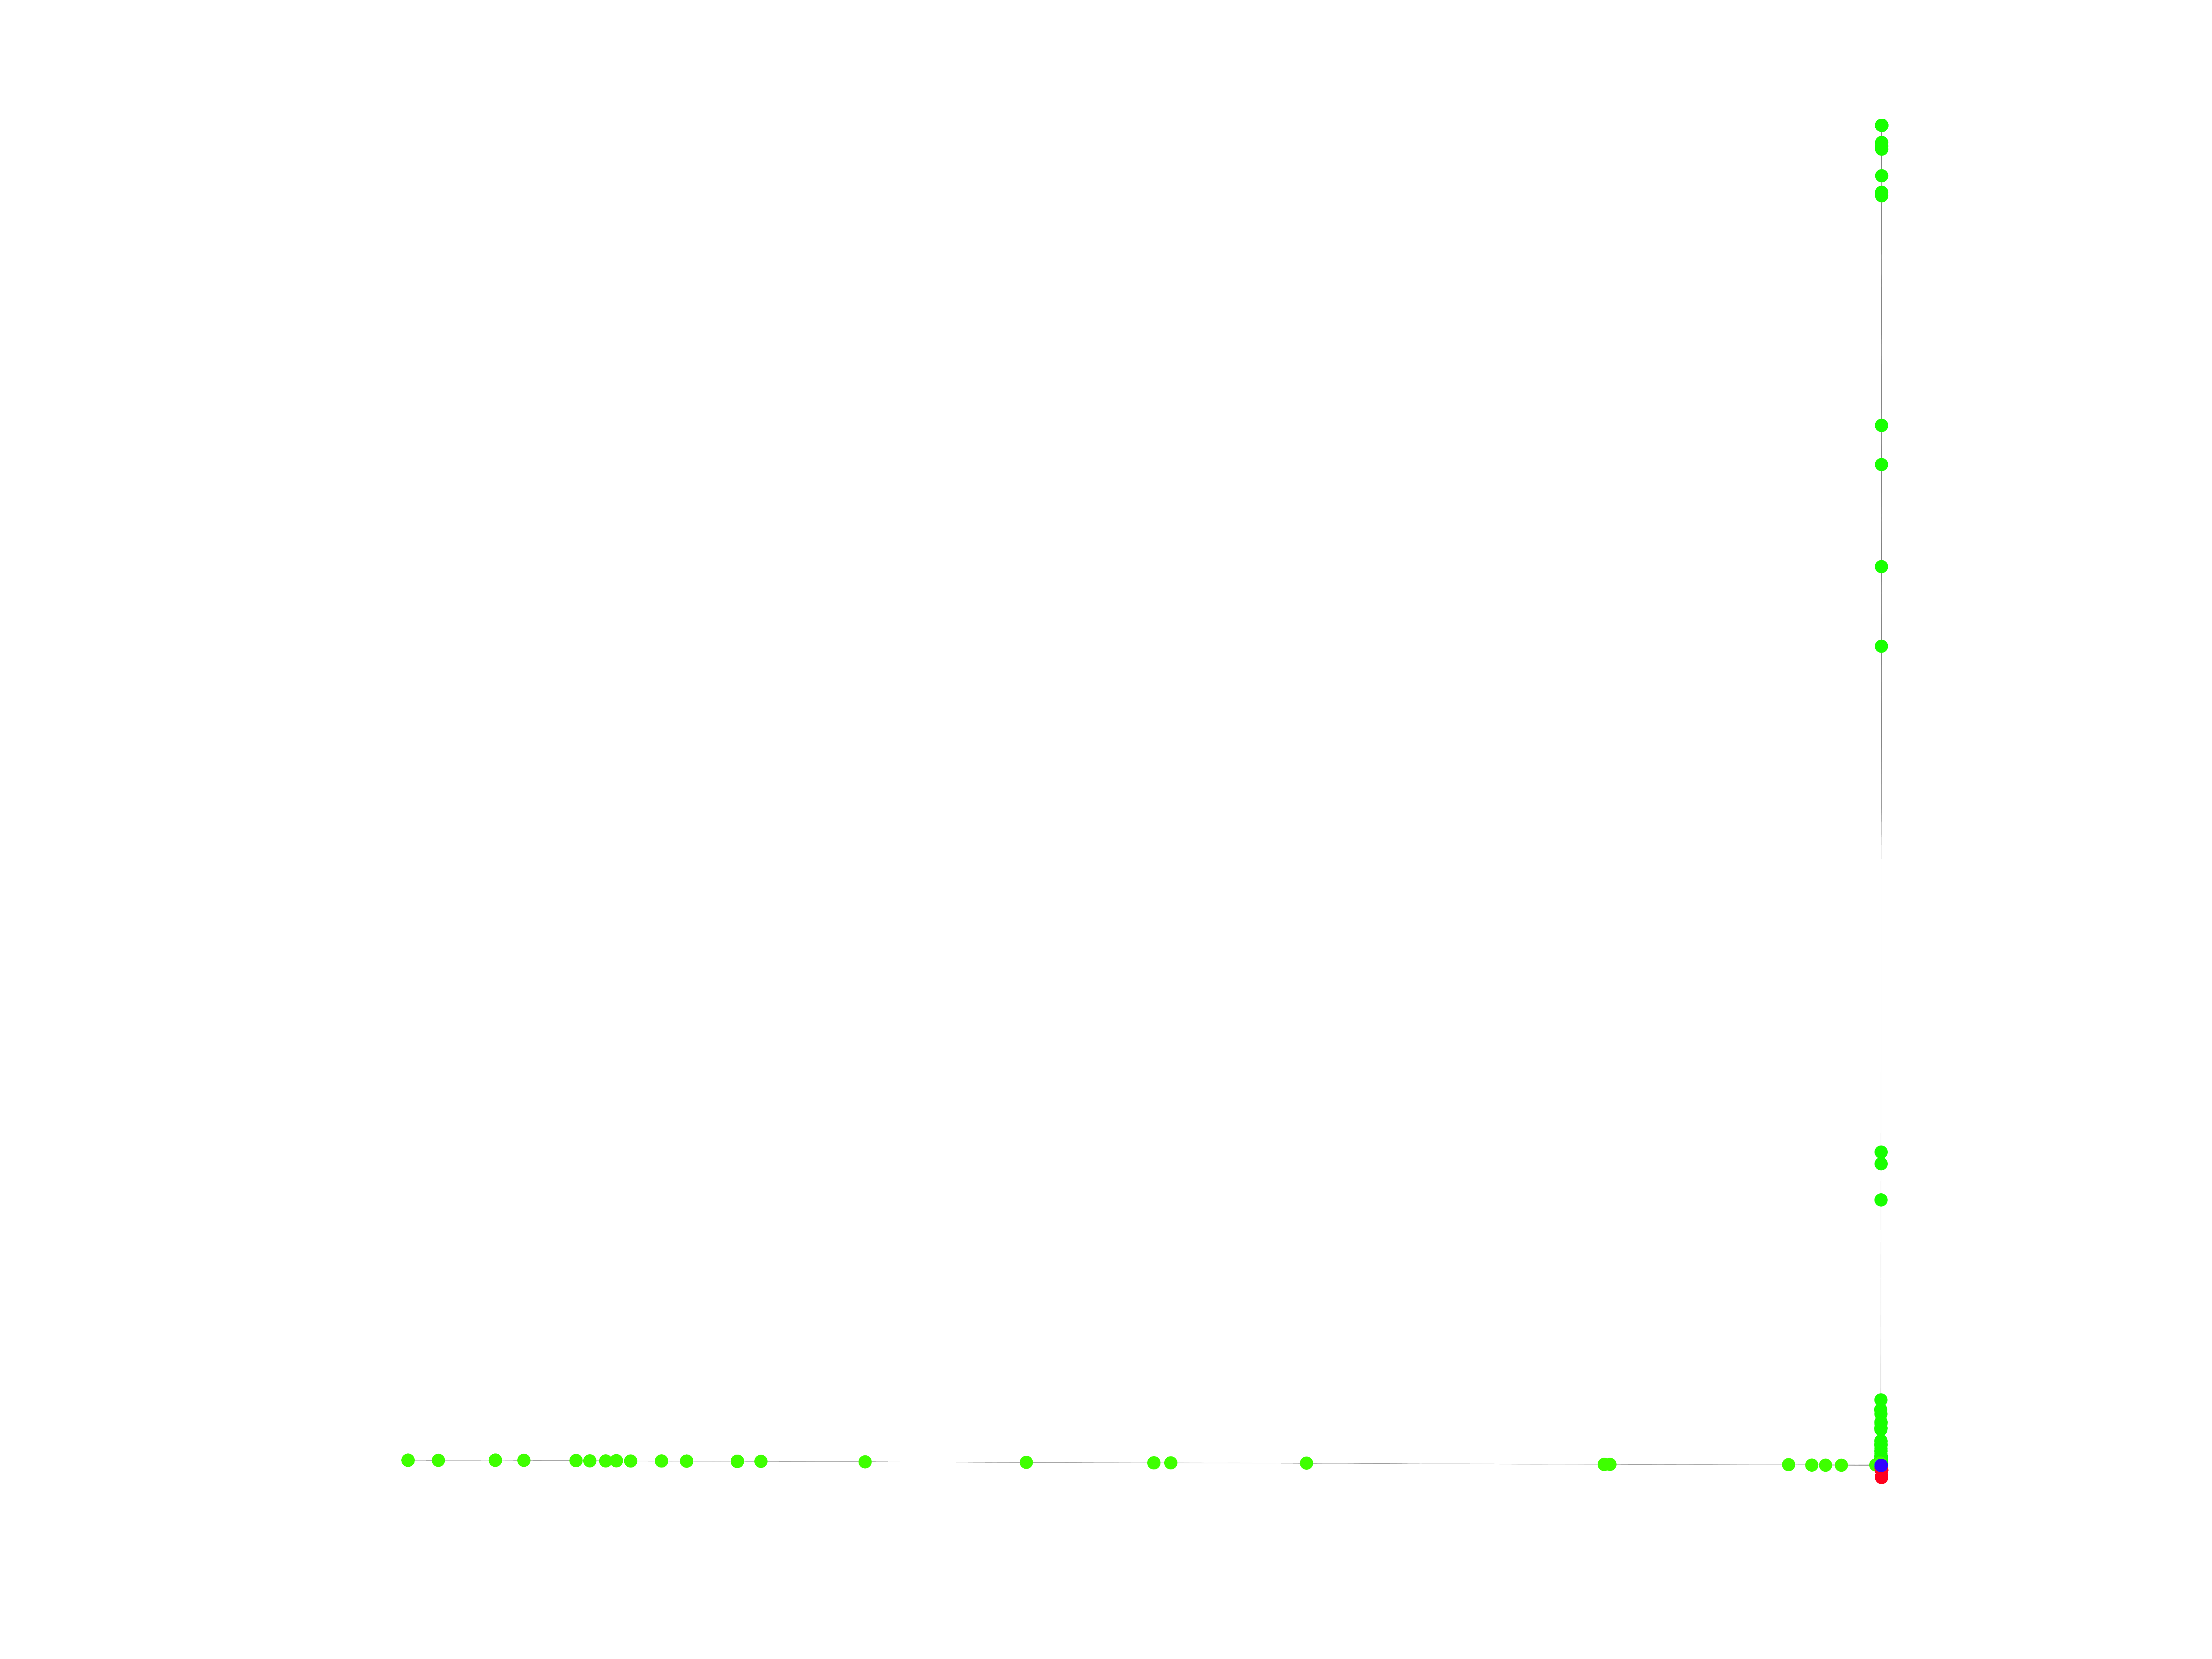
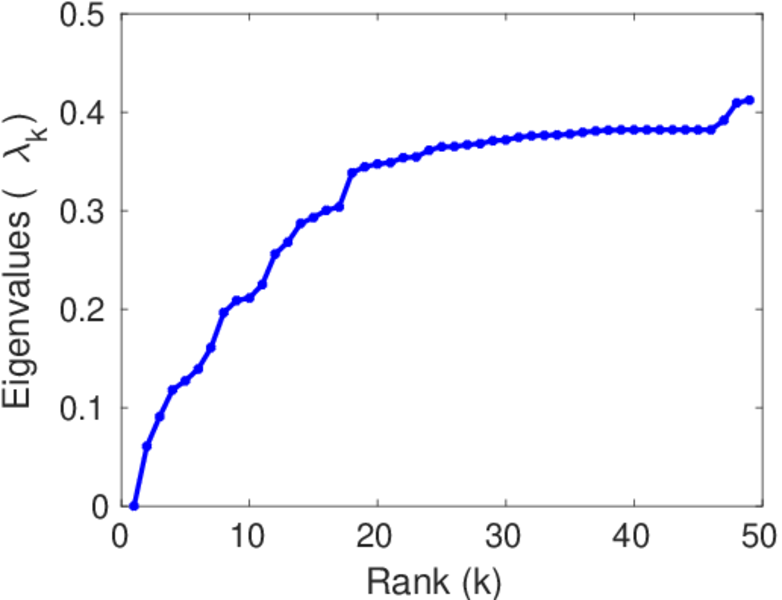
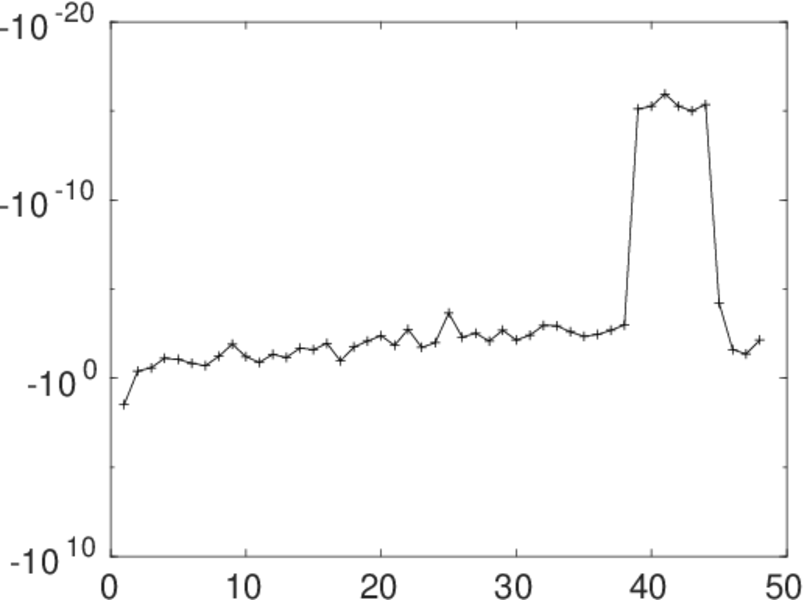
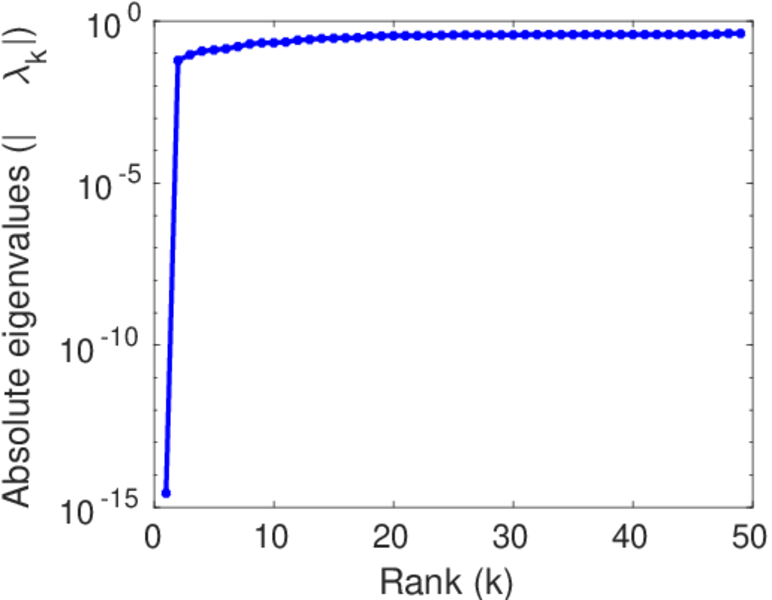
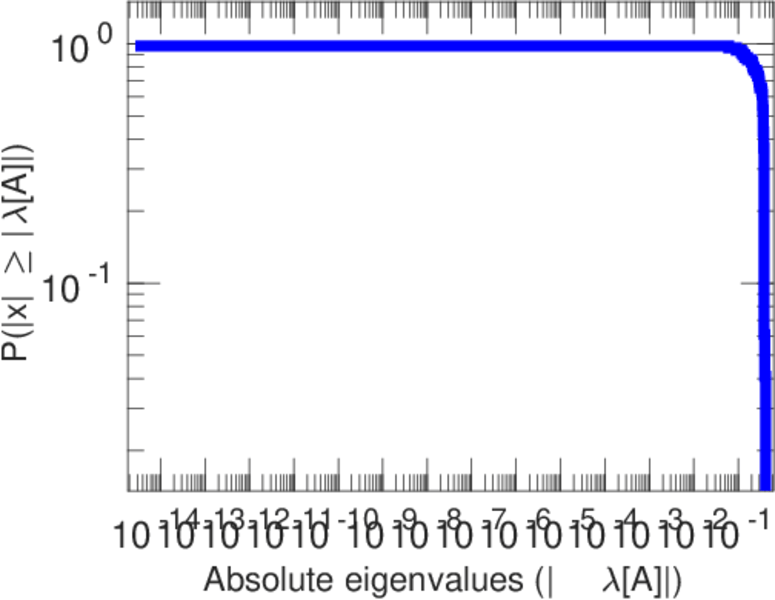
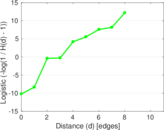
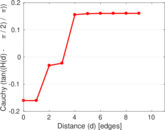
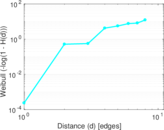
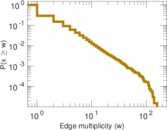
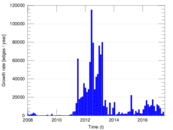
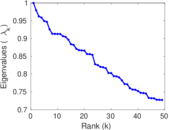
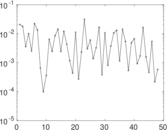
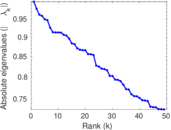
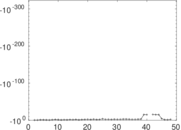
Plots


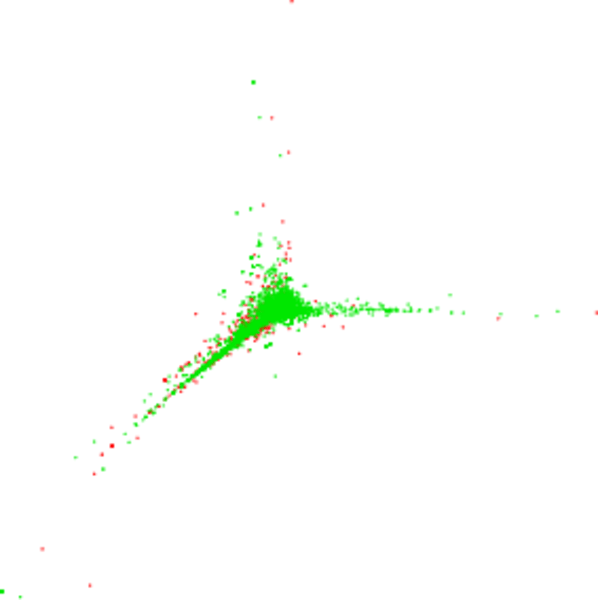
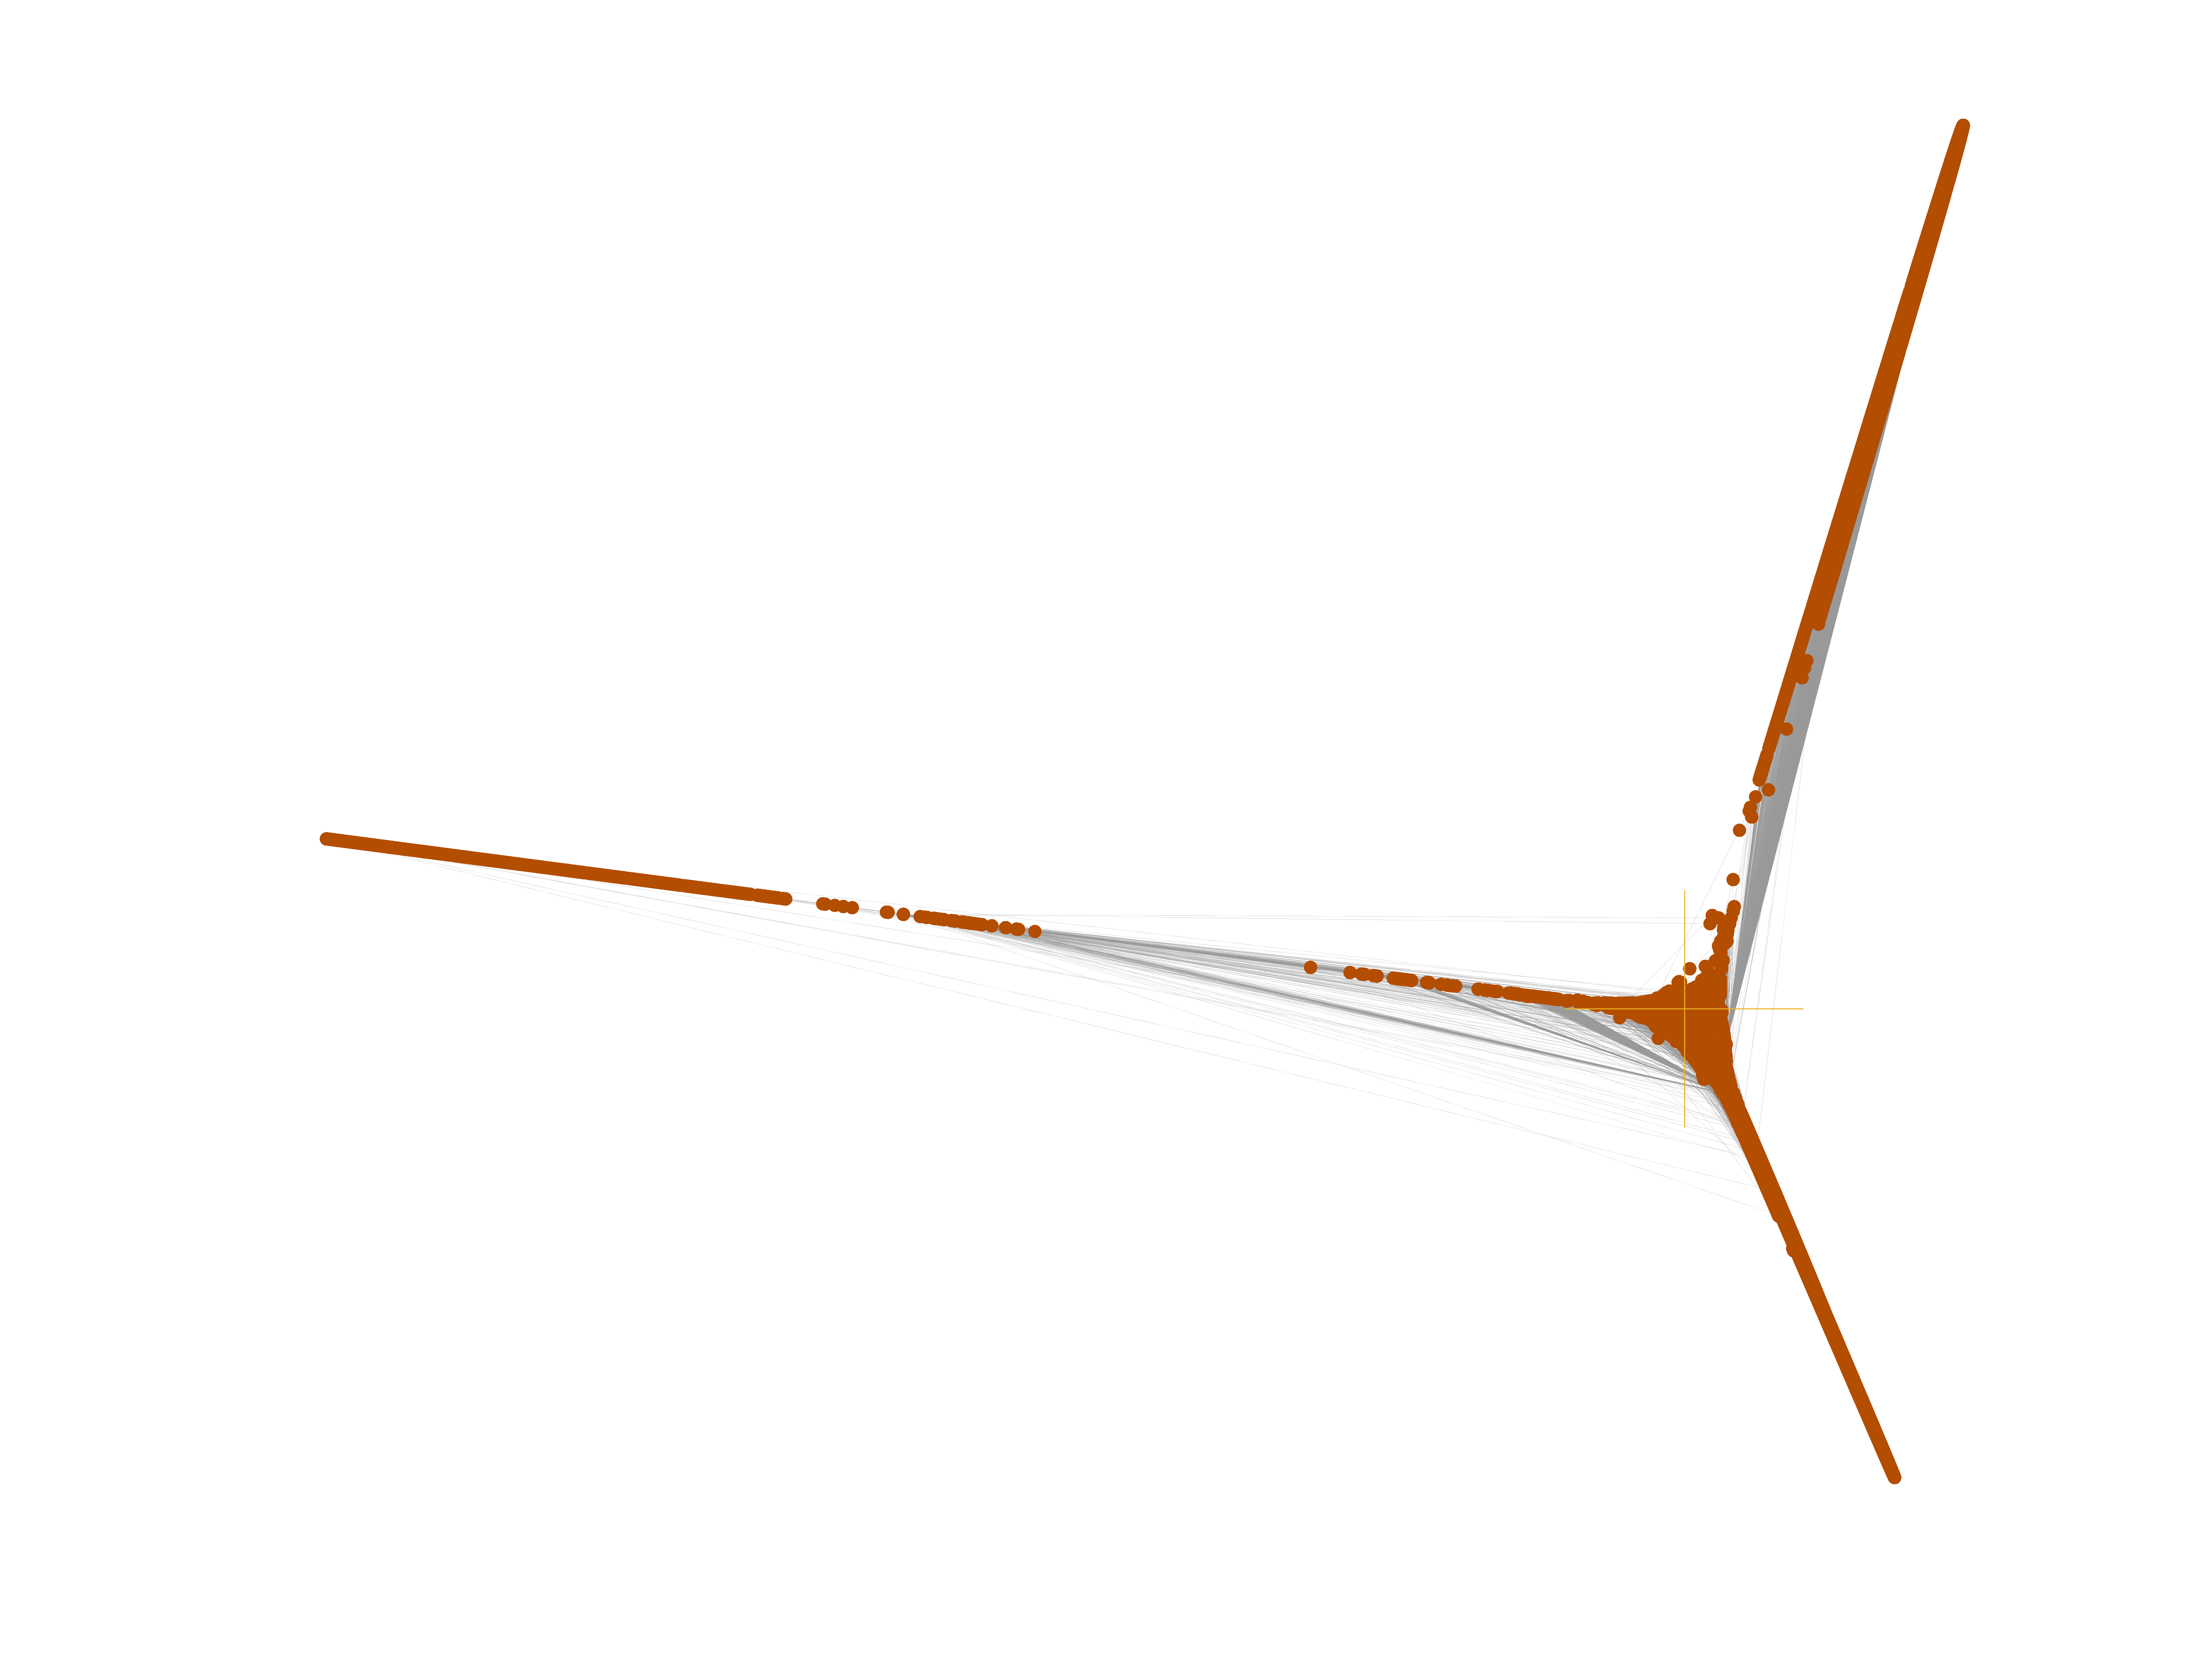
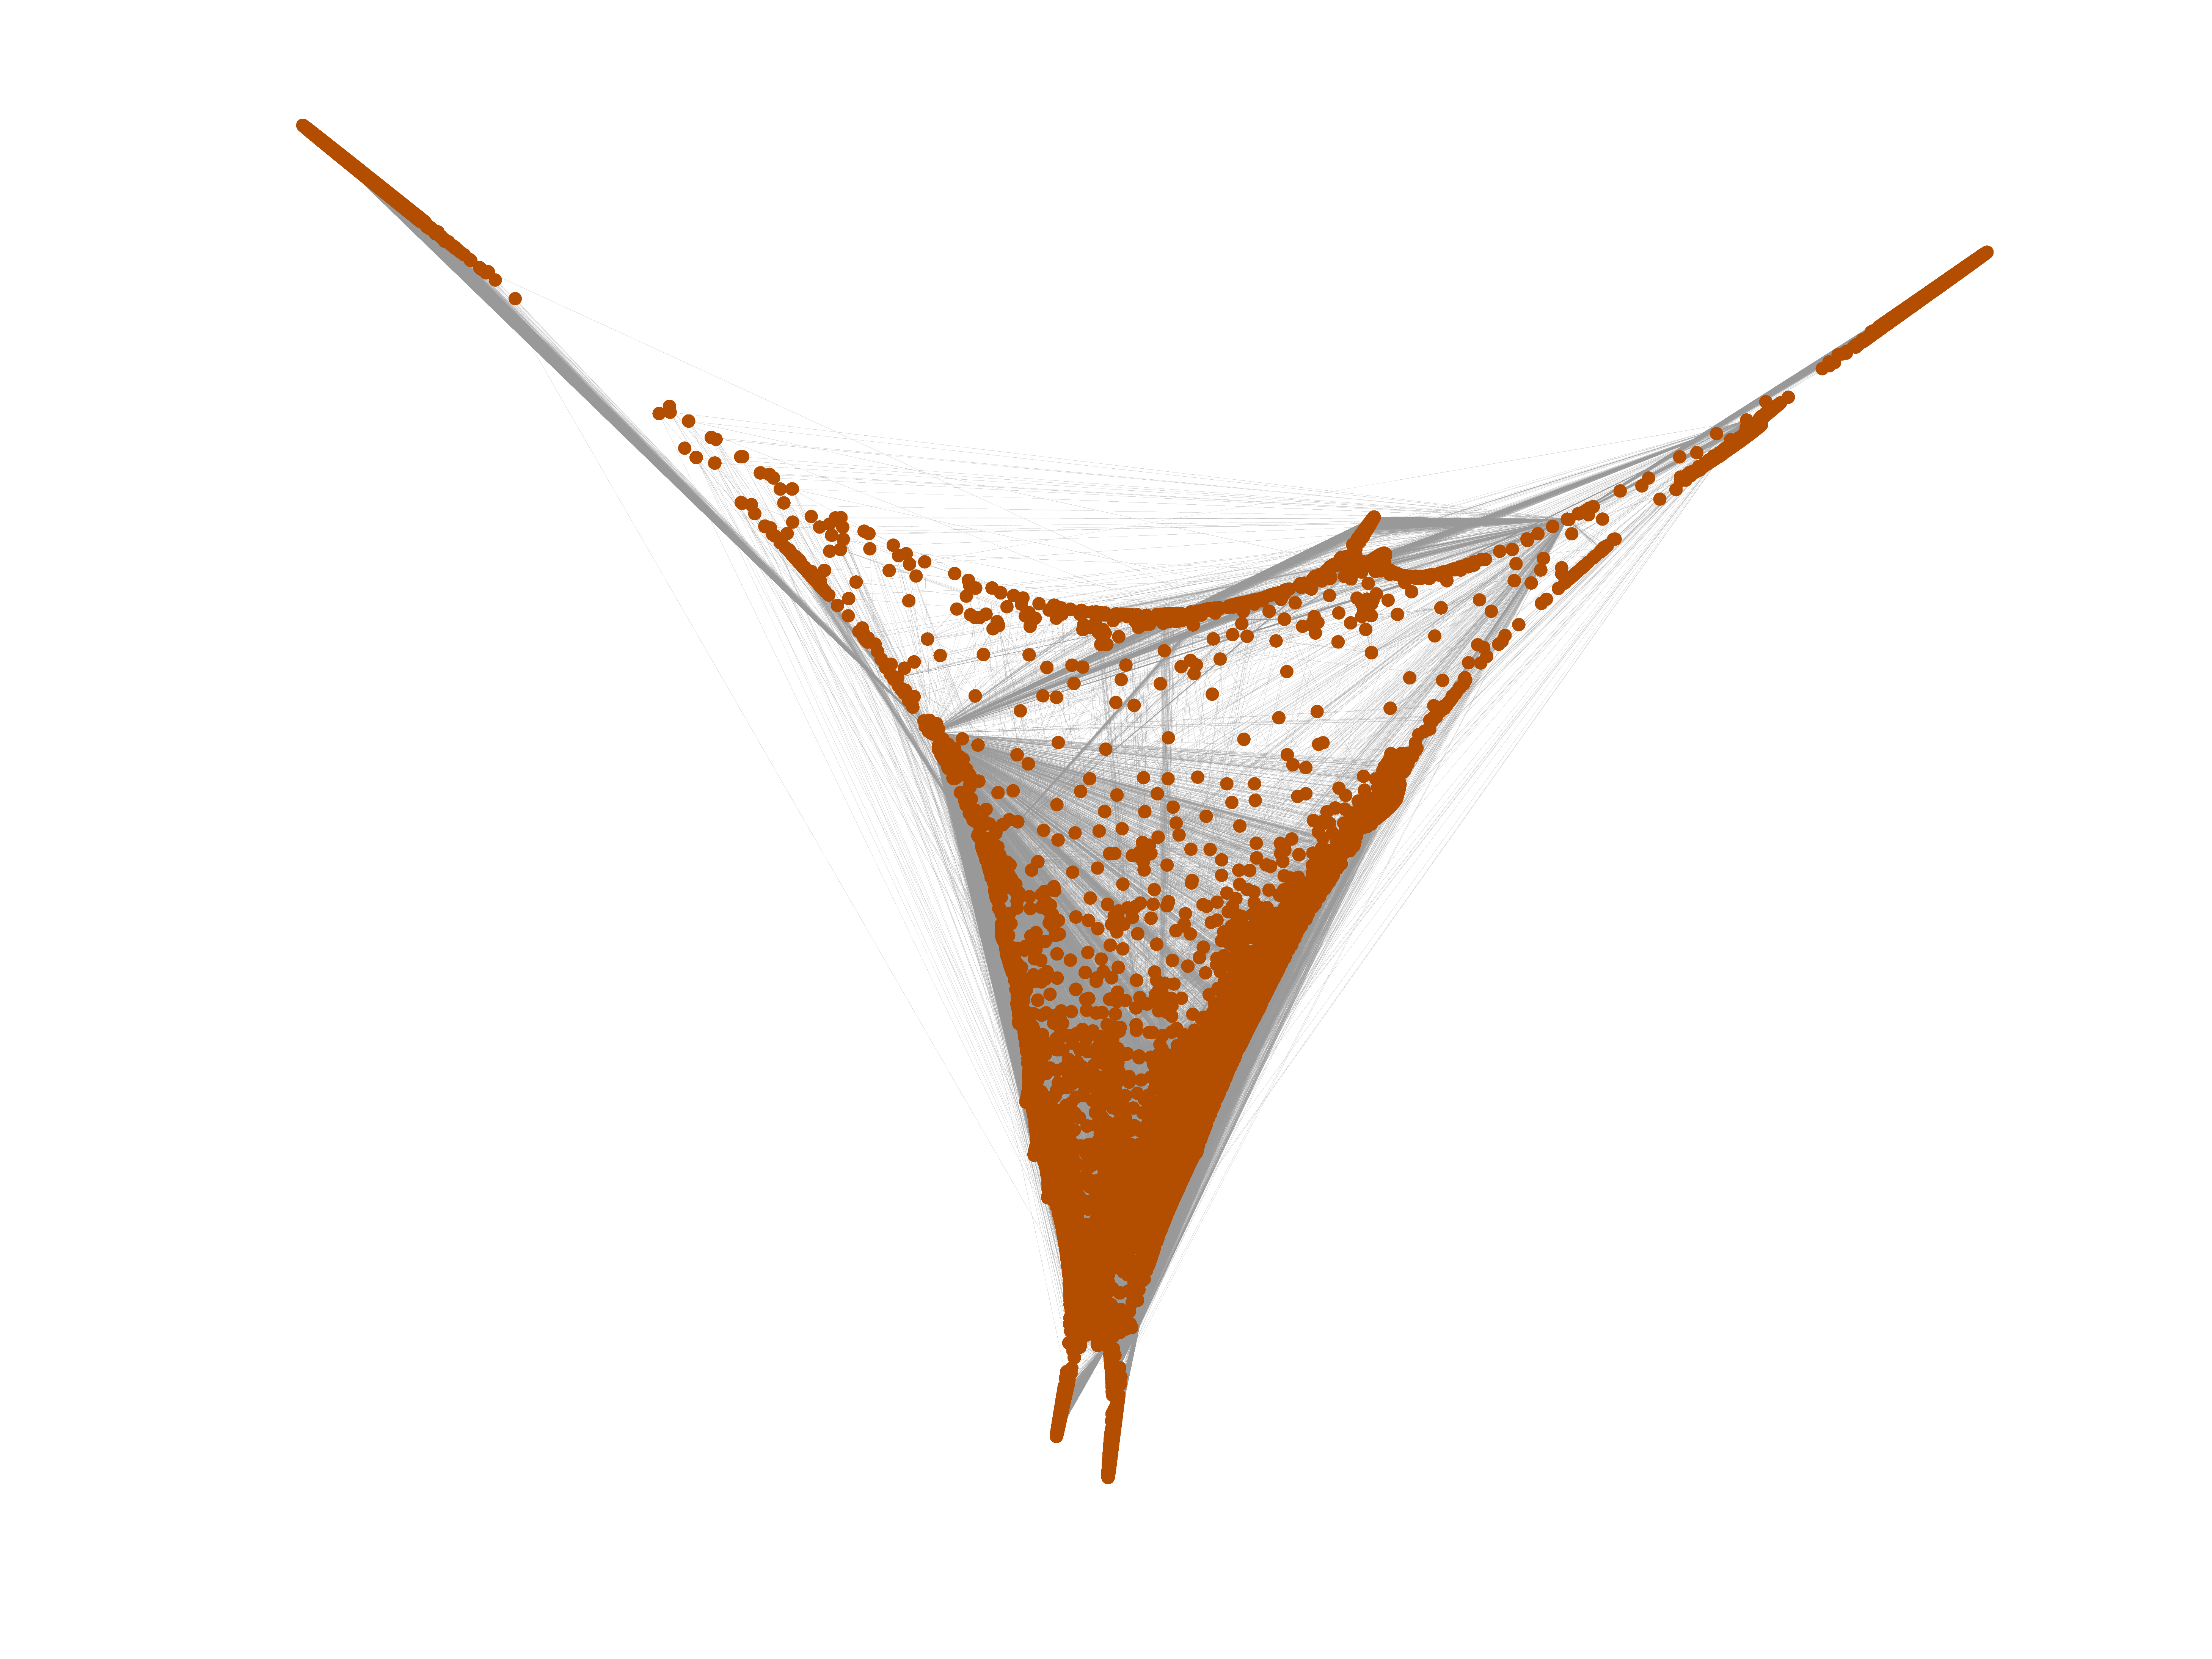
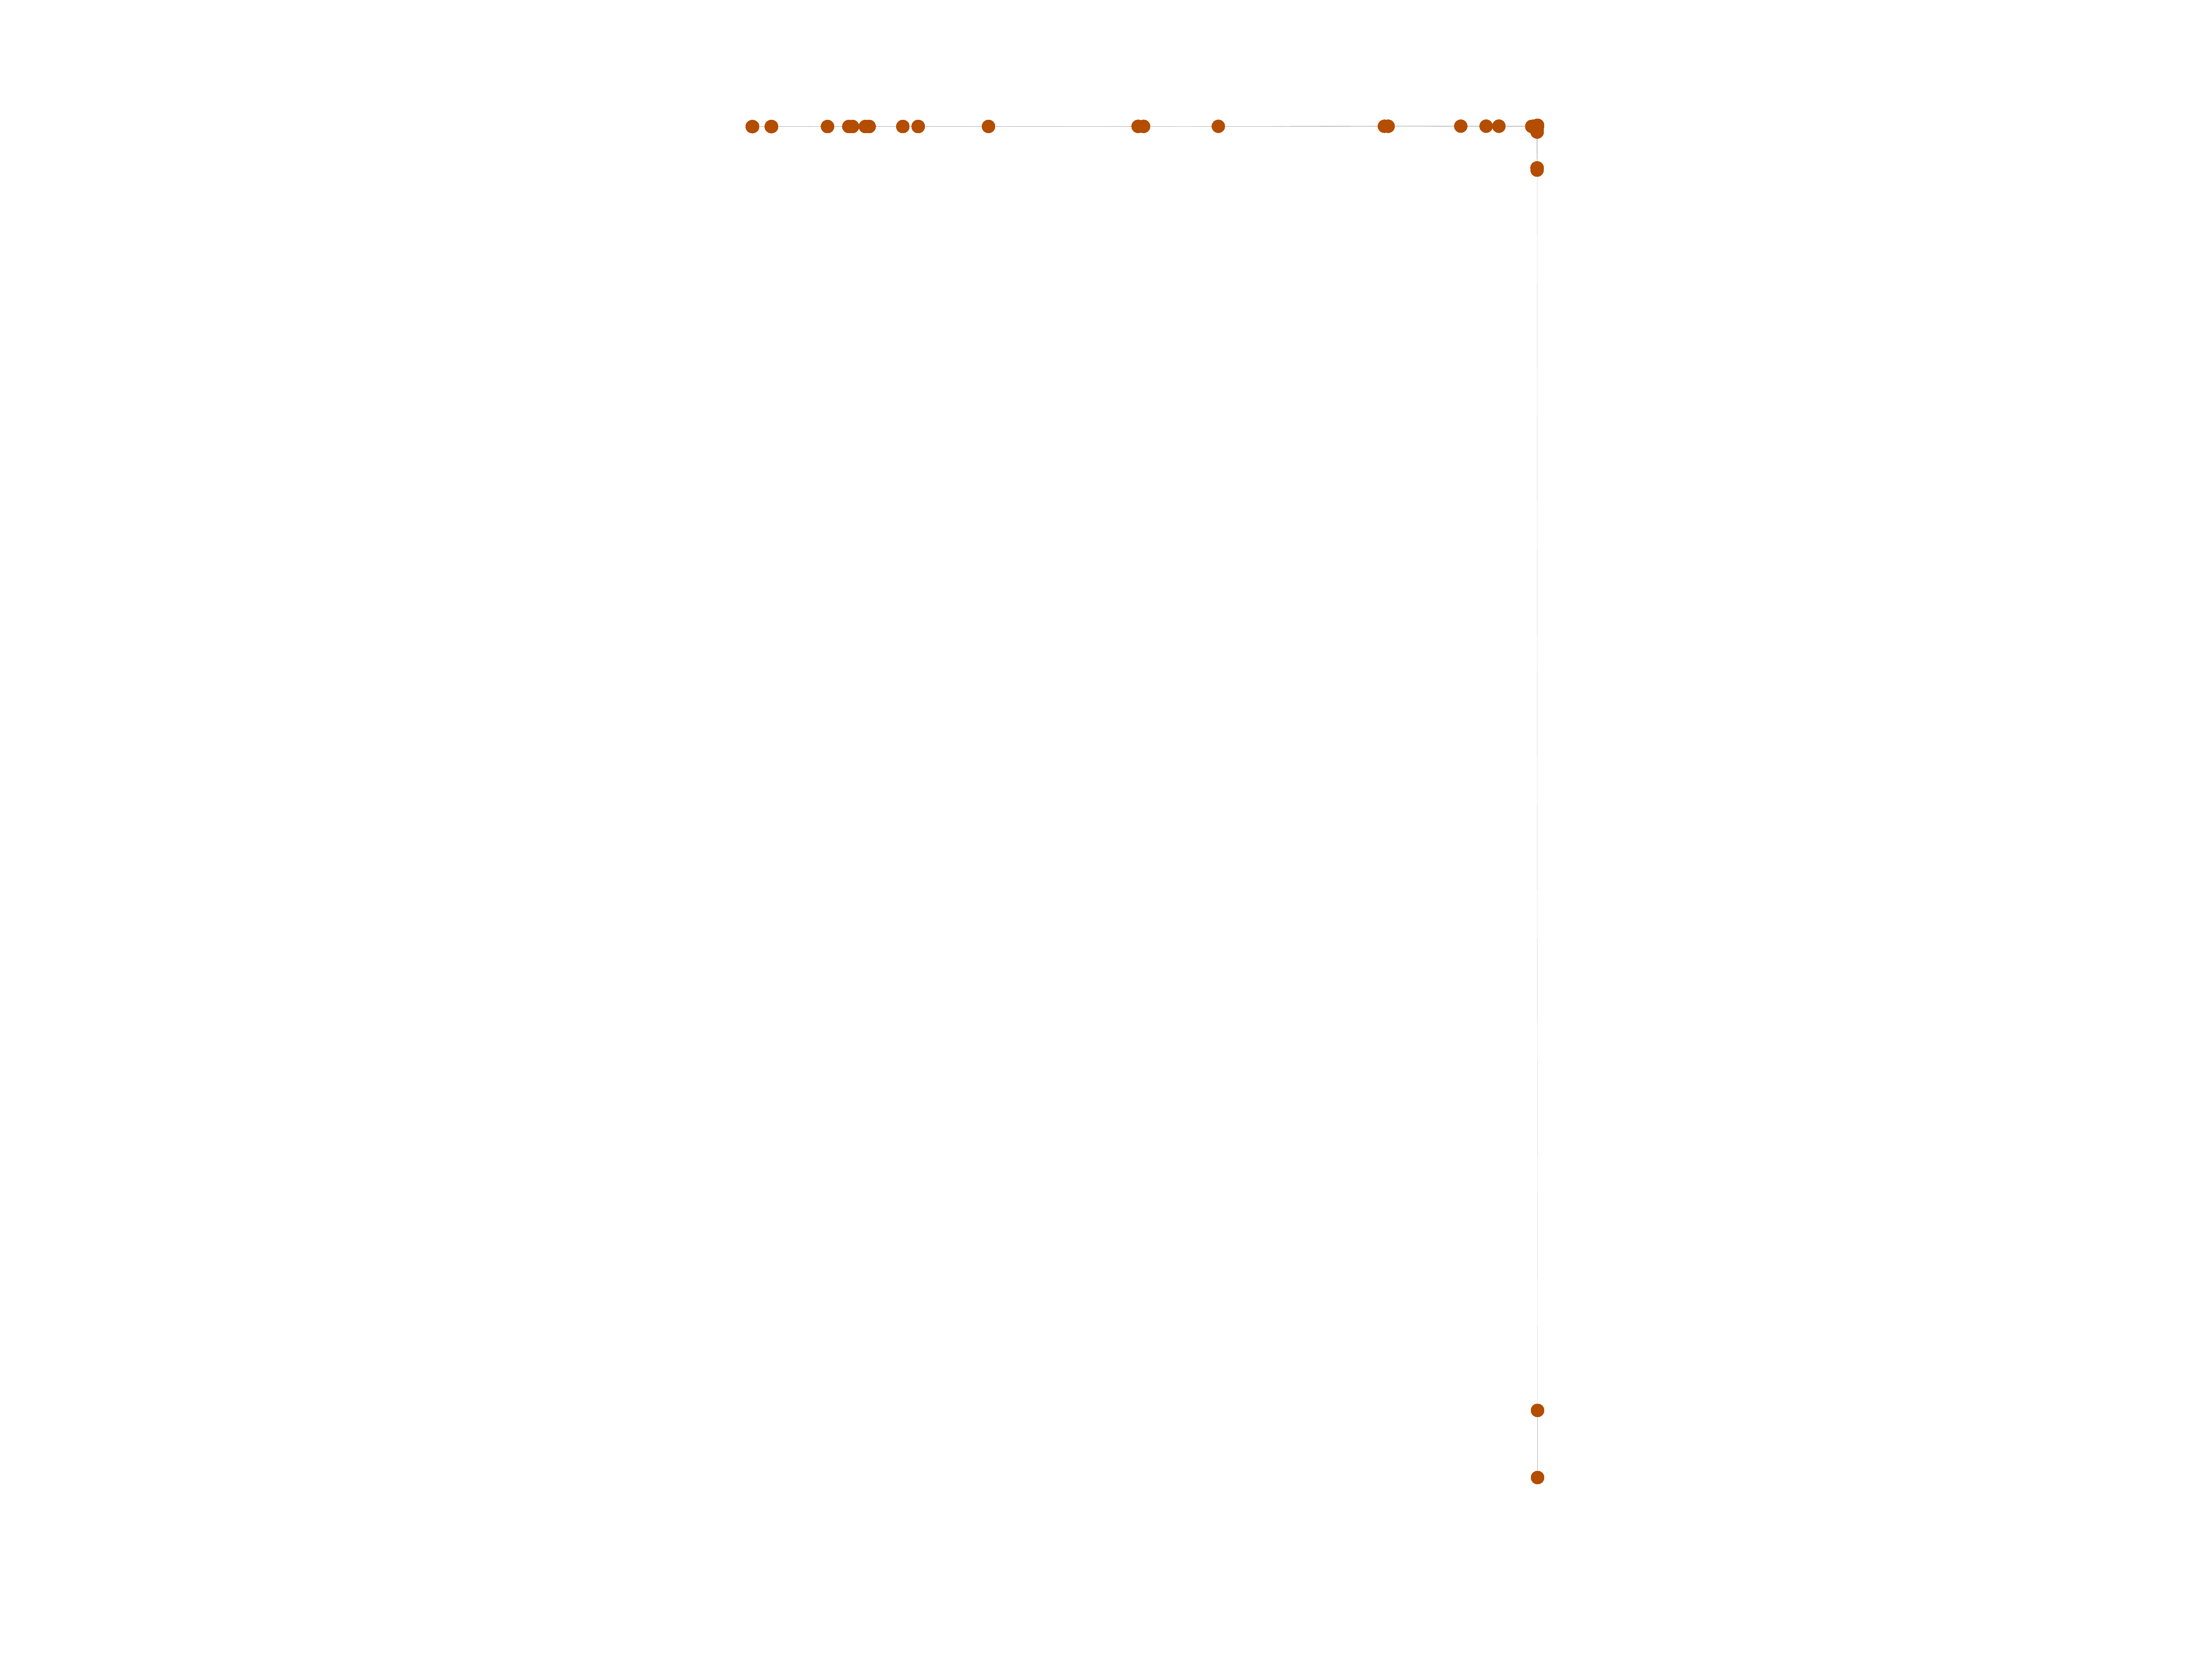
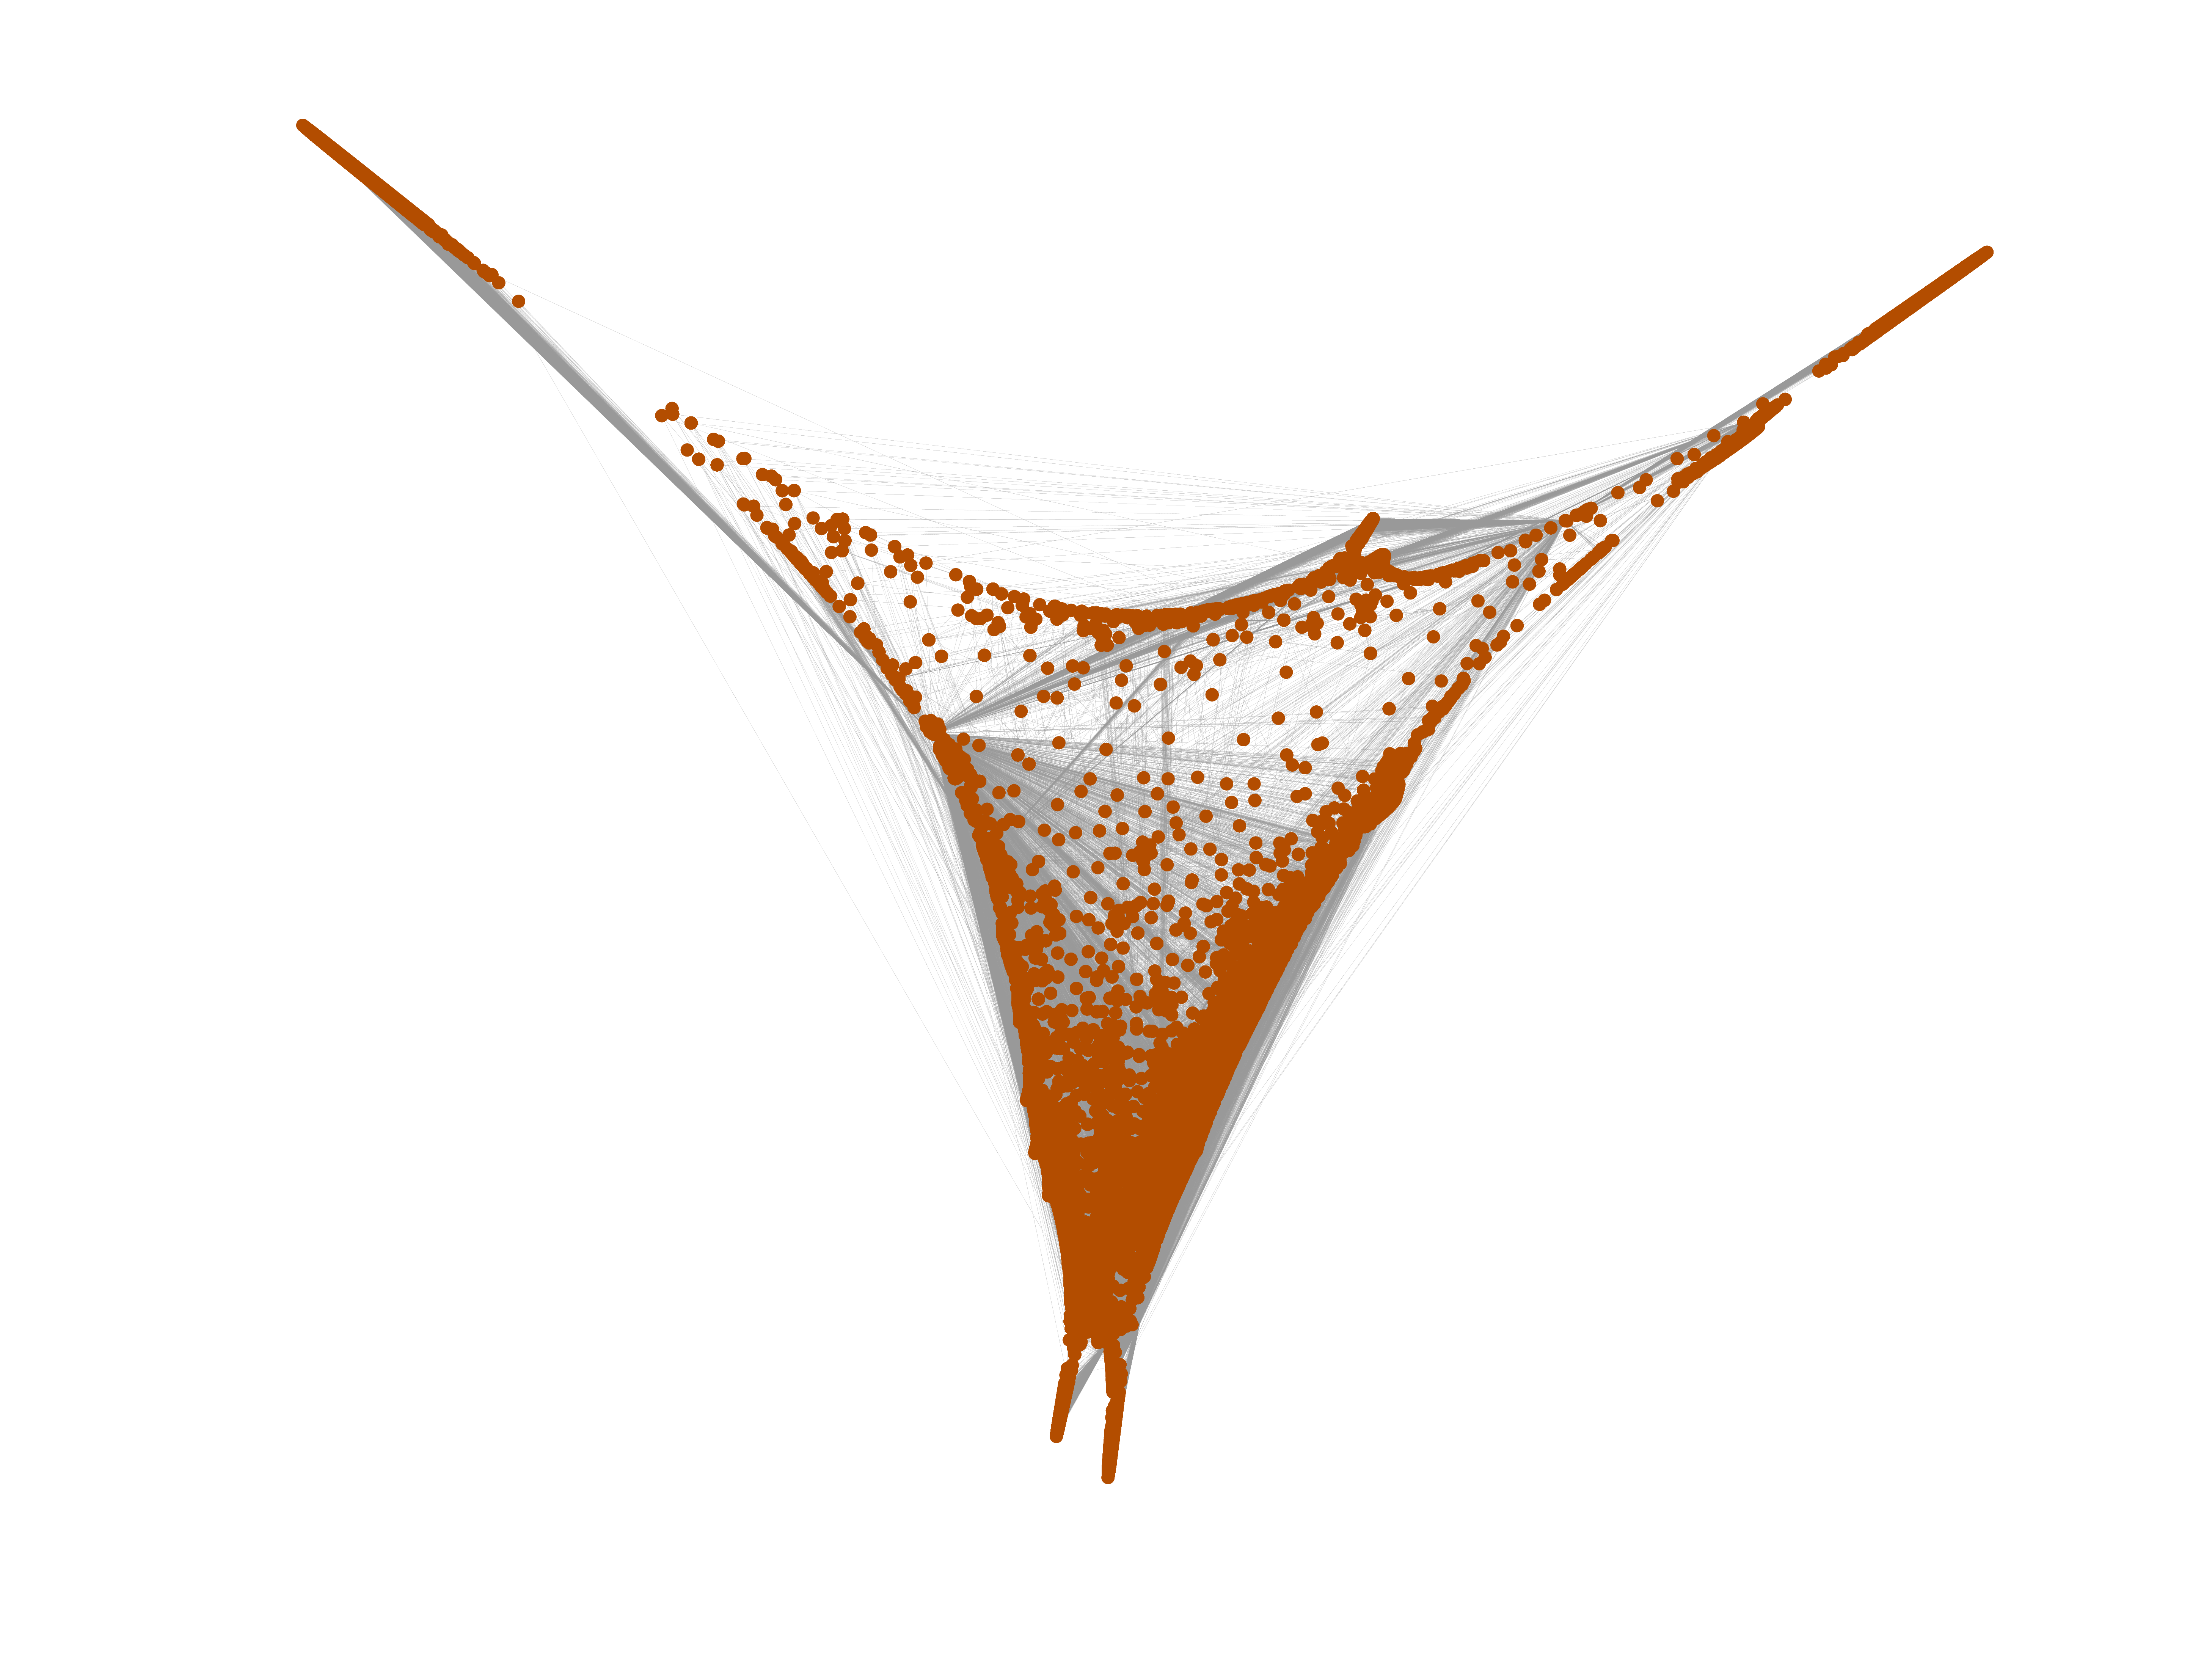
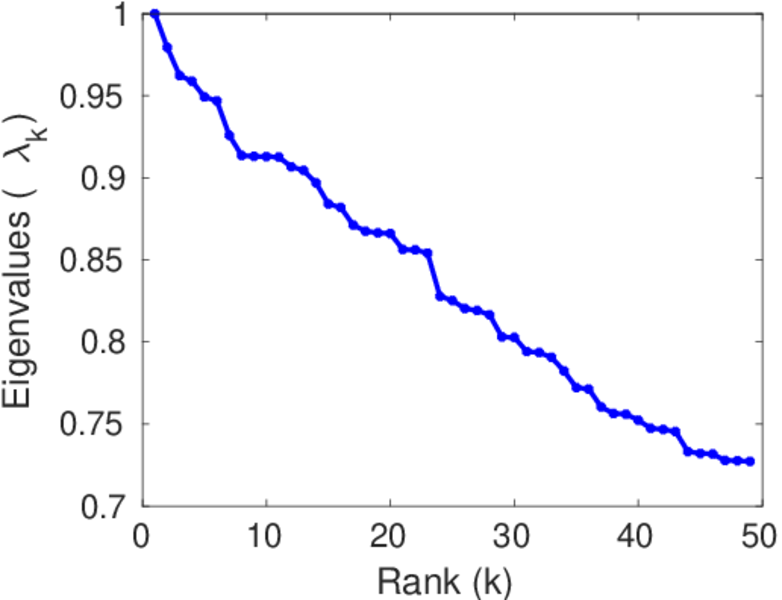
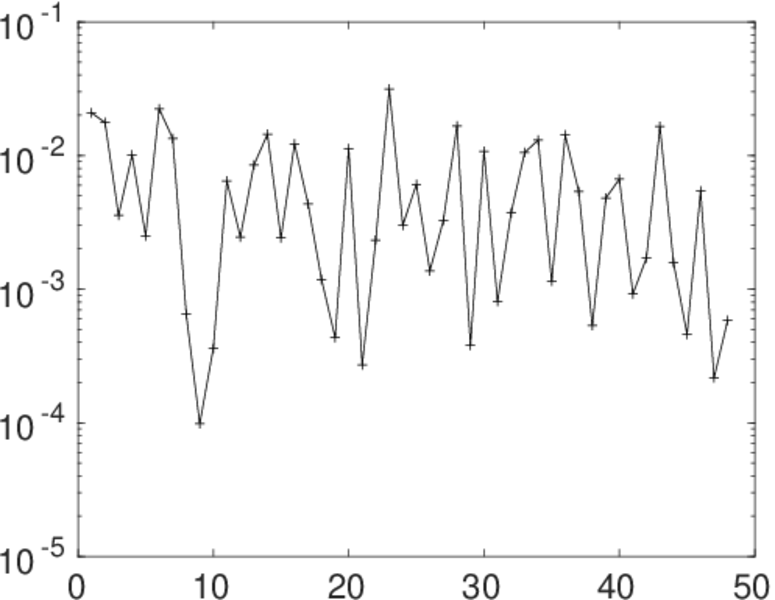
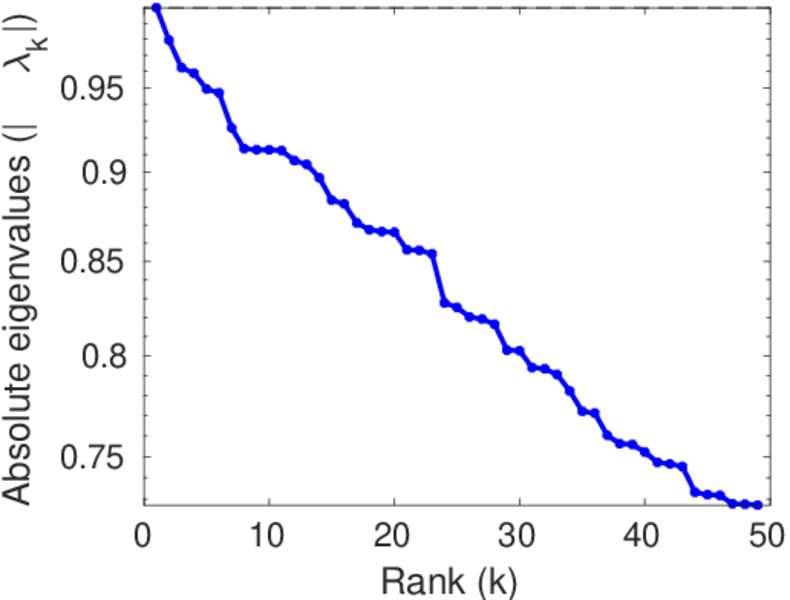
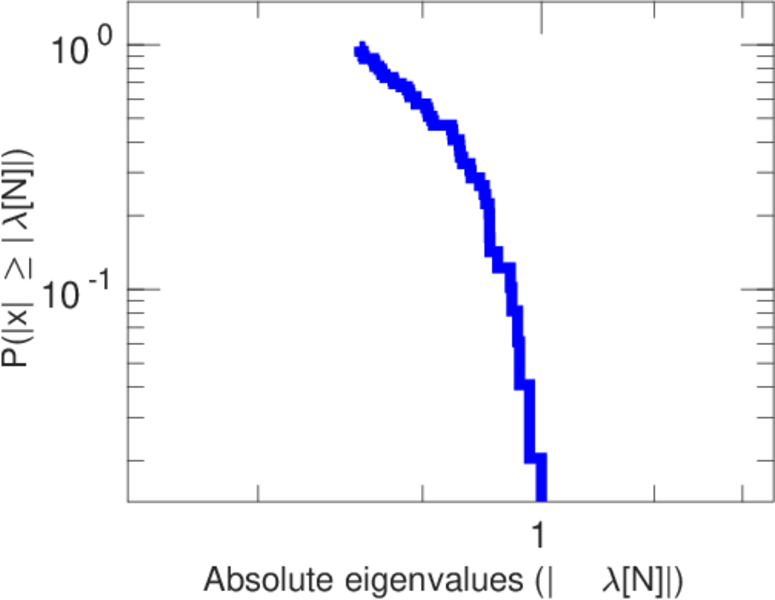
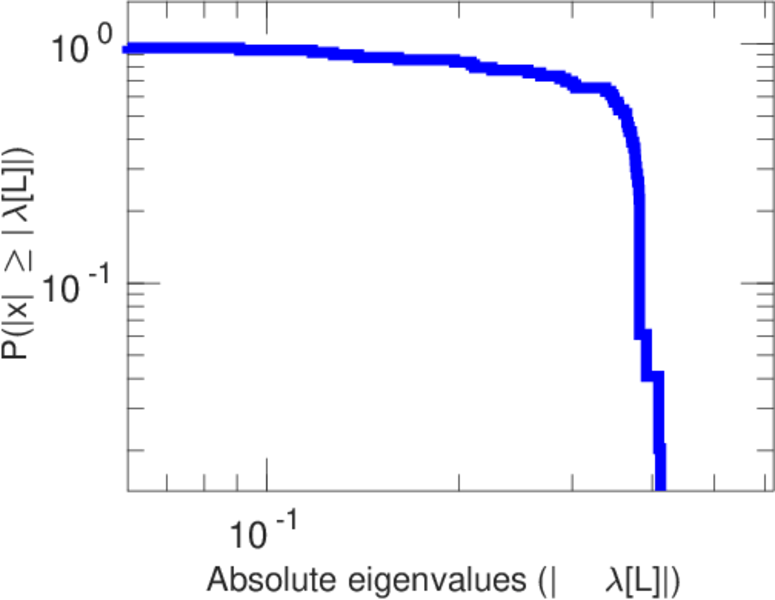
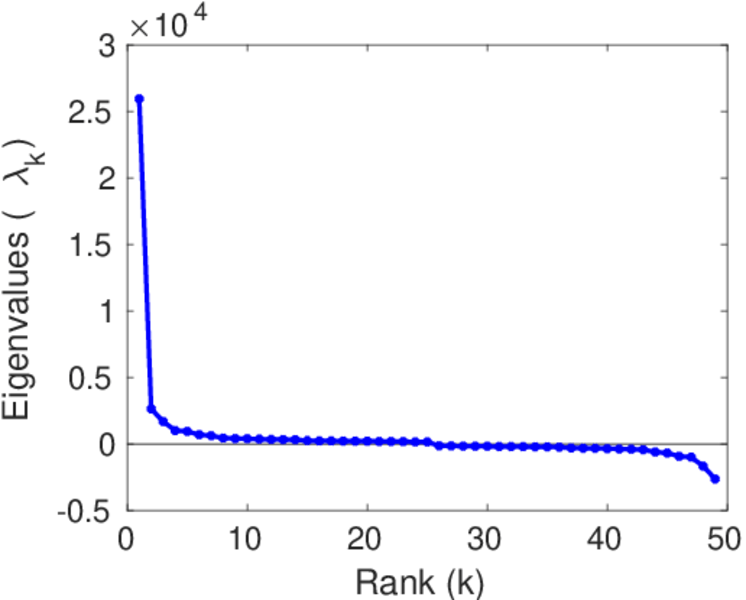
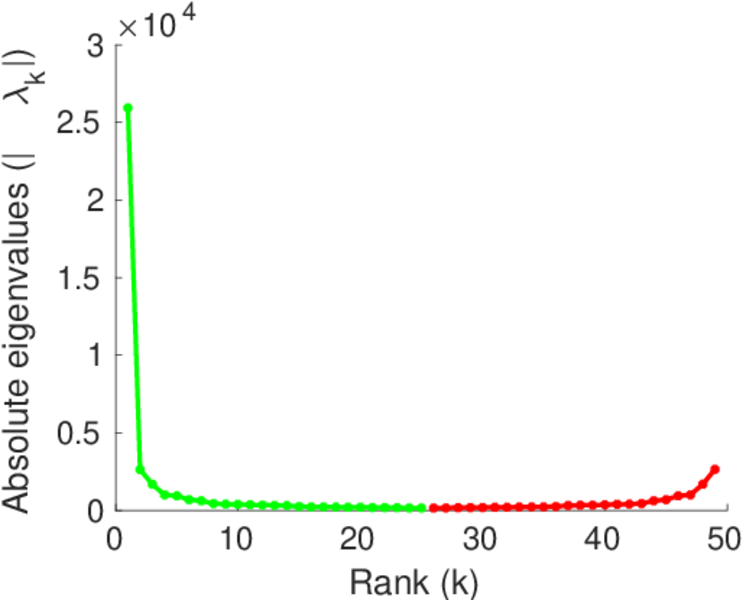
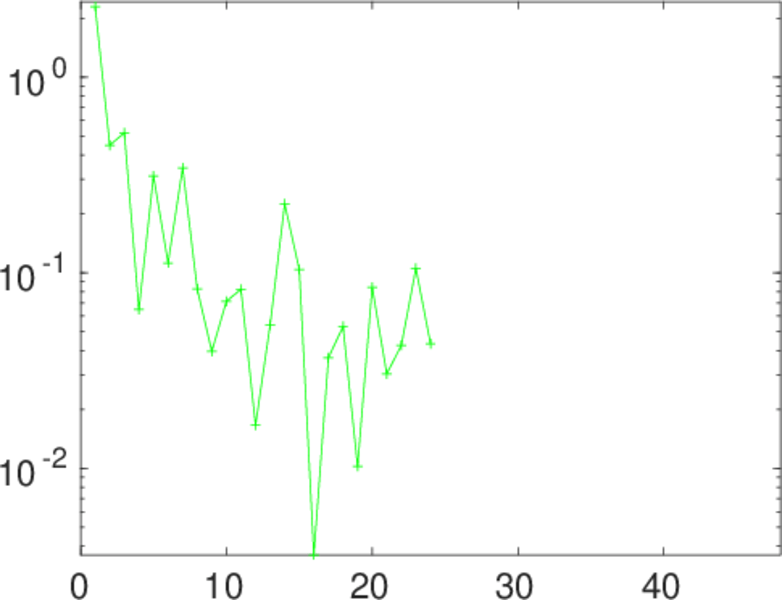
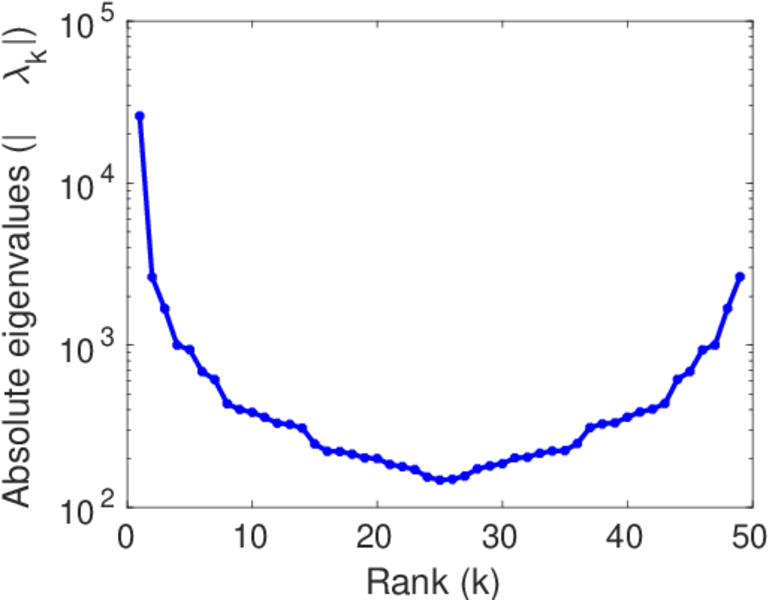
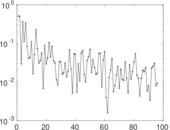
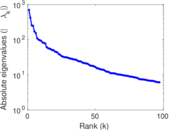
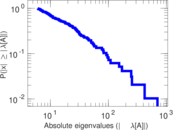
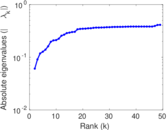
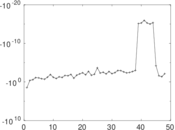
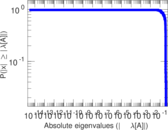
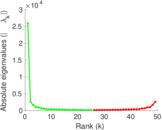
Matrix decompositions plots


Downloads
References
|
[1]
|
Jérôme Kunegis.
KONECT – The Koblenz Network Collection.
In Proc. Int. Conf. on World Wide Web Companion, pages
1343–1350, 2013.
[ http ]
|
|
[2]
|
Wikimedia Foundation.
Wikimedia downloads.
http://dumps.wikimedia.org/, January 2010.
|
 KONECT ‣ Networks ‣
Buy Me a Coffee
KONECT ‣ Networks ‣
Buy Me a Coffee