Wikipedia edits (yi)
This is the bipartite edit network of the Yiddish Wikipedia. It contains users
and pages from the Yiddish Wikipedia, connected by edit events. Each edge
represents an edit. The dataset includes the timestamp of each edit.
Metadata
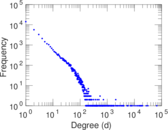
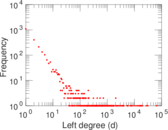
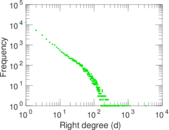
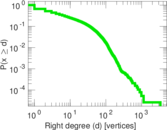
Statistics
| Size | n = | 41,363
|
| Left size | n1 = | 2,760
|
| Right size | n2 = | 38,603
|
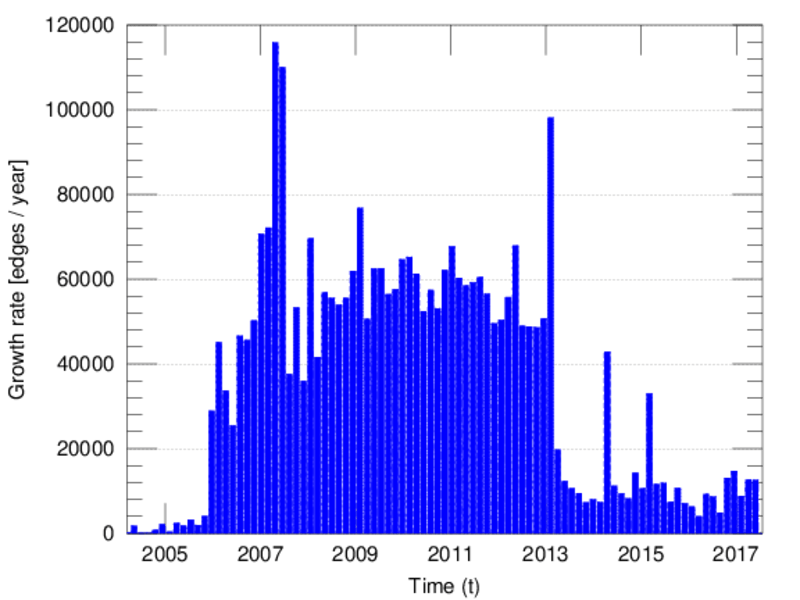
| Volume | m = | 474,132
|
| Unique edge count | m̿ = | 209,217
|
| Wedge count | s = | 528,389,220
|
| Claw count | z = | 2,207,928,207,626
|
| Cross count | x = | 9,514,828,230,601,674
|
| Square count | q = | 983,155,981
|
| 4-Tour count | T4 = | 9,979,301,530
|
| Maximum degree | dmax = | 66,842
|
| Maximum left degree | d1max = | 66,842
|
| Maximum right degree | d2max = | 3,349
|
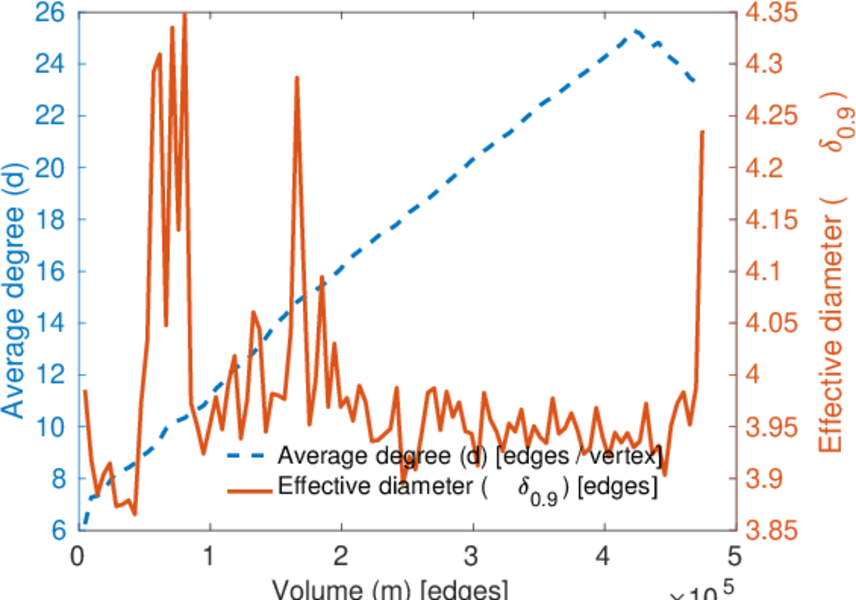
| Average degree | d = | 22.925 4
|
| Average left degree | d1 = | 171.787
|
| Average right degree | d2 = | 12.282 3
|
| Fill | p = | 0.001 963 66
|
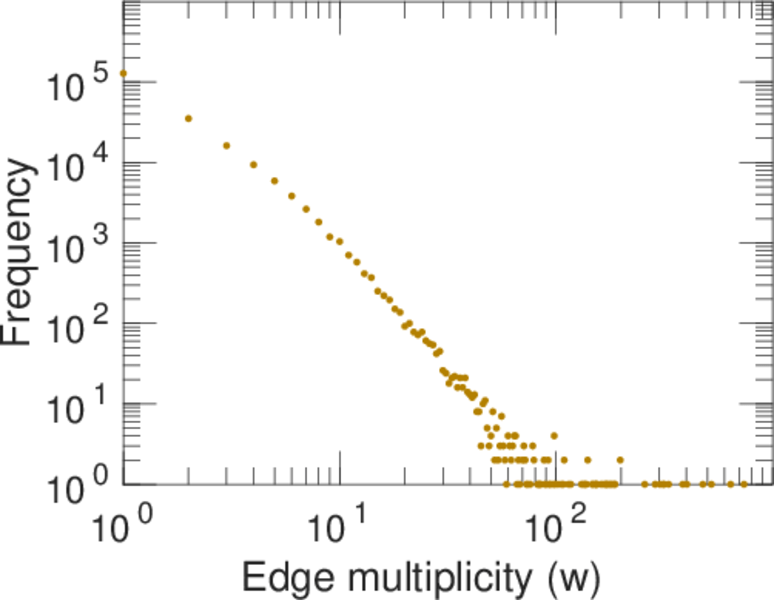
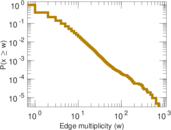
| Average edge multiplicity | m̃ = | 2.266 22
|
| Size of LCC | N = | 40,307
|
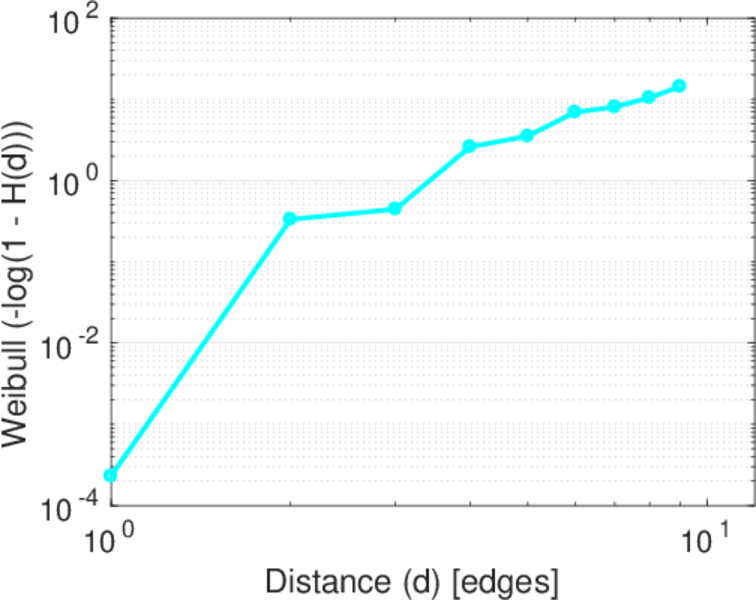
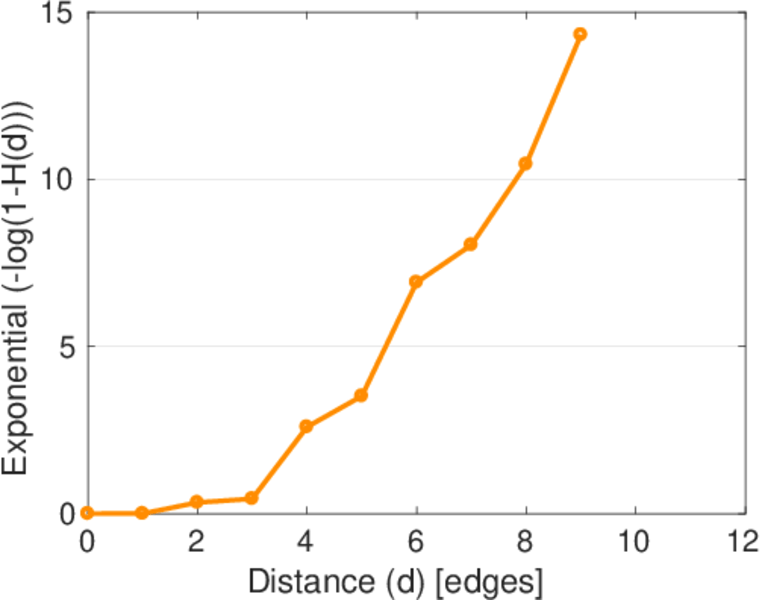
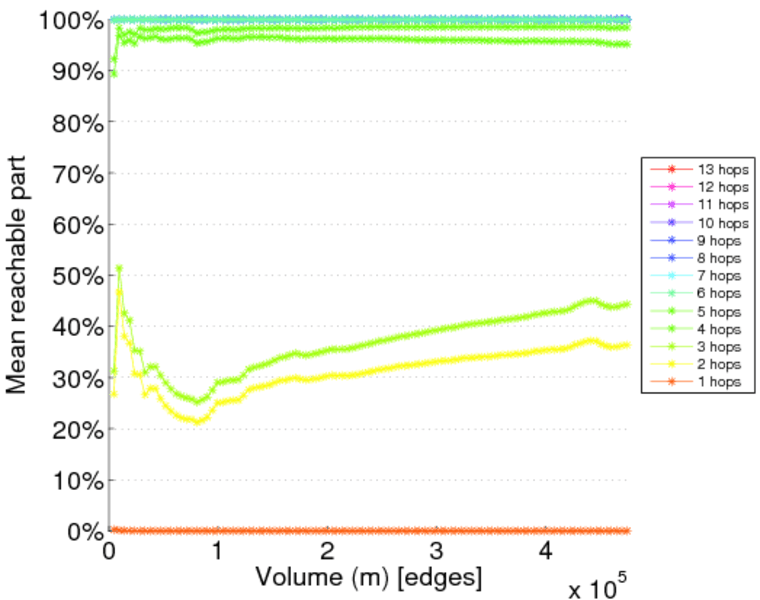
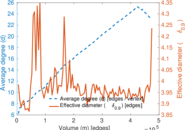
| Diameter | δ = | 13
|
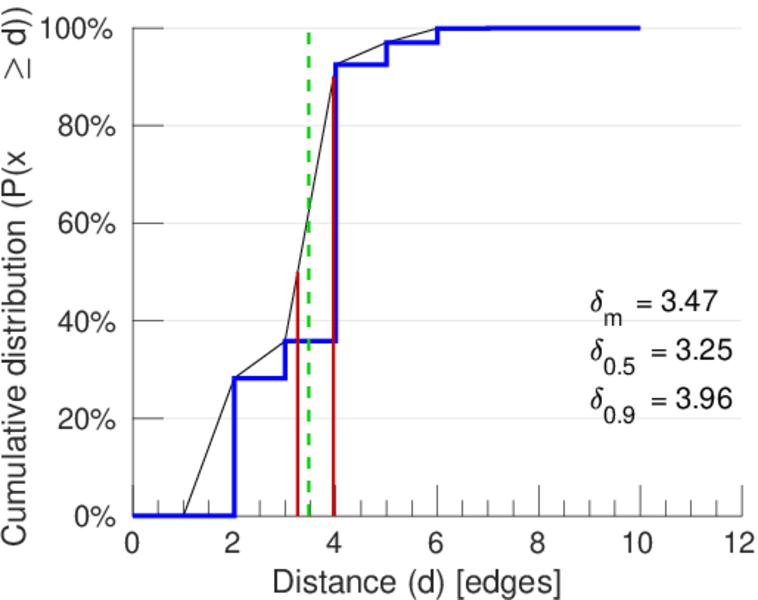
| 50-Percentile effective diameter | δ0.5 = | 3.250 30
|
| 90-Percentile effective diameter | δ0.9 = | 3.955 70
|
| Median distance | δM = | 4
|
| Mean distance | δm = | 3.465 26
|
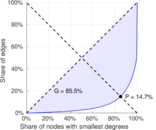
| Gini coefficient | G = | 0.854 588
|
| Balanced inequality ratio | P = | 0.149 243
|
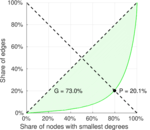
| Left balanced inequality ratio | P1 = | 0.055 549 9
|
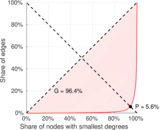
| Right balanced inequality ratio | P2 = | 0.200 539
|
| Relative edge distribution entropy | Her = | 0.749 117
|
| Power law exponent | γ = | 2.033 95
|
| Tail power law exponent | γt = | 1.701 00
|
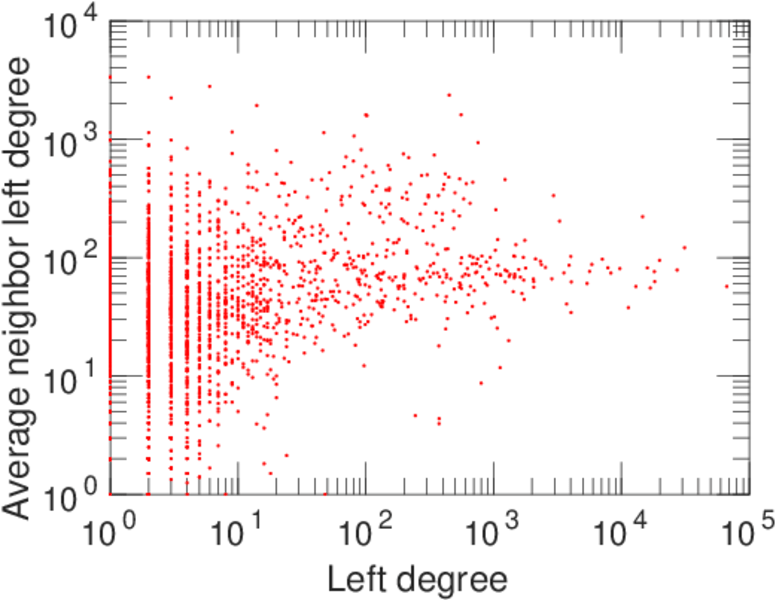
| Degree assortativity | ρ = | −0.273 556
|
| Degree assortativity p-value | pρ = | 0.000 00
|
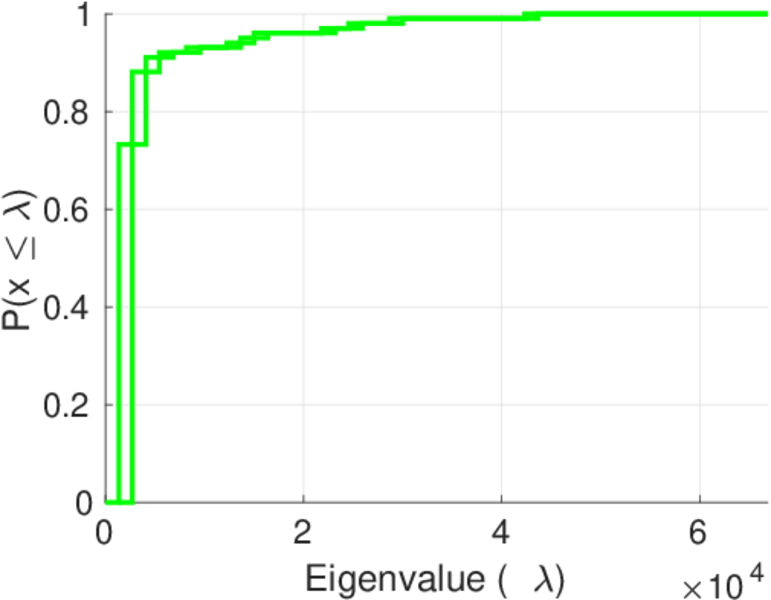
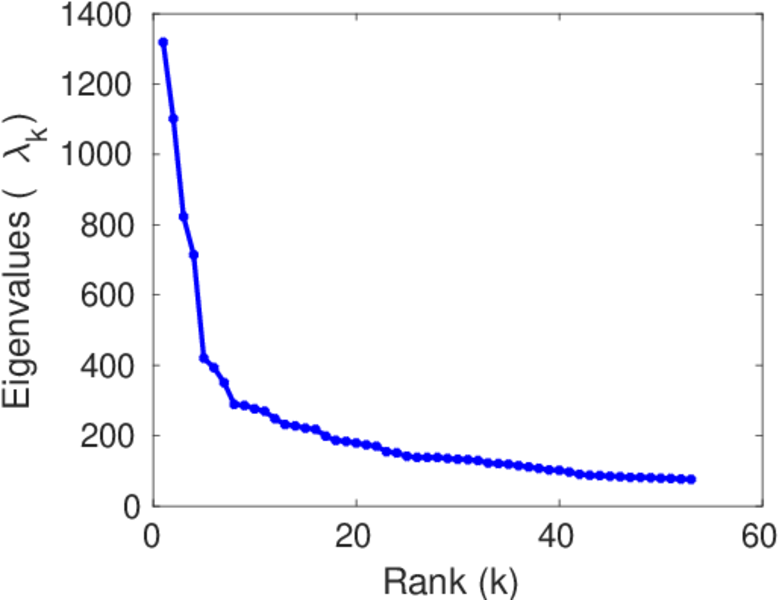
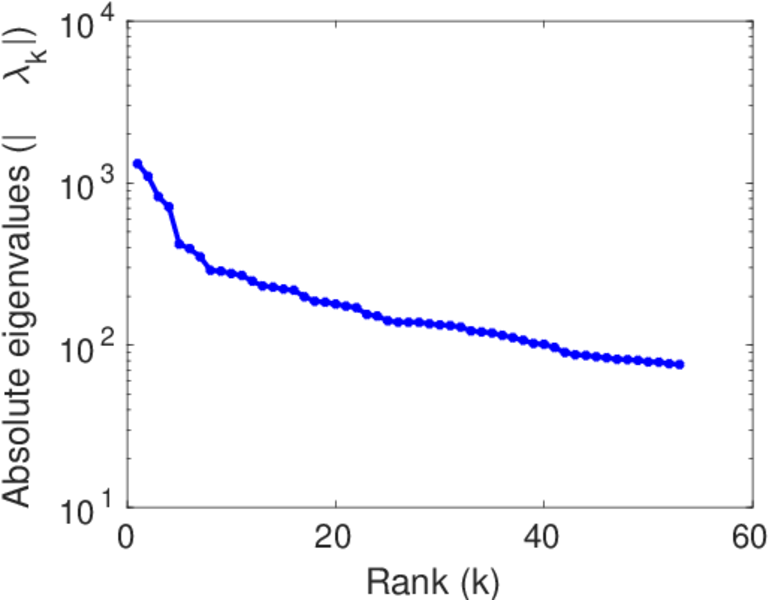
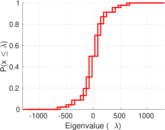
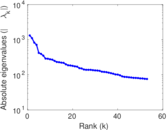
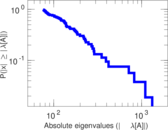
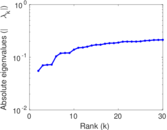
| Spectral norm | α = | 1,318.54
|
| Algebraic connectivity | a = | 0.055 068 4
|
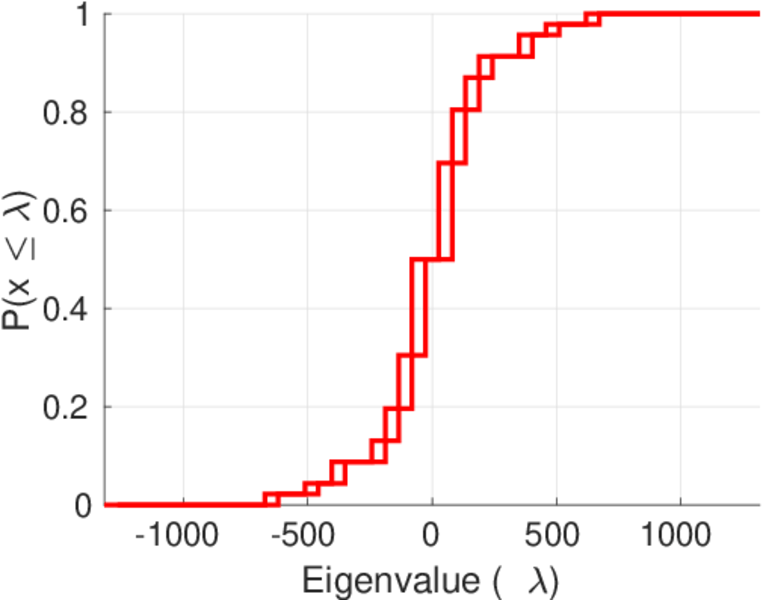
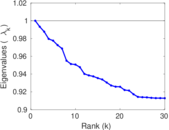
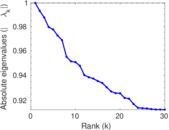
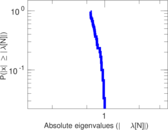
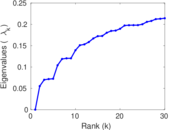
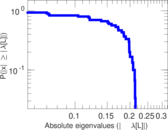
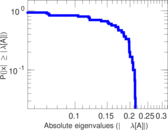
| Spectral separation | |λ1[A] / λ2[A]| = | 1.197 28
|
| Controllability | C = | 35,928
|
| Relative controllability | Cr = | 0.874 246
|
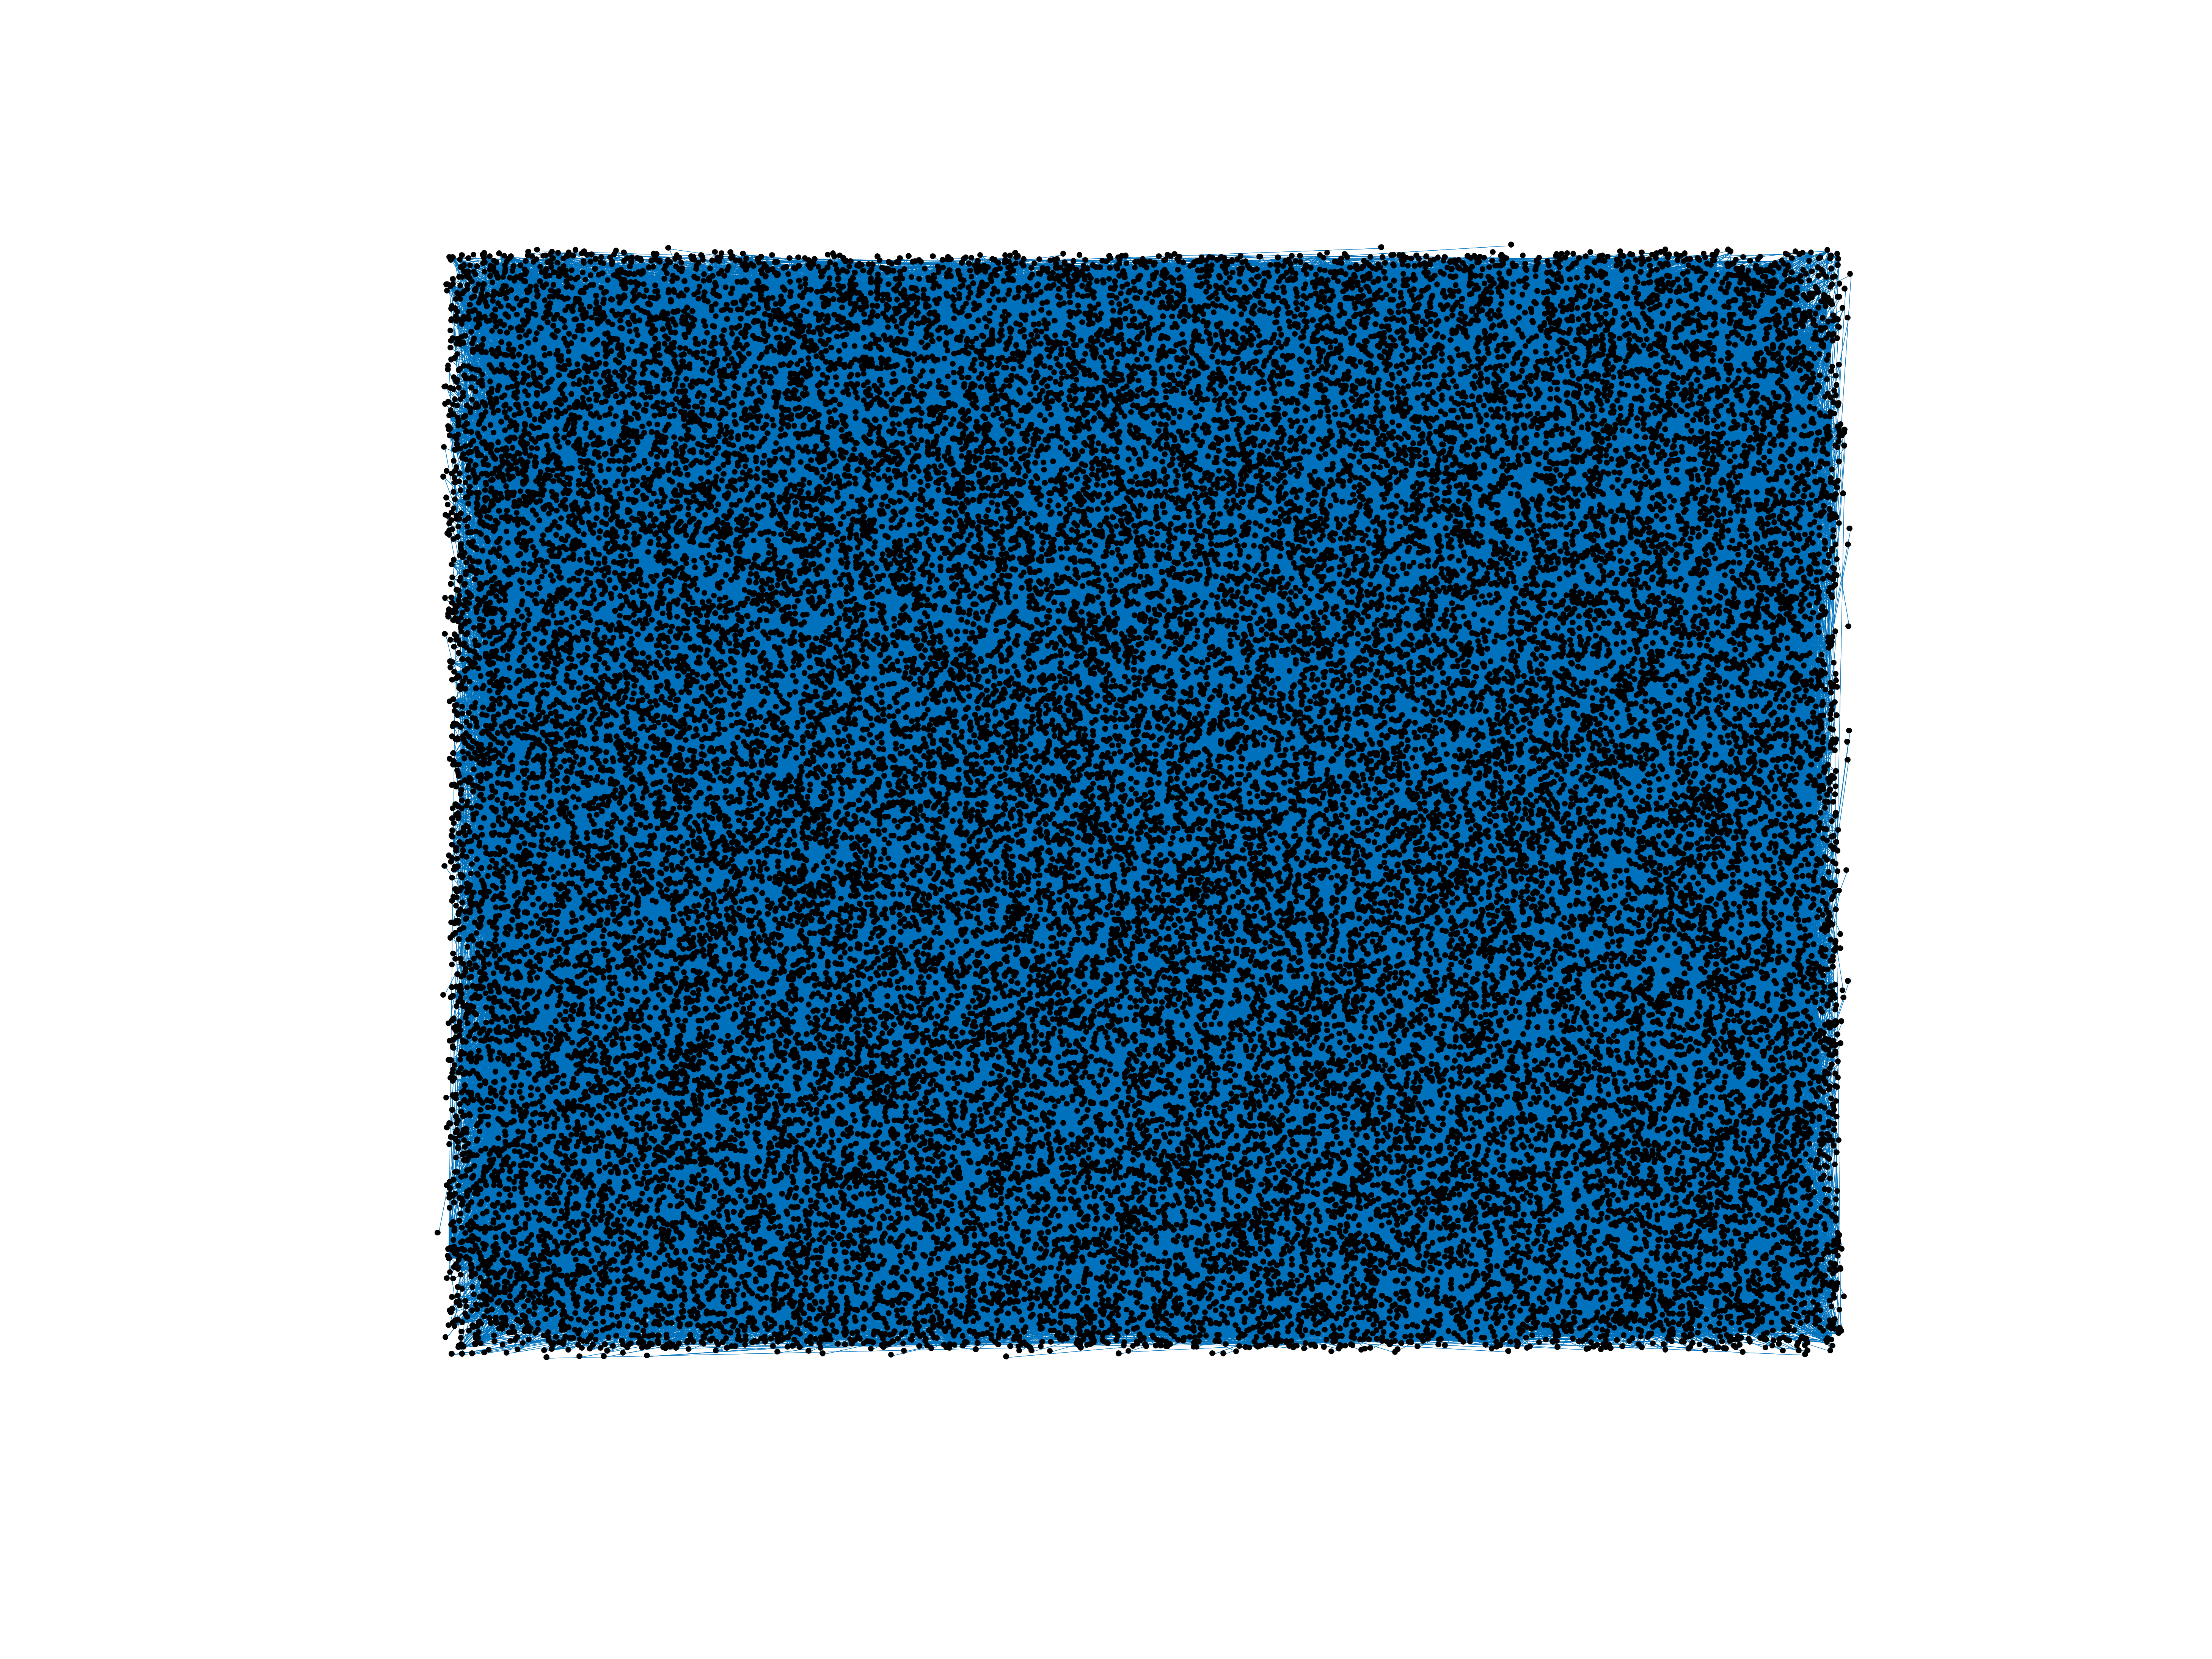
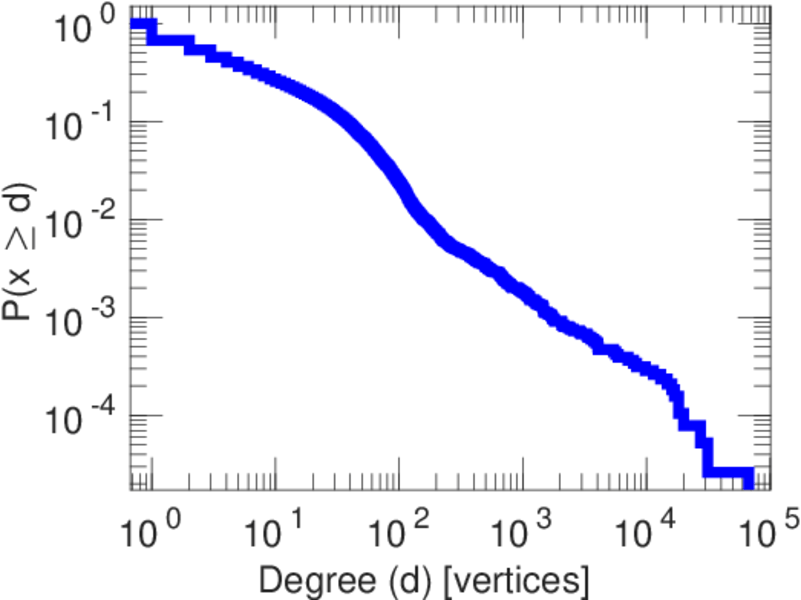
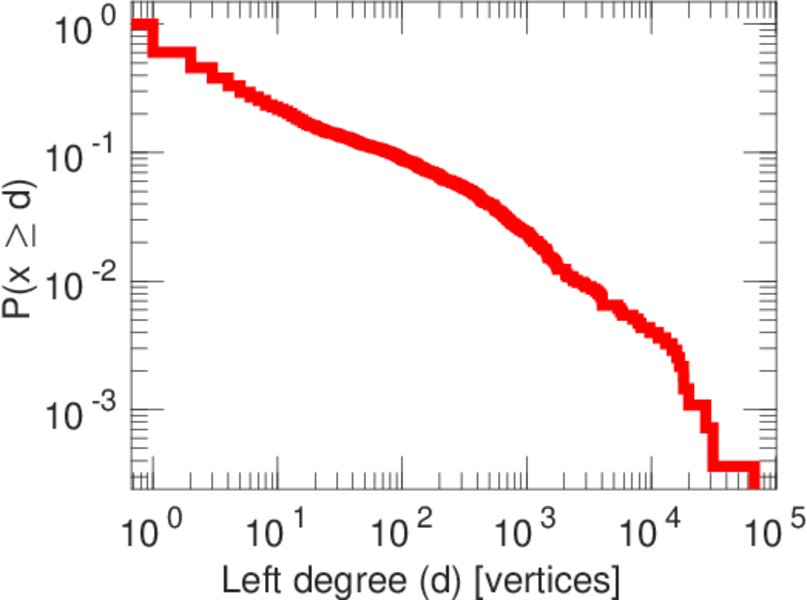
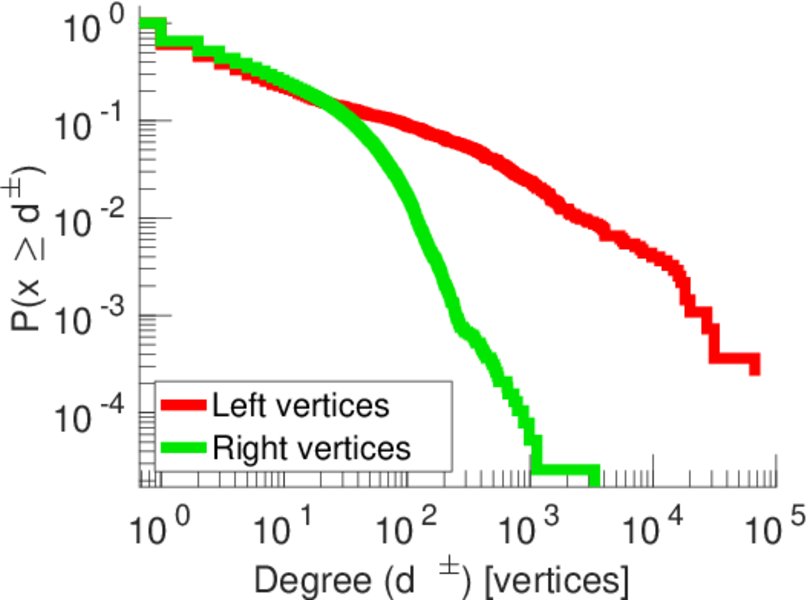
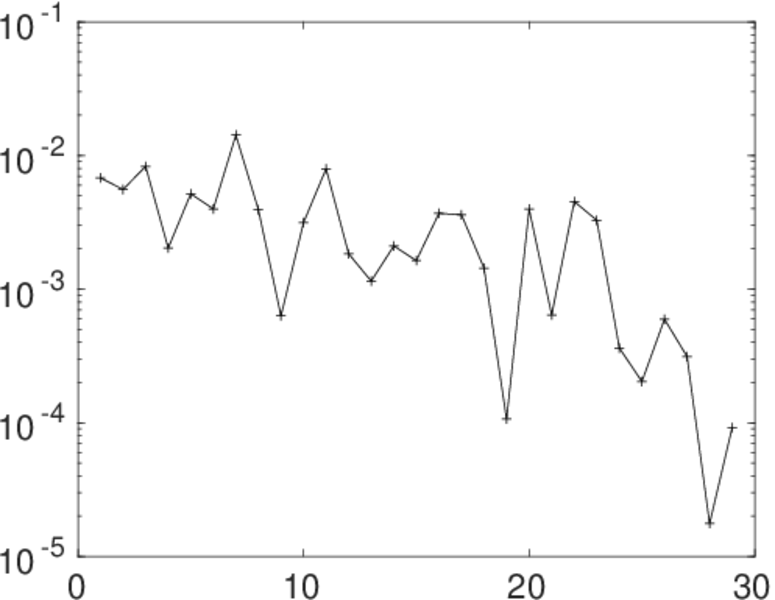
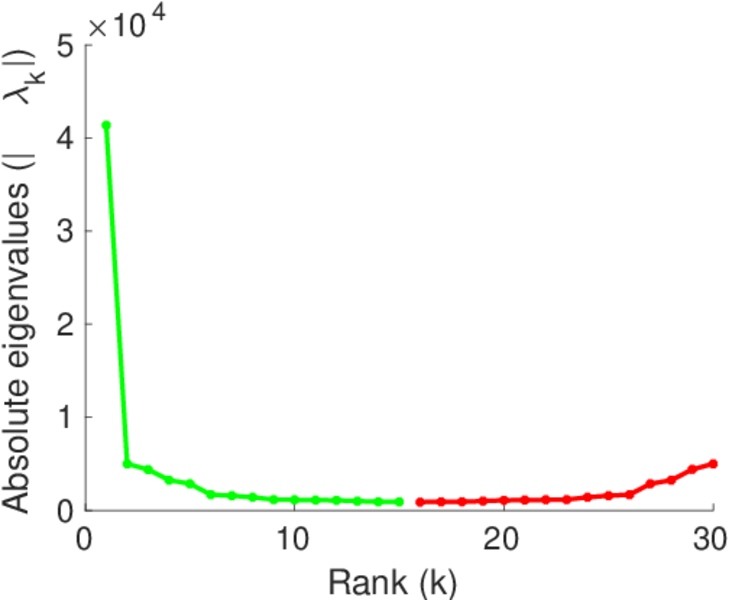
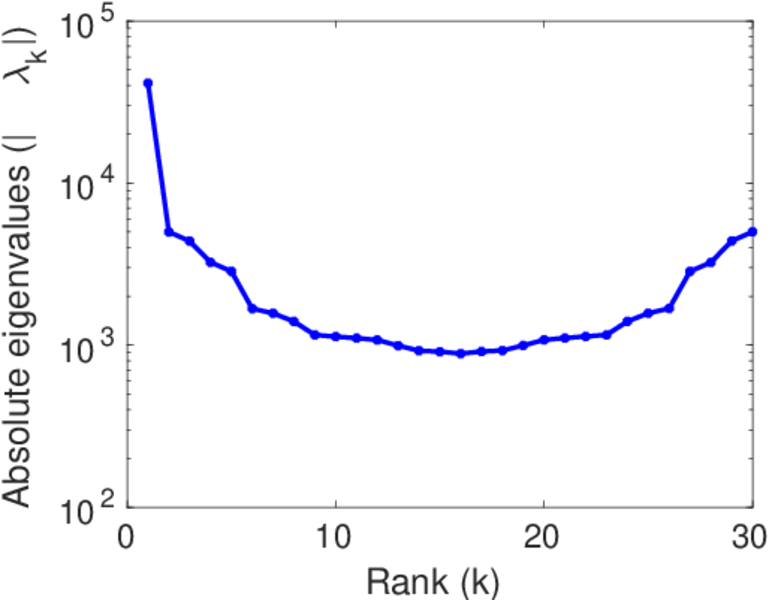
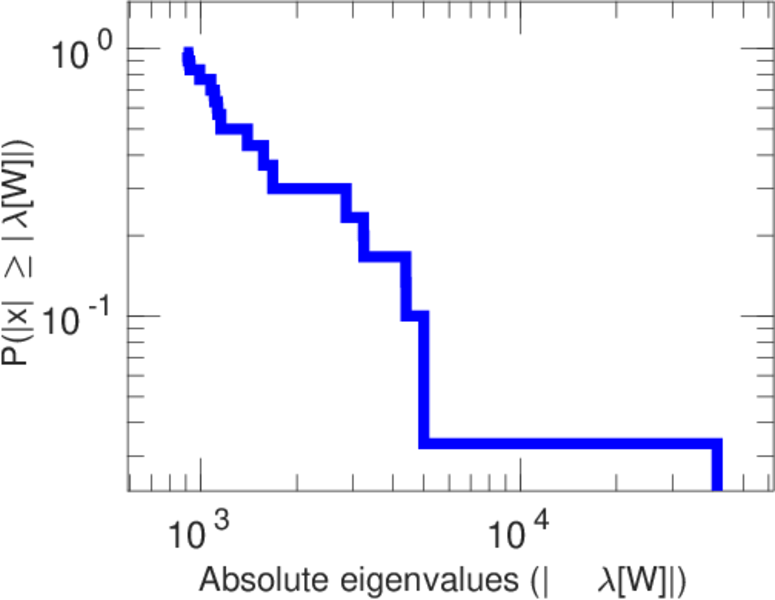
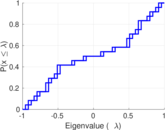
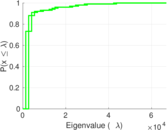
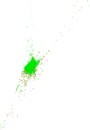
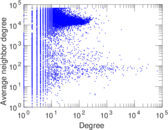
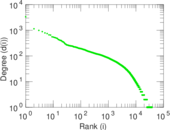
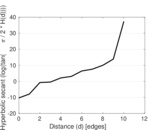
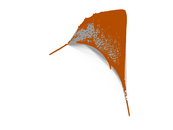
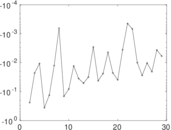
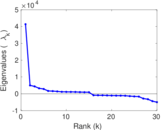
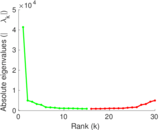
Plots


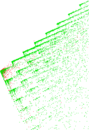
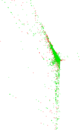


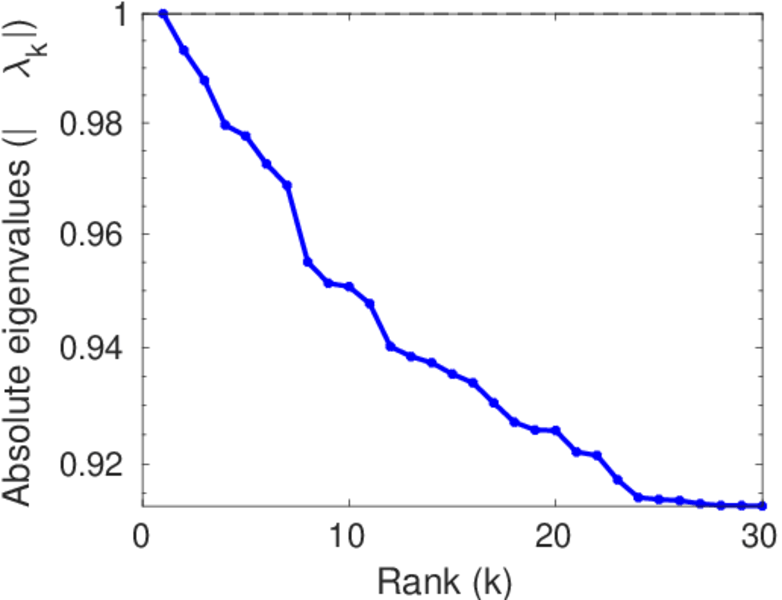
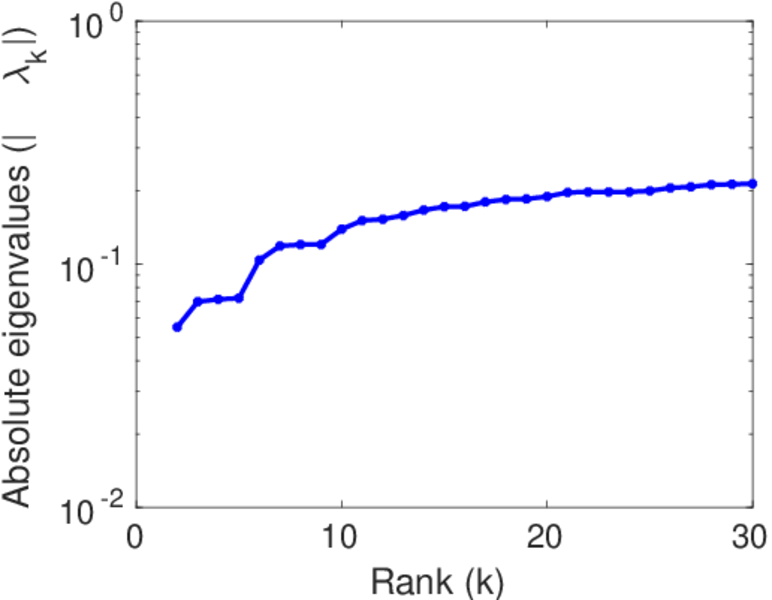
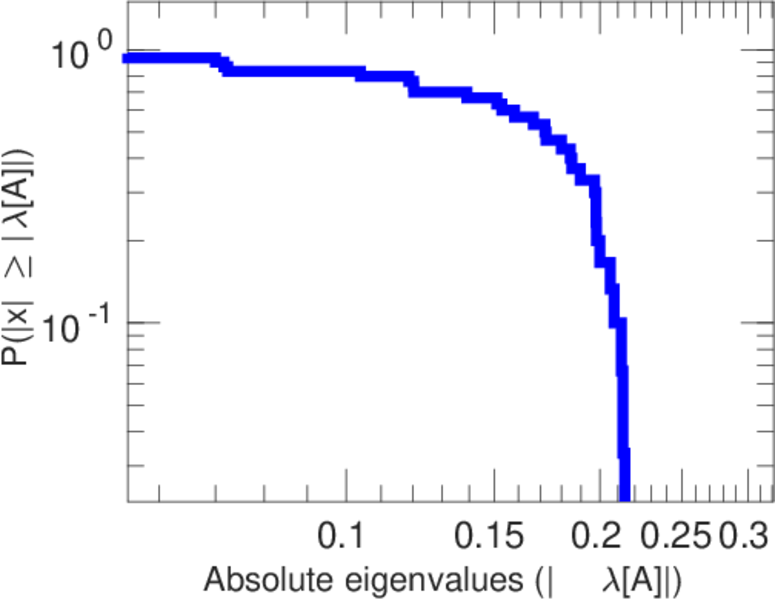
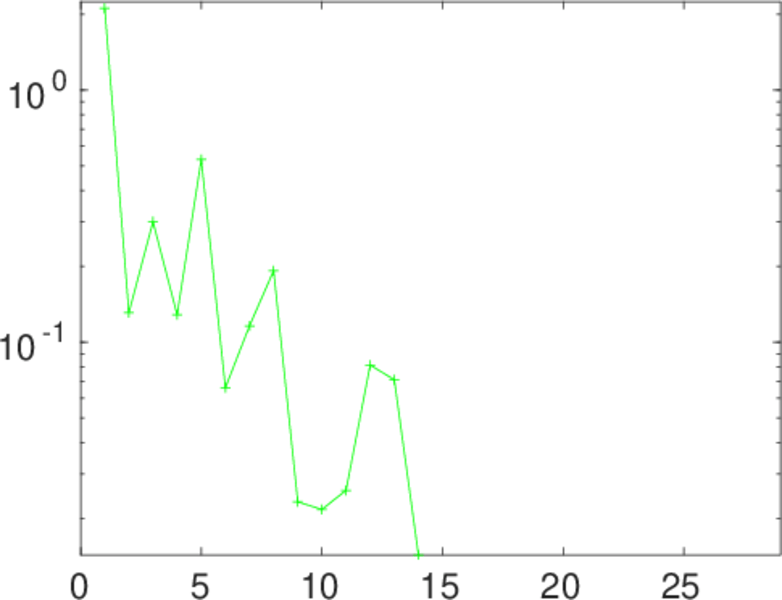
Matrix decompositions plots


Downloads
References
|
[1]
|
Jérôme Kunegis.
KONECT – The Koblenz Network Collection.
In Proc. Int. Conf. on World Wide Web Companion, pages
1343–1350, 2013.
[ http ]
|
|
[2]
|
Wikimedia Foundation.
Wikimedia downloads.
http://dumps.wikimedia.org/, January 2010.
|
 KONECT ‣ Networks ‣
Buy Me a Coffee
KONECT ‣ Networks ‣
Buy Me a Coffee