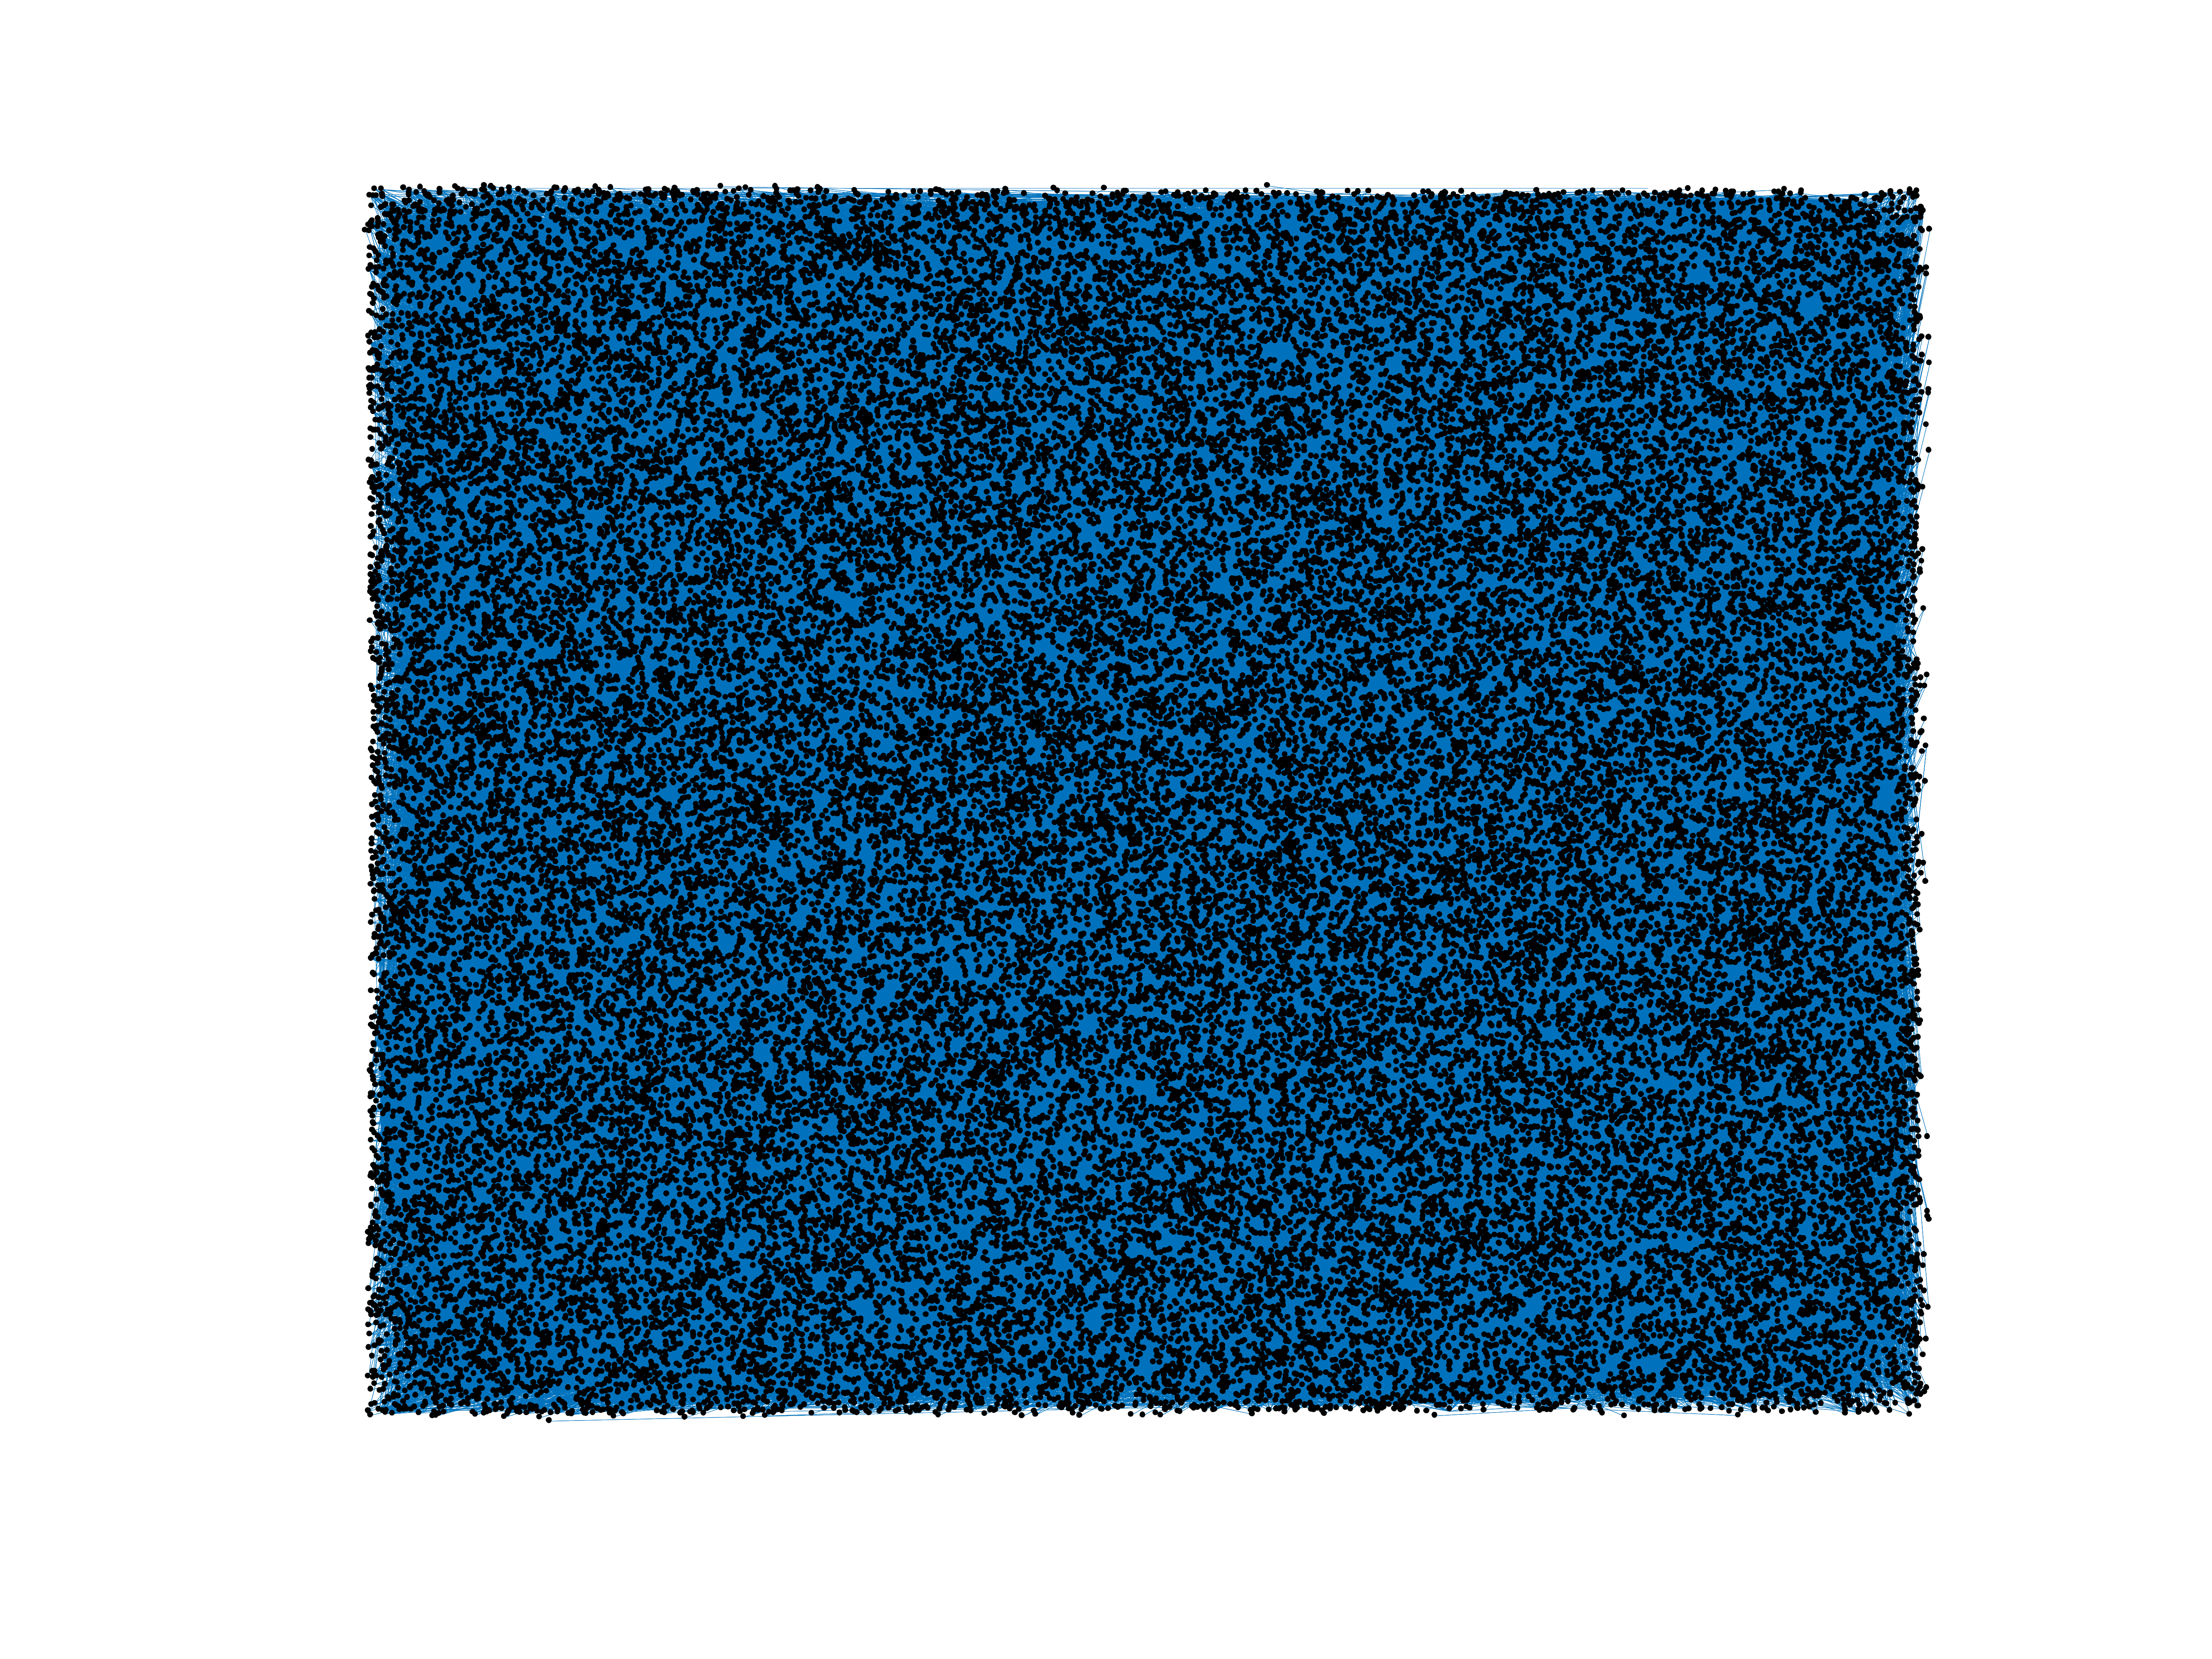
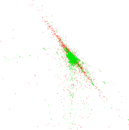
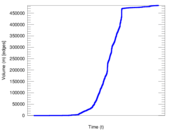
Wikipedia edits (yo)
This is the bipartite edit network of the Yoruba Wikipedia. It contains users
and pages from the Yoruba Wikipedia, connected by edit events. Each edge
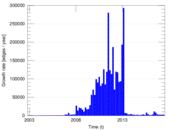
represents an edit. The dataset includes the timestamp of each edit.
Metadata
Statistics
| Size | n = | 55,100
|
| Left size | n1 = | 1,713
|
| Right size | n2 = | 53,387
|
| Volume | m = | 484,122
|
| Unique edge count | m̿ = | 288,902
|
| Wedge count | s = | 2,312,647,116
|
| Claw count | z = | 23,674,430,368,695
|
| Cross count | x = | 230,687,492,572,426,080
|
| Square count | q = | 2,642,750,694
|
| 4-Tour count | T4 = | 30,393,449,056
|
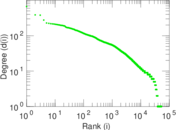
| Maximum degree | dmax = | 83,382
|
| Maximum left degree | d1max = | 83,382
|
| Maximum right degree | d2max = | 670
|
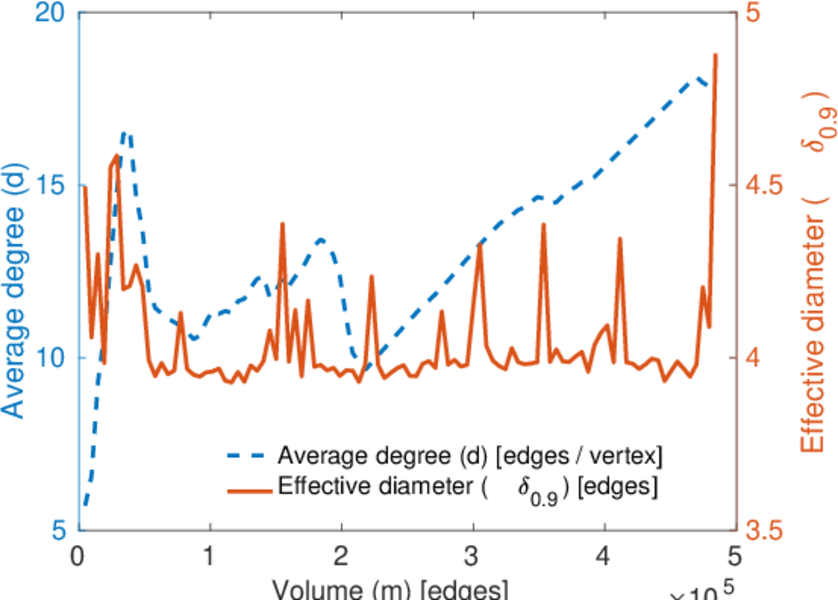
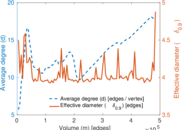
| Average degree | d = | 17.572 5
|
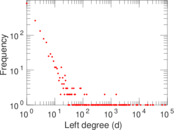
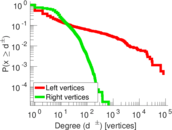
| Average left degree | d1 = | 282.616
|
| Average right degree | d2 = | 9.068 16
|
| Fill | p = | 0.003 159 06
|
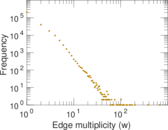
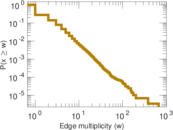
| Average edge multiplicity | m̃ = | 1.675 73
|
| Size of LCC | N = | 53,856
|
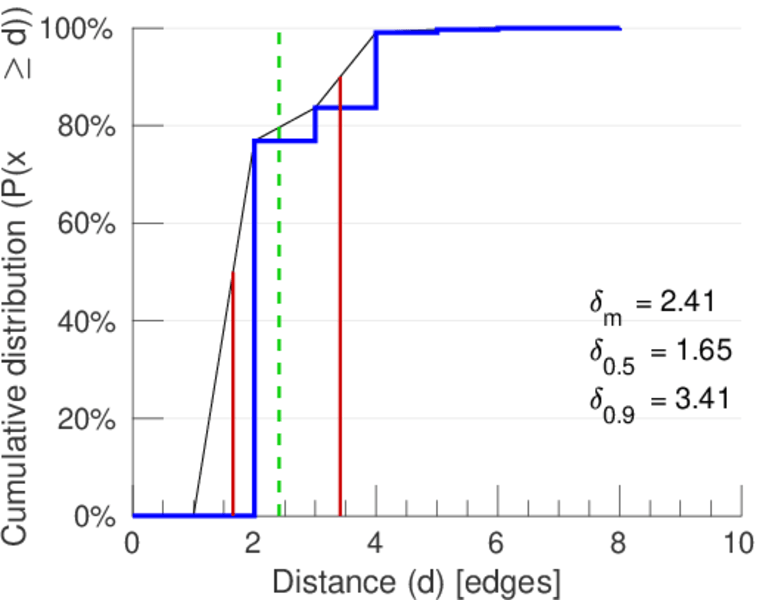
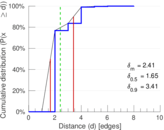
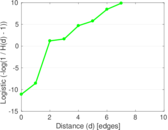
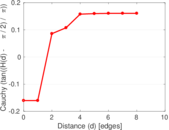
| Diameter | δ = | 12
|
| 50-Percentile effective diameter | δ0.5 = | 1.650 40
|
| 90-Percentile effective diameter | δ0.9 = | 3.411 29
|
| Median distance | δM = | 2
|
| Mean distance | δm = | 2.407 12
|
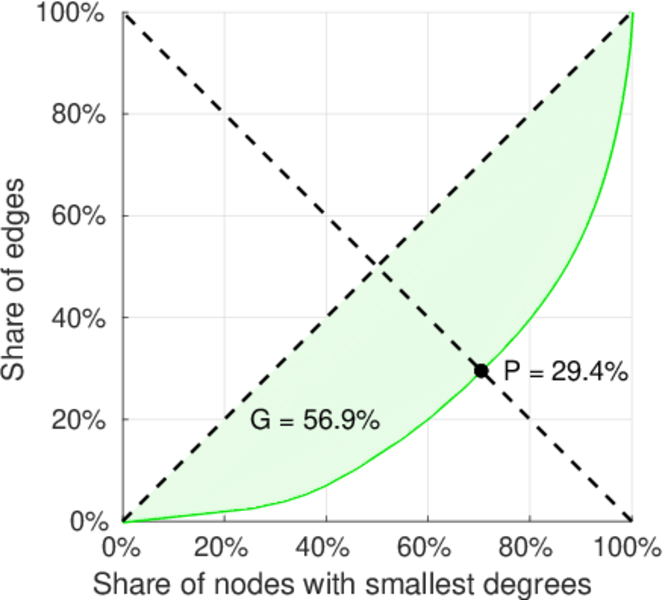
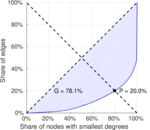
| Gini coefficient | G = | 0.780 141
|
| Balanced inequality ratio | P = | 0.200 479
|
| Left balanced inequality ratio | P1 = | 0.032 799 6
|
| Right balanced inequality ratio | P2 = | 0.294 013
|
| Relative edge distribution entropy | Her = | 0.710 979
|
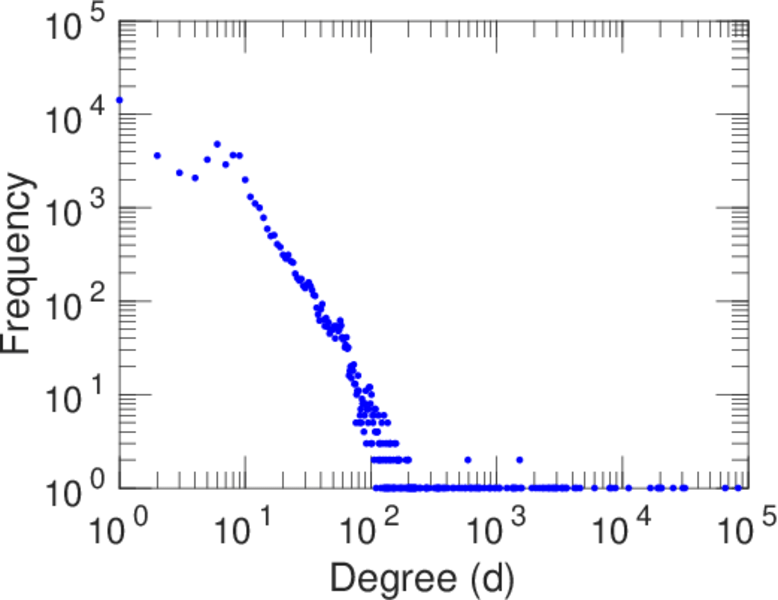
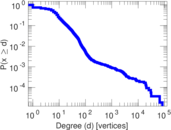
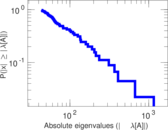
| Power law exponent | γ = | 1.803 26
|
| Tail power law exponent | γt = | 2.931 00
|
| Tail power law exponent with p | γ3 = | 2.931 00
|
| p-value | p = | 0.000 00
|
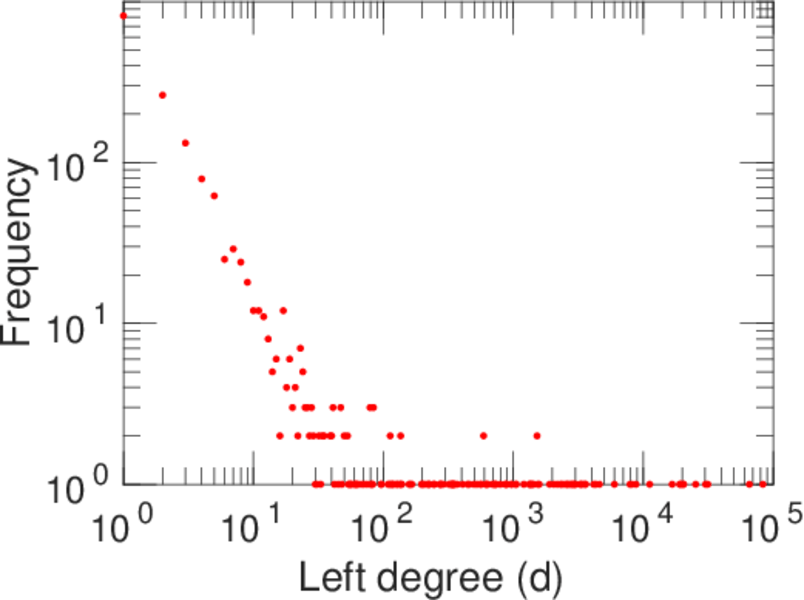
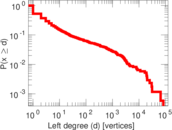
| Left tail power law exponent with p | γ3,1 = | 1.441 00
|
| Left p-value | p1 = | 0.000 00
|
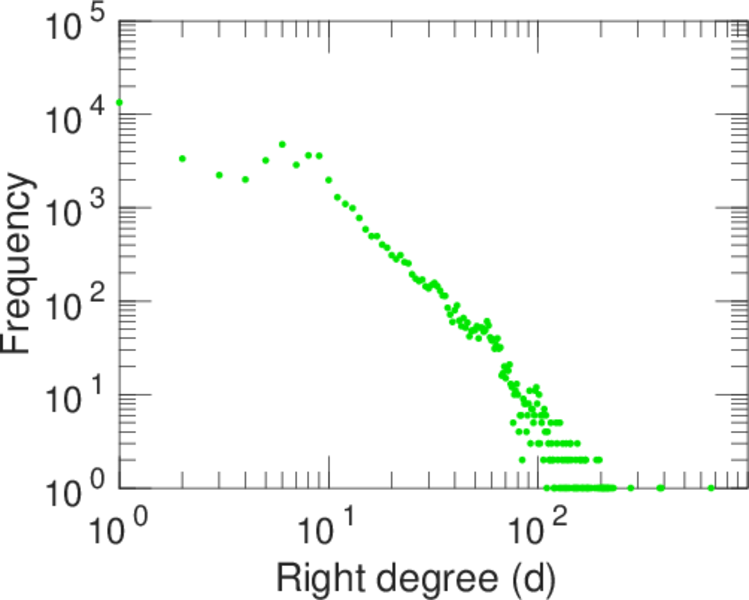
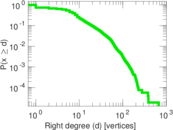
| Right tail power law exponent with p | γ3,2 = | 7.971 00
|
| Right p-value | p2 = | 0.405 000
|
| Degree assortativity | ρ = | −0.369 505
|
| Degree assortativity p-value | pρ = | 0.000 00
|
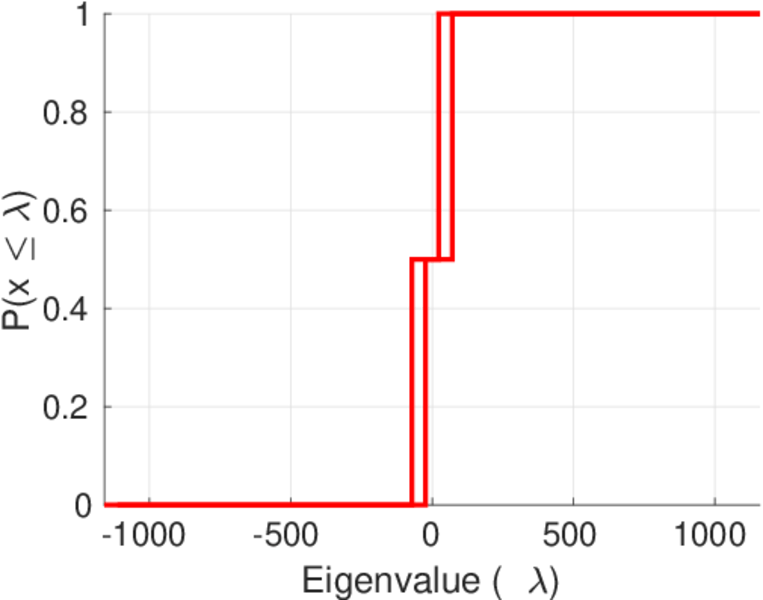
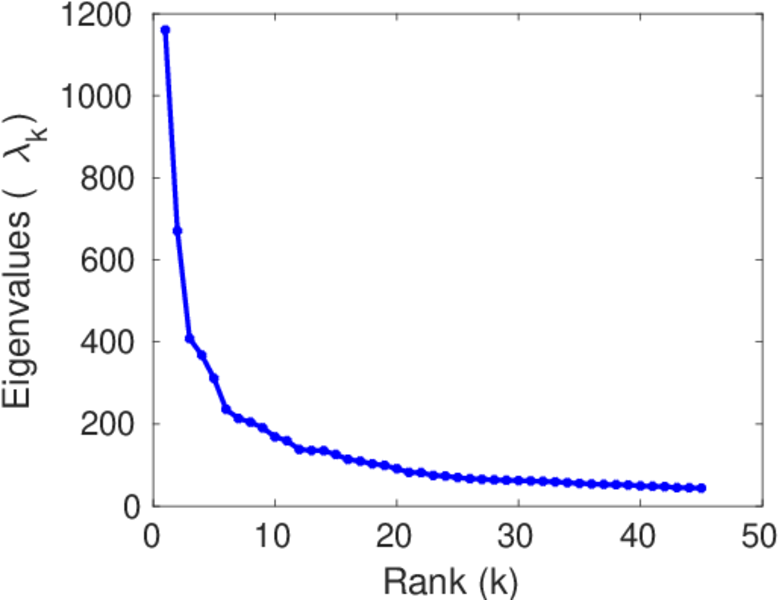
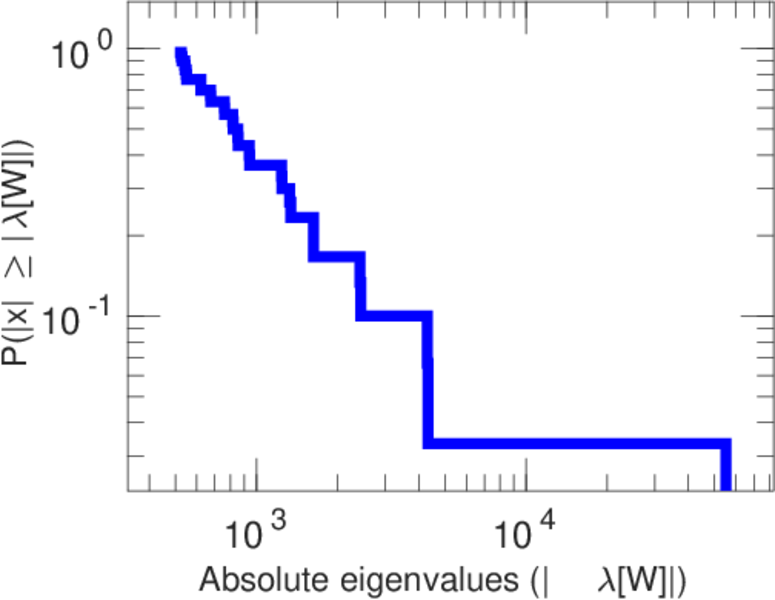
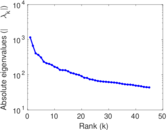
| Spectral norm | α = | 1,160.31
|
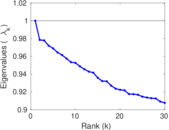
| Algebraic connectivity | a = | 0.041 548 7
|
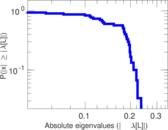
| Spectral separation | |λ1[A] / λ2[A]| = | 1.730 04
|
| Controllability | C = | 51,366
|
| Relative controllability | Cr = | 0.941 511
|
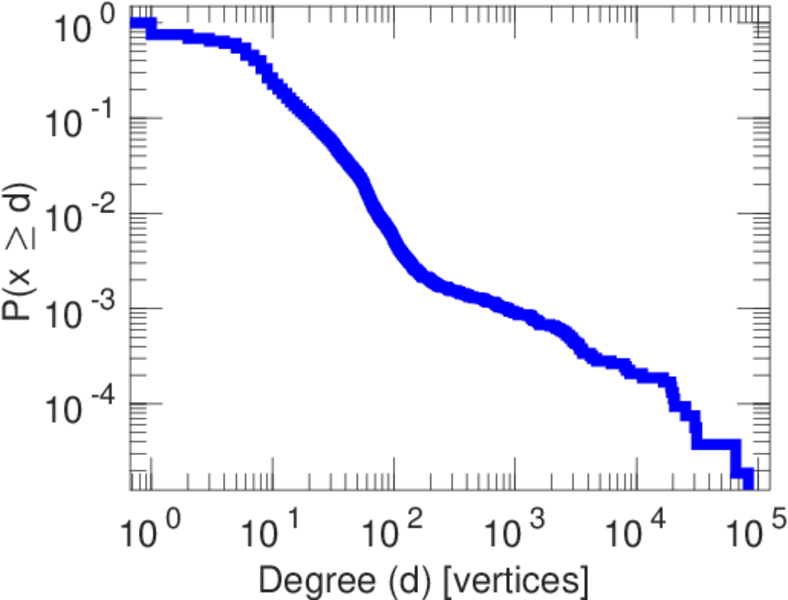
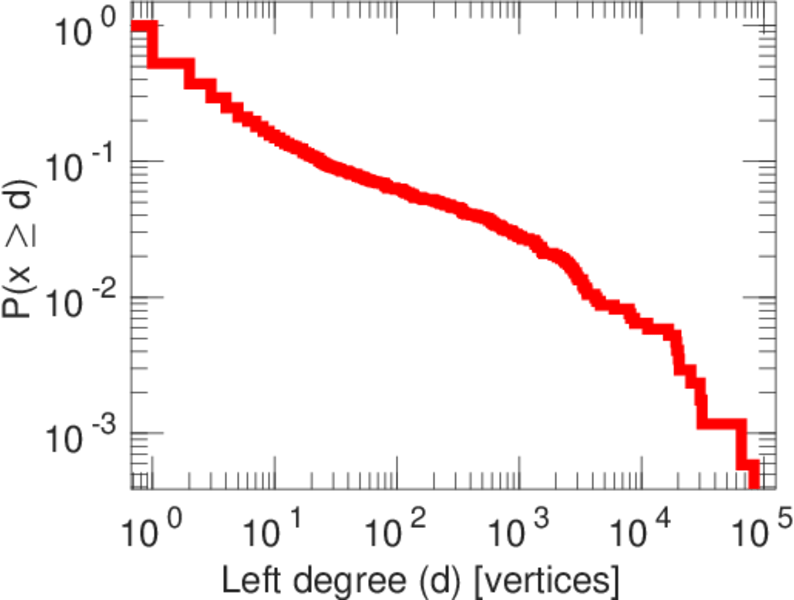
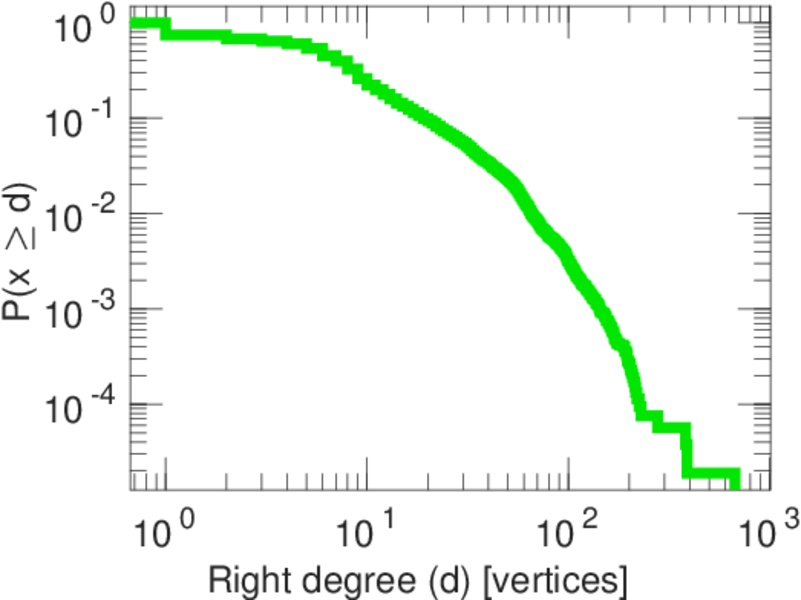
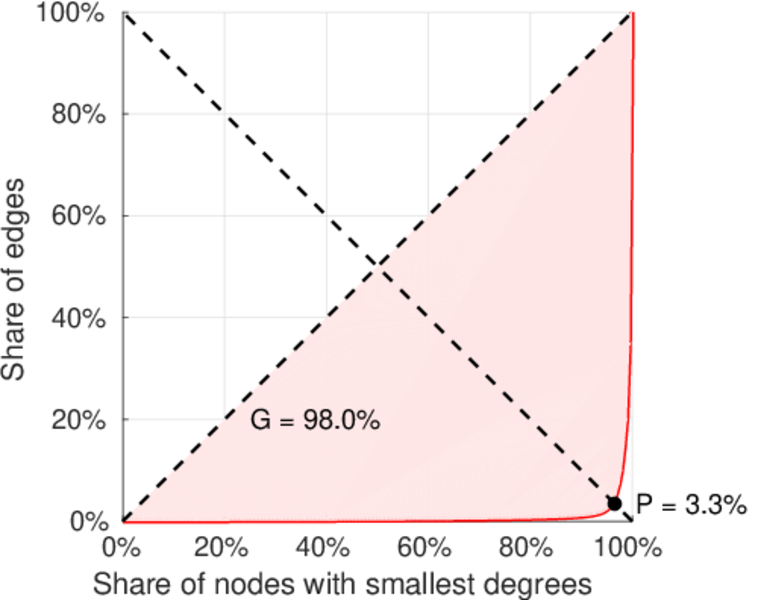
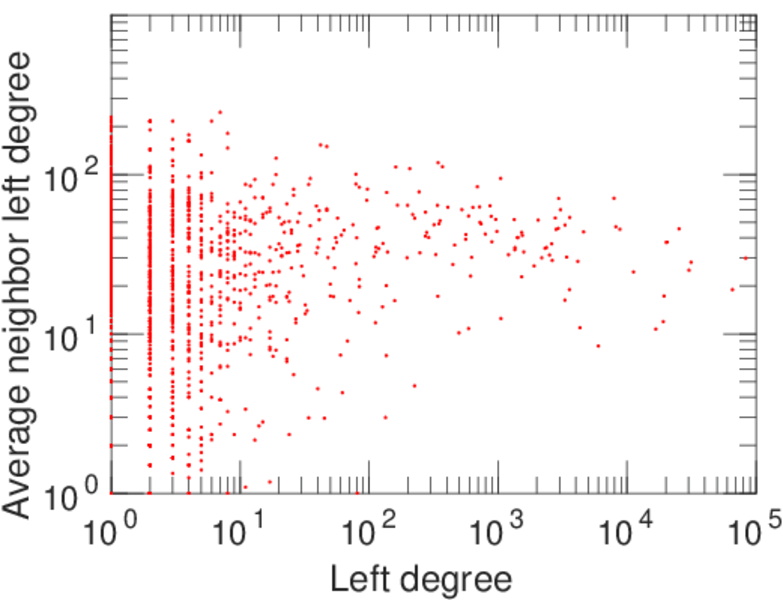
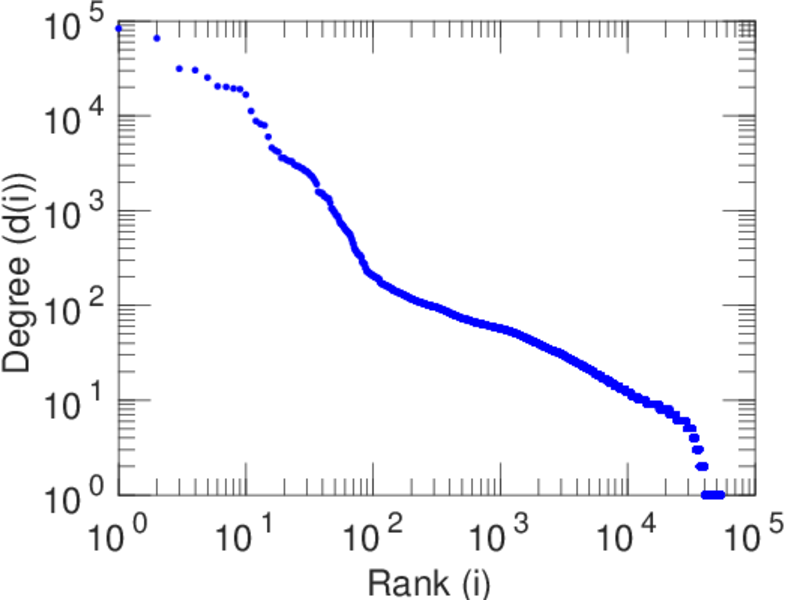
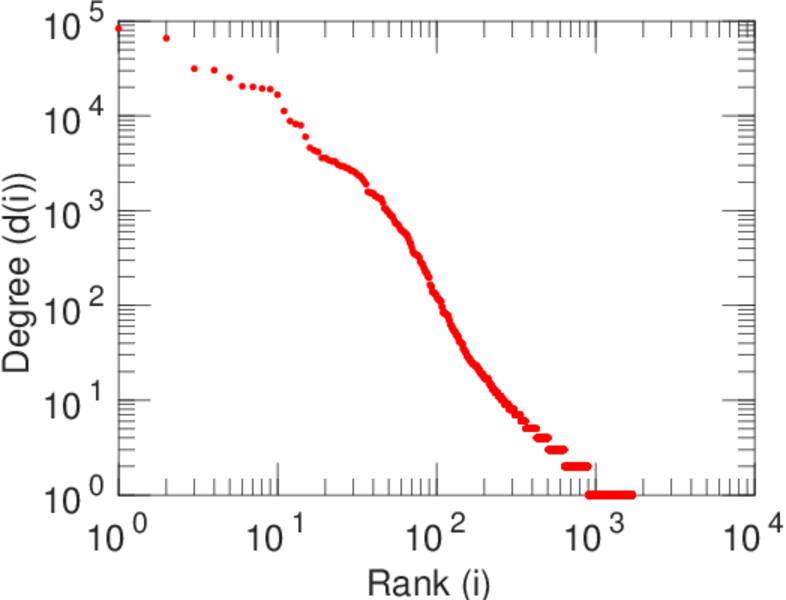
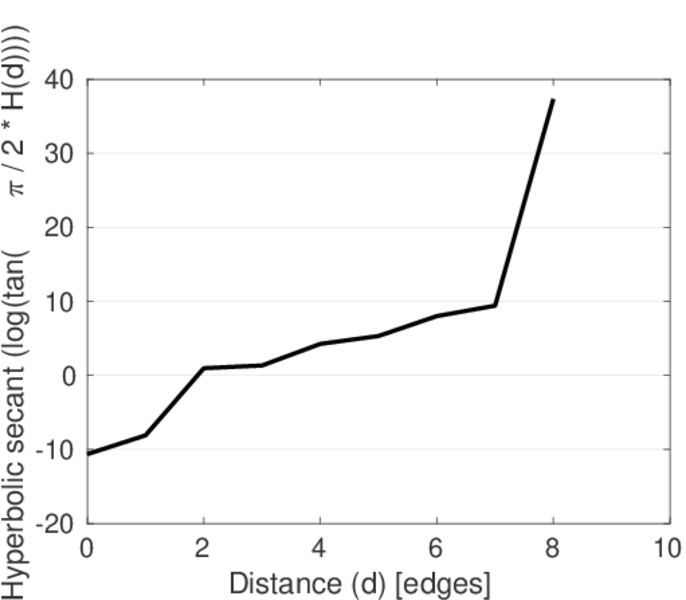
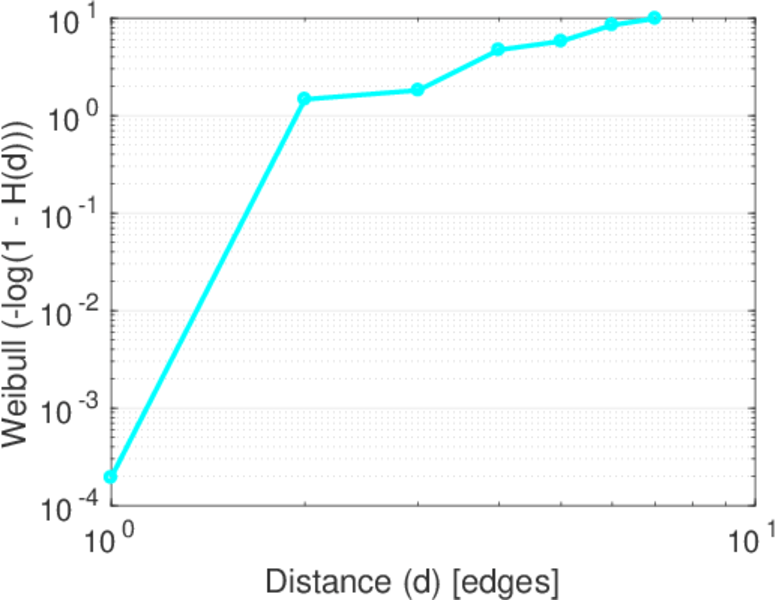
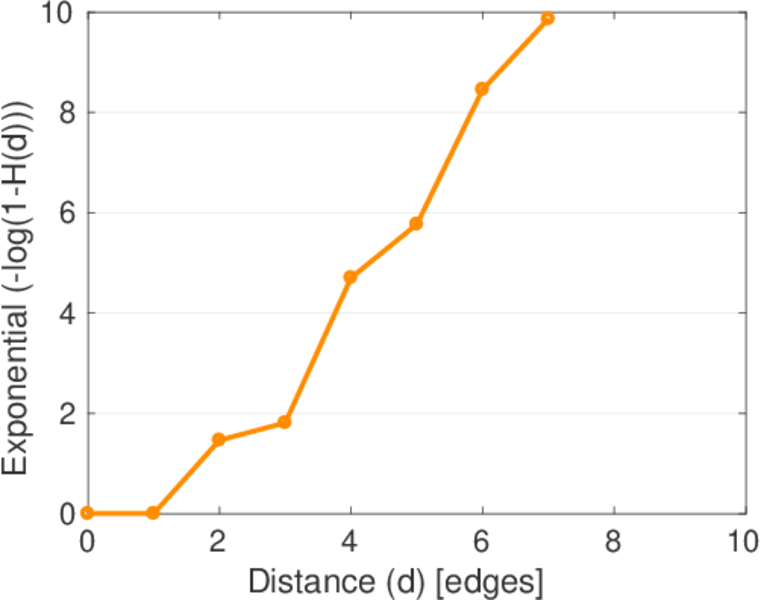
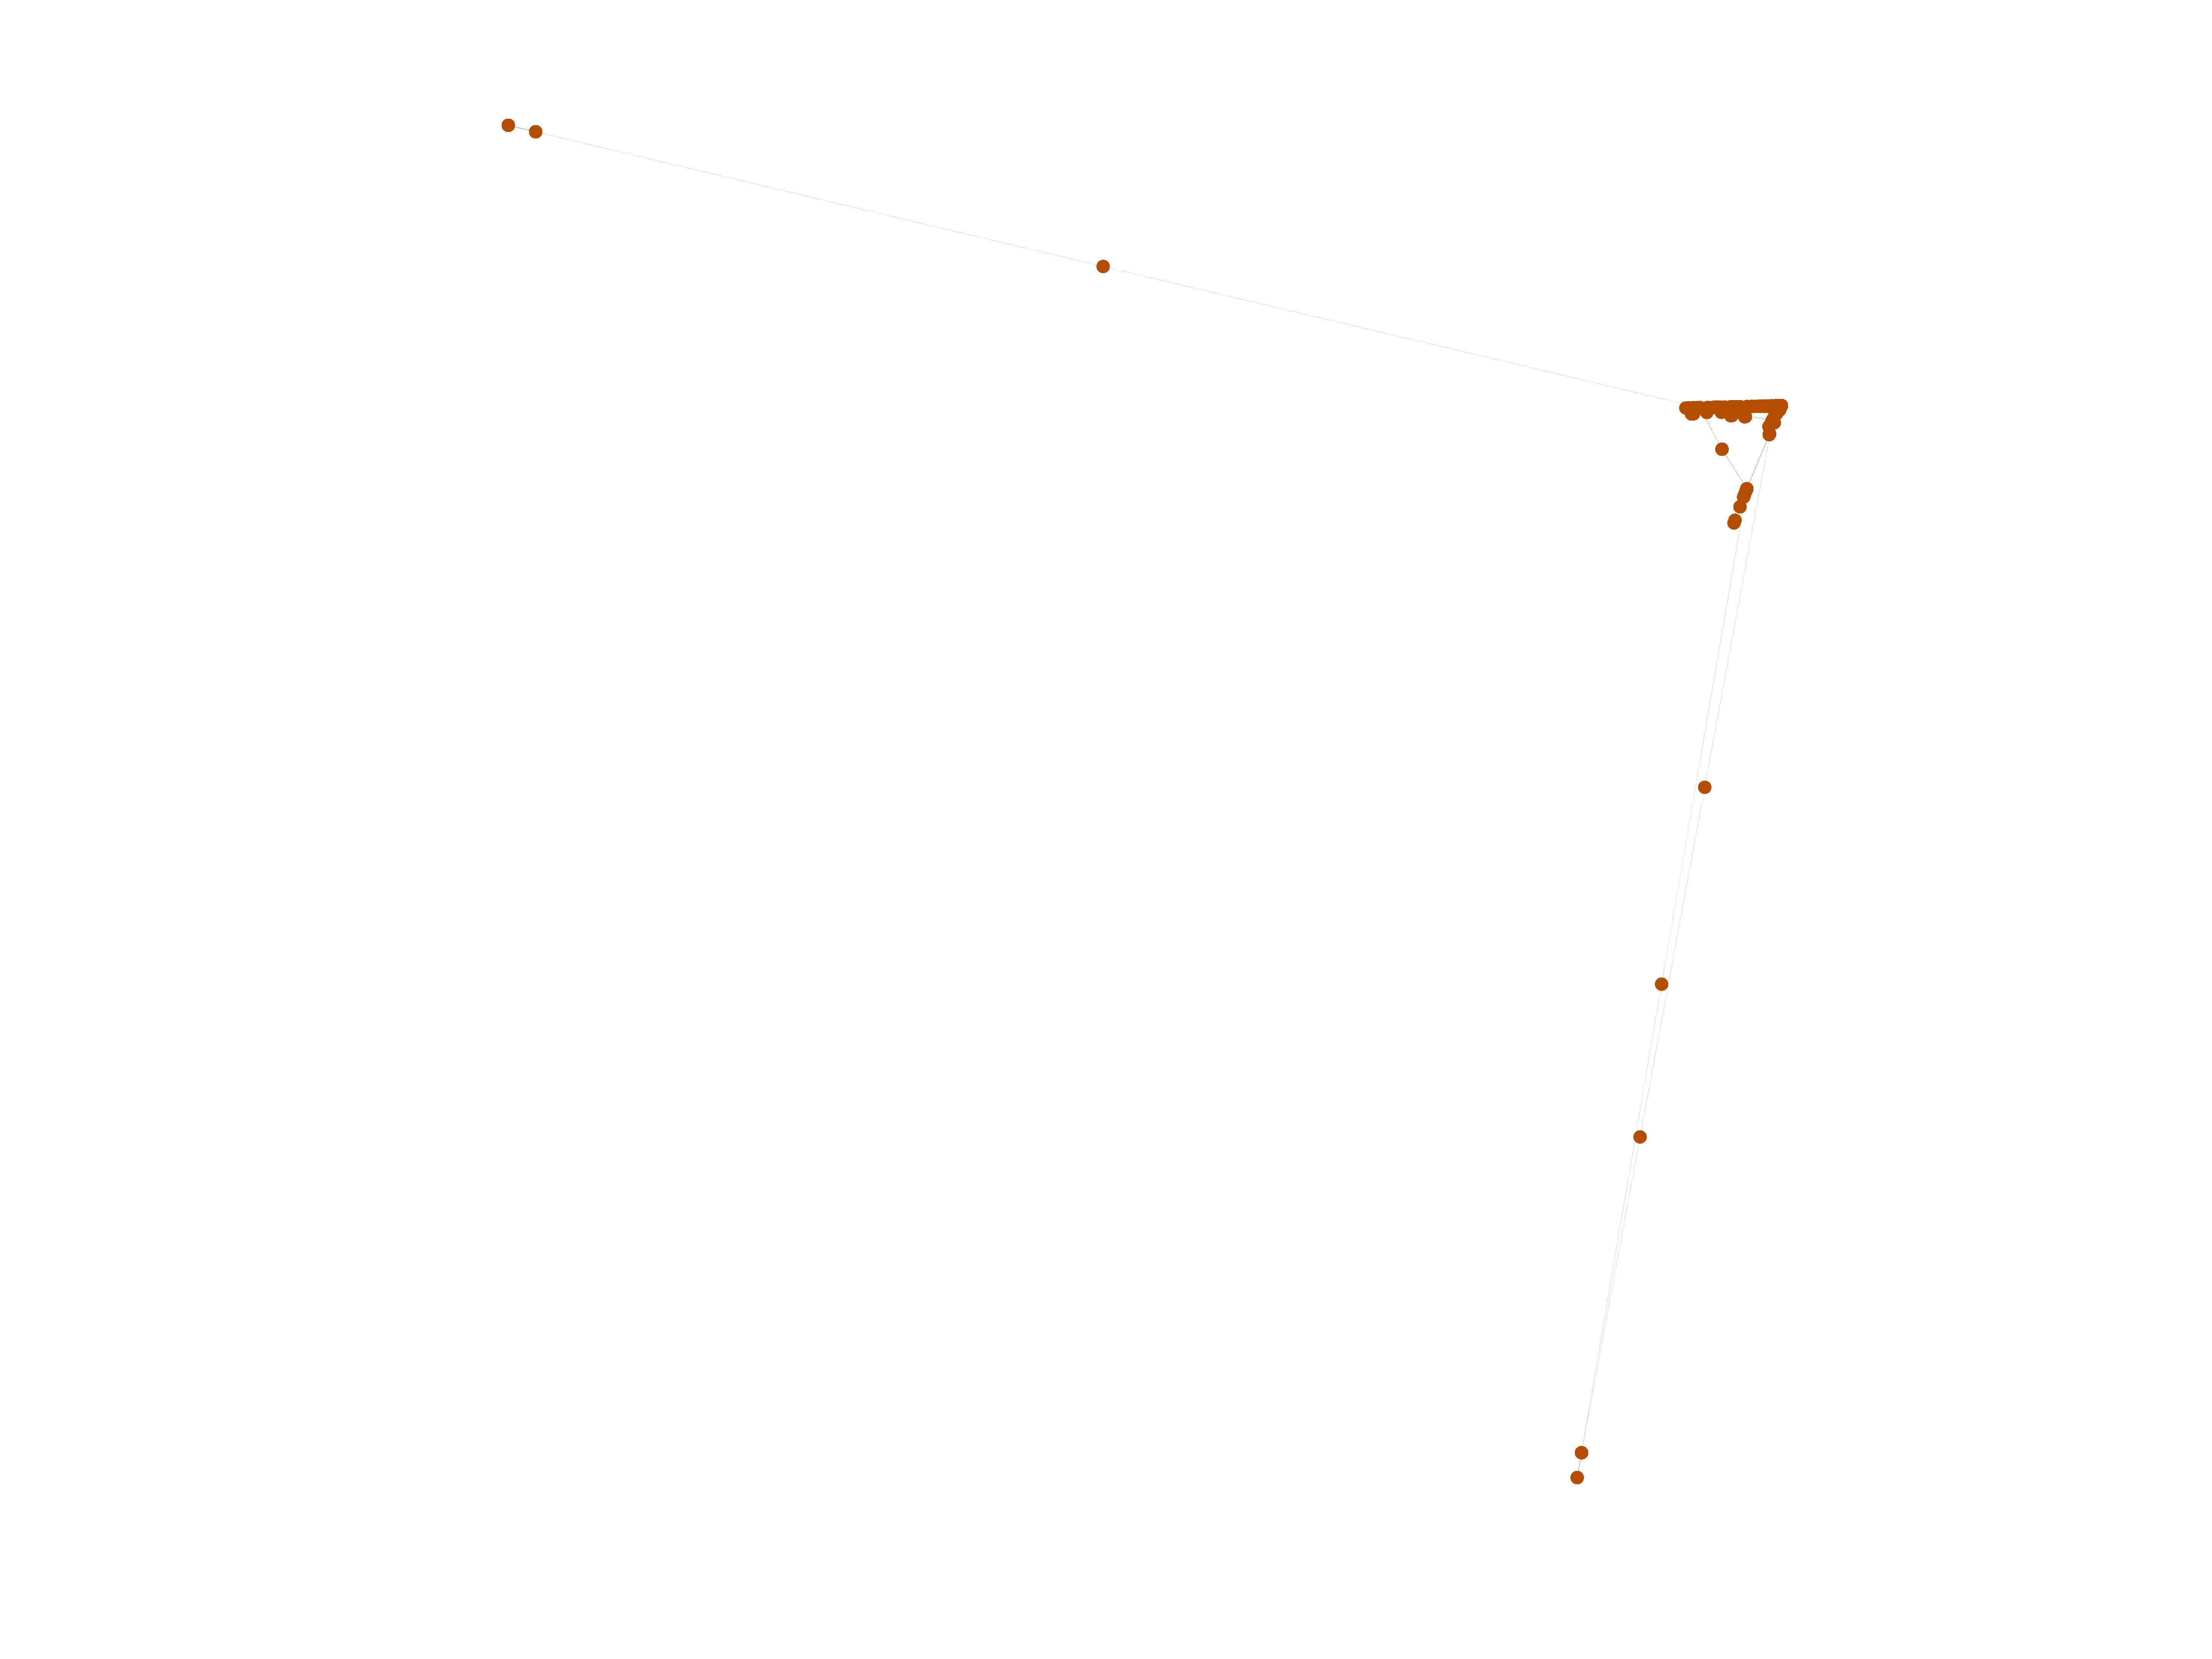
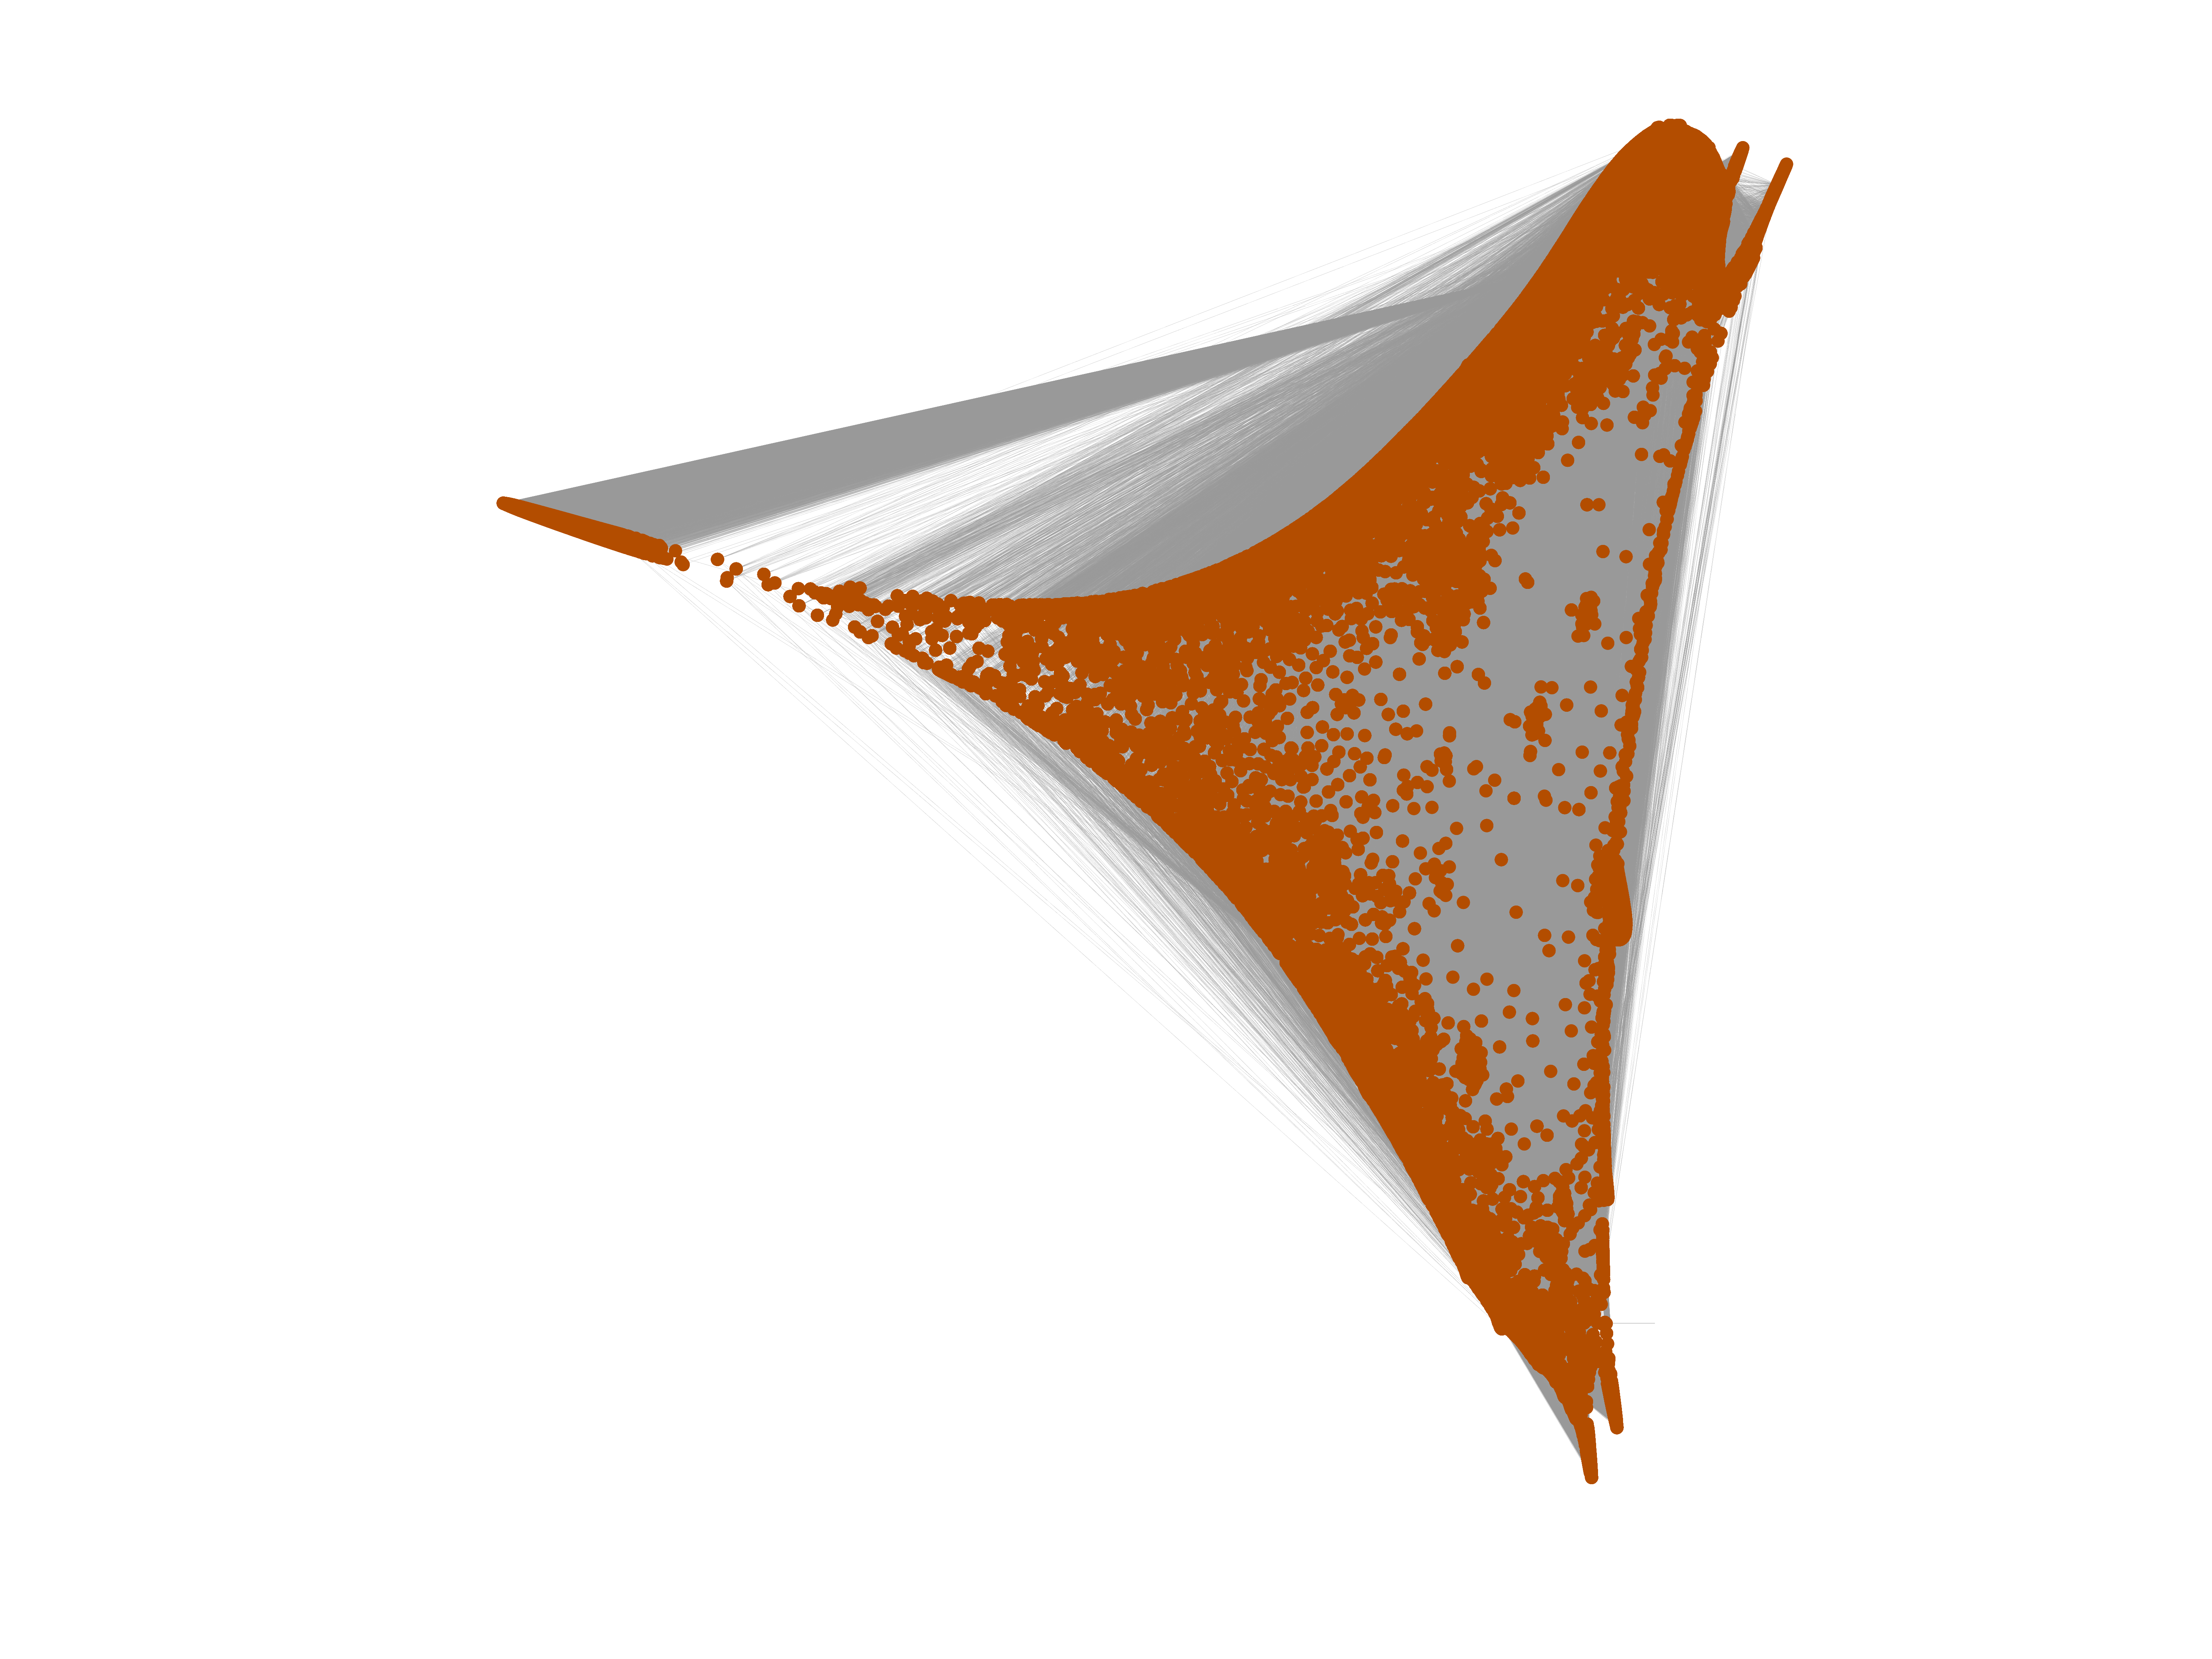
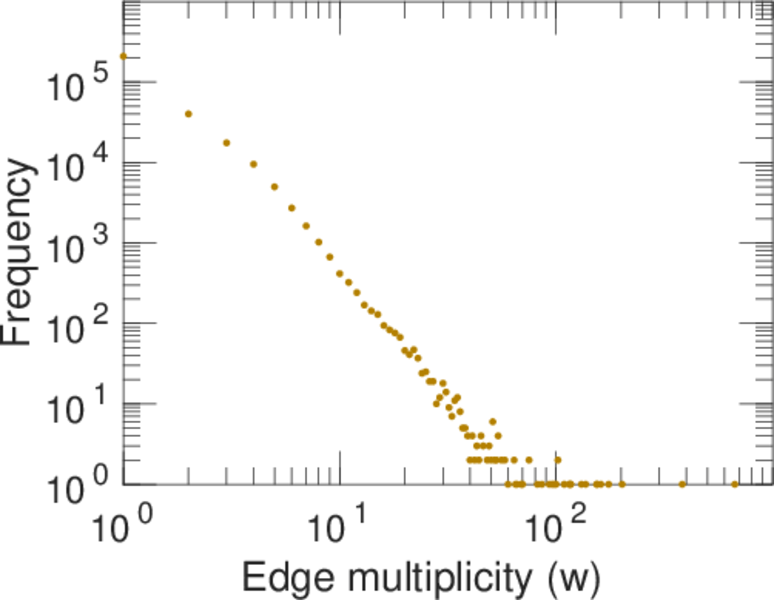
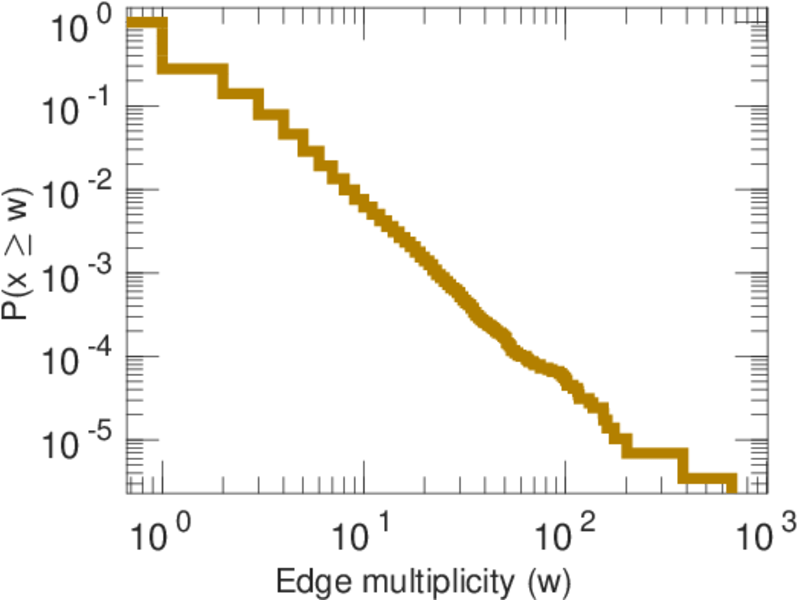
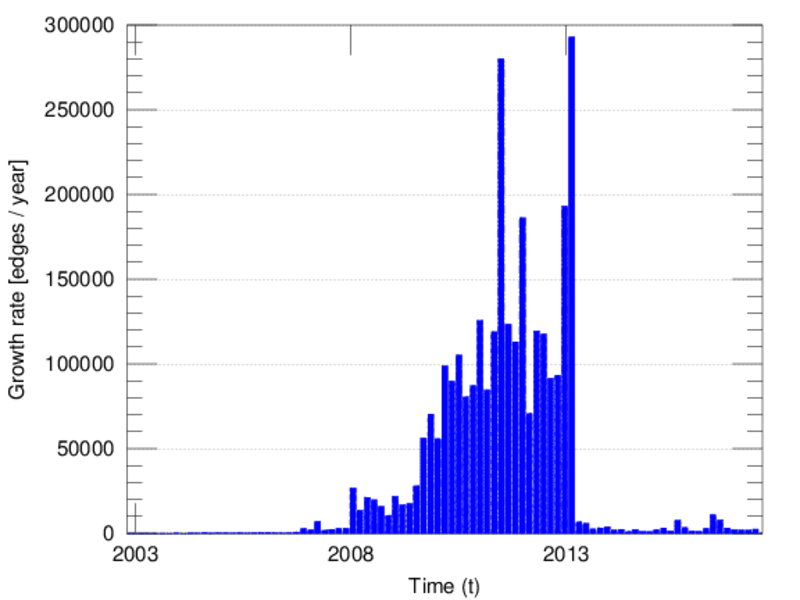
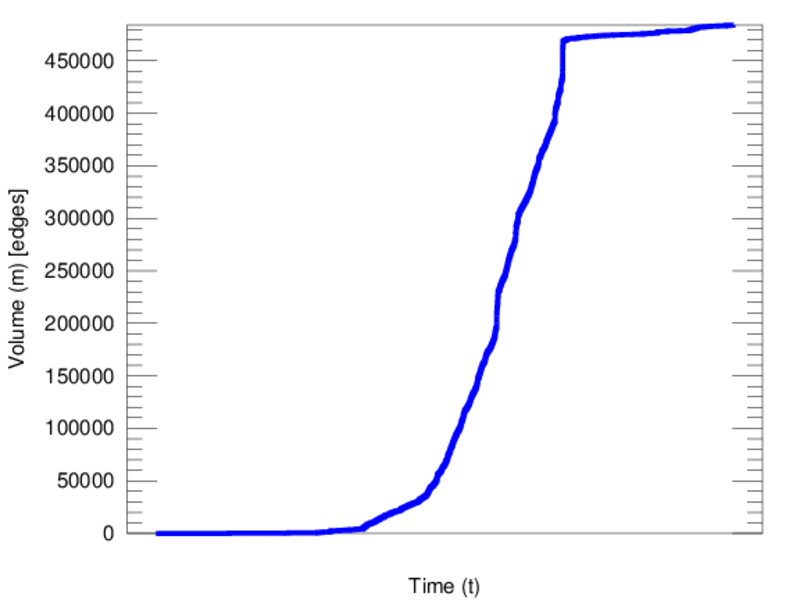
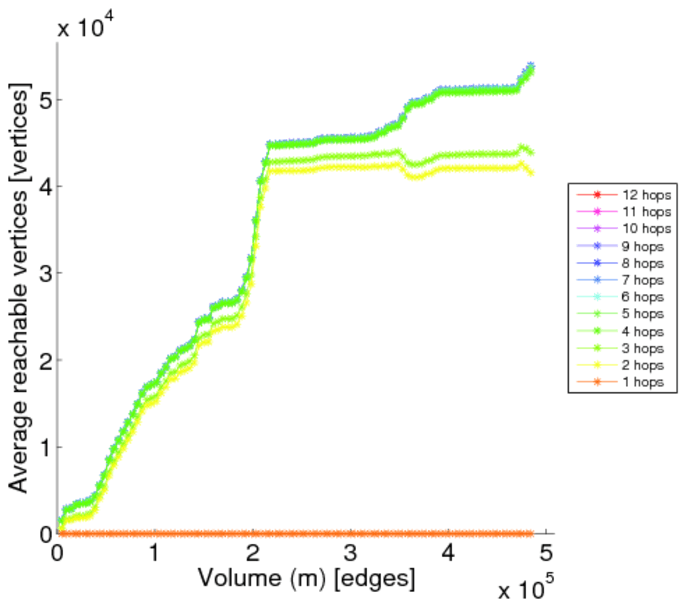
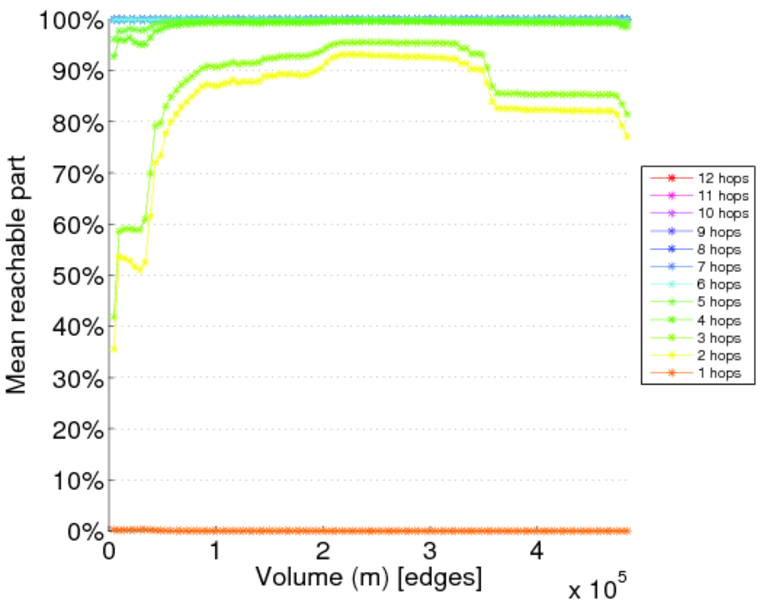
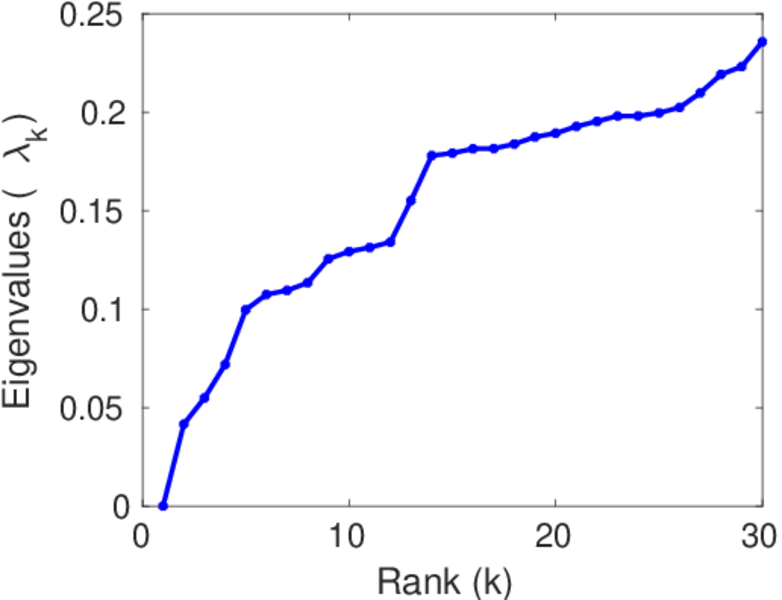
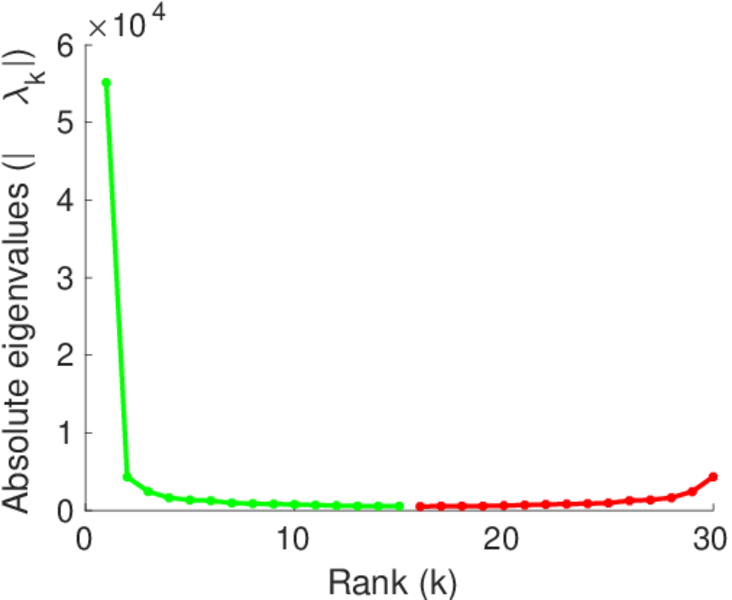
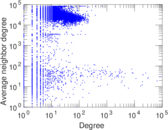
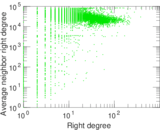
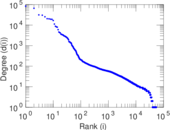
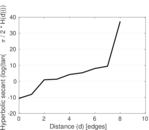
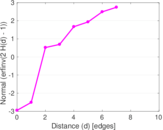
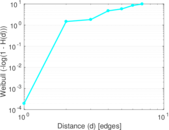
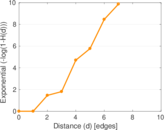
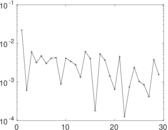
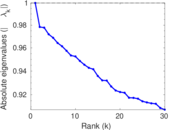
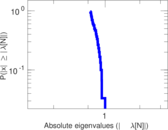
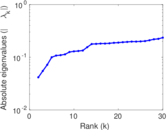
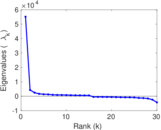
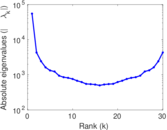
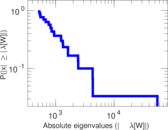
Plots


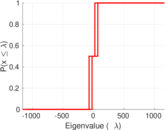

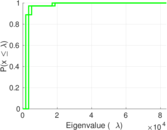

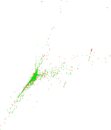


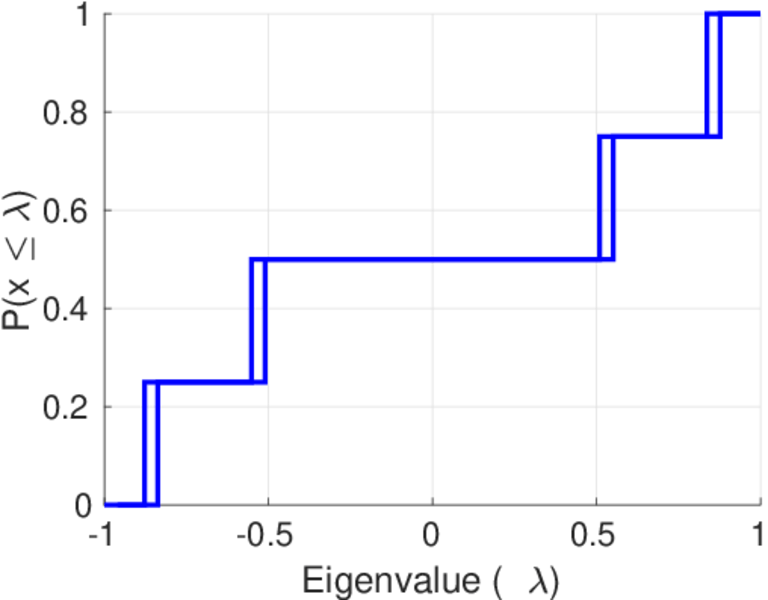
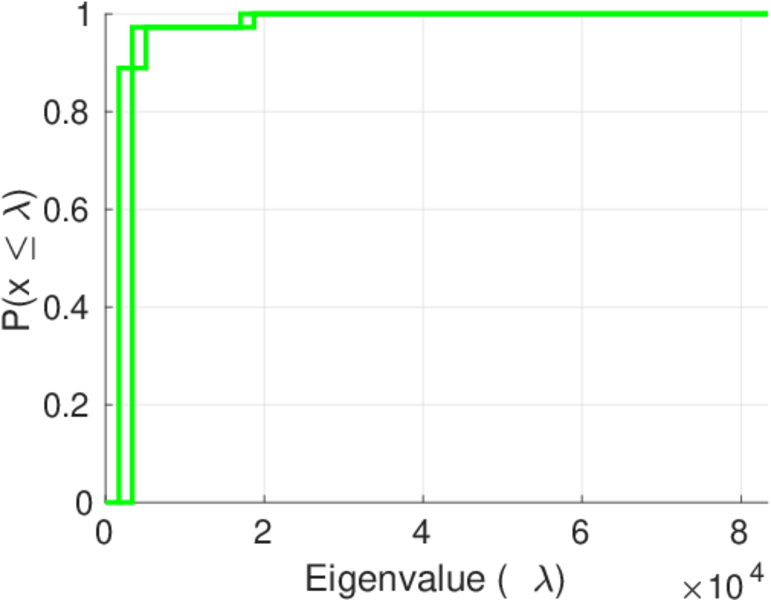
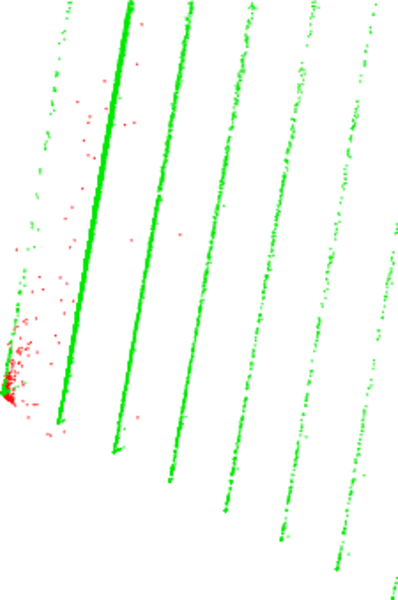
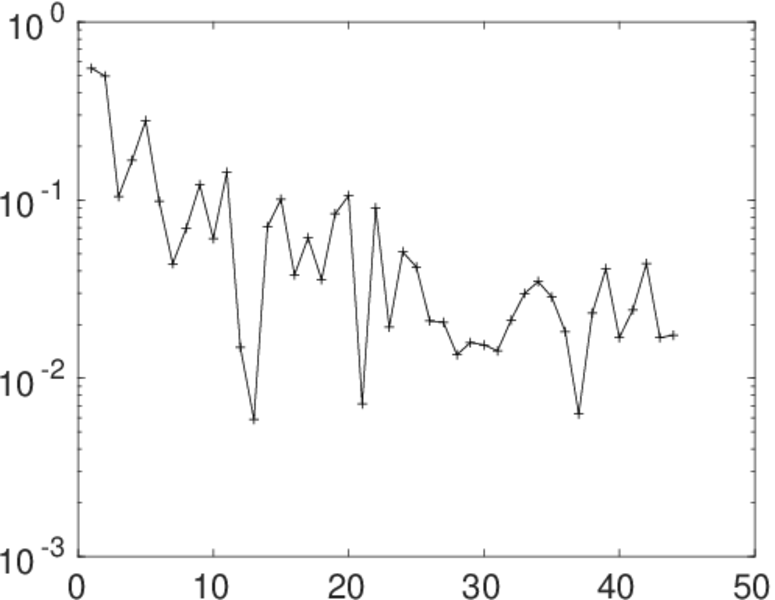
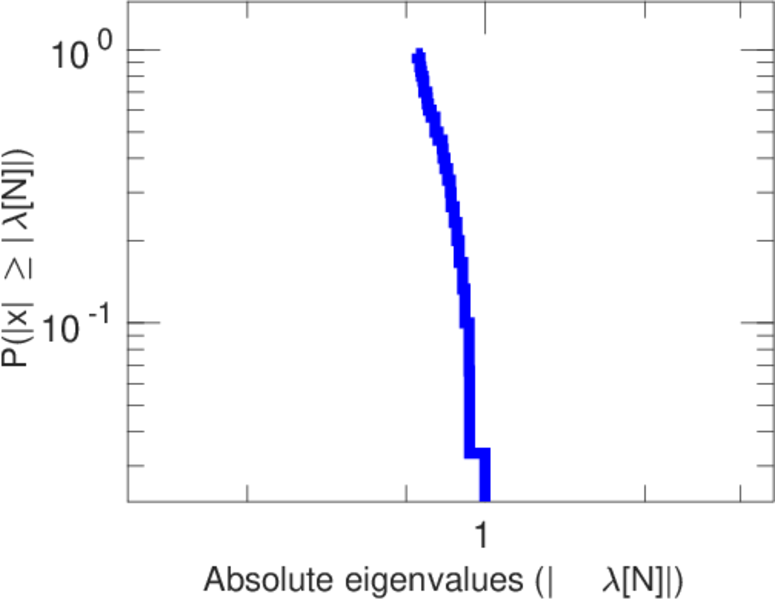
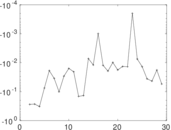
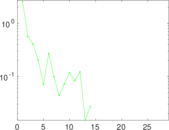
Matrix decompositions plots


Downloads
References
|
[1]
|
Jérôme Kunegis.
KONECT – The Koblenz Network Collection.
In Proc. Int. Conf. on World Wide Web Companion, pages
1343–1350, 2013.
[ http ]
|
|
[2]
|
Wikimedia Foundation.
Wikimedia downloads.
http://dumps.wikimedia.org/, January 2010.
|
 KONECT ‣ Networks ‣
Buy Me a Coffee
KONECT ‣ Networks ‣
Buy Me a Coffee