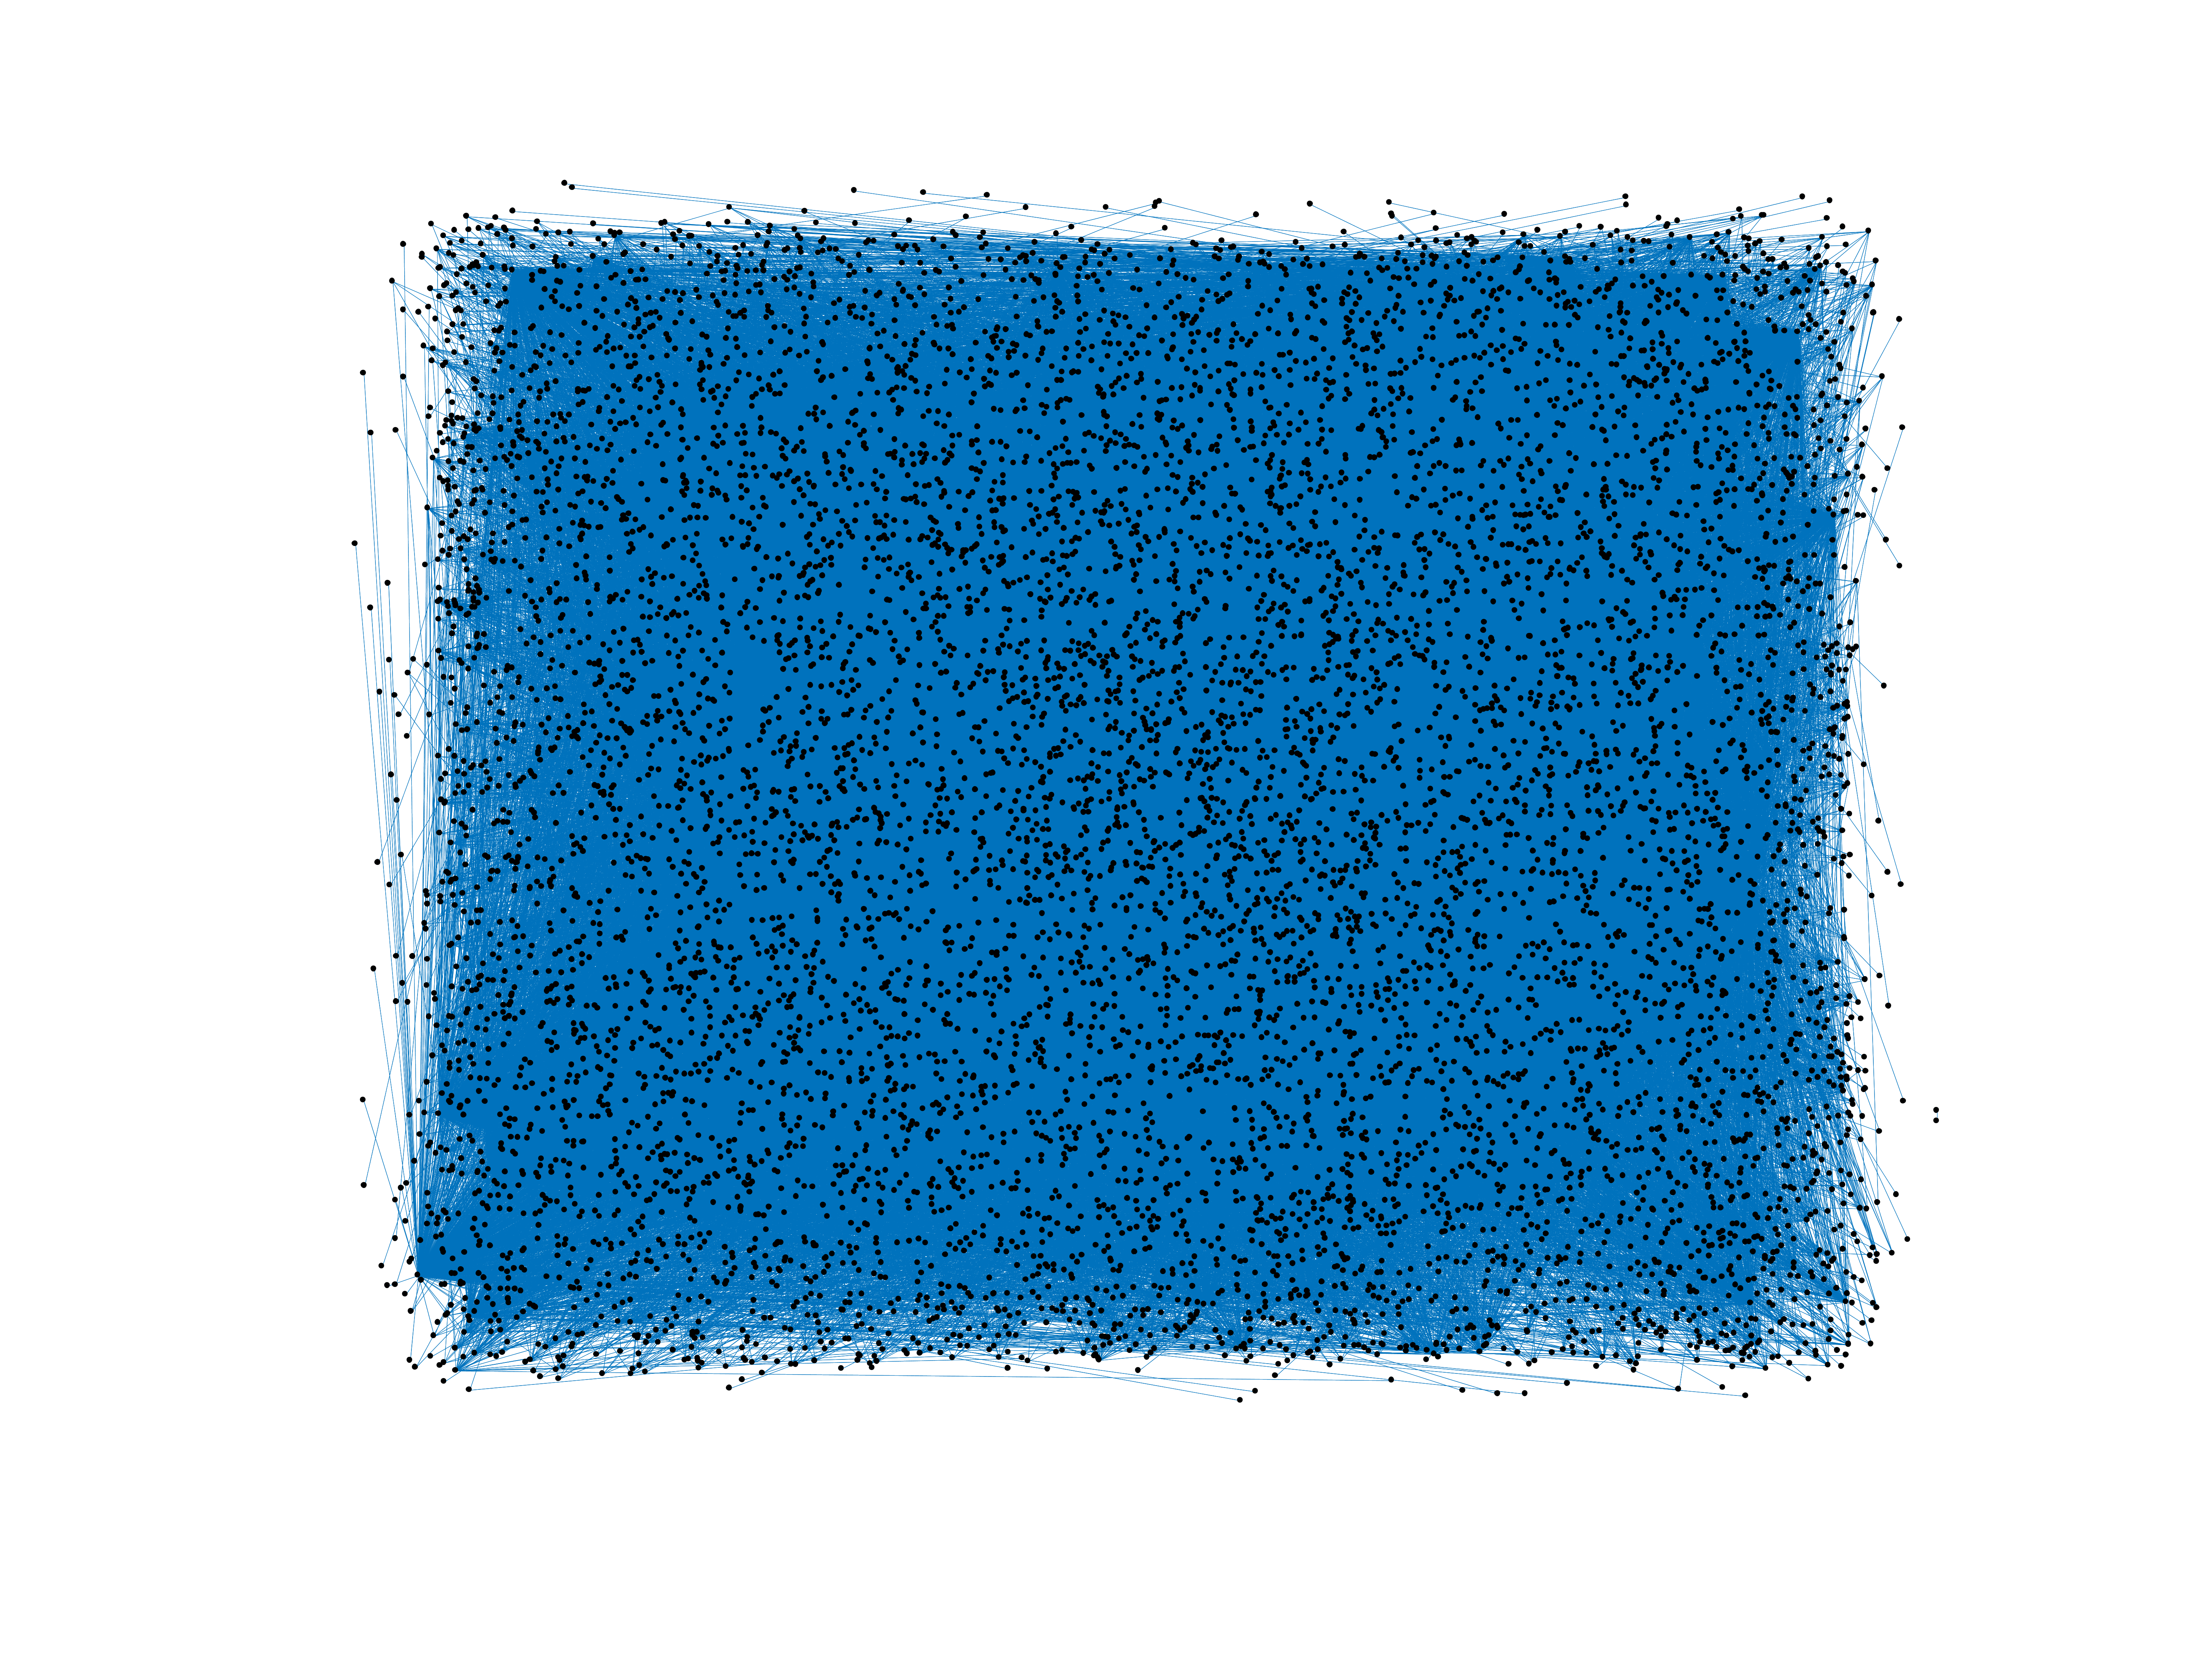
Wikipedia edits (zea)
This is the bipartite edit network of the Zeelandic Wikipedia. It contains
users and pages from the Zeelandic Wikipedia, connected by edit events. Each
edge represents an edit. The dataset includes the timestamp of each edit.
Metadata
Statistics
| Size | n = | 9,240
|
| Left size | n1 = | 944
|
| Right size | n2 = | 8,296
|
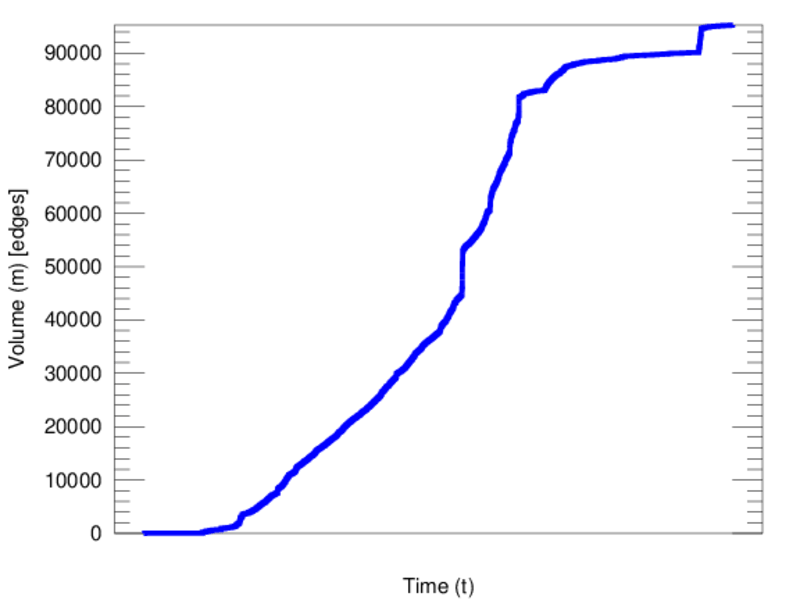
| Volume | m = | 95,290
|
| Unique edge count | m̿ = | 46,811
|
| Wedge count | s = | 30,153,754
|
| Claw count | z = | 22,073,145,110
|
| Cross count | x = | 14,357,740,737,137
|
| Square count | q = | 45,856,532
|
| 4-Tour count | T4 = | 487,611,094
|
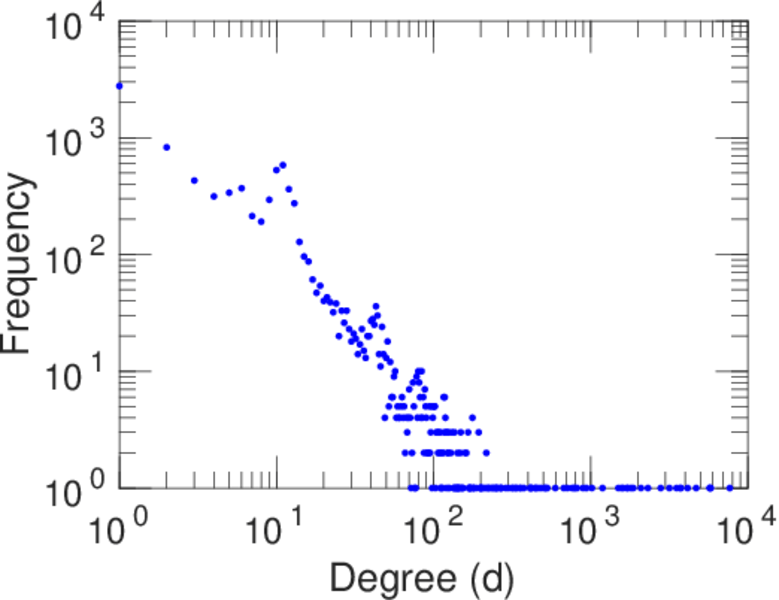
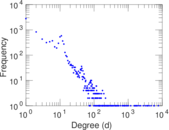
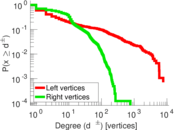
| Maximum degree | dmax = | 7,696
|
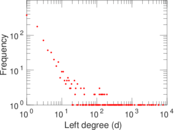
| Maximum left degree | d1max = | 7,696
|
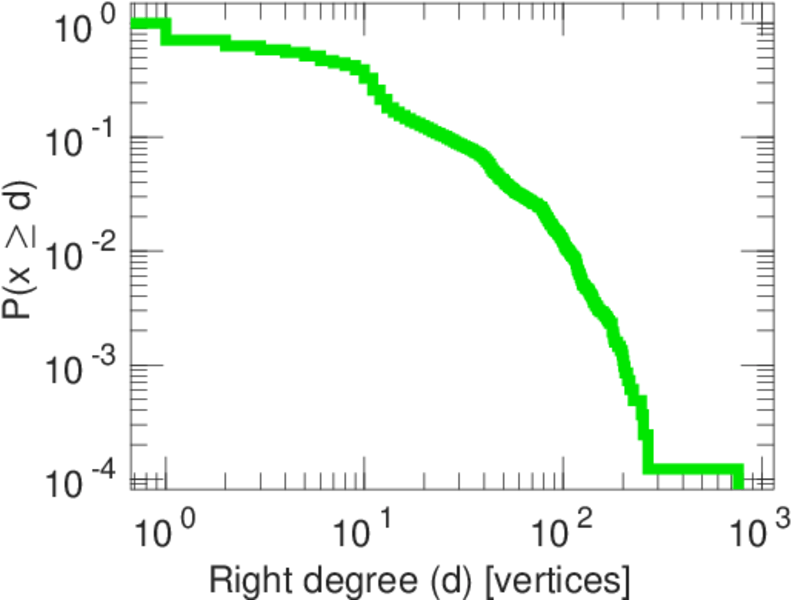
| Maximum right degree | d2max = | 763
|
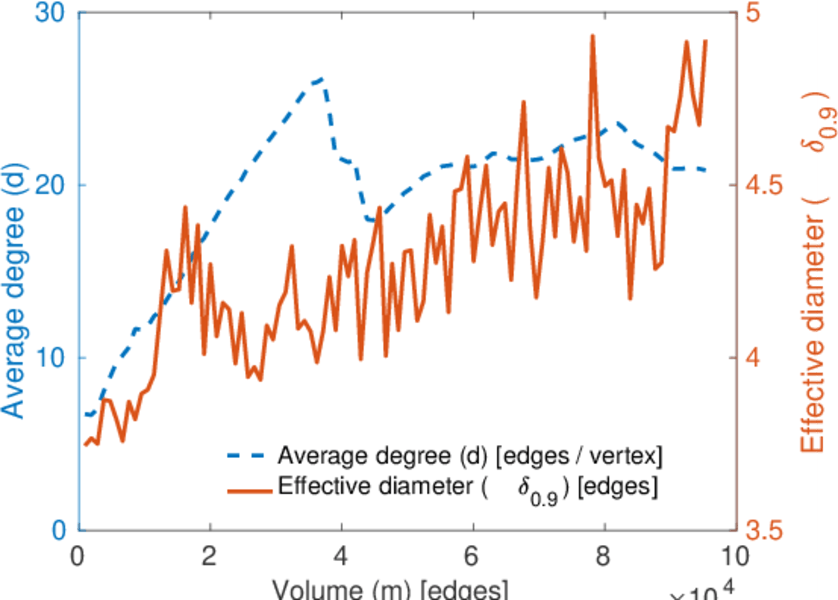
| Average degree | d = | 20.625 5
|
| Average left degree | d1 = | 100.943
|
| Average right degree | d2 = | 11.486 3
|
| Fill | p = | 0.005 977 33
|
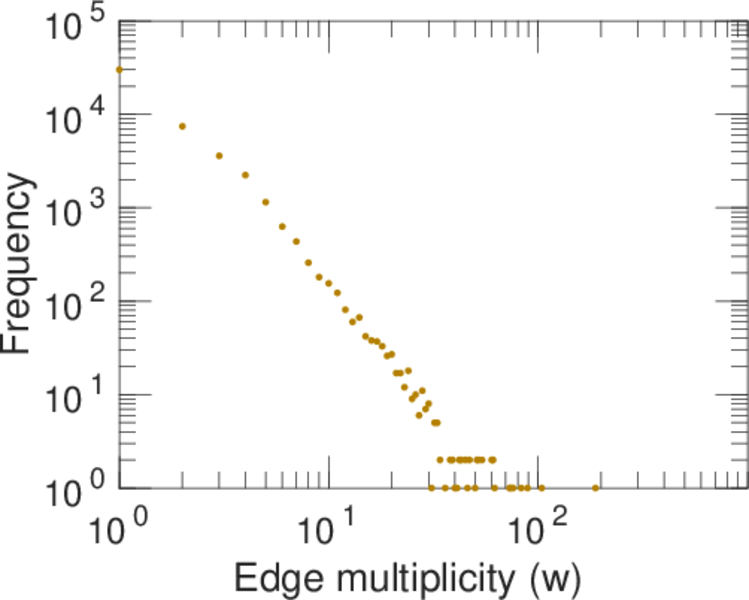
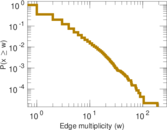
| Average edge multiplicity | m̃ = | 2.035 63
|
| Size of LCC | N = | 8,678
|
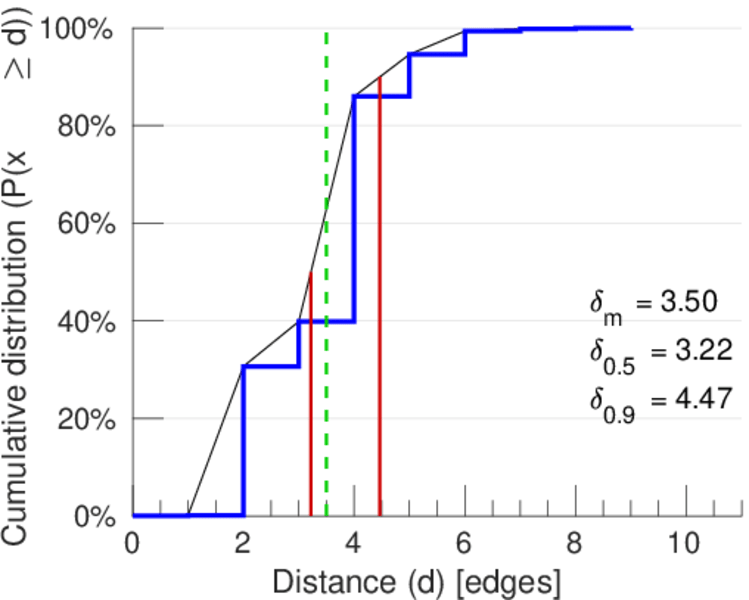
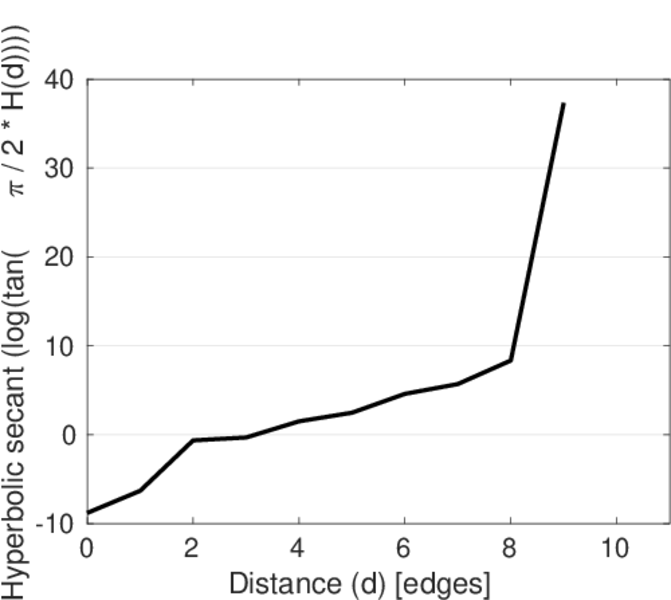
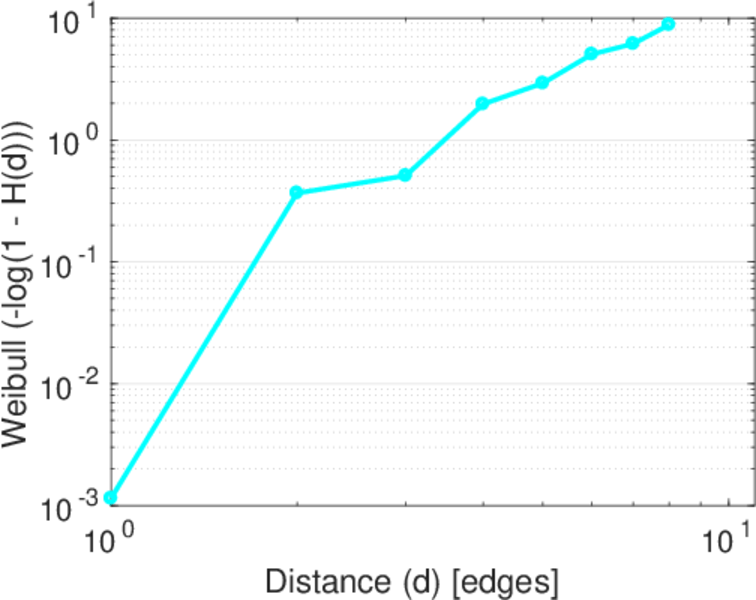
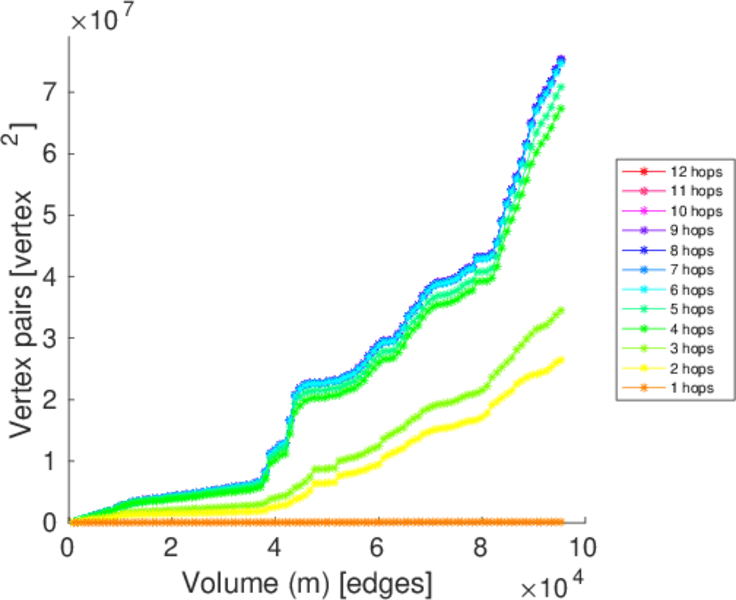
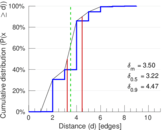
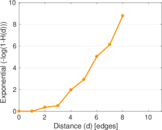
| Diameter | δ = | 11
|
| 50-Percentile effective diameter | δ0.5 = | 3.220 08
|
| 90-Percentile effective diameter | δ0.9 = | 4.467 10
|
| Median distance | δM = | 4
|
| Mean distance | δm = | 3.497 02
|
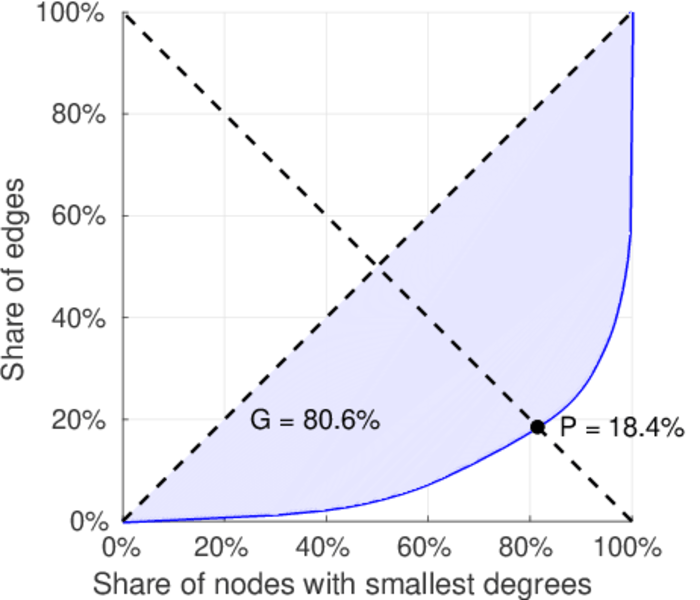
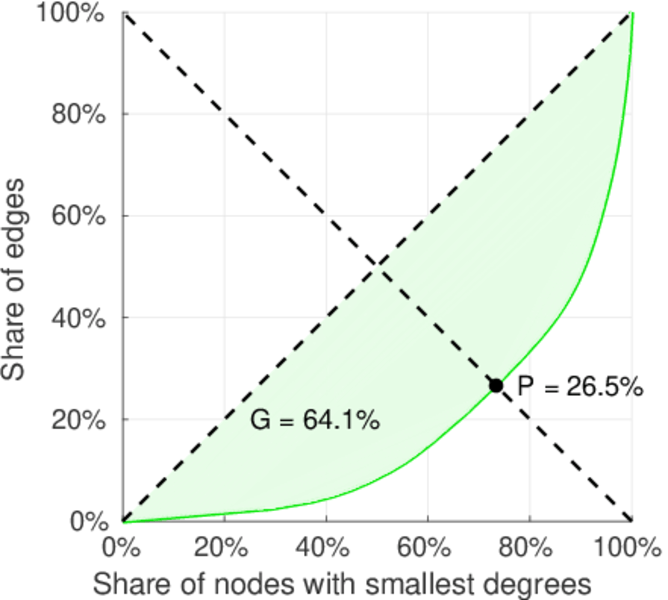
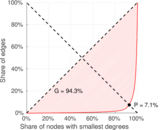
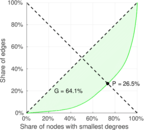
| Gini coefficient | G = | 0.801 657
|
| Balanced inequality ratio | P = | 0.185 565
|
| Left balanced inequality ratio | P1 = | 0.070 951 8
|
| Right balanced inequality ratio | P2 = | 0.264 729
|
| Relative edge distribution entropy | Her = | 0.776 021
|
| Power law exponent | γ = | 1.854 94
|
| Tail power law exponent | γt = | 2.201 00
|
| Tail power law exponent with p | γ3 = | 2.201 00
|
| p-value | p = | 0.000 00
|
| Left tail power law exponent with p | γ3,1 = | 1.621 00
|
| Left p-value | p1 = | 0.000 00
|
| Right tail power law exponent with p | γ3,2 = | 7.191 00
|
| Right p-value | p2 = | 0.589 000
|
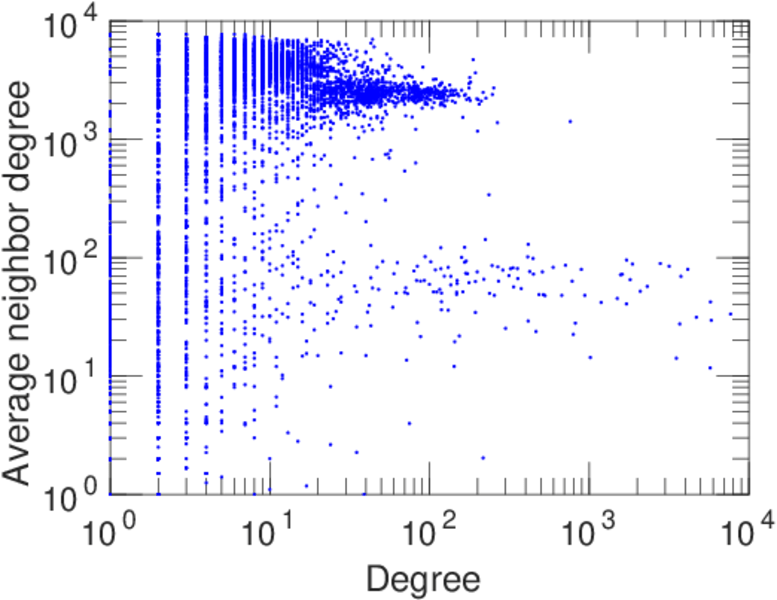
| Degree assortativity | ρ = | −0.350 275
|
| Degree assortativity p-value | pρ = | 0.000 00
|
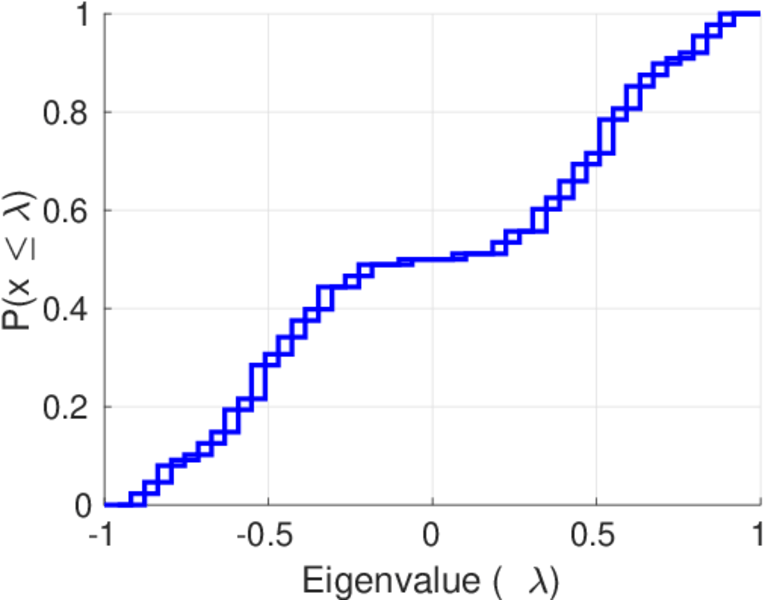
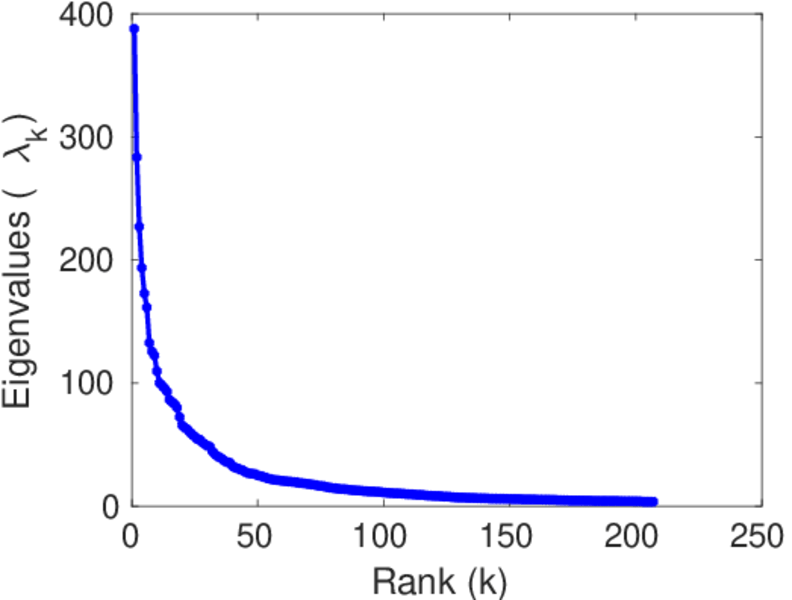
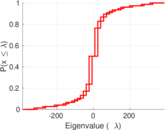
| Spectral norm | α = | 387.695
|
| Algebraic connectivity | a = | 0.044 180 7
|
| Spectral separation | |λ1[A] / λ2[A]| = | 1.368 44
|
| Controllability | C = | 7,365
|
| Relative controllability | Cr = | 0.805 534
|
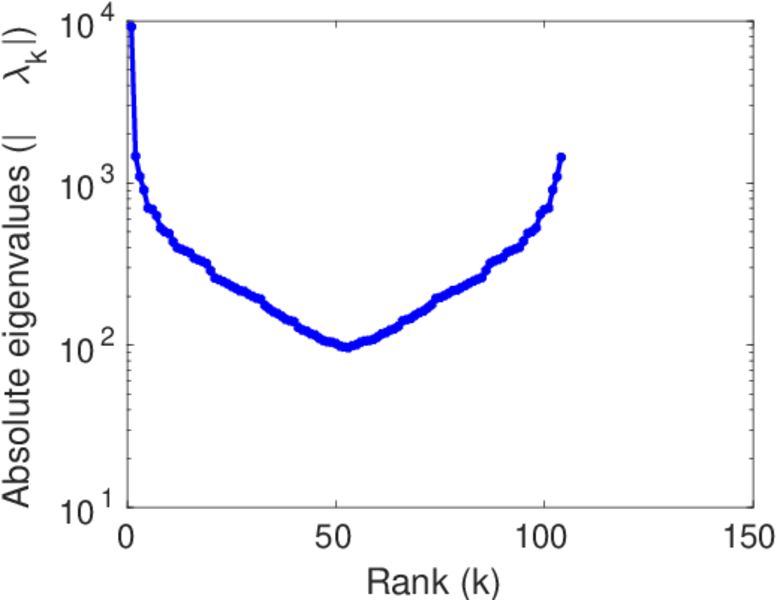
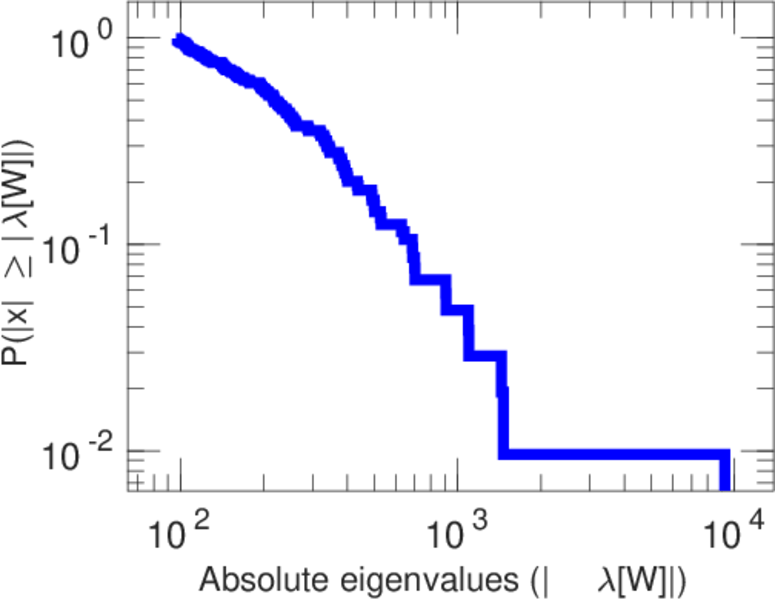
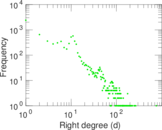
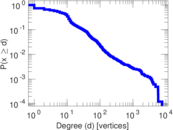
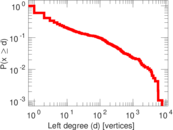
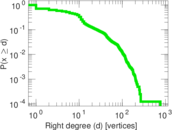
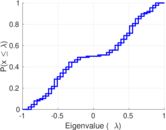
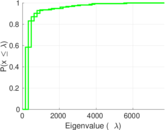
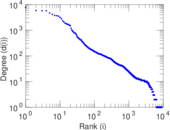
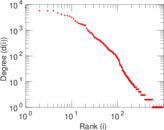
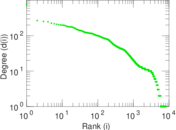
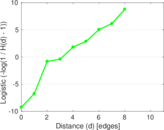
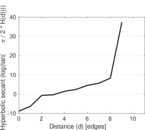
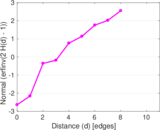
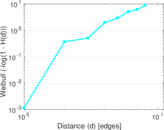
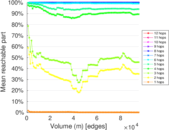
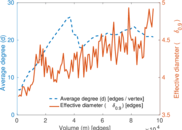
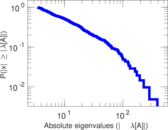
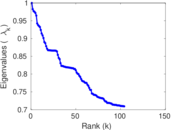
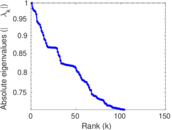
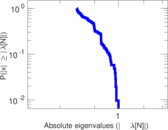
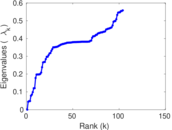
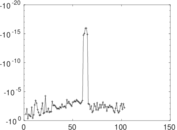
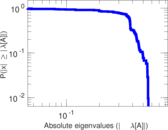
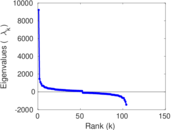
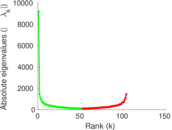
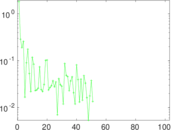
Plots


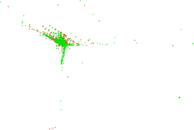
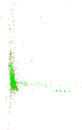


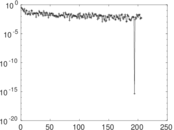
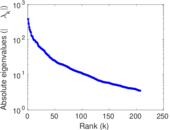
Matrix decompositions plots


Downloads
References
|
[1]
|
Jérôme Kunegis.
KONECT – The Koblenz Network Collection.
In Proc. Int. Conf. on World Wide Web Companion, pages
1343–1350, 2013.
[ http ]
|
|
[2]
|
Wikimedia Foundation.
Wikimedia downloads.
http://dumps.wikimedia.org/, January 2010.
|
 KONECT ‣ Networks ‣
Buy Me a Coffee
KONECT ‣ Networks ‣
Buy Me a Coffee