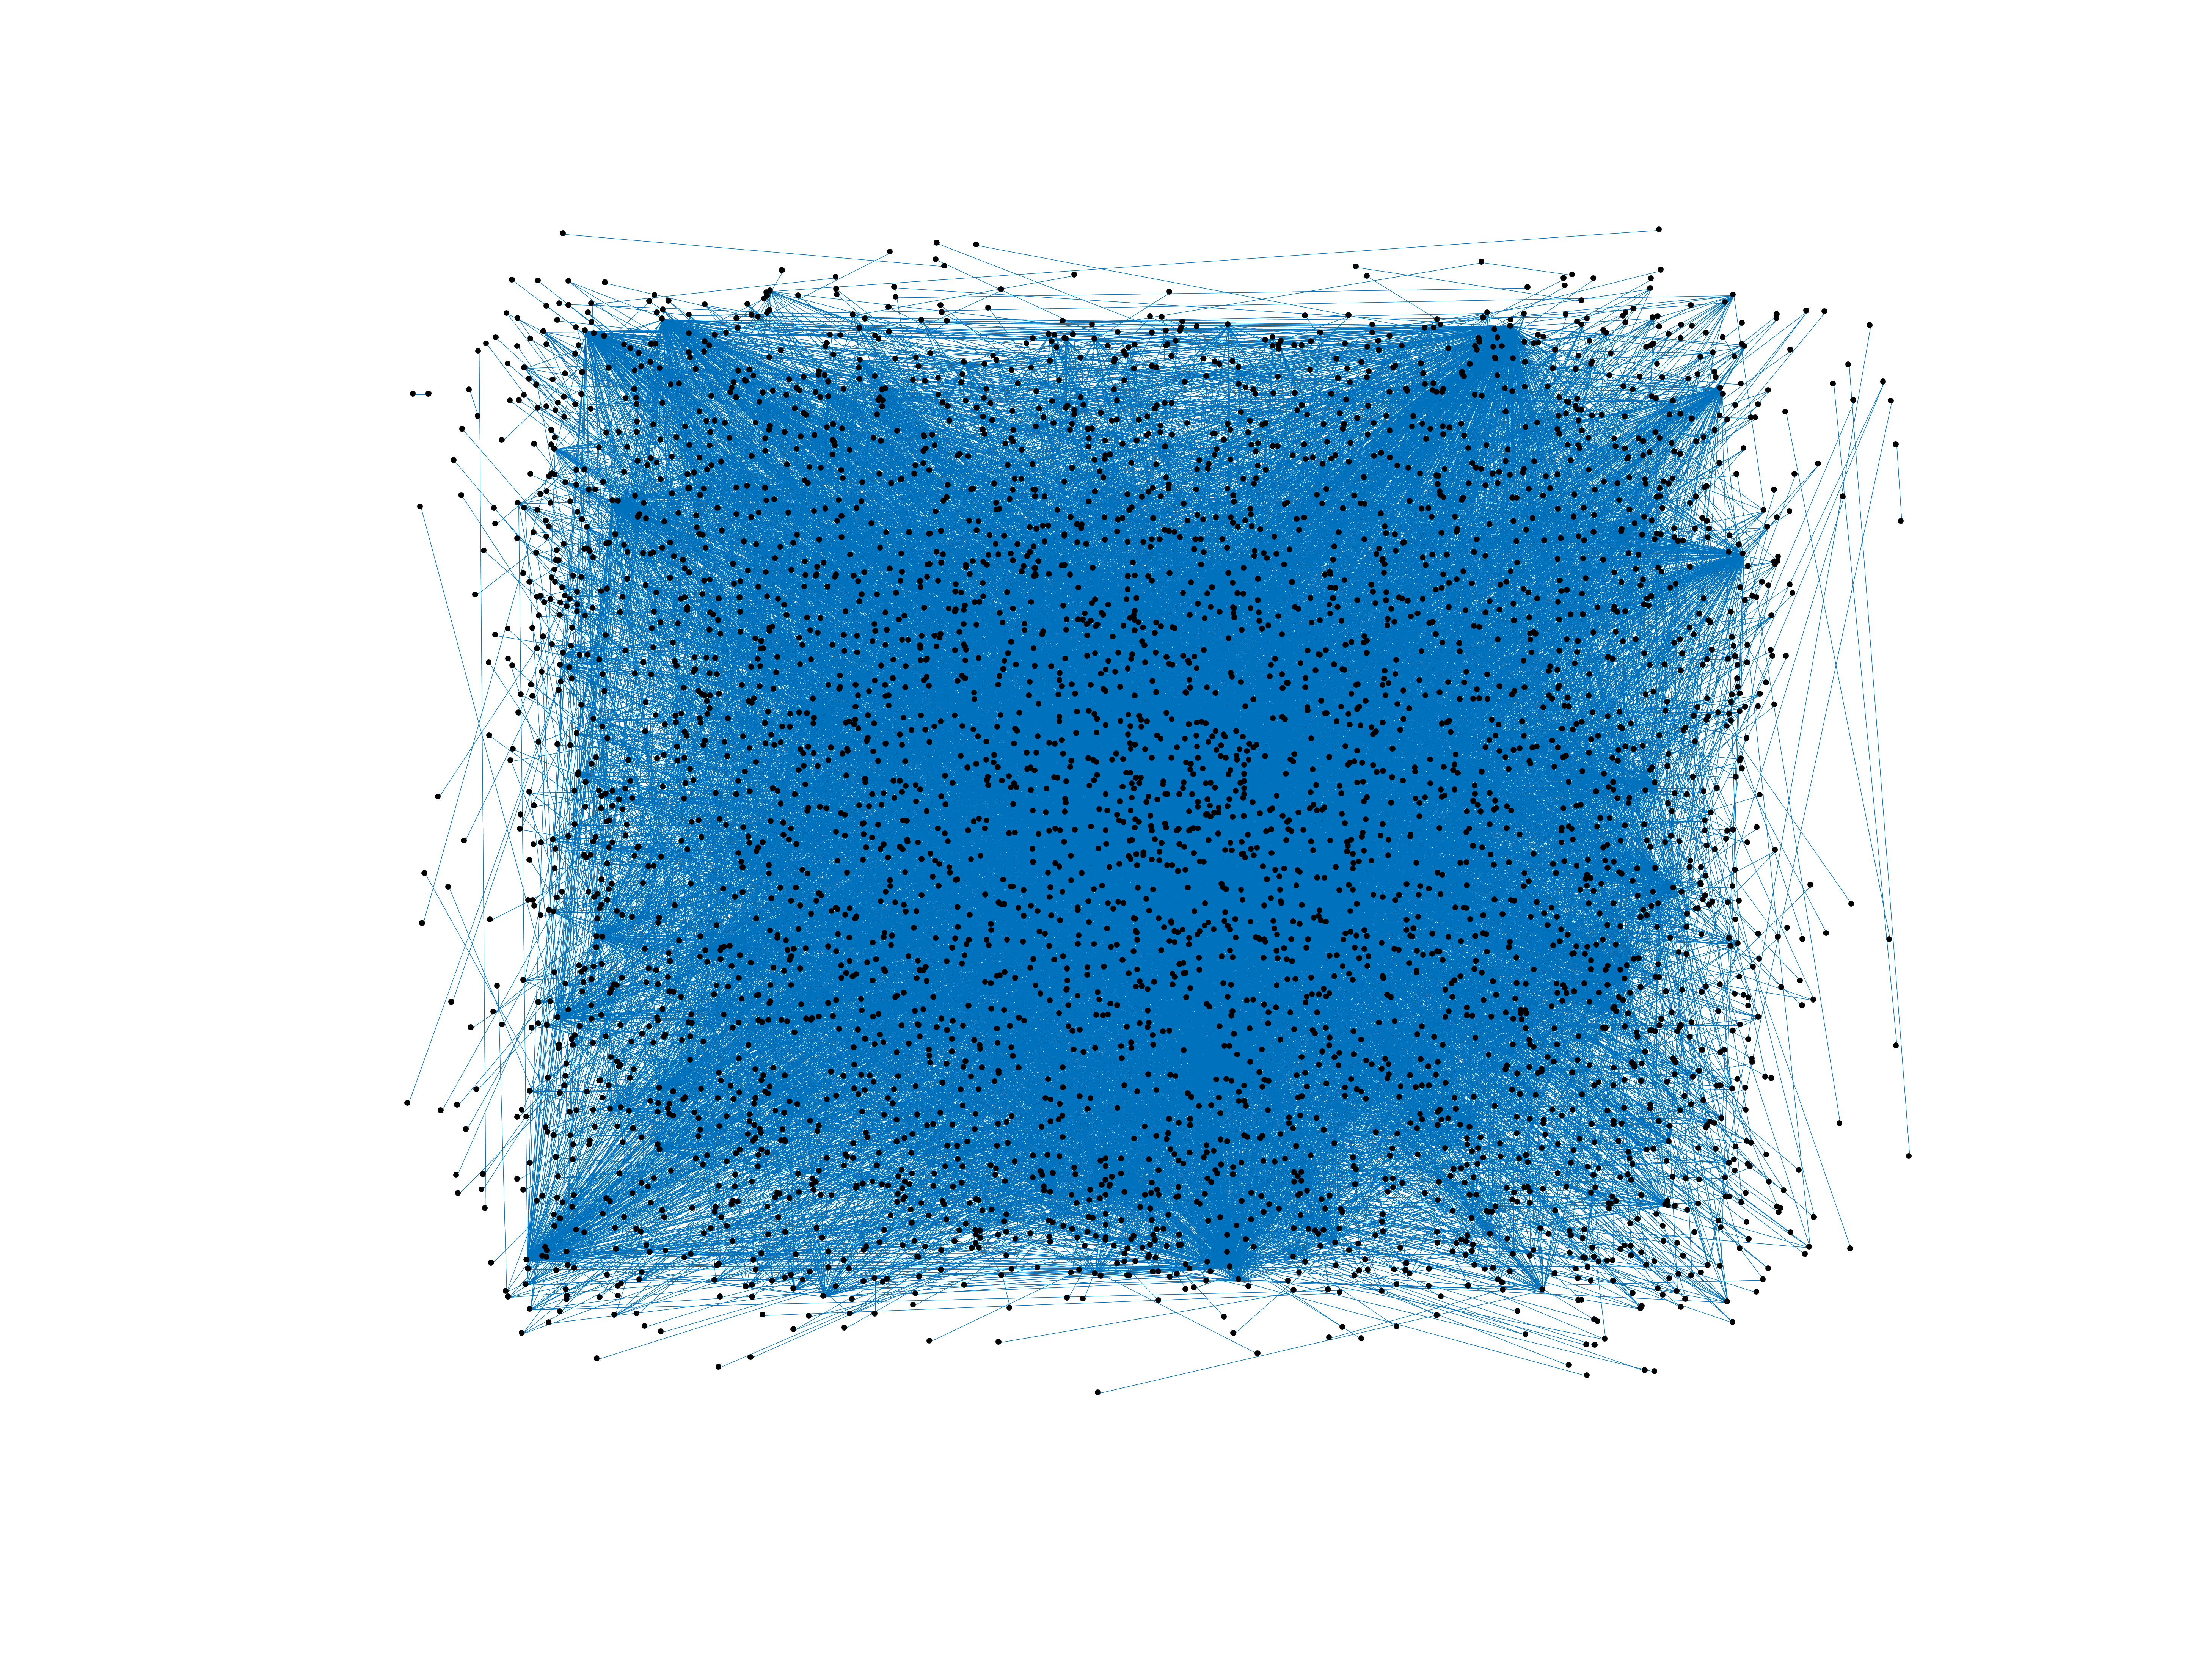
Wikipedia edits (zu)
This is the bipartite edit network of the Zulu Wikipedia. It contains users and
pages from the Zulu Wikipedia, connected by edit events. Each edge represents
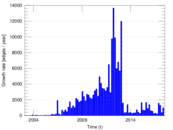
an edit. The dataset includes the timestamp of each edit.
Metadata
Statistics
| Size | n = | 4,531
|
| Left size | n1 = | 939
|
| Right size | n2 = | 3,592
|
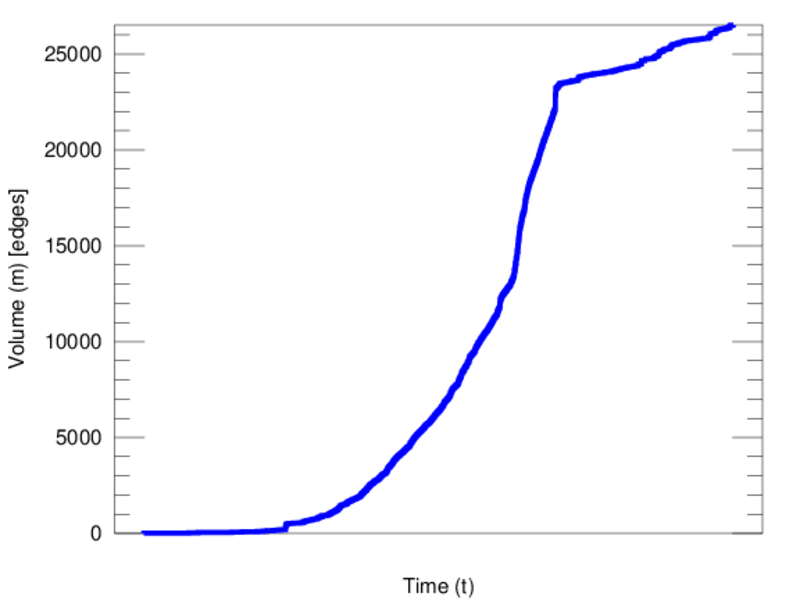
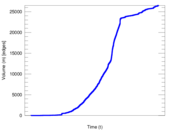
| Volume | m = | 26,511
|
| Unique edge count | m̿ = | 12,839
|
| Wedge count | s = | 1,753,217
|
| Claw count | z = | 340,474,459
|
| Cross count | x = | 66,630,972,068
|
| Square count | q = | 2,720,713
|
| 4-Tour count | T4 = | 28,812,550
|
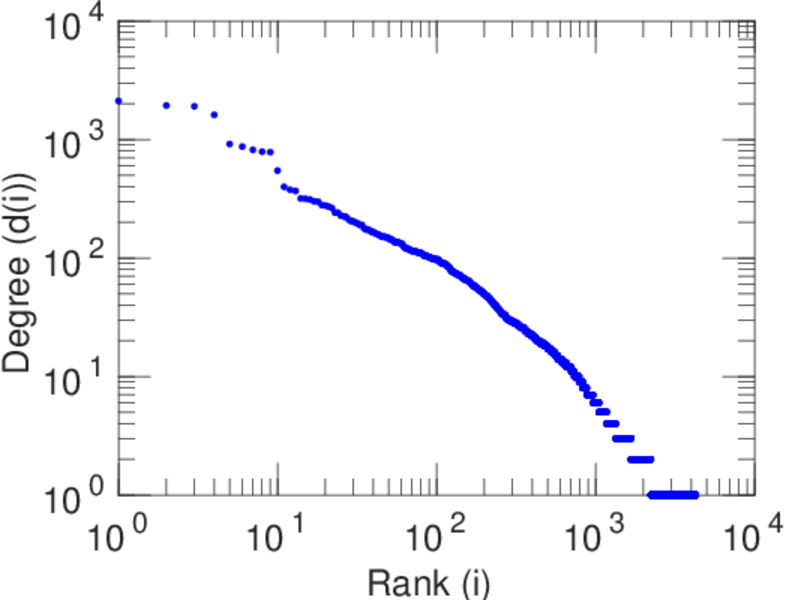
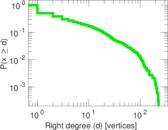
| Maximum degree | dmax = | 2,116
|
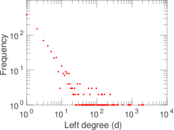
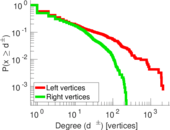
| Maximum left degree | d1max = | 2,116
|
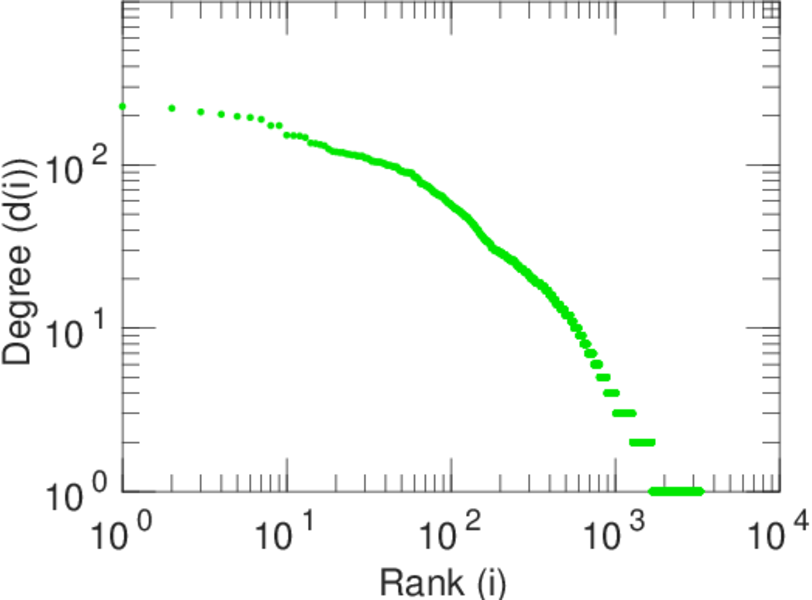
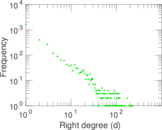
| Maximum right degree | d2max = | 228
|
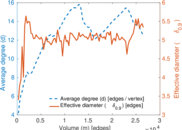
| Average degree | d = | 11.702 1
|
| Average left degree | d1 = | 28.233 2
|
| Average right degree | d2 = | 7.380 57
|
| Fill | p = | 0.003 806 53
|
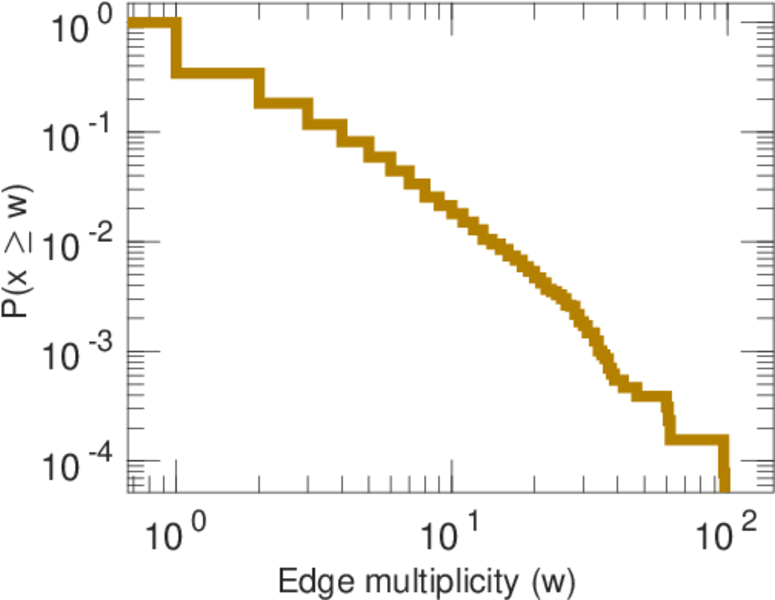
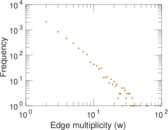
| Average edge multiplicity | m̃ = | 2.064 88
|
| Size of LCC | N = | 3,528
|
| Diameter | δ = | 12
|
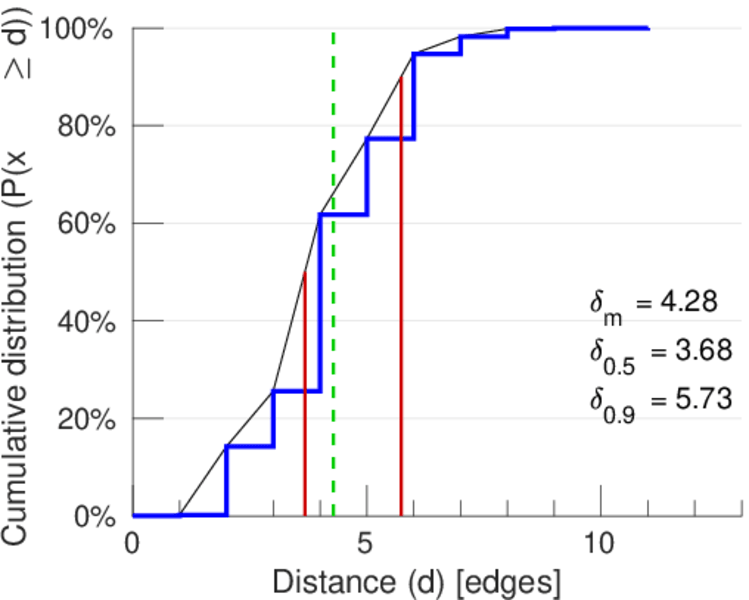
| 50-Percentile effective diameter | δ0.5 = | 3.675 33
|
| 90-Percentile effective diameter | δ0.9 = | 5.730 22
|
| Median distance | δM = | 4
|
| Mean distance | δm = | 4.282 12
|
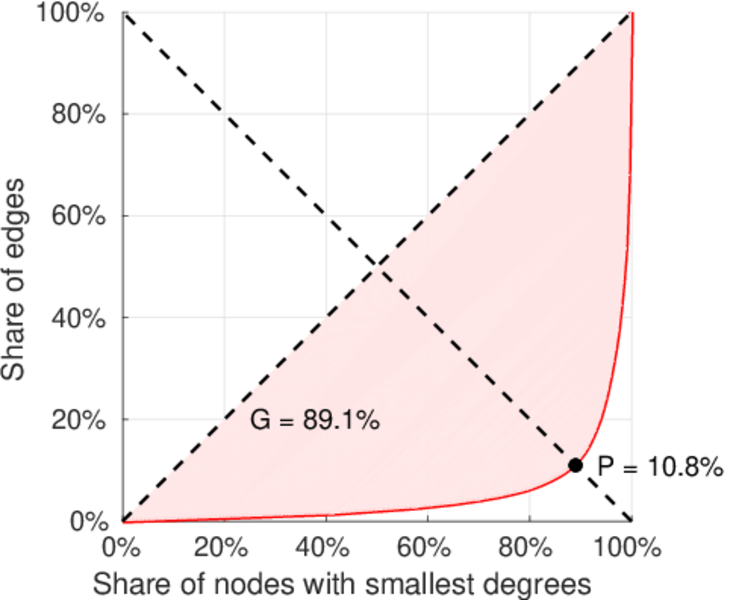
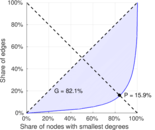
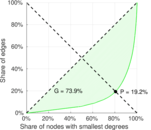
| Gini coefficient | G = | 0.822 648
|
| Balanced inequality ratio | P = | 0.162 272
|
| Left balanced inequality ratio | P1 = | 0.108 332
|
| Right balanced inequality ratio | P2 = | 0.191 845
|
| Relative edge distribution entropy | Her = | 0.811 357
|
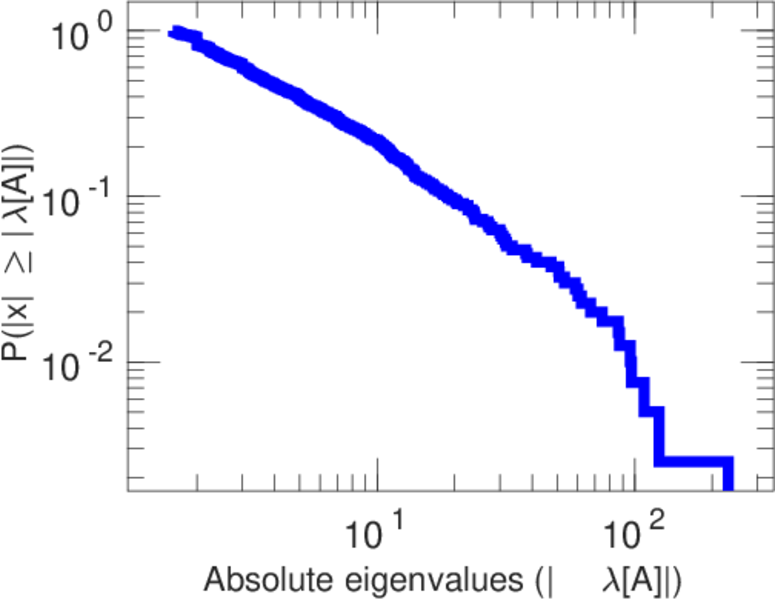
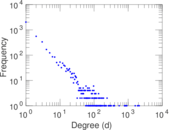
| Power law exponent | γ = | 2.393 82
|
| Tail power law exponent | γt = | 1.861 00
|
| Tail power law exponent with p | γ3 = | 1.861 00
|
| p-value | p = | 0.000 00
|
| Left tail power law exponent with p | γ3,1 = | 1.721 00
|
| Left p-value | p1 = | 0.003 000 00
|
| Right tail power law exponent with p | γ3,2 = | 1.911 00
|
| Right p-value | p2 = | 0.000 00
|
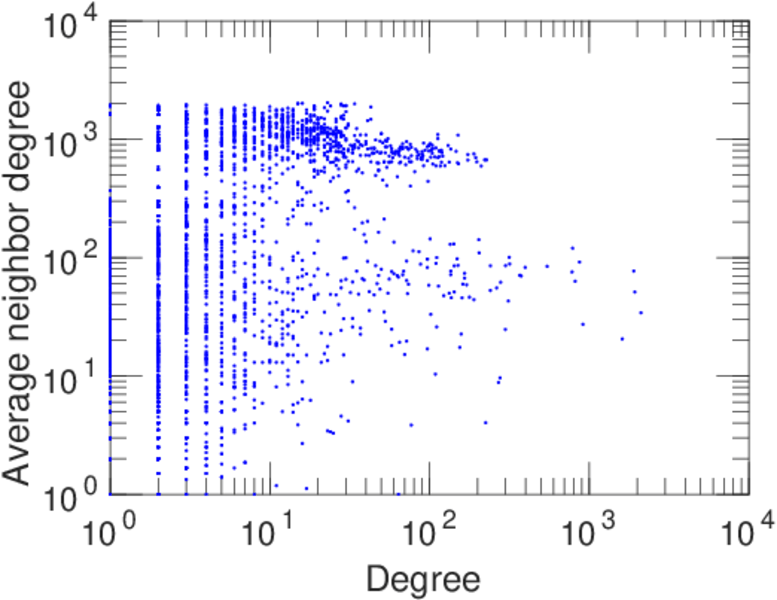
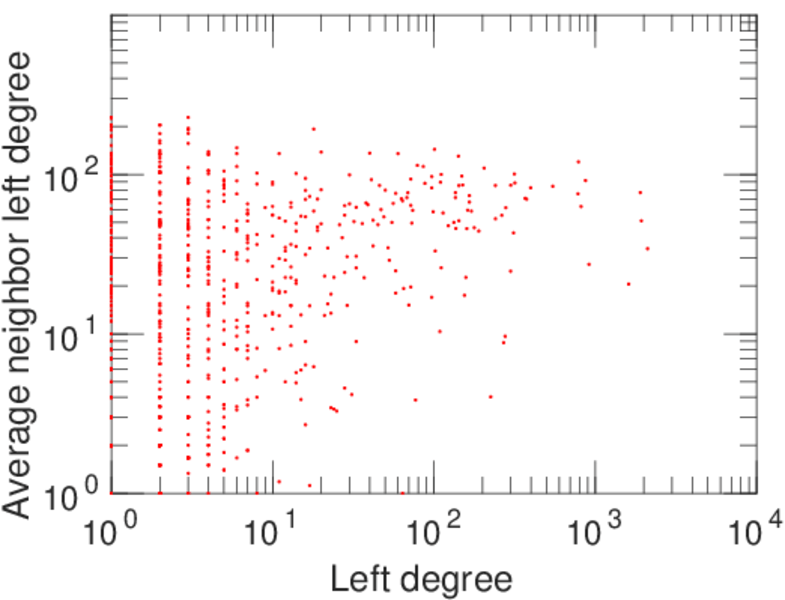
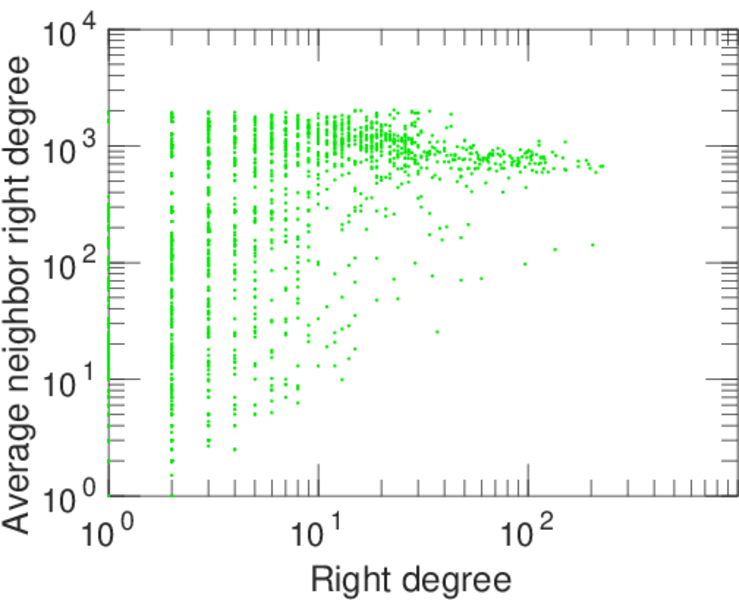
| Degree assortativity | ρ = | −0.208 194
|
| Degree assortativity p-value | pρ = | 1.016 37 × 10−125
|
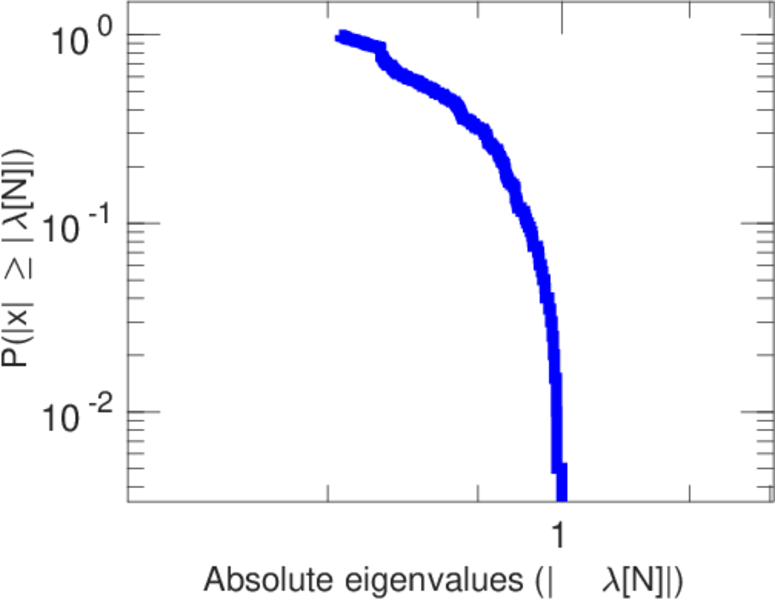
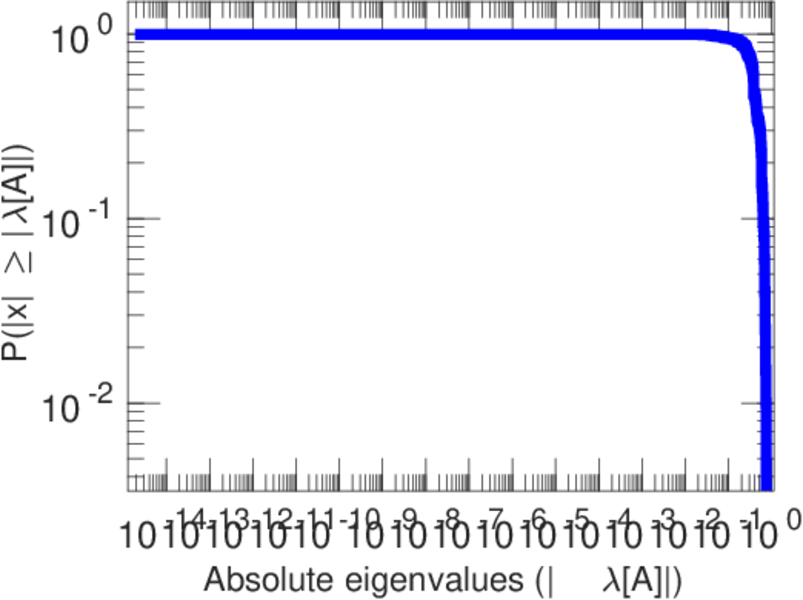
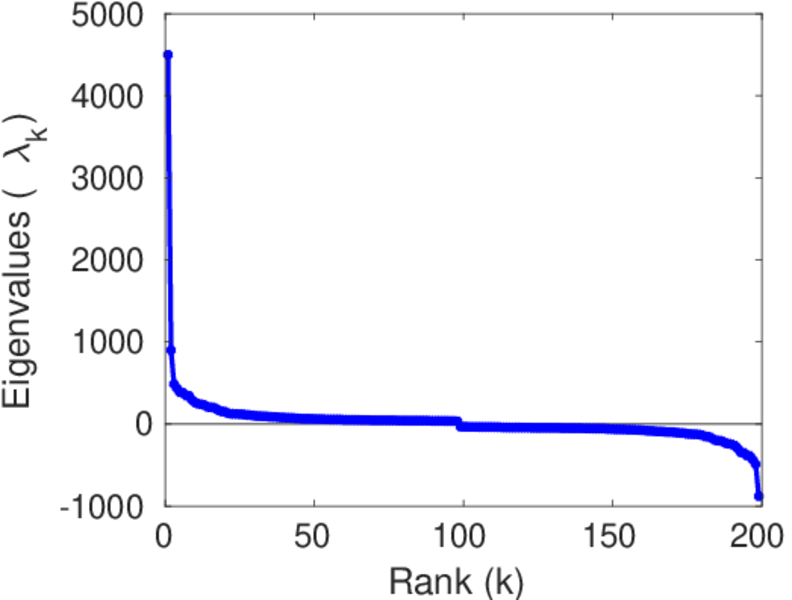
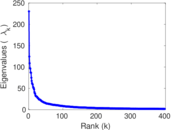
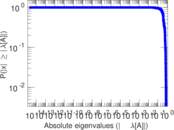
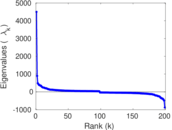
| Spectral norm | α = | 230.313
|
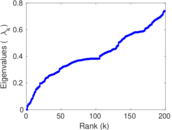
| Algebraic connectivity | a = | 0.025 849 6
|
| Spectral separation | |λ1[A] / λ2[A]| = | 1.850 79
|
| Controllability | C = | 2,549
|
| Relative controllability | Cr = | 0.599 906
|
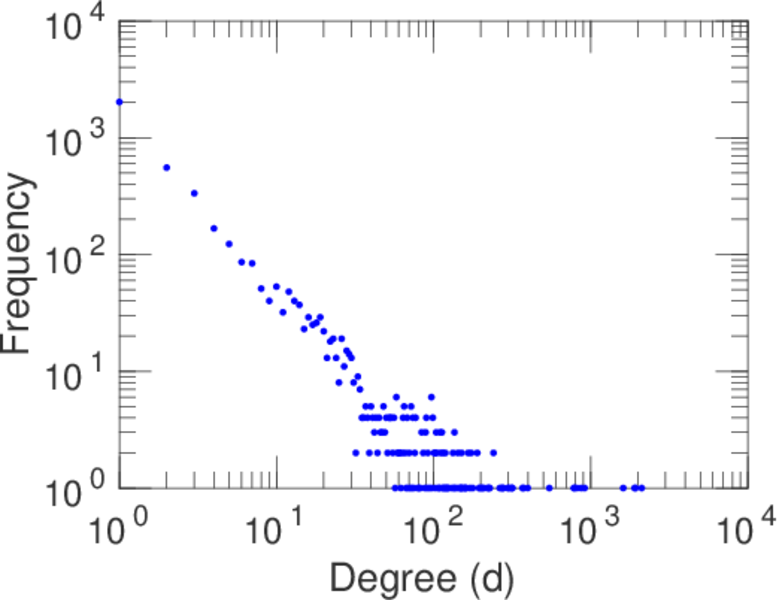
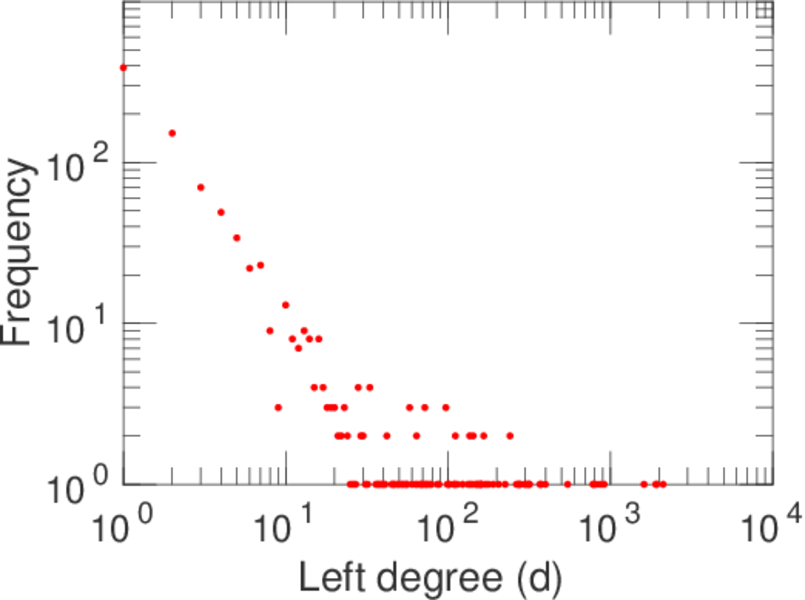
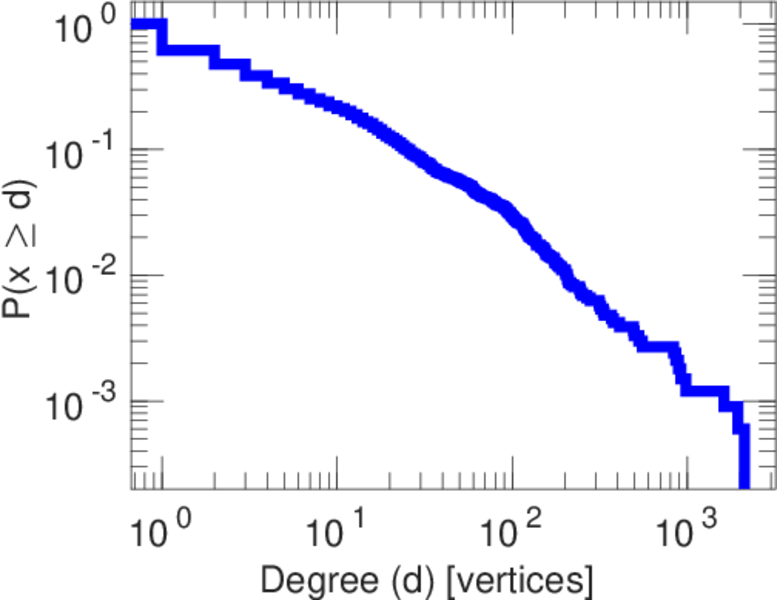
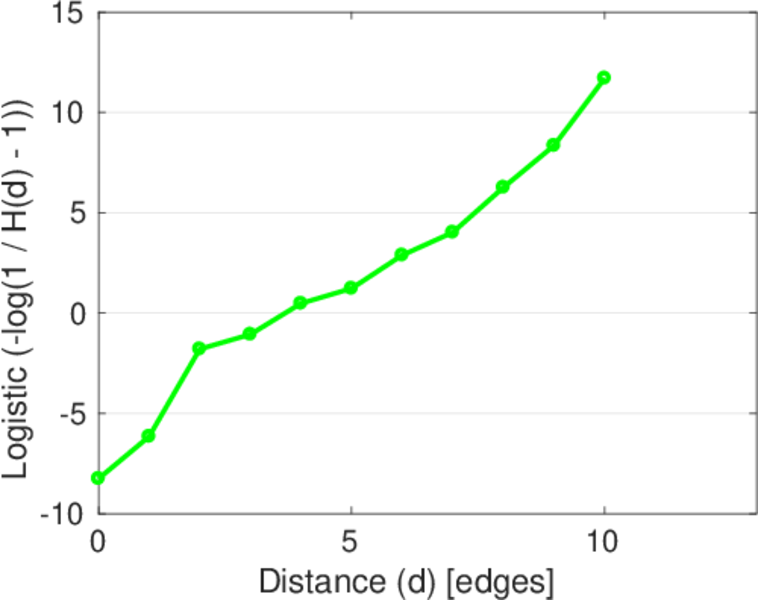
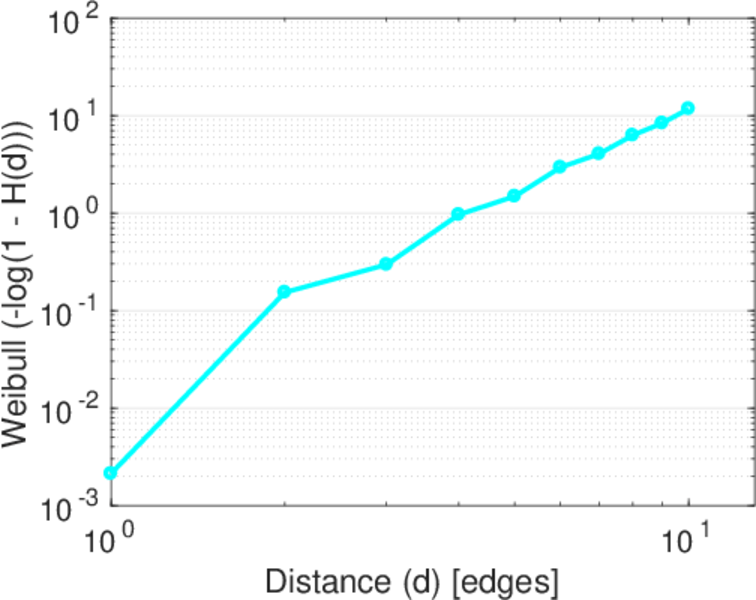
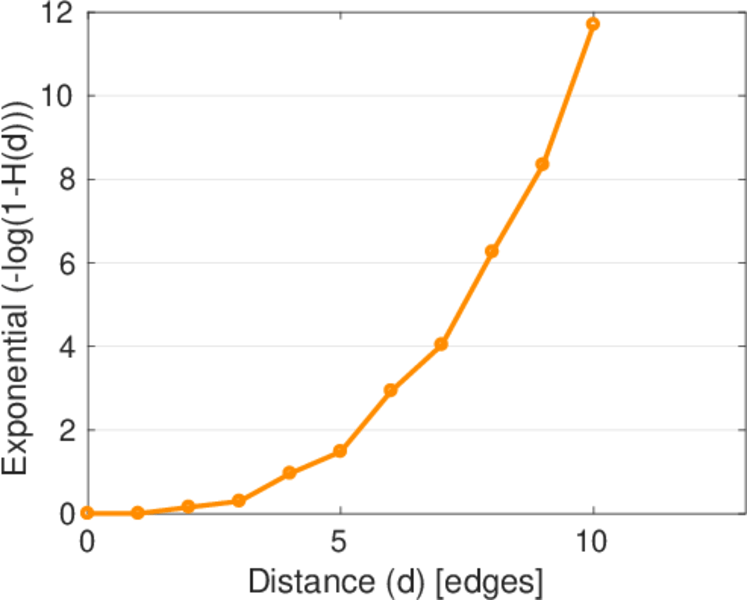
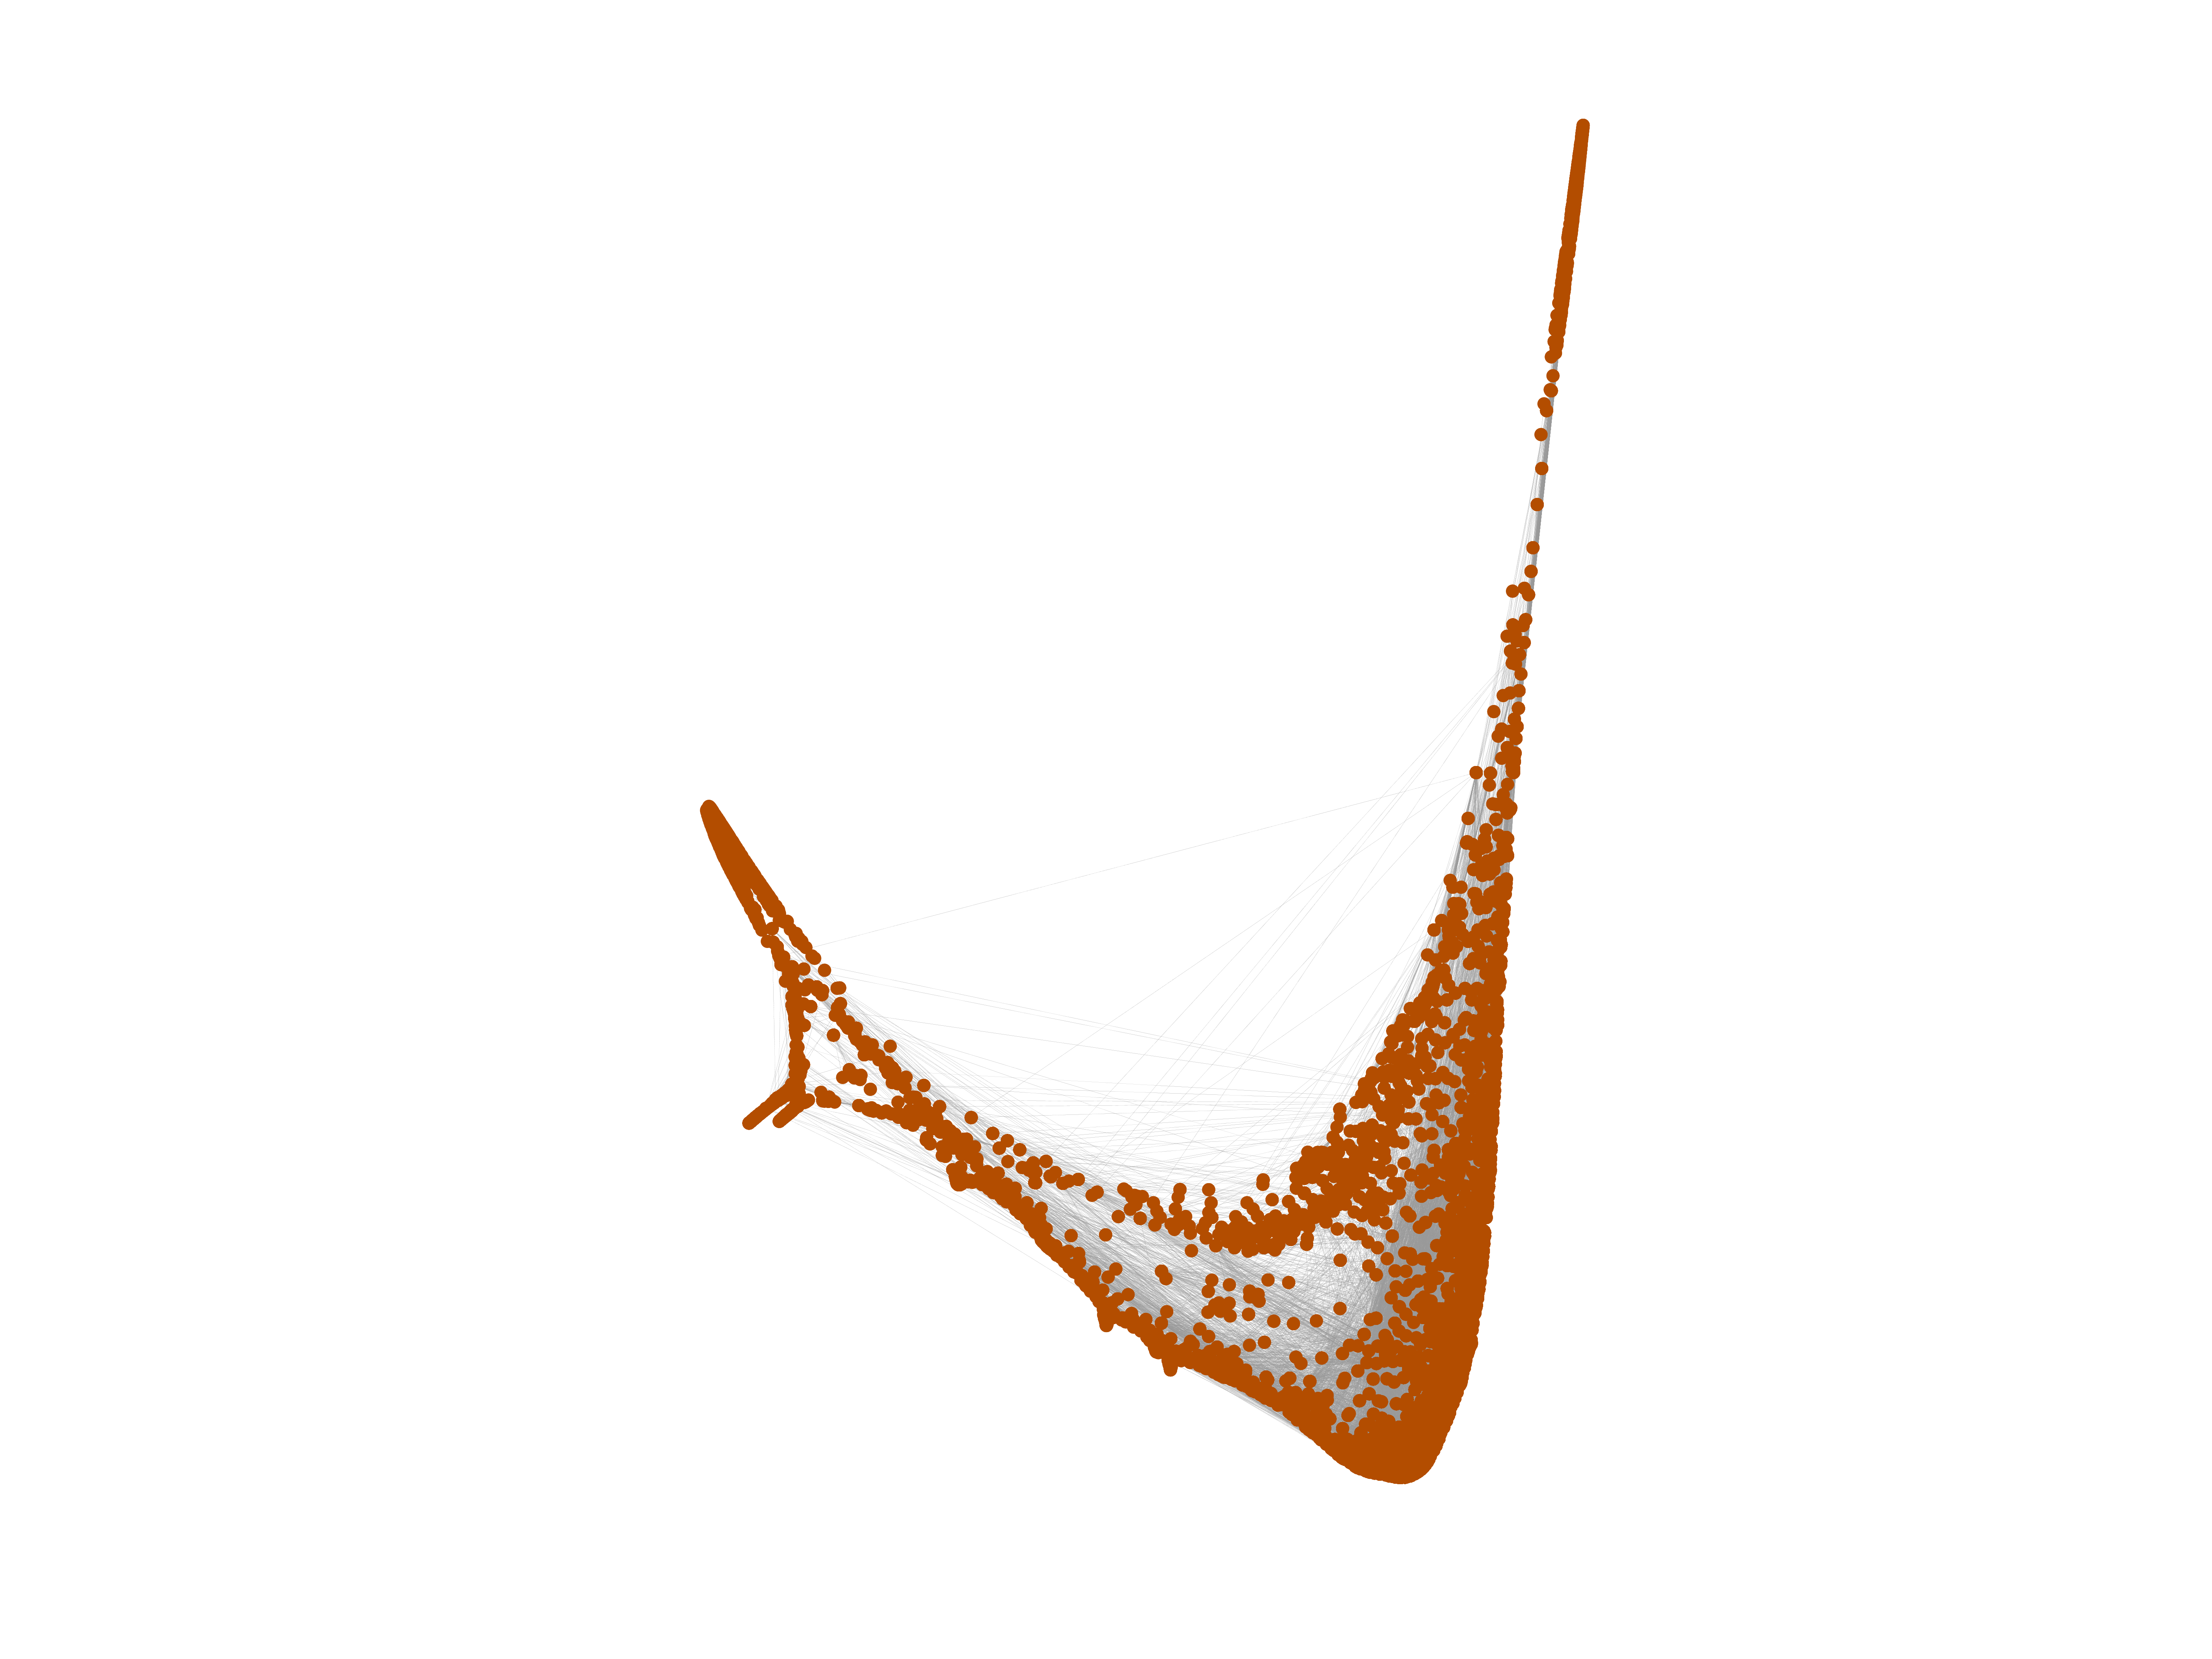
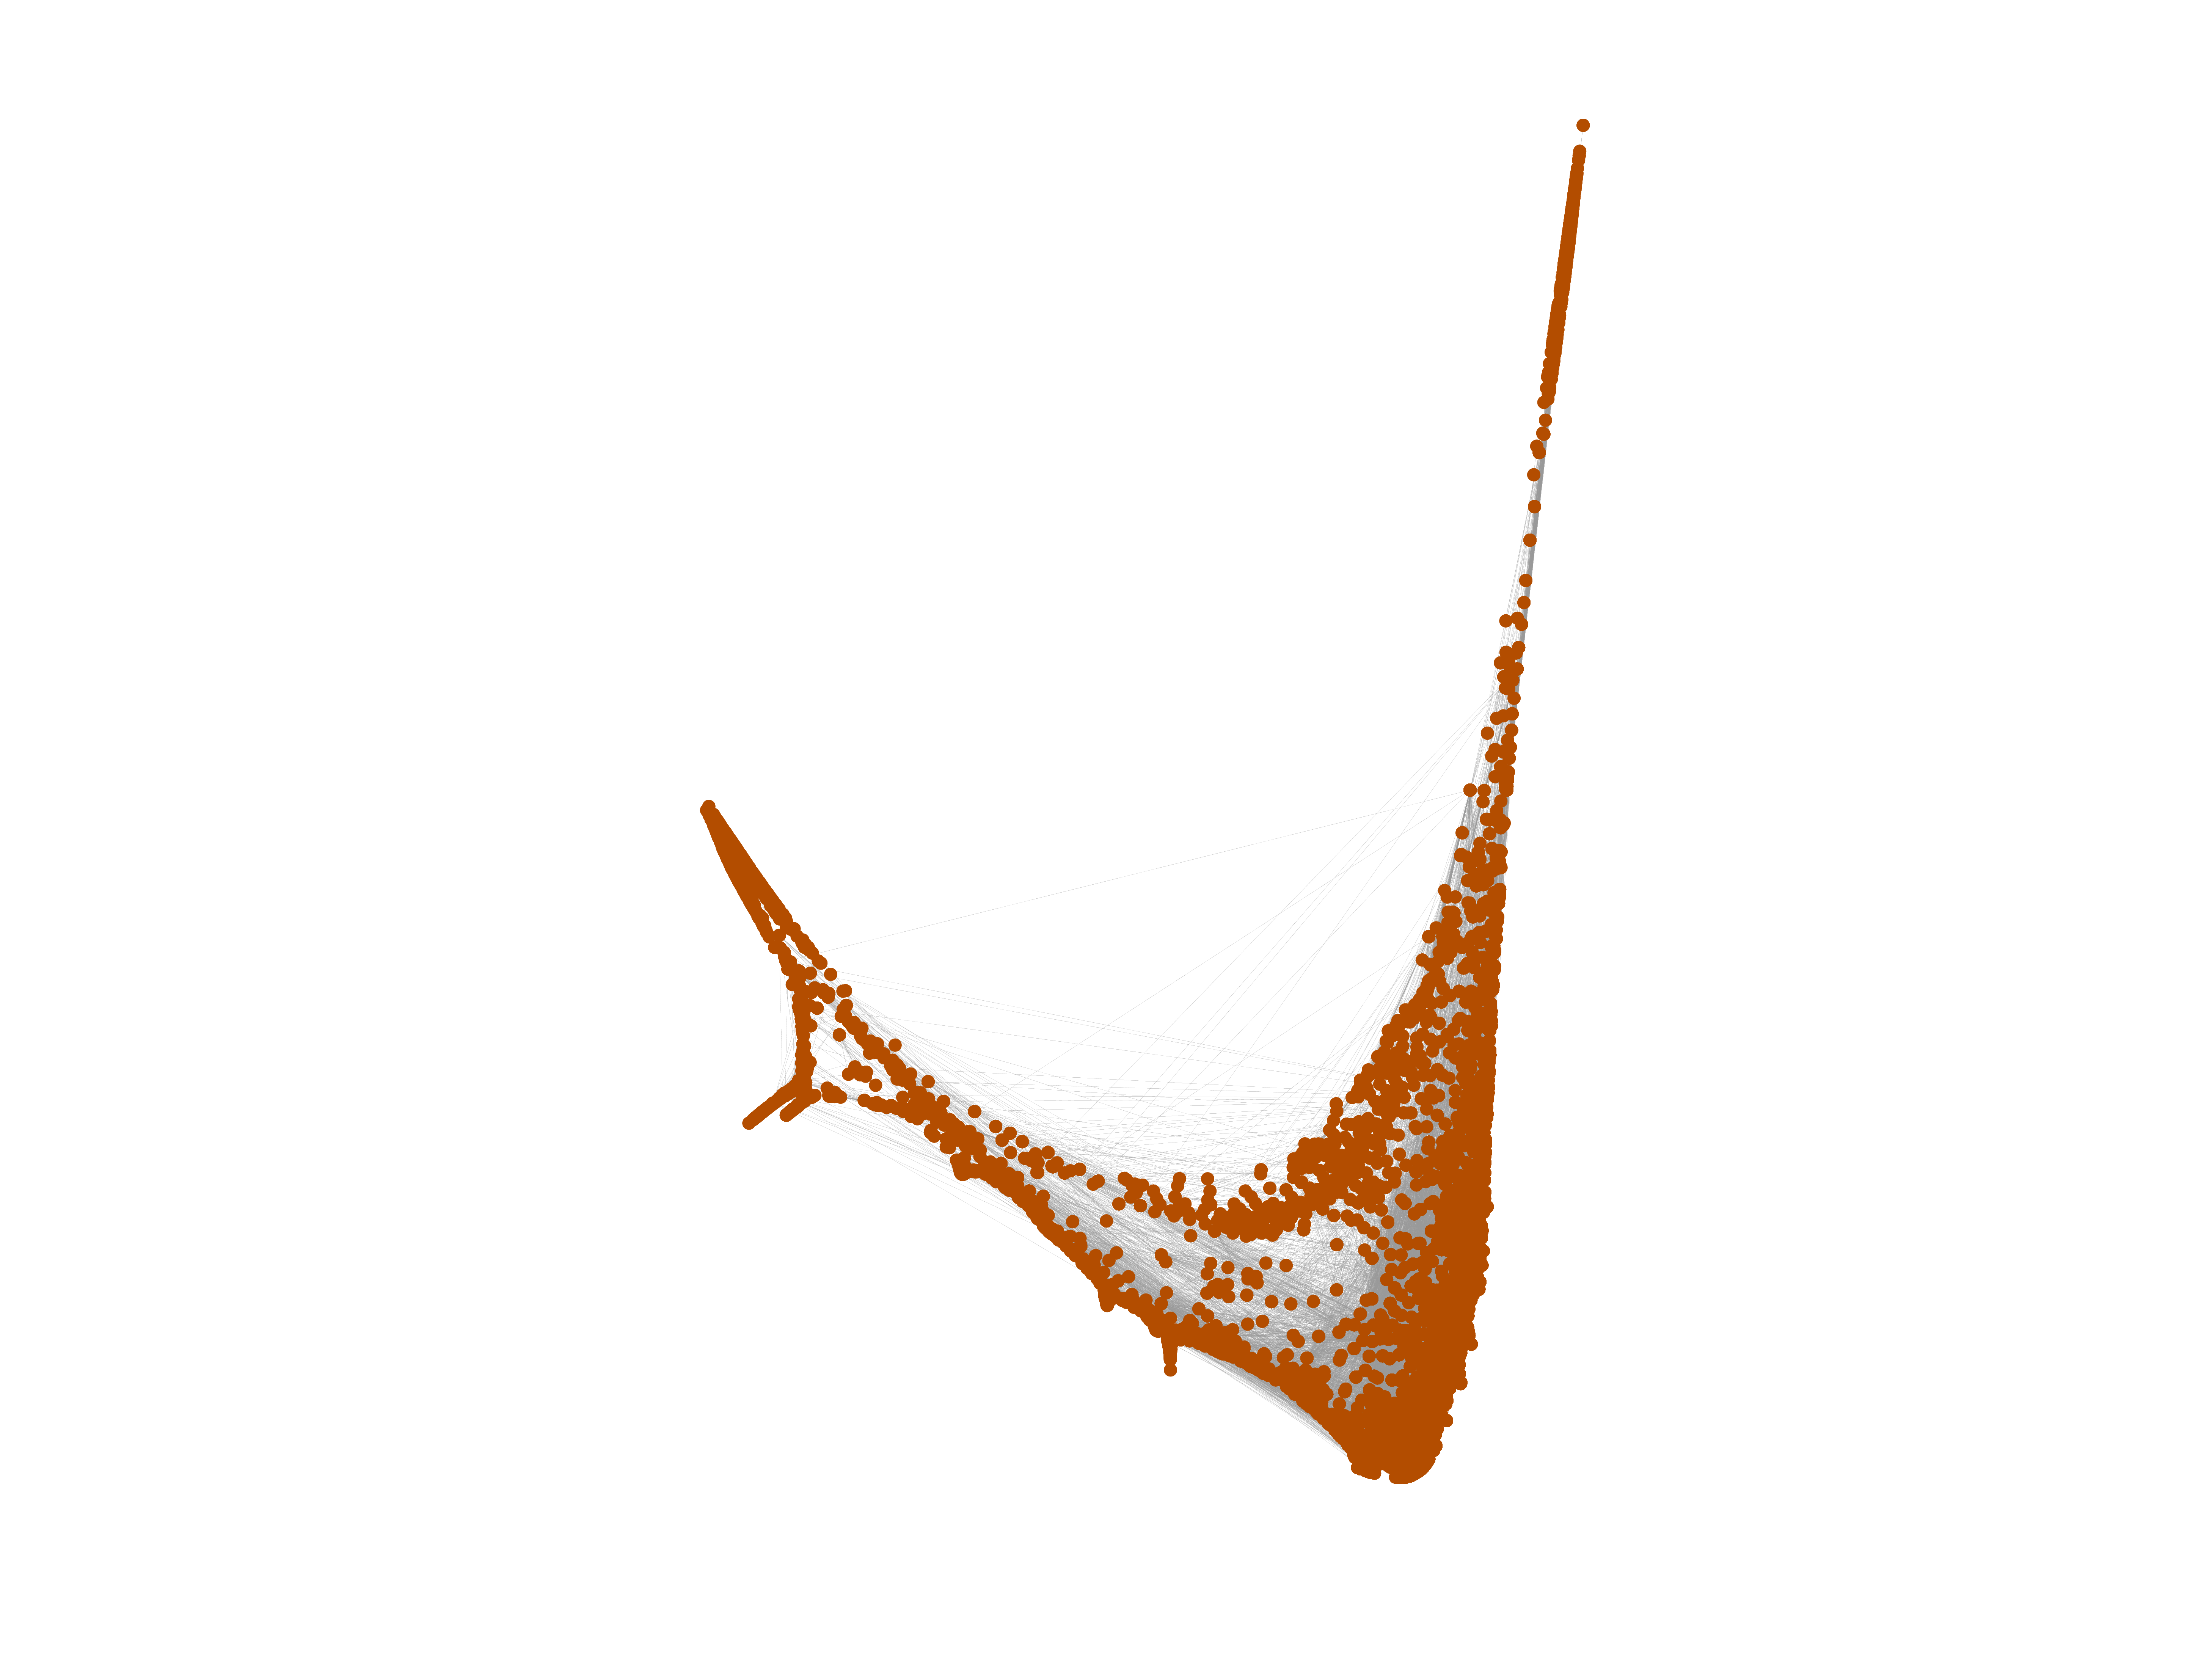
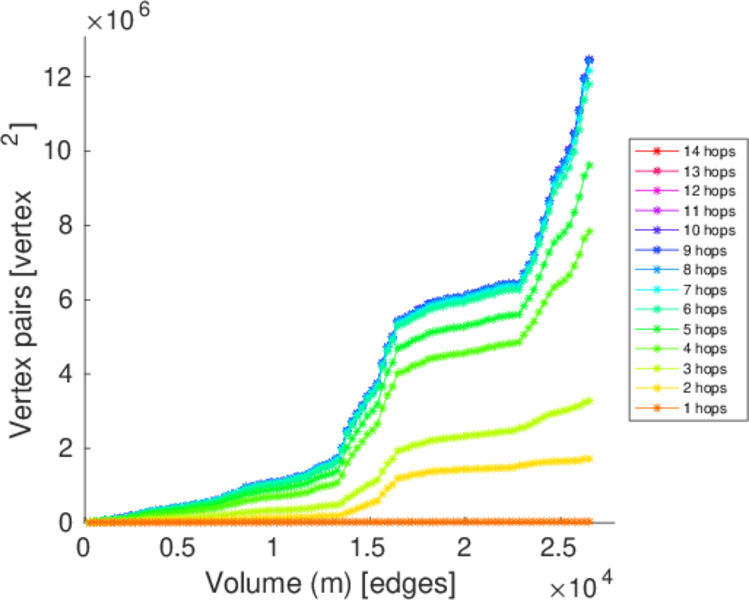
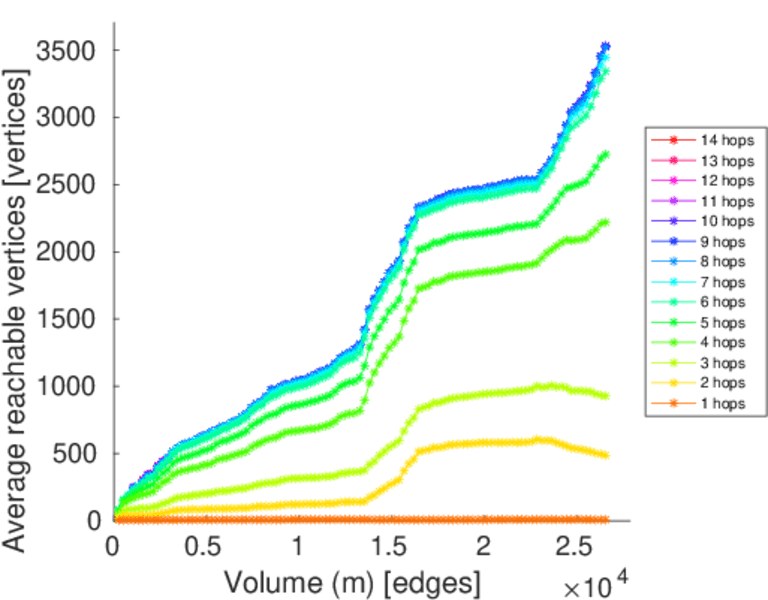
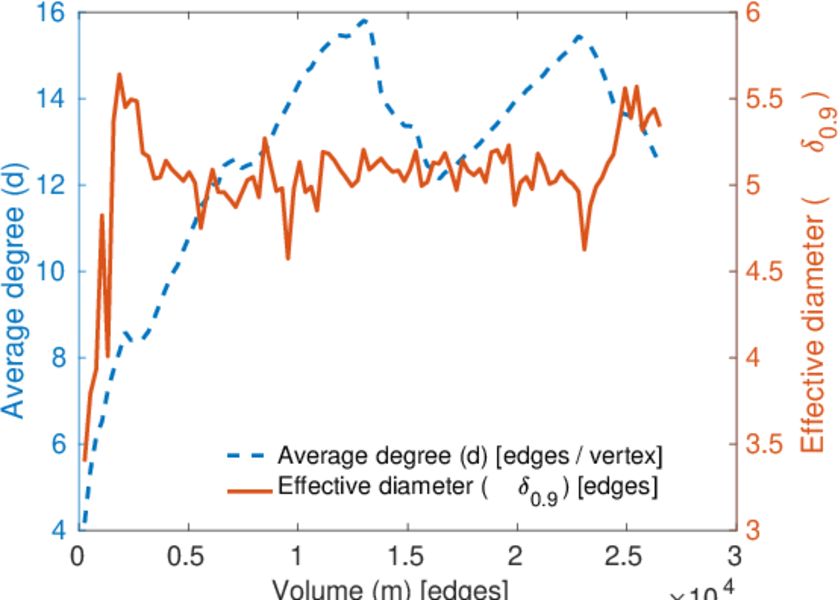
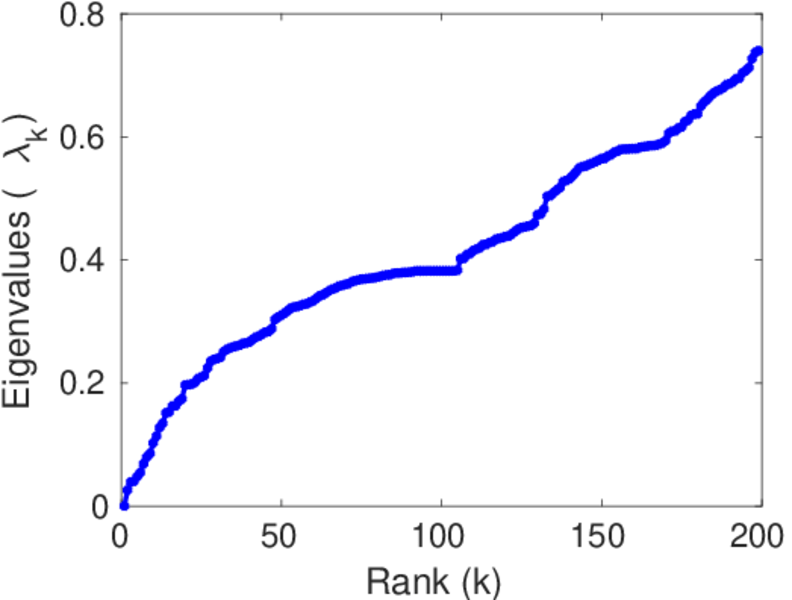
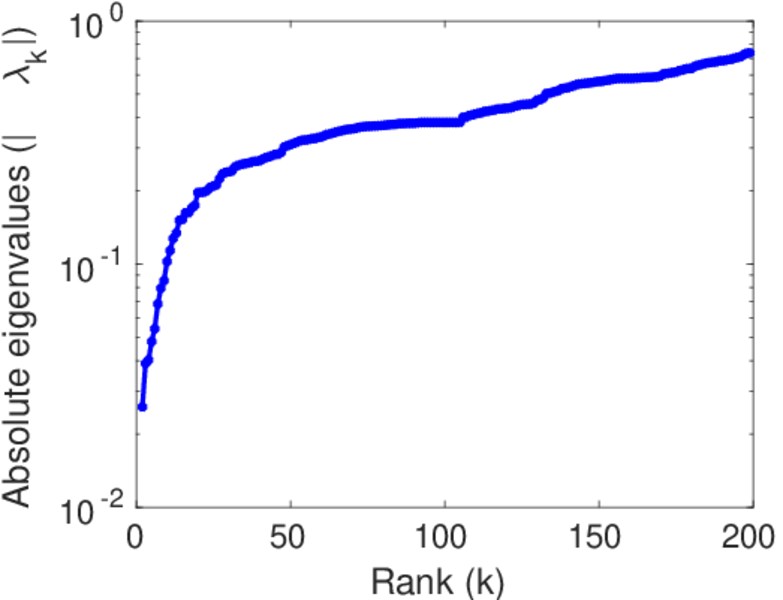
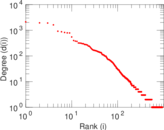
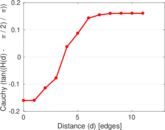
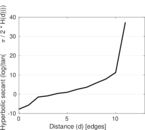
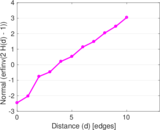
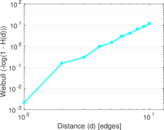
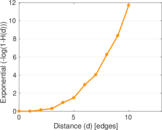
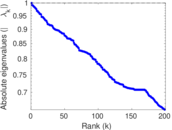
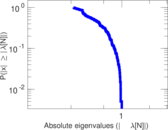
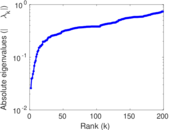
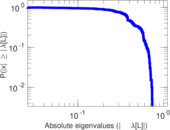
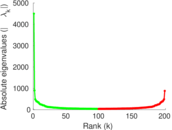
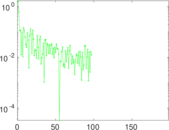
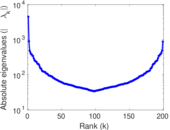
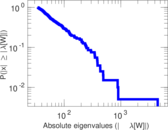
Plots

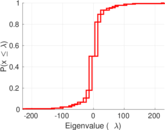
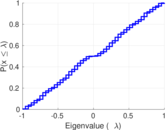
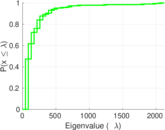


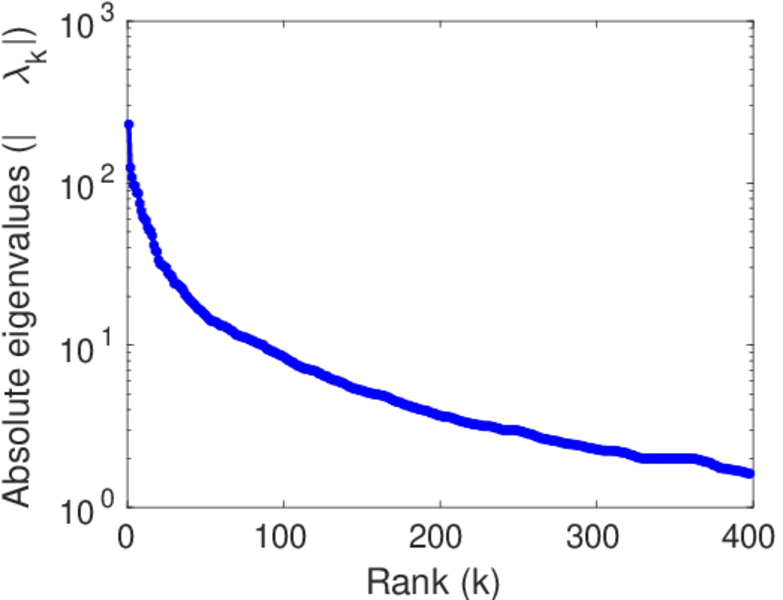
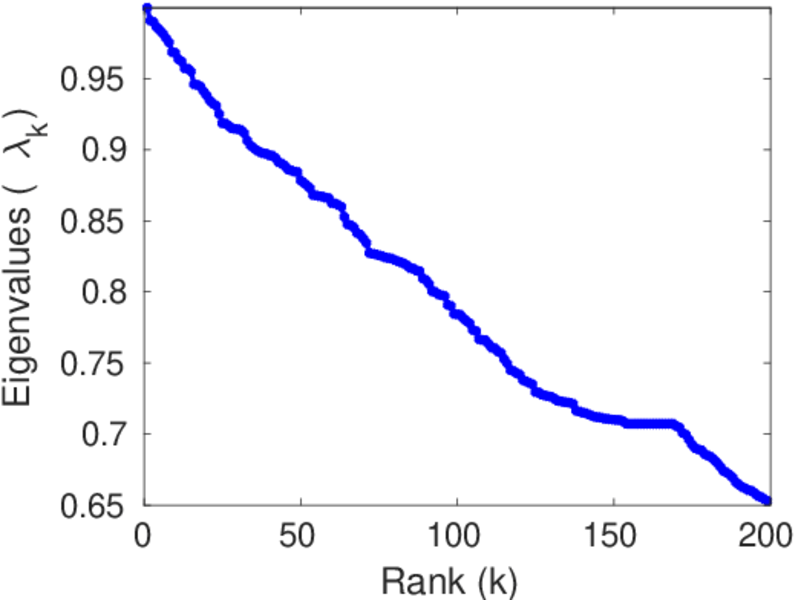
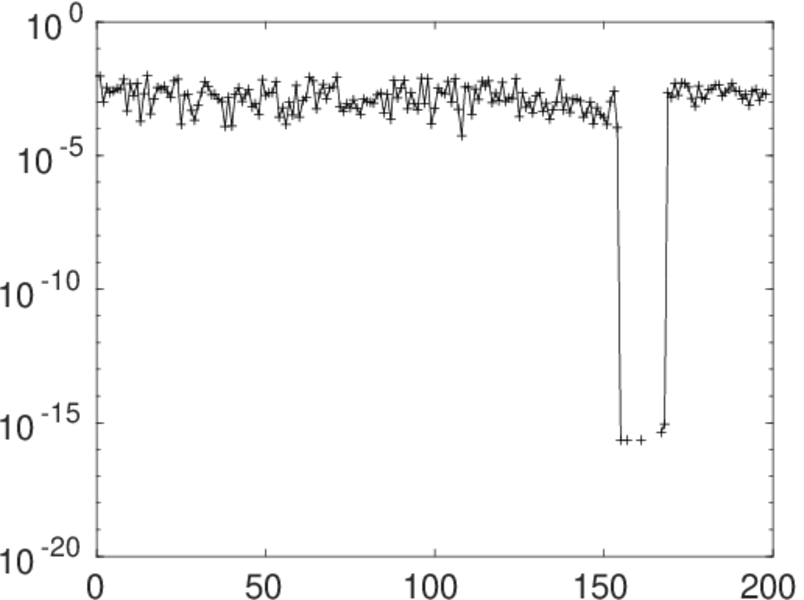
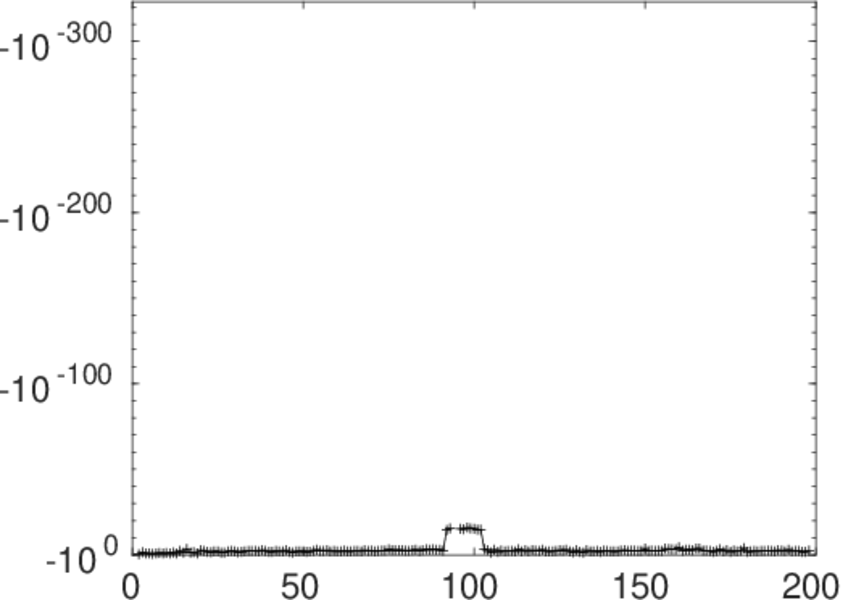
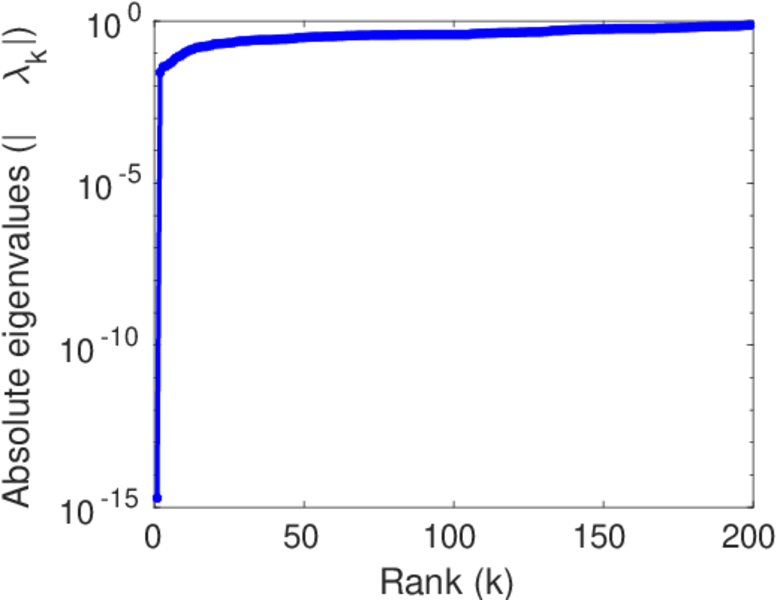
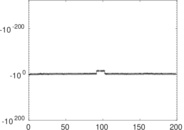
Matrix decompositions plots


Downloads
References
|
[1]
|
Jérôme Kunegis.
KONECT – The Koblenz Network Collection.
In Proc. Int. Conf. on World Wide Web Companion, pages
1343–1350, 2013.
[ http ]
|
|
[2]
|
Wikimedia Foundation.
Wikimedia downloads.
http://dumps.wikimedia.org/, January 2010.
|
 KONECT ‣ Networks ‣
Buy Me a Coffee
KONECT ‣ Networks ‣
Buy Me a Coffee