Enron
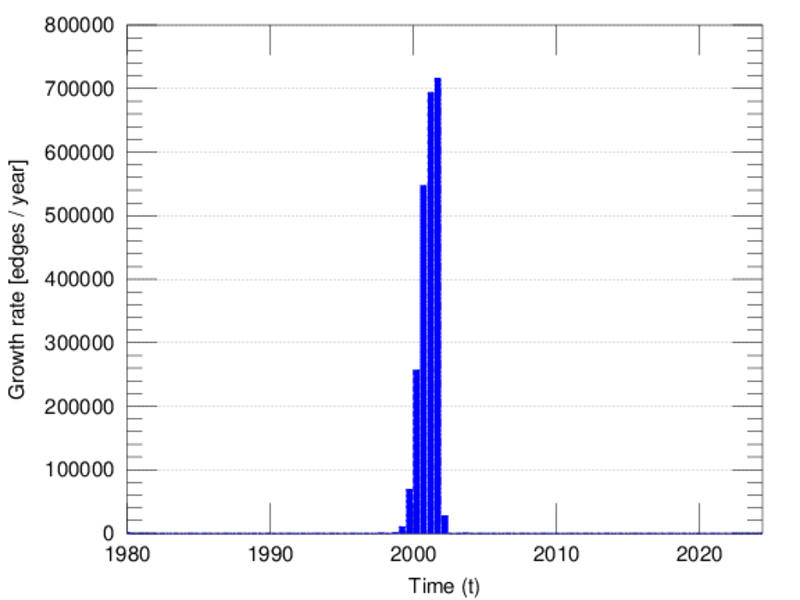
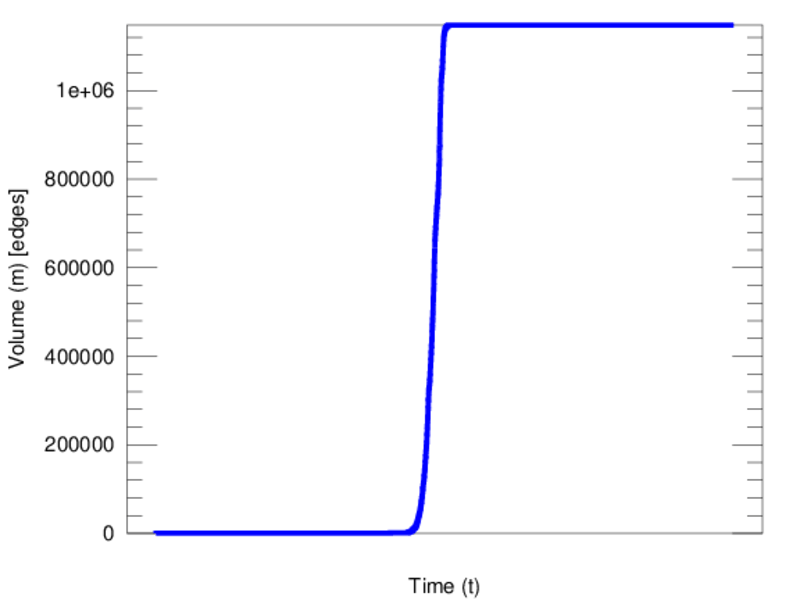
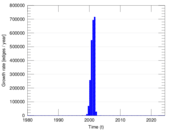
The Enron email network consists of 1,148,072 emails sent between employees of
Enron between 1999 and 2003. Nodes in the network are individual employees and
edges are individual emails. It is possible to send an email to oneself, and
thus this network contains loops.
Metadata
Statistics
| Size | n = | 87,273
|
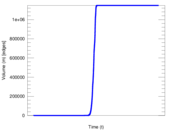
| Volume | m = | 1,148,072
|
| Unique edge count | m̿ = | 321,918
|
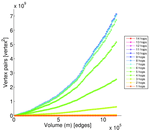
| Wedge count | s = | 49,424,399
|
| Claw count | z = | 13,894,959,120
|
| Cross count | x = | 3,805,295,597,320
|
| Triangle count | t = | 1,180,387
|
| Square count | q = | 92,985,807
|
| 4-Tour count | T4 = | 942,178,964
|
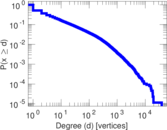
| Maximum degree | dmax = | 38,785
|
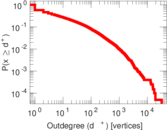
| Maximum outdegree | d+max = | 32,619
|
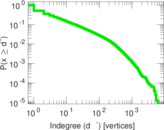
| Maximum indegree | d−max = | 6,166
|
| Average degree | d = | 26.309 9
|
| Fill | p = | 4.226 54 × 10−5
|
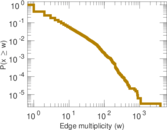
| Average edge multiplicity | m̃ = | 3.566 35
|
| Size of LCC | N = | 84,384
|
| Size of LSCC | Ns = | 9,164
|
| Relative size of LSCC | Nrs = | 0.105 004
|
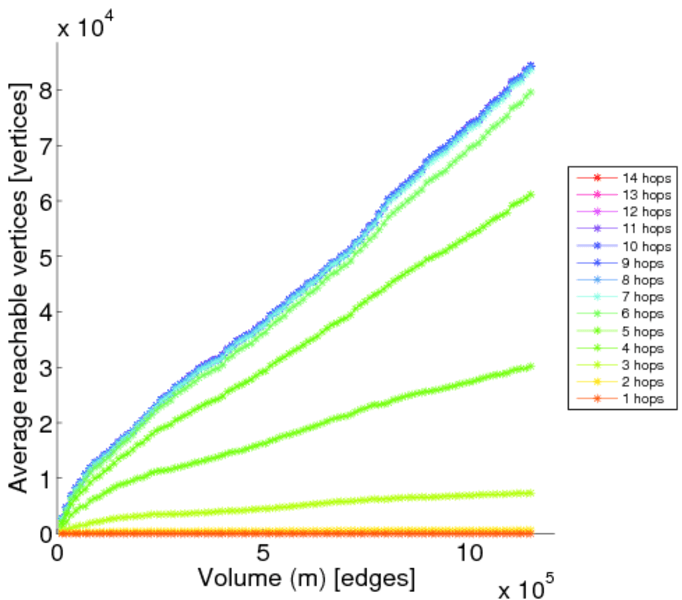
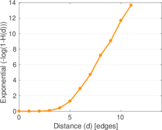
| Diameter | δ = | 14
|
| 50-Percentile effective diameter | δ0.5 = | 4.405 46
|
| 90-Percentile effective diameter | δ0.9 = | 5.790 34
|
| Median distance | δM = | 5
|
| Mean distance | δm = | 4.903 26
|
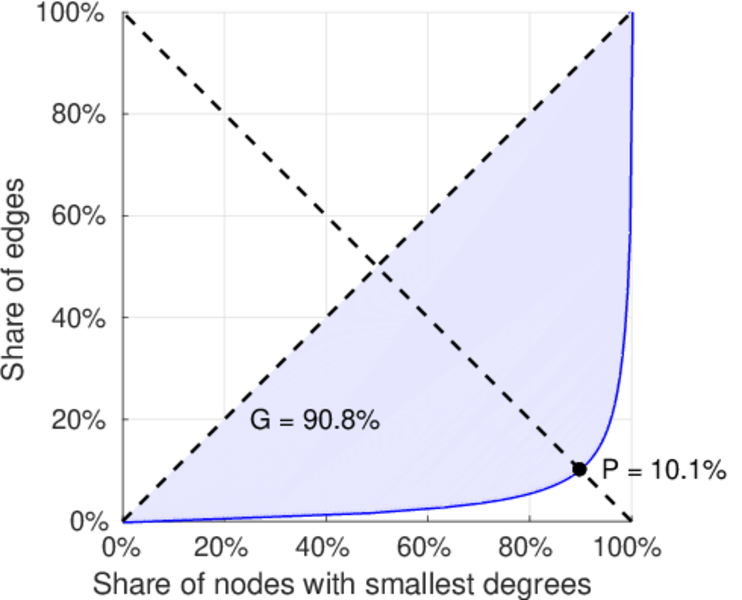
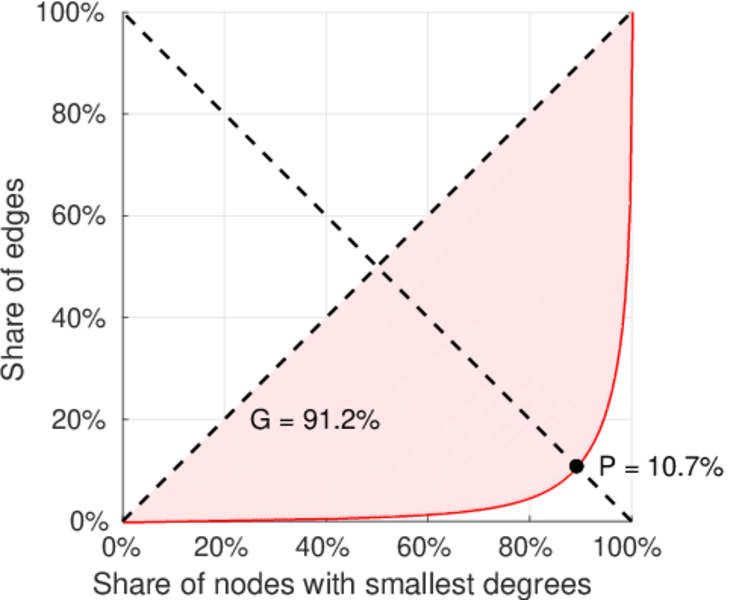
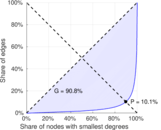
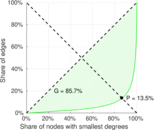
| Balanced inequality ratio | P = | 0.100 618
|
| Outdegree balanced inequality ratio | P+ = | 0.106 510
|
| Indegree balanced inequality ratio | P− = | 0.134 857
|
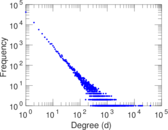
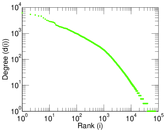
| Power law exponent | γ = | 2.651 60
|
| Tail power law exponent | γt = | 1.761 00
|
| Tail power law exponent with p | γ3 = | 1.761 00
|
| p-value | p = | 0.000 00
|
| Outdegree tail power law exponent with p | γ3,o = | 2.301 00
|
| Outdegree p-value | po = | 0.000 00
|
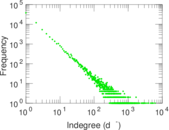
| Indegree tail power law exponent with p | γ3,i = | 2.871 00
|
| Indegree p-value | pi = | 0.351 000
|
| Degree assortativity | ρ = | −0.167 768
|
| Degree assortativity p-value | pρ = | 0.000 00
|
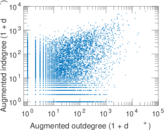
| In/outdegree correlation | ρ± = | +0.403 110
|
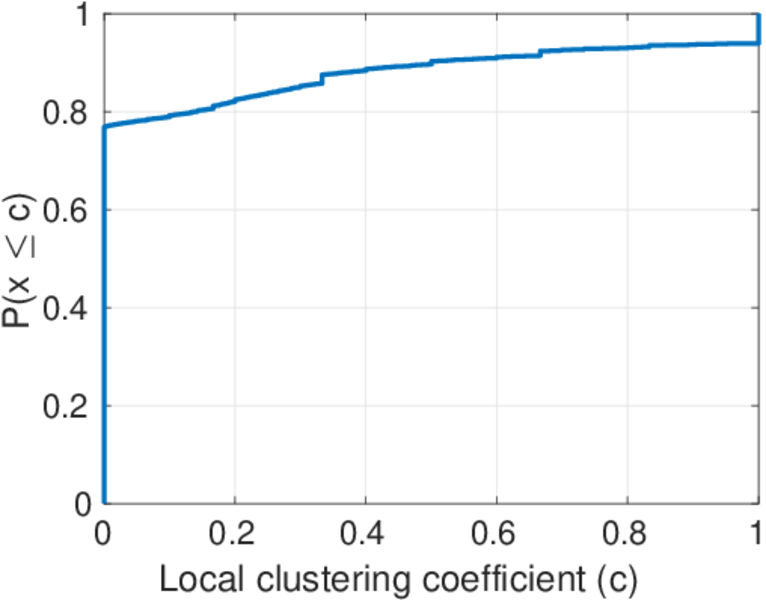
| Clustering coefficient | c = | 0.071 648 0
|
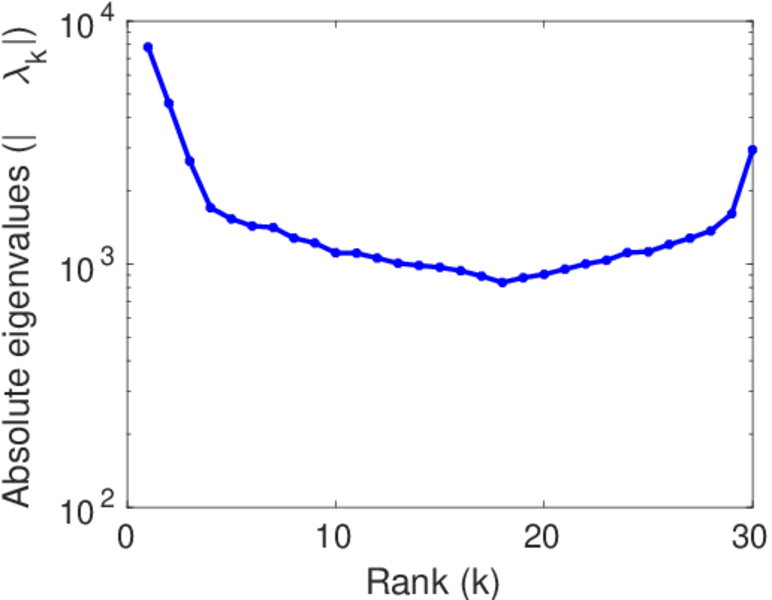
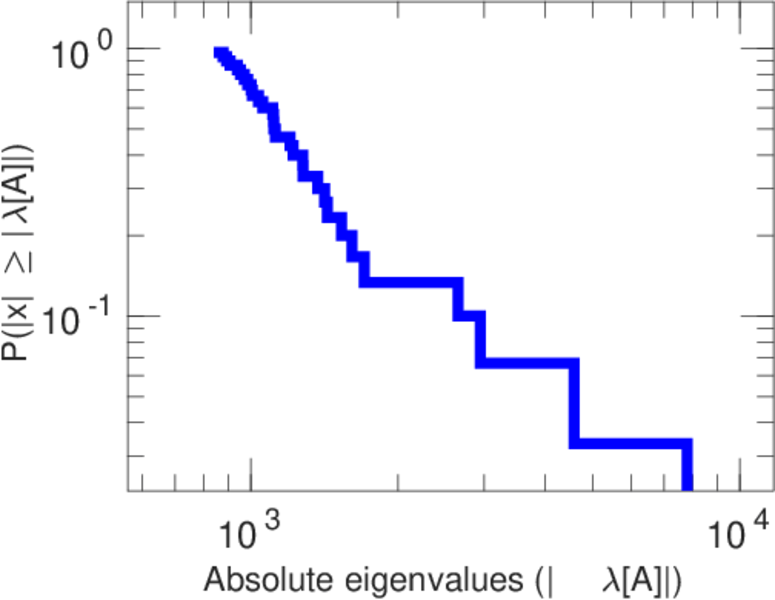
| Spectral norm | α = | 7,808.15
|
| Operator 2-norm | ν = | 3,904.14
|
| Cyclic eigenvalue | π = | 3,904.00
|
| Algebraic connectivity | a = | 0.004 157 70
|
| Reciprocity | y = | 0.146 497
|
| Non-bipartivity | bA = | 0.622 292
|
| Spectral bipartite frustration | bK = | 8.928 20 × 10−5
|
| Controllability | C = | 77,596
|
| Relative controllability | Cr = | 0.889 118
|
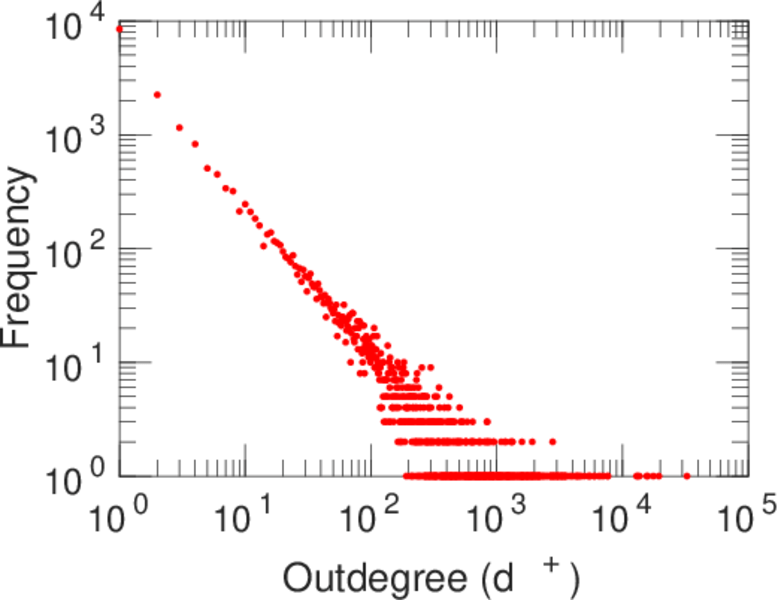
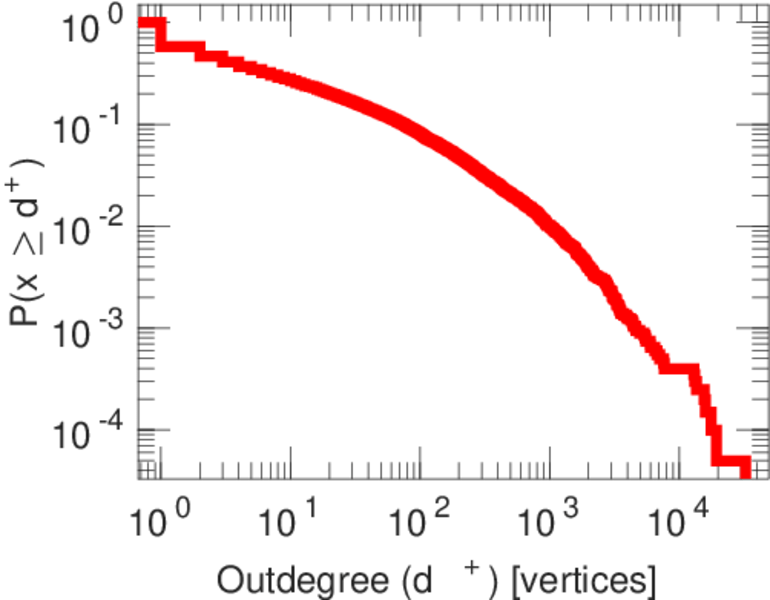
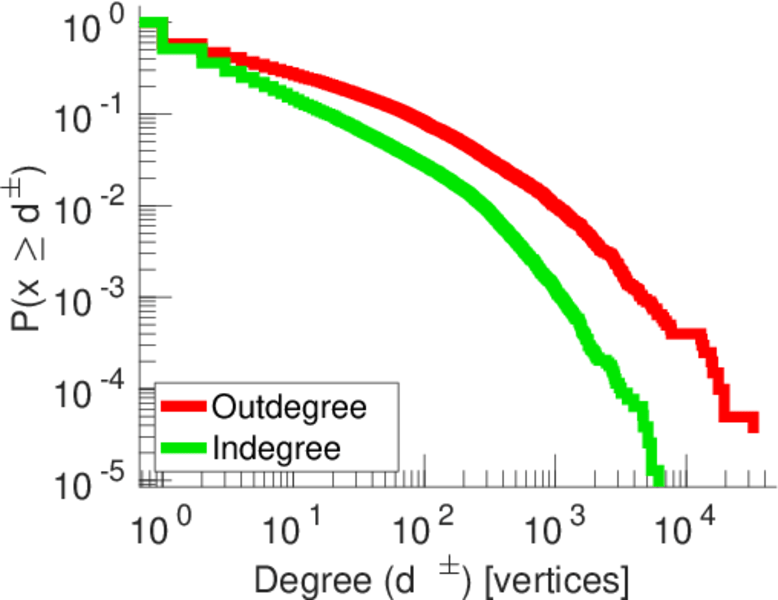
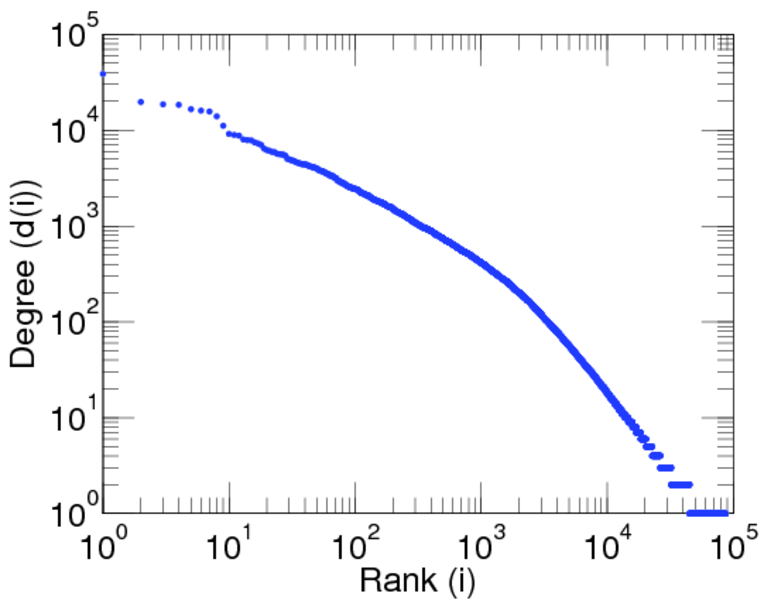
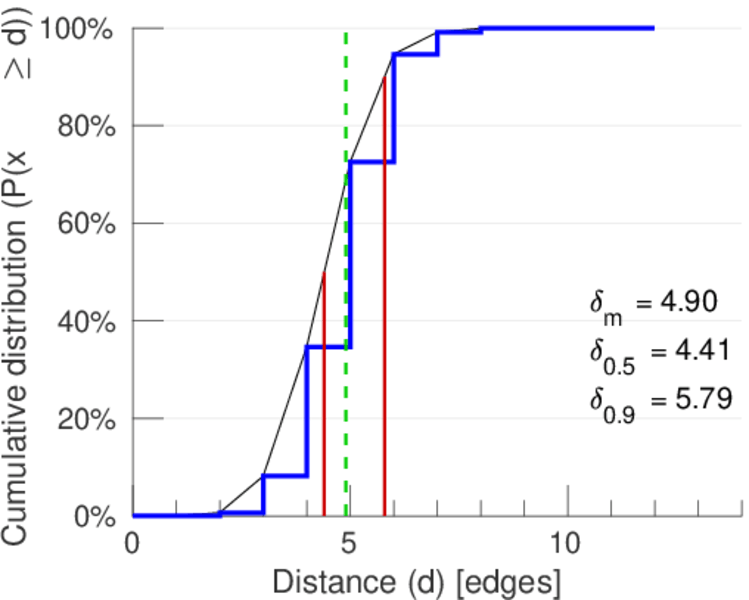
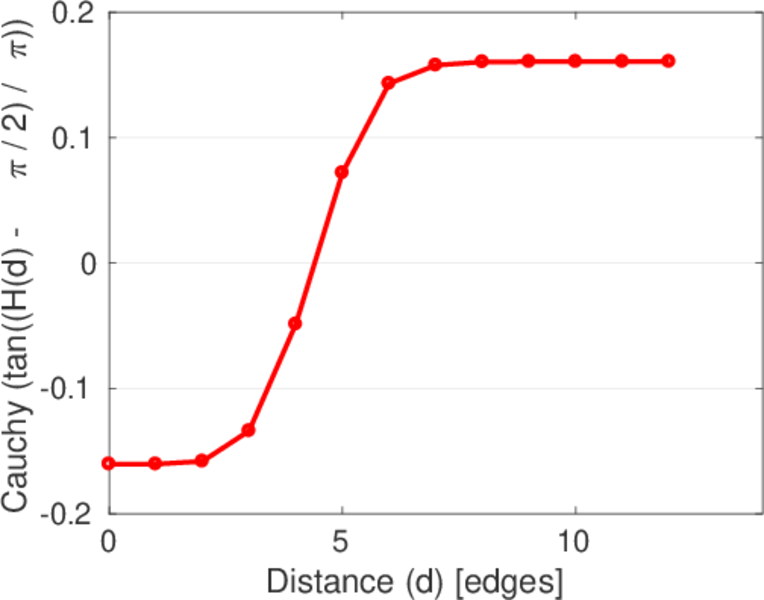
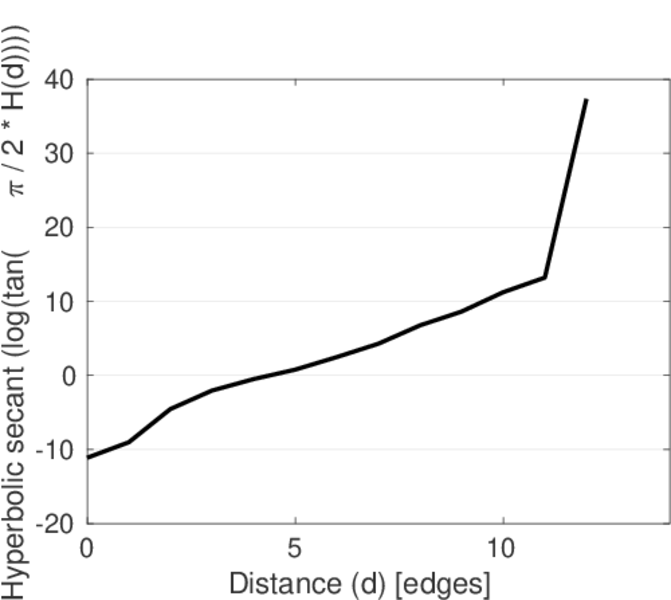
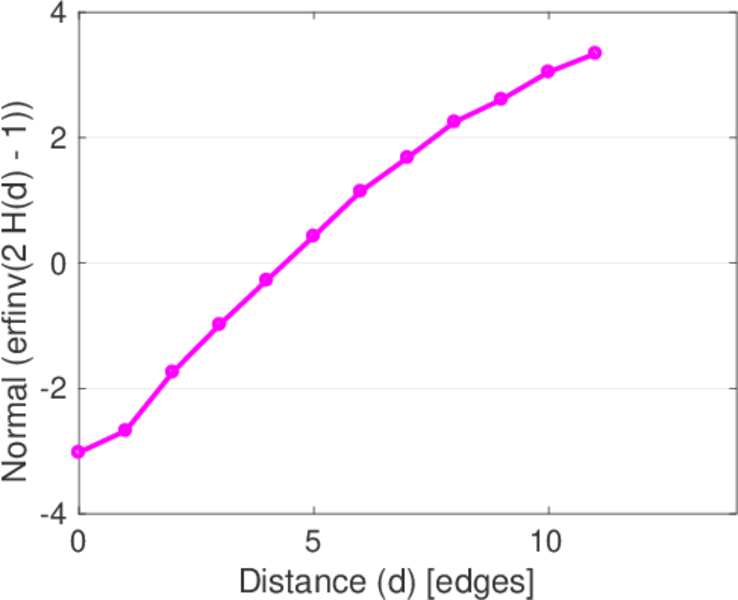
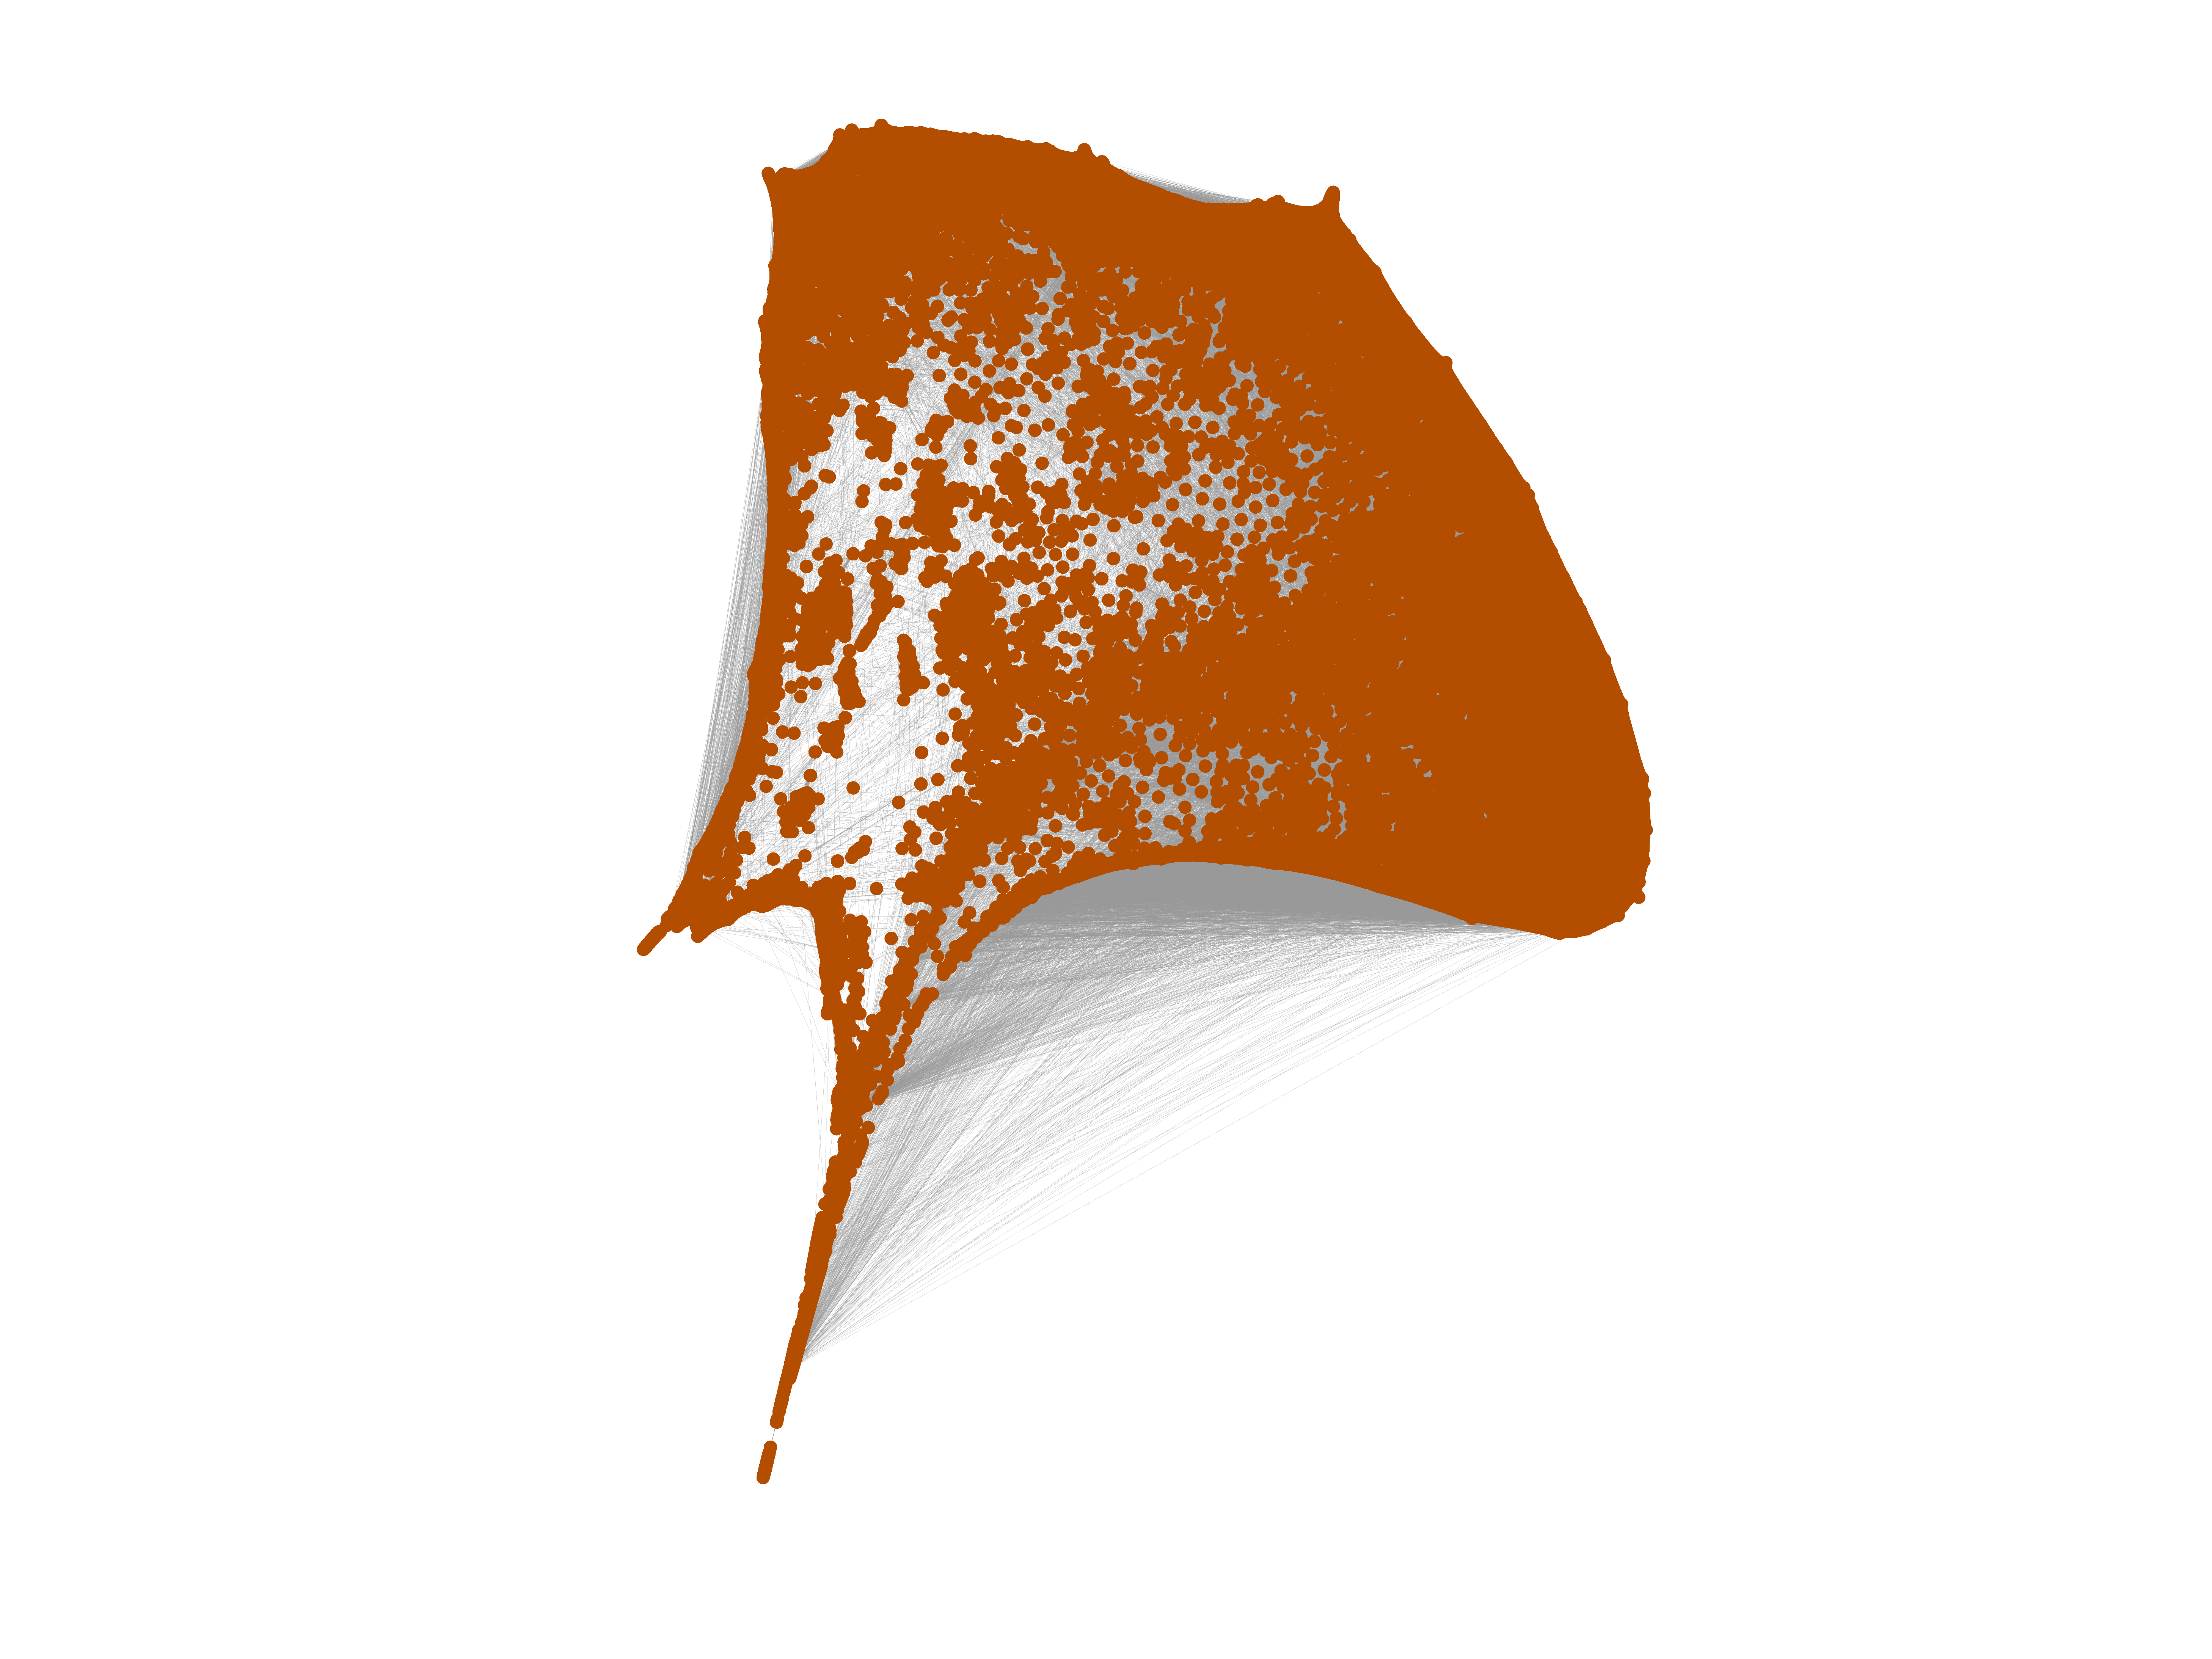
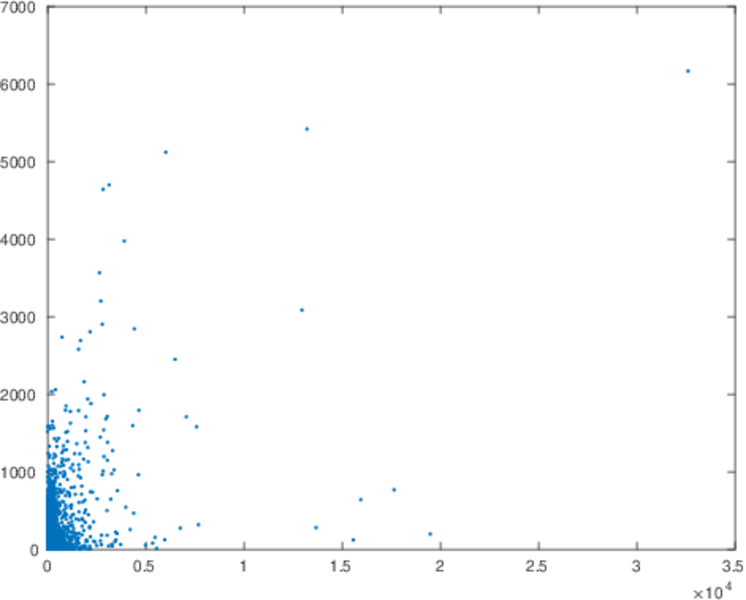
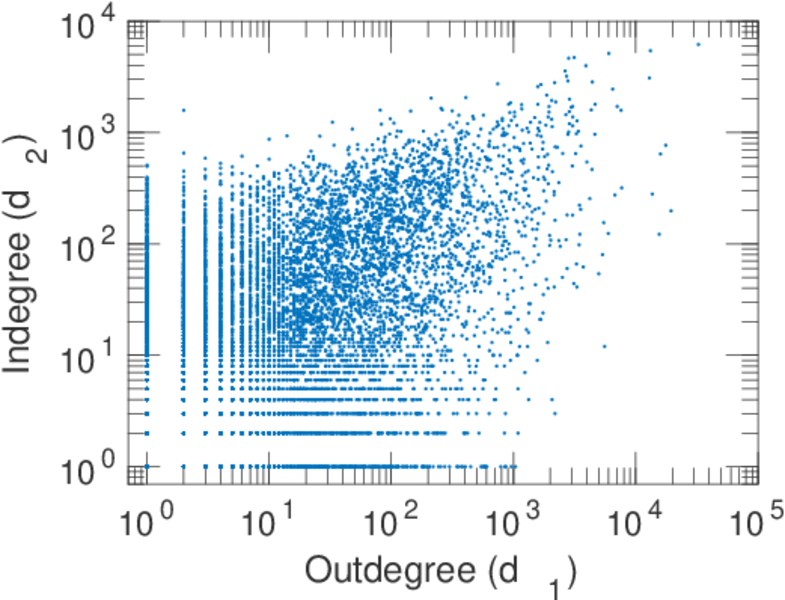
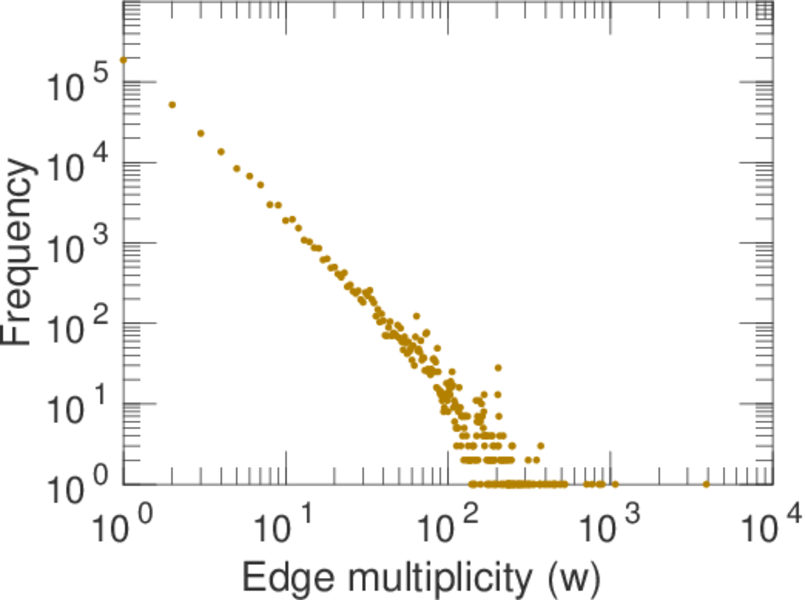
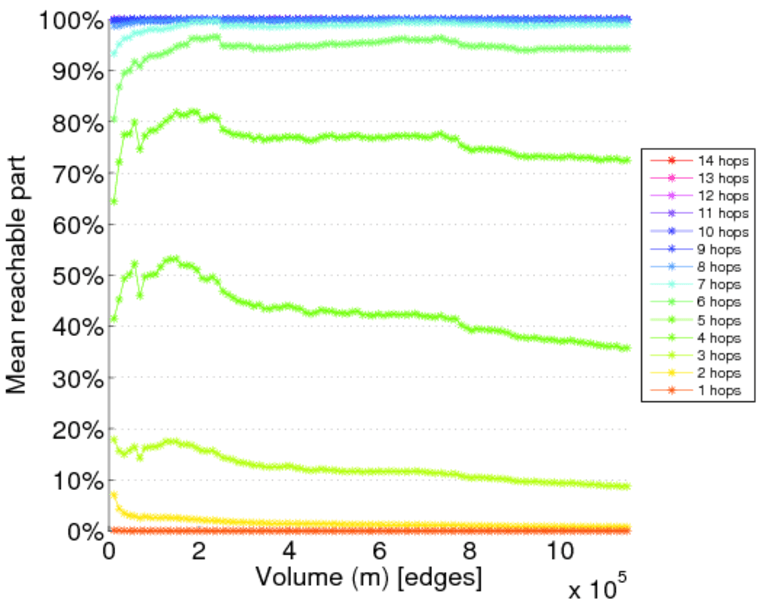
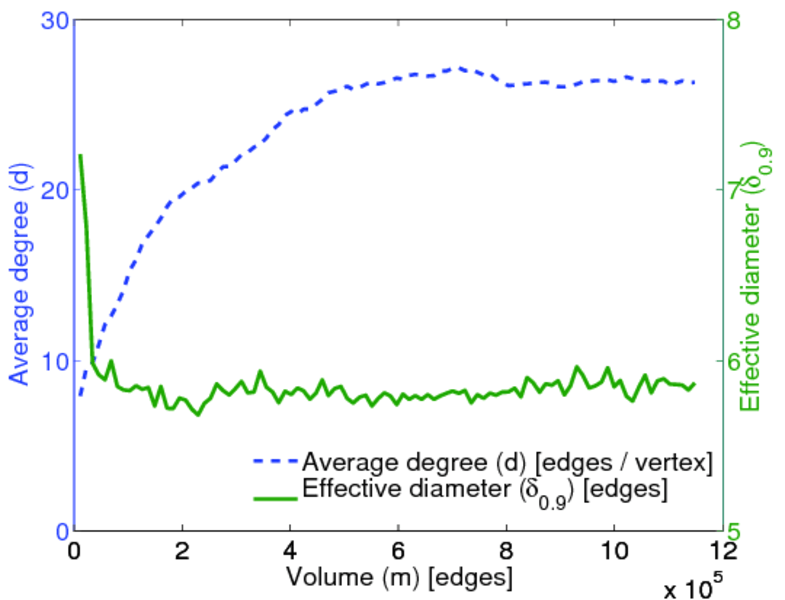
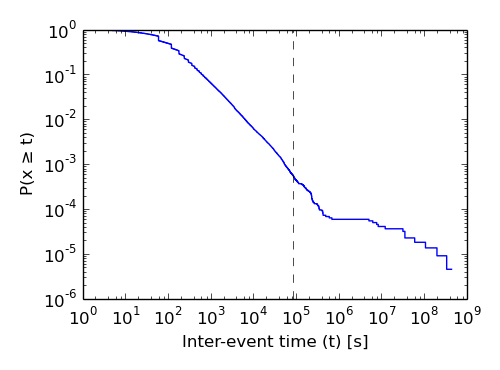
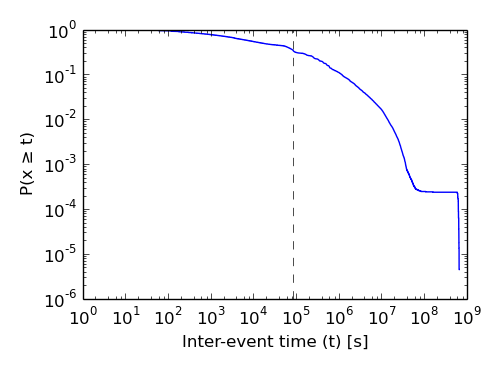
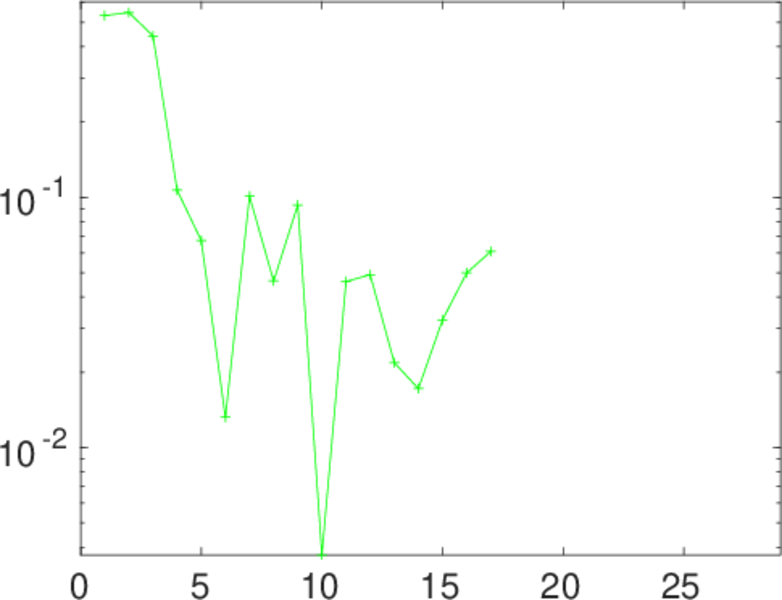
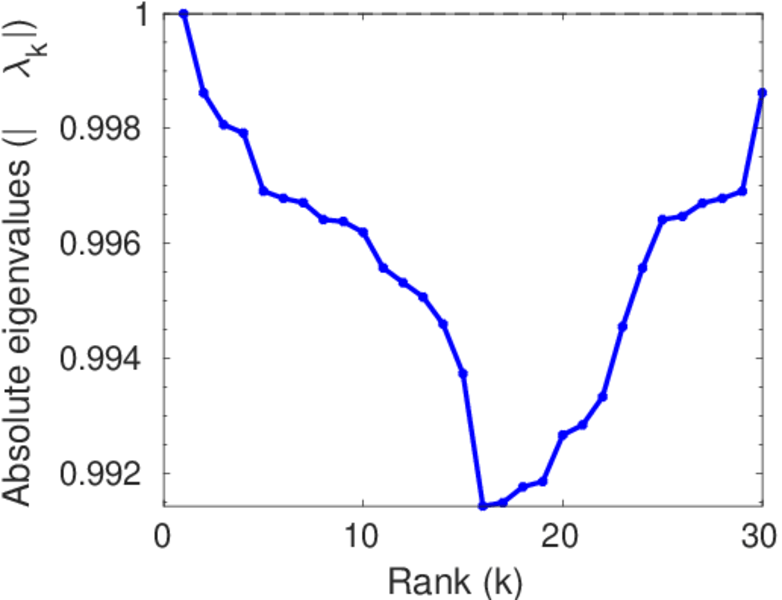
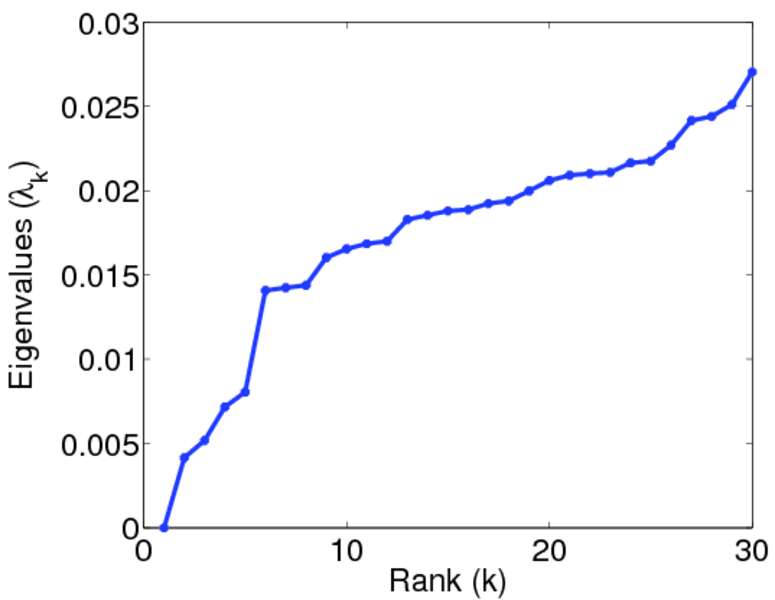
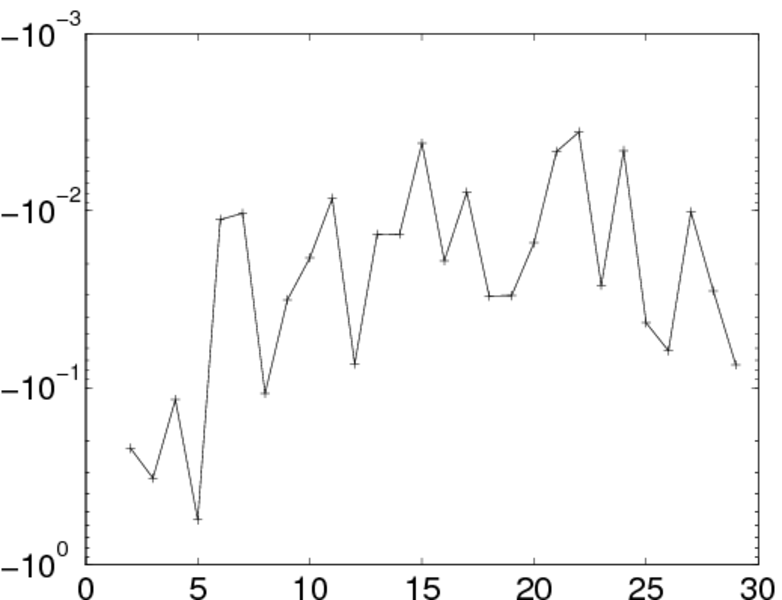
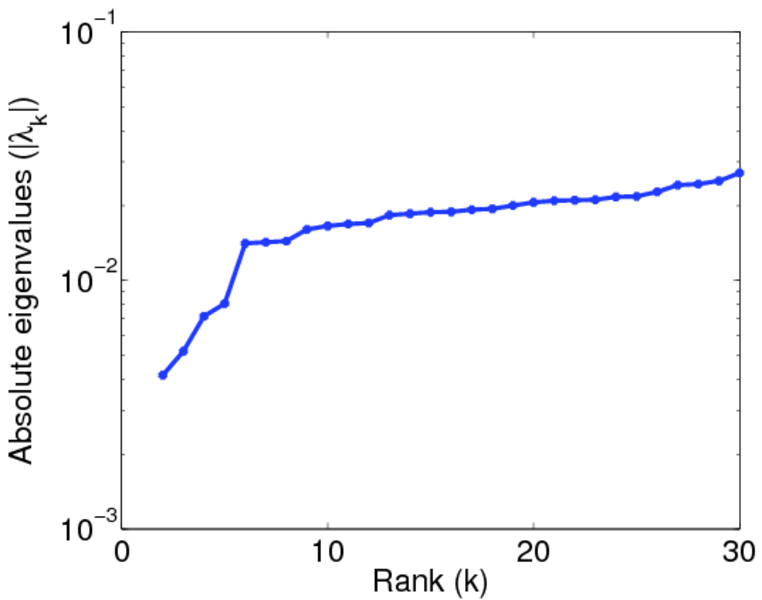
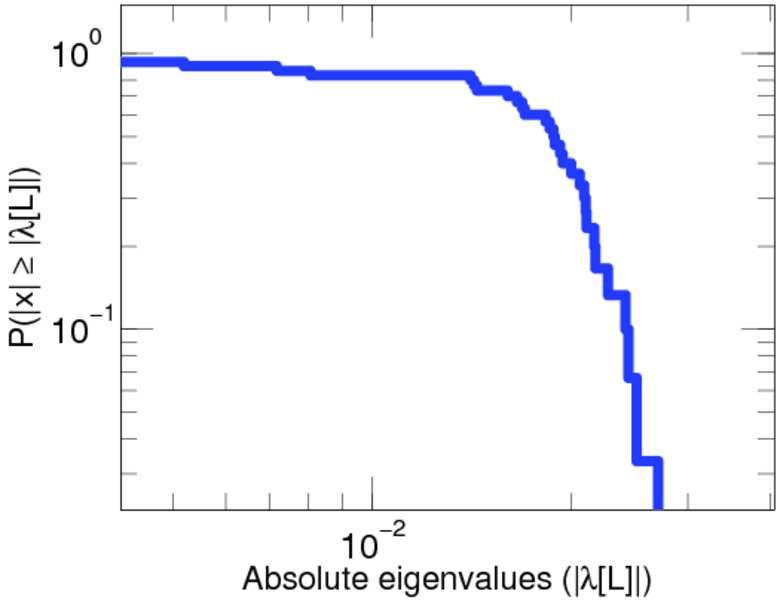
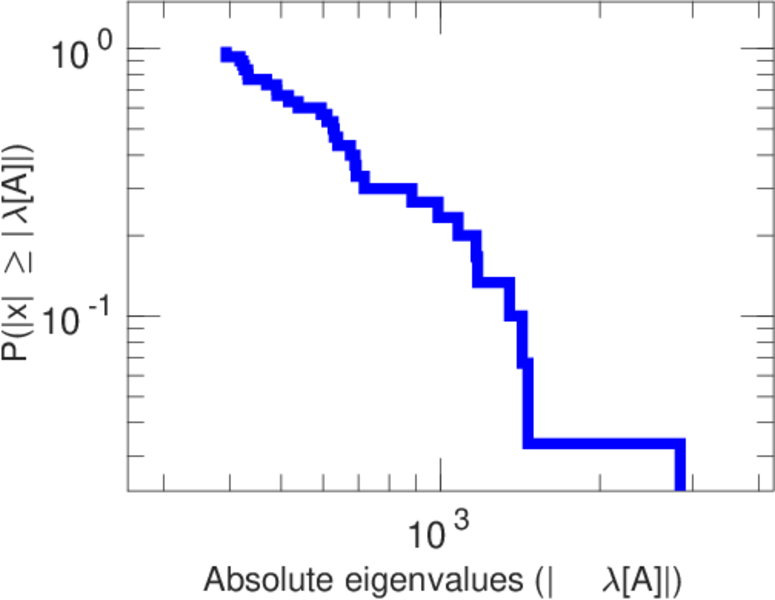
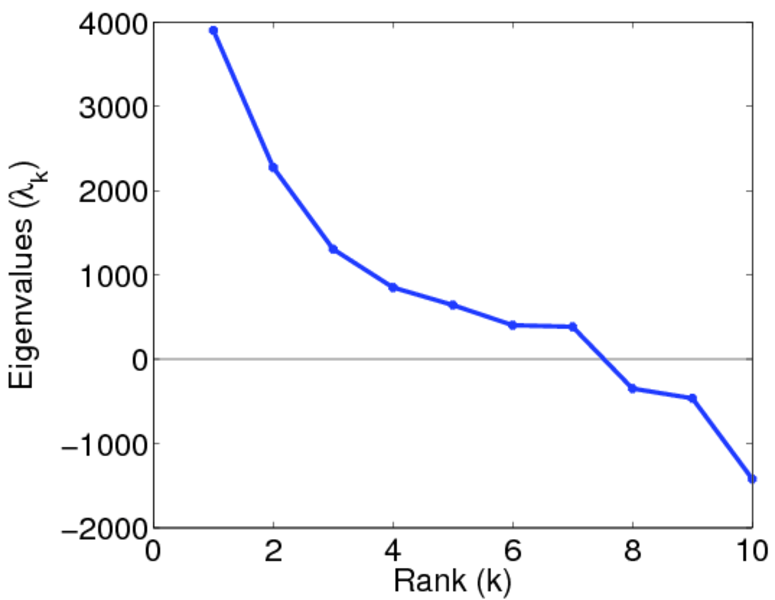
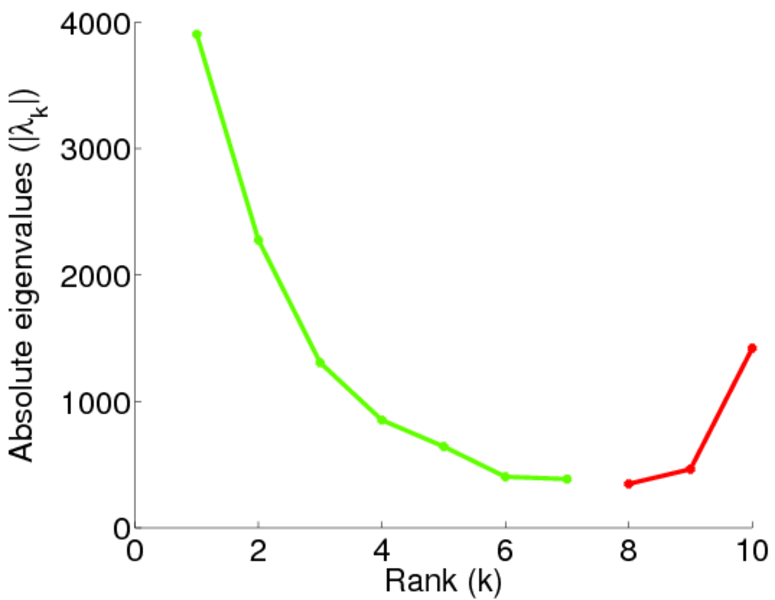
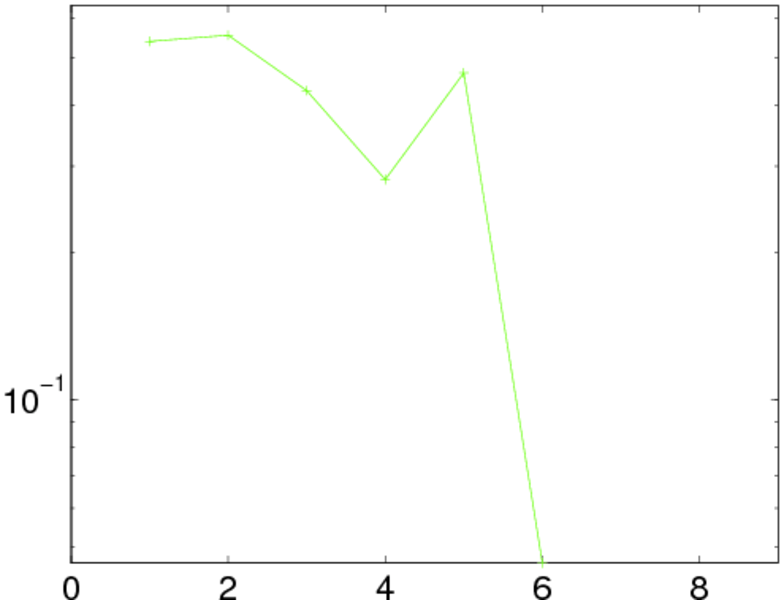
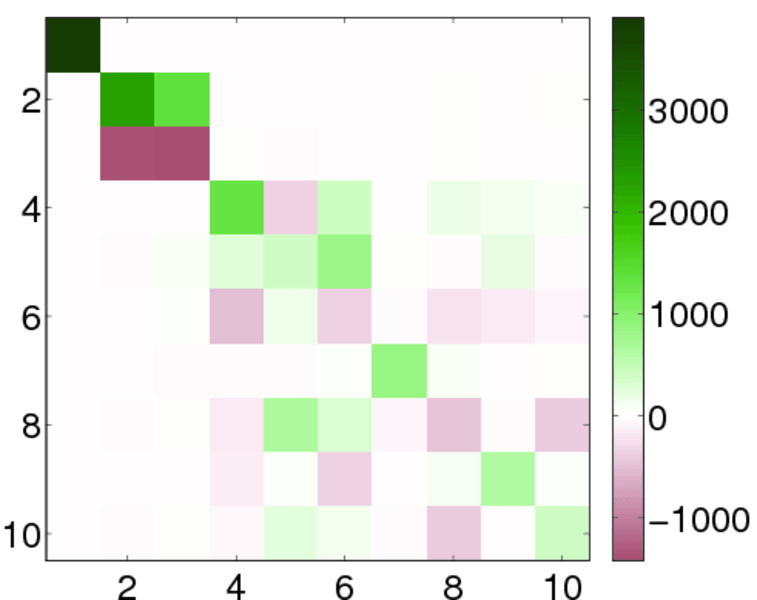
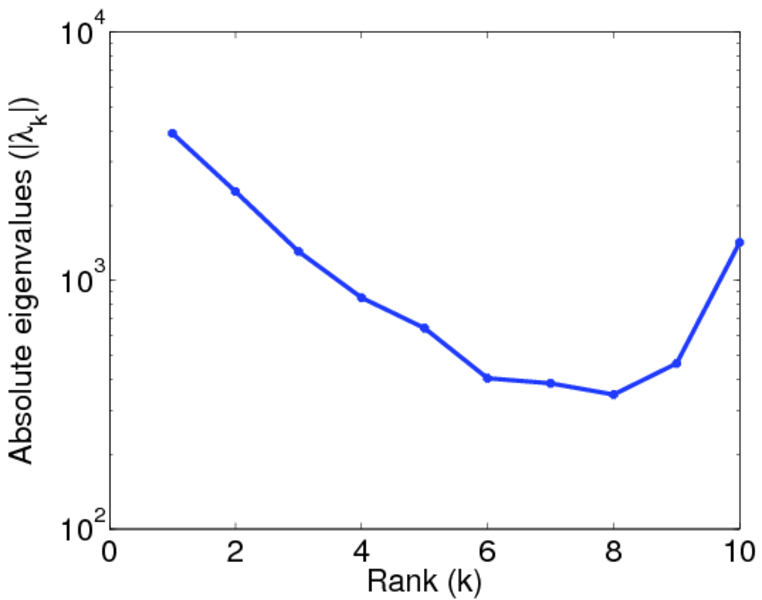
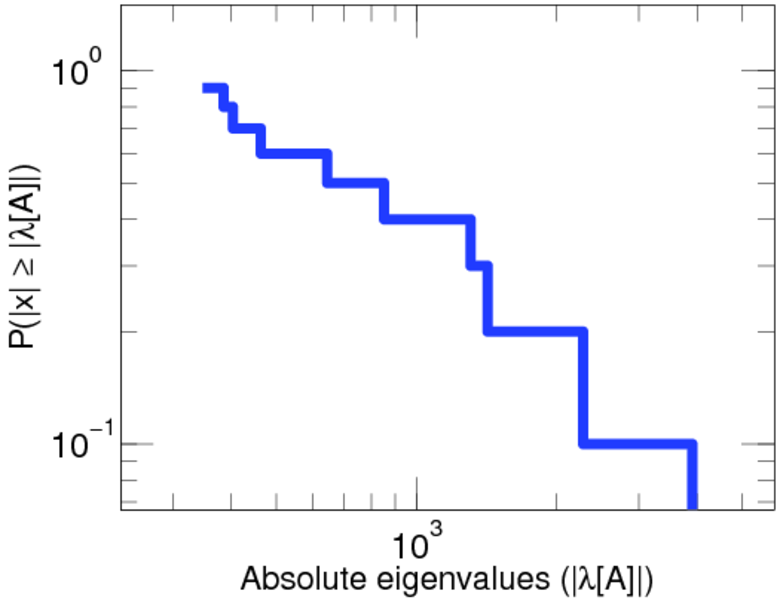
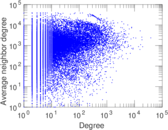
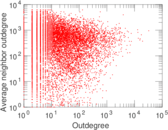
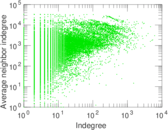
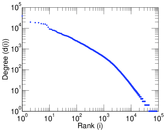
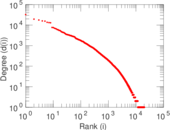
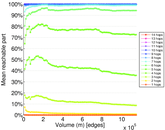
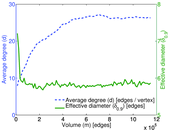
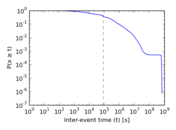
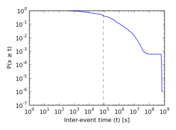
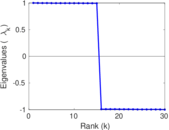
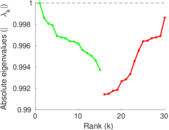
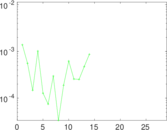
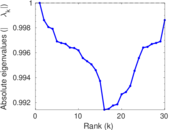
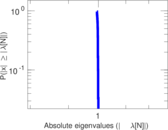
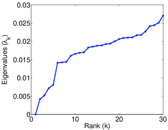
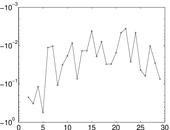
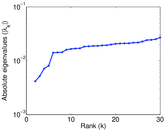
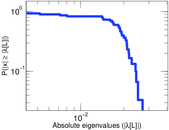
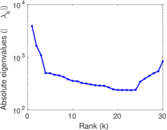
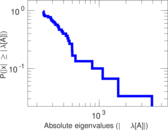
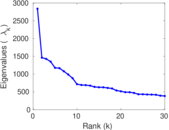
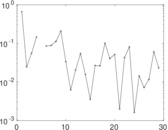
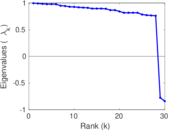
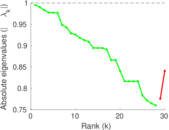
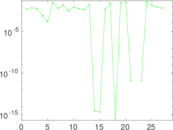
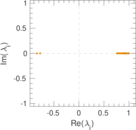
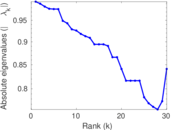
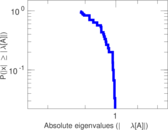
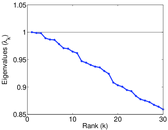
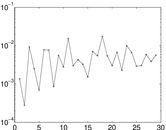
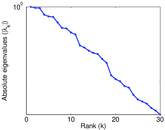
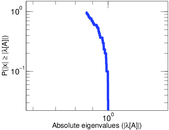
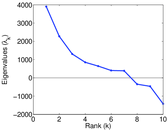
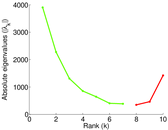
Plots


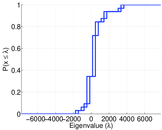
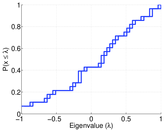
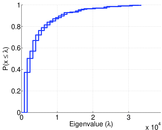


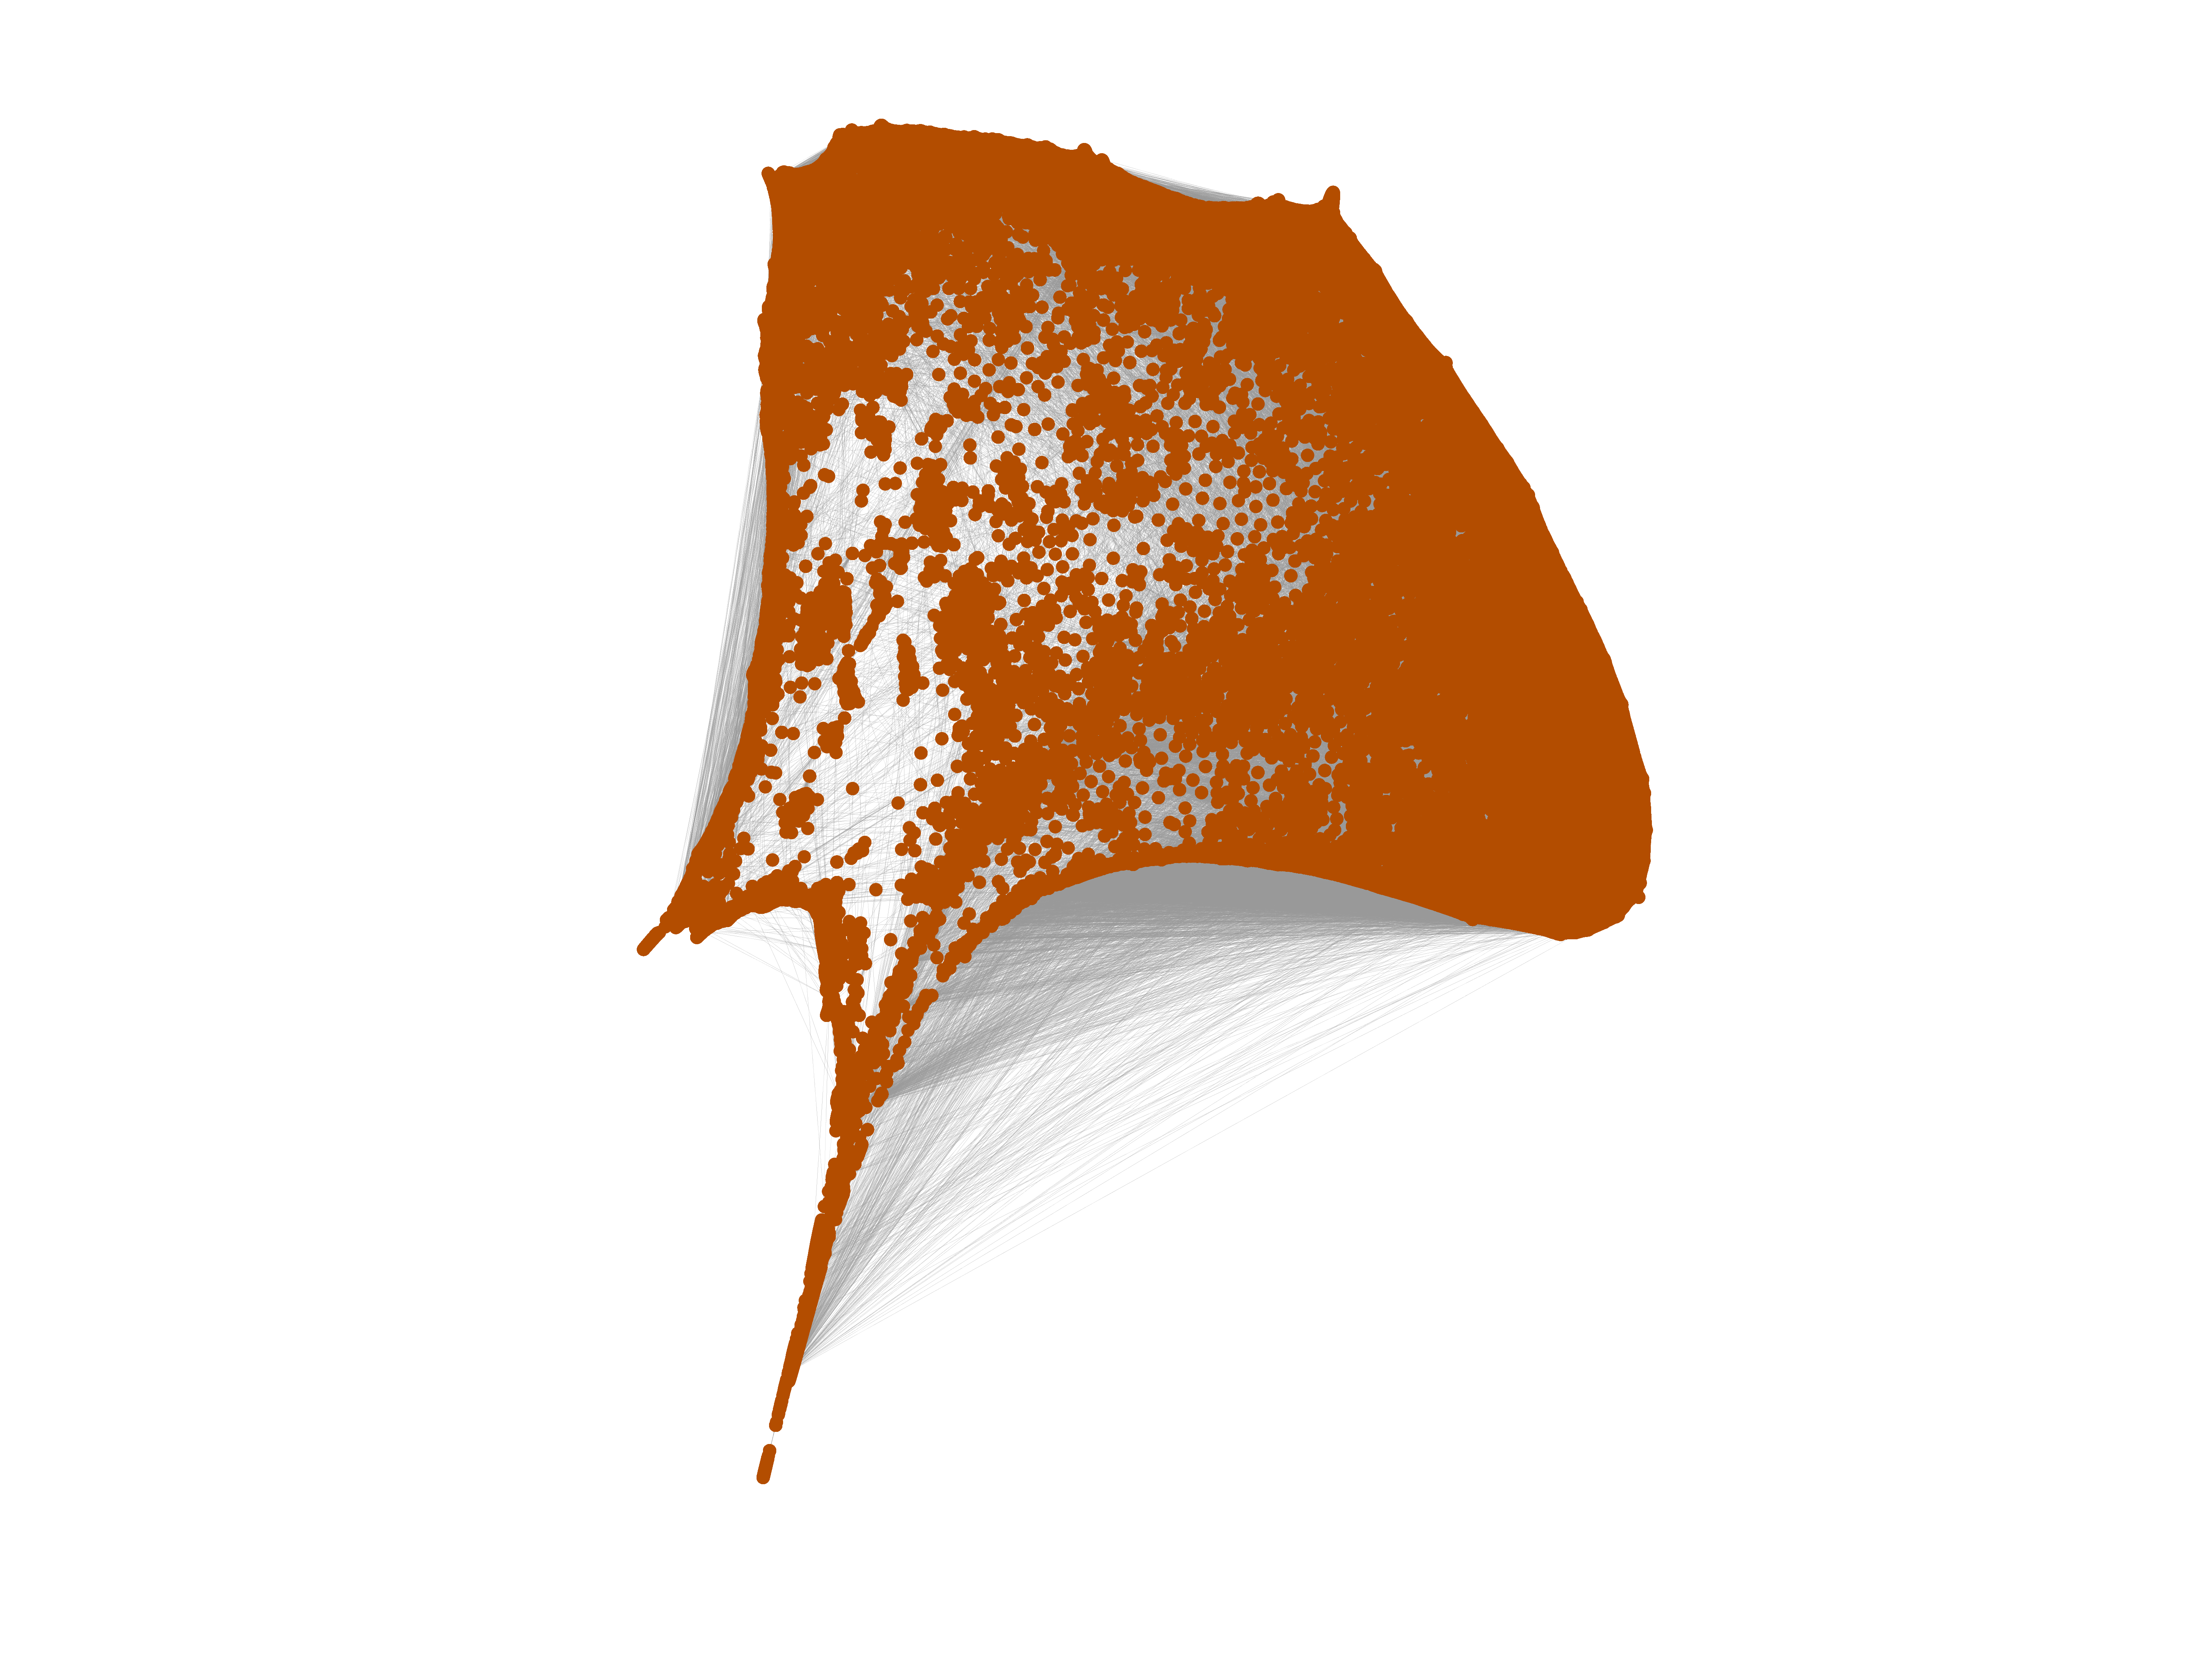
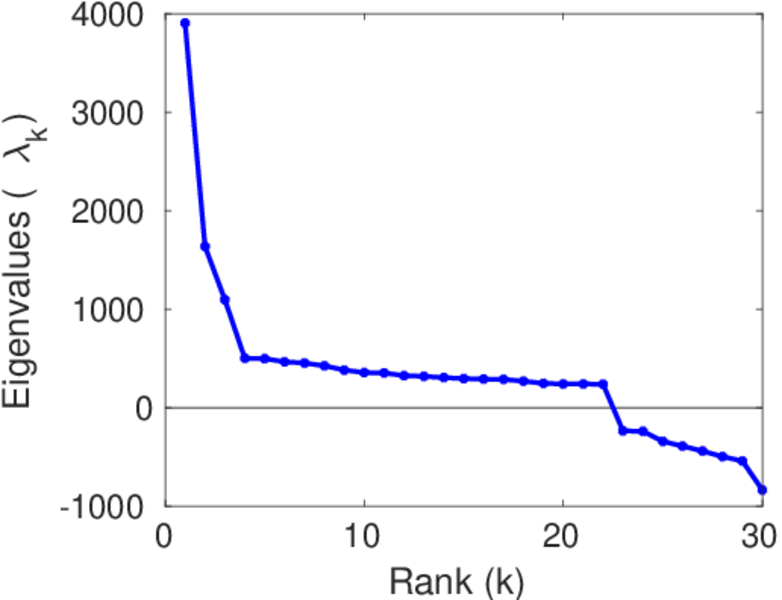
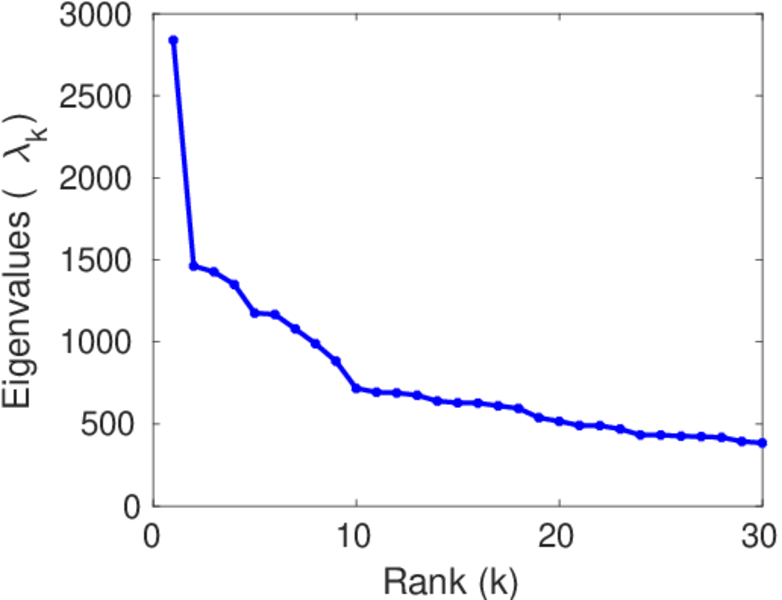
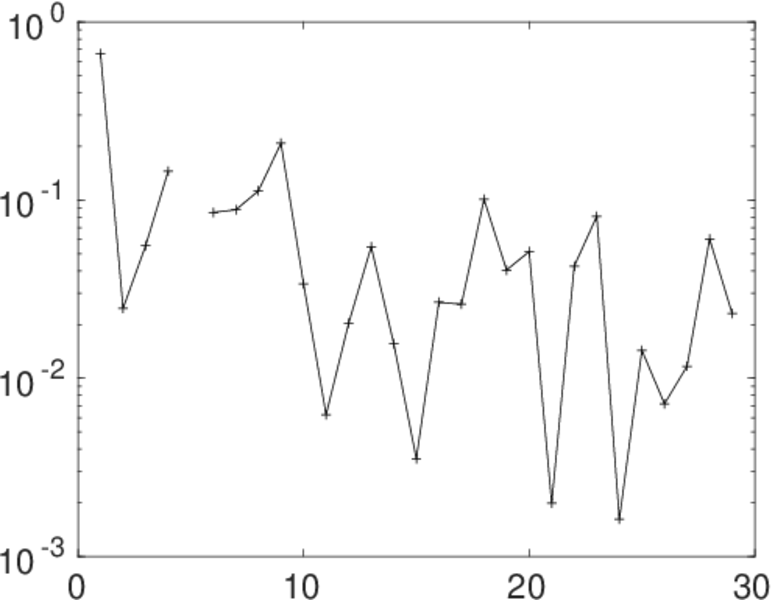
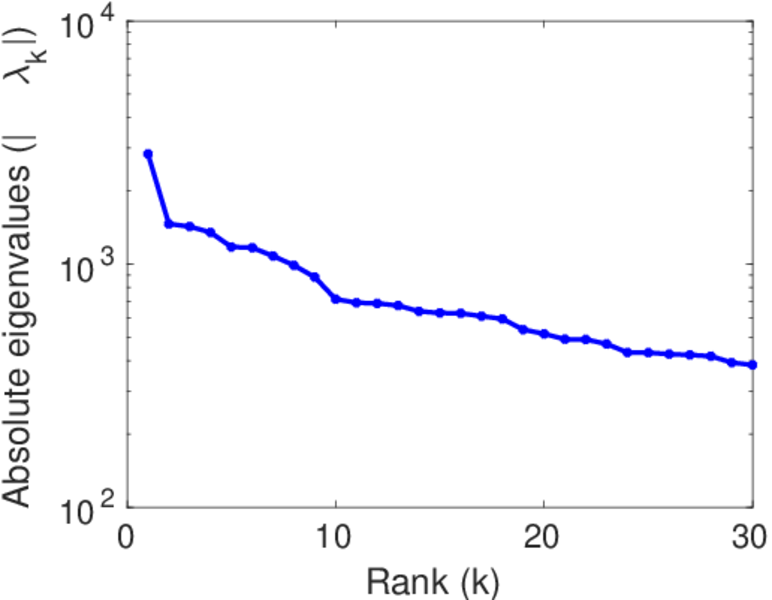
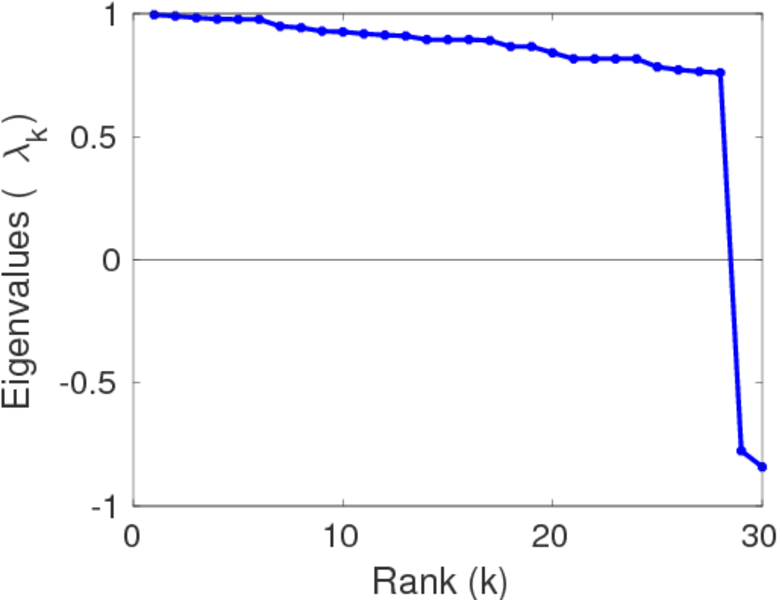
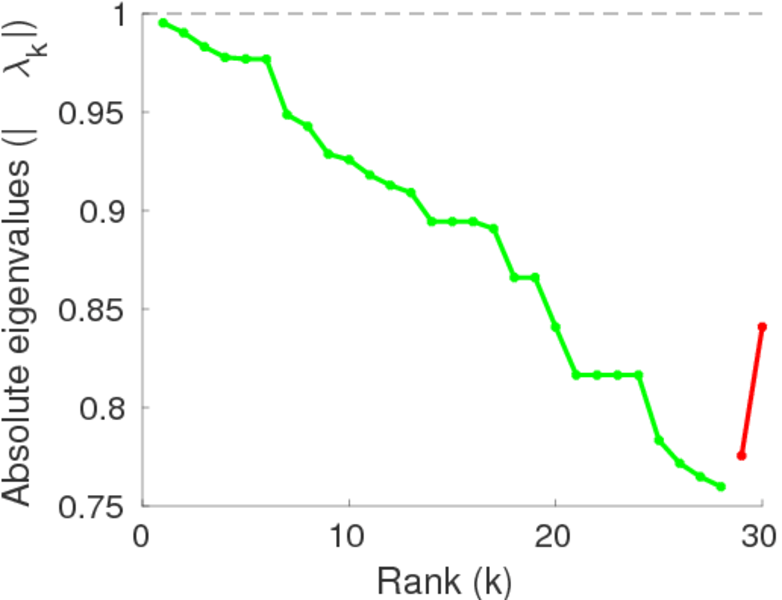
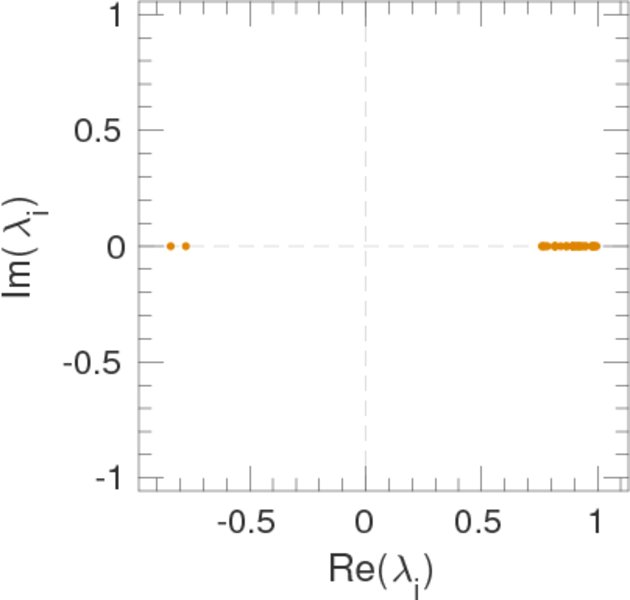
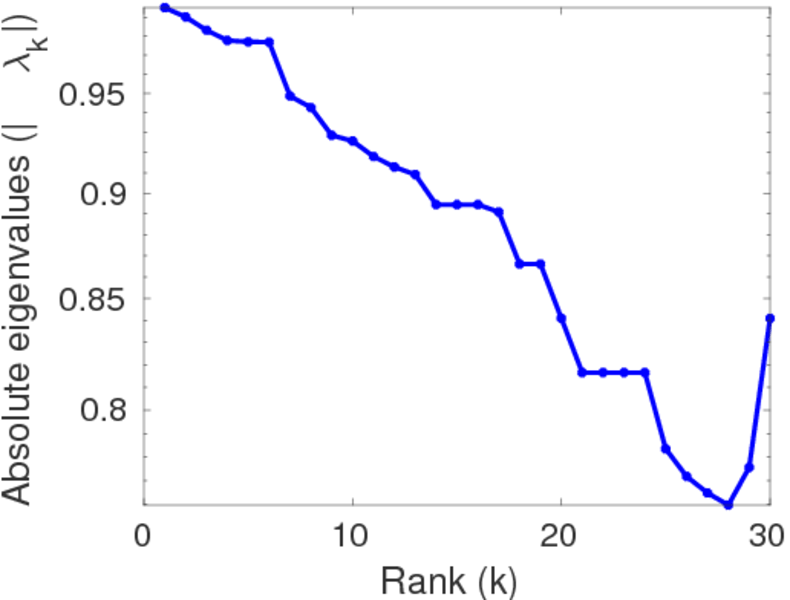
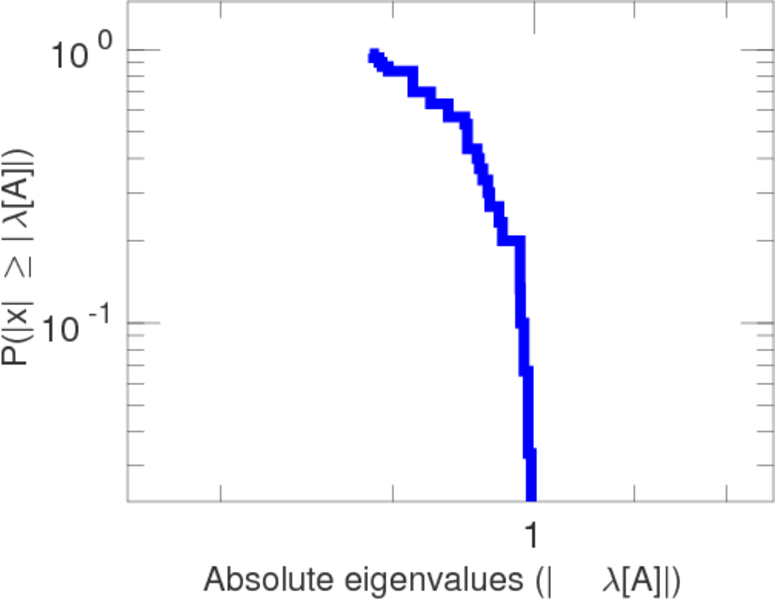
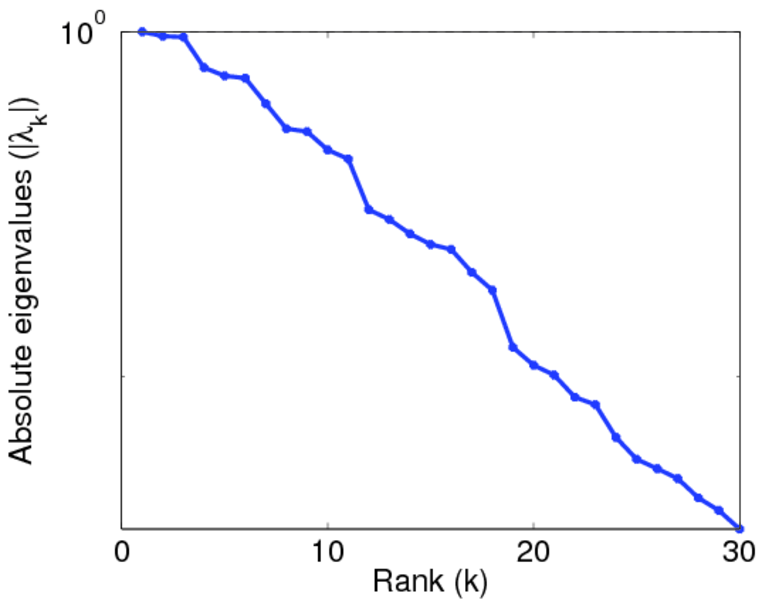
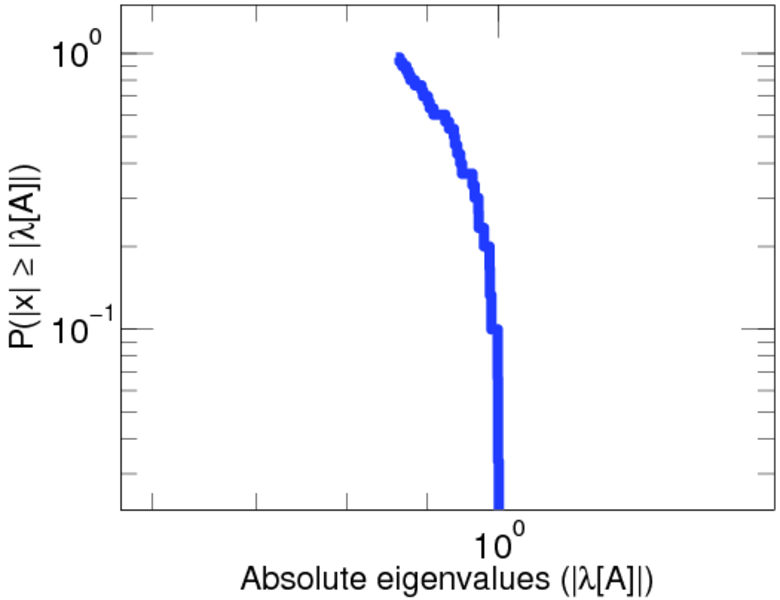
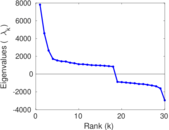
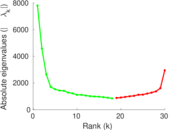
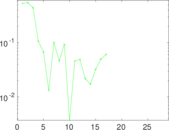
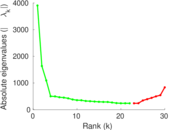
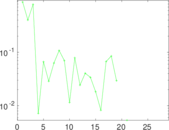
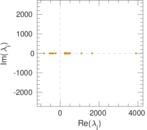
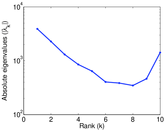
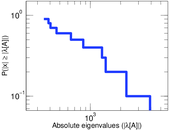
Matrix decompositions plots


Downloads
References
|
[1]
|
Jérôme Kunegis.
KONECT – The Koblenz Network Collection.
In Proc. Int. Conf. on World Wide Web Companion, pages
1343–1350, 2013.
[ http ]
|
|
[2]
|
Bryan Klimt and Yiming Yang.
The Enron corpus: A new dataset for email classification research.
In Proc. Eur. Conf. on Mach. Learn., pages 217–226, 2004.
|
 KONECT ‣ Networks ‣
Buy Me a Coffee
KONECT ‣ Networks ‣
Buy Me a Coffee