Enron (clean)
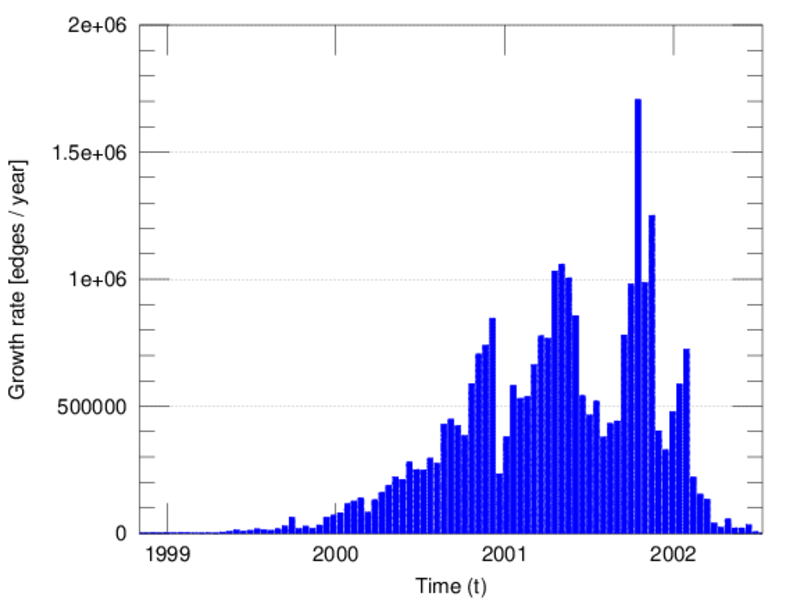
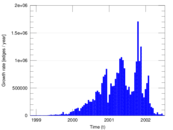
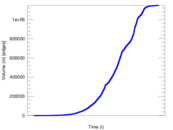
The Enron email network consists of 1,148,072 emails sent between employees of
Enron between 1999 and 2003. Nodes in the network are individual employees and
edges are individual emails. It is possible to send an email to oneself, and
thus this network contains loops. In this version of the network, nodes with
erroneous timestamps were removed.
Metadata
Statistics
| Size | n = | 87,273
|
| Volume | m = | 1,147,126
|
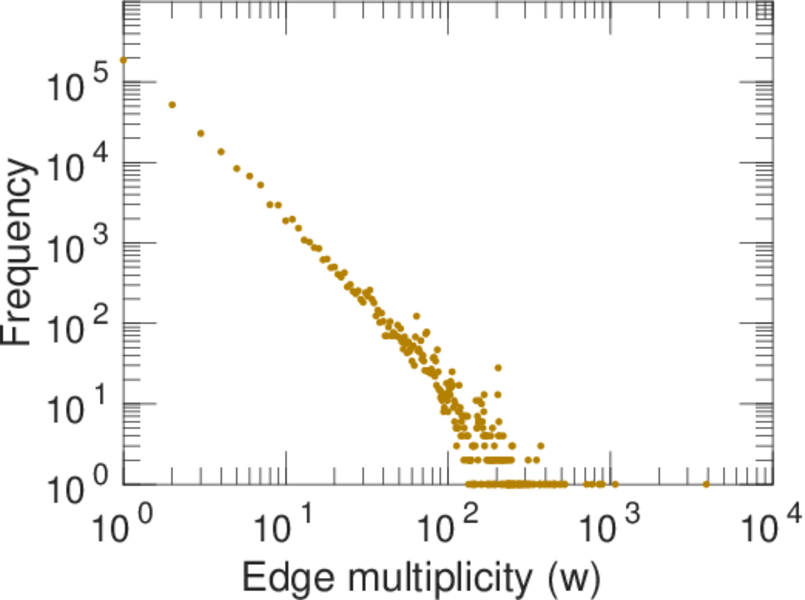
| Unique edge count | m̿ = | 321,288
|
| Loop count | l = | 13,080
|
| Wedge count | s = | 49,130,407
|
| Claw count | z = | 13,799,850,890
|
| Triangle count | t = | 1,178,289
|
| Square count | q = | 92,655,137
|
| 4-Tour count | T4 = | 938,356,410
|
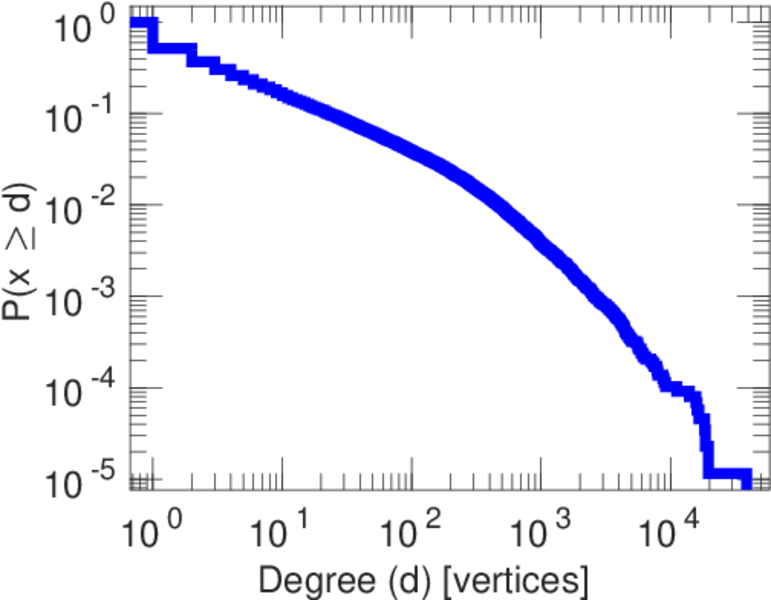
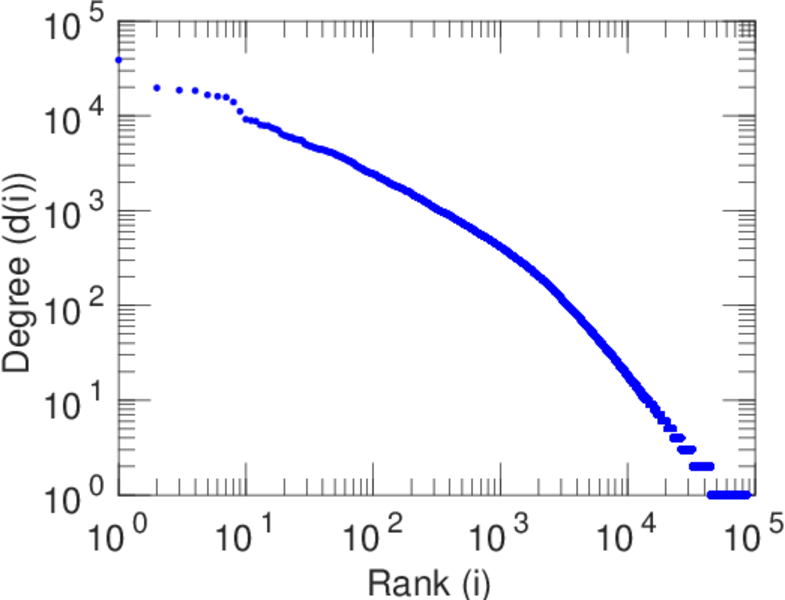
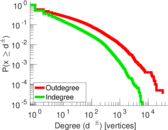
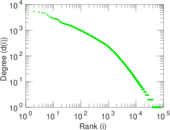
| Maximum degree | dmax = | 38,778
|
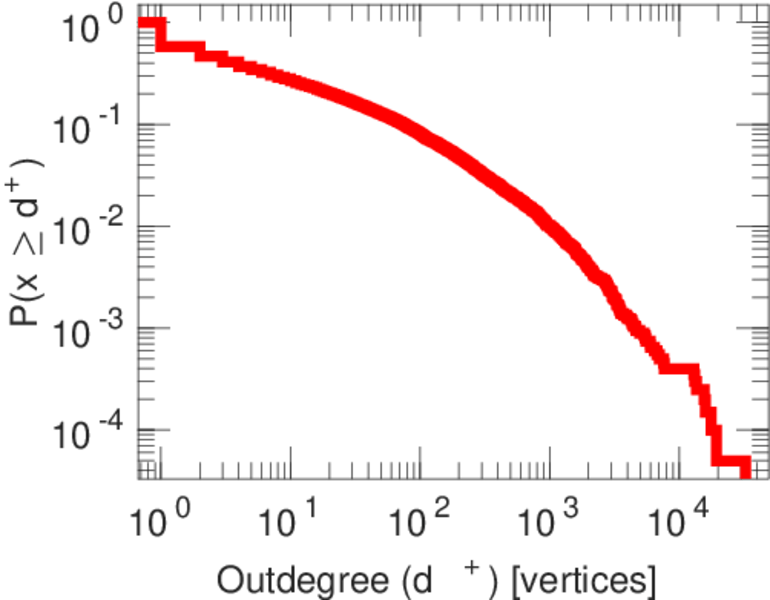
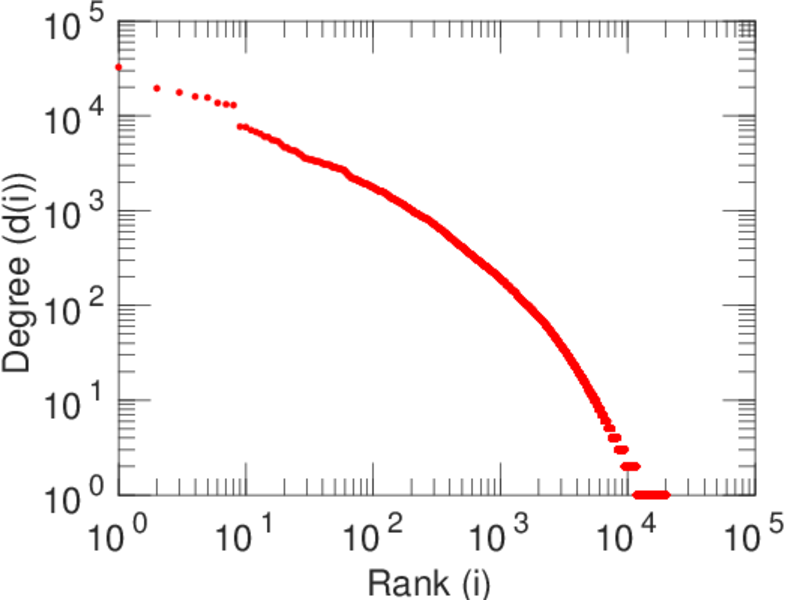
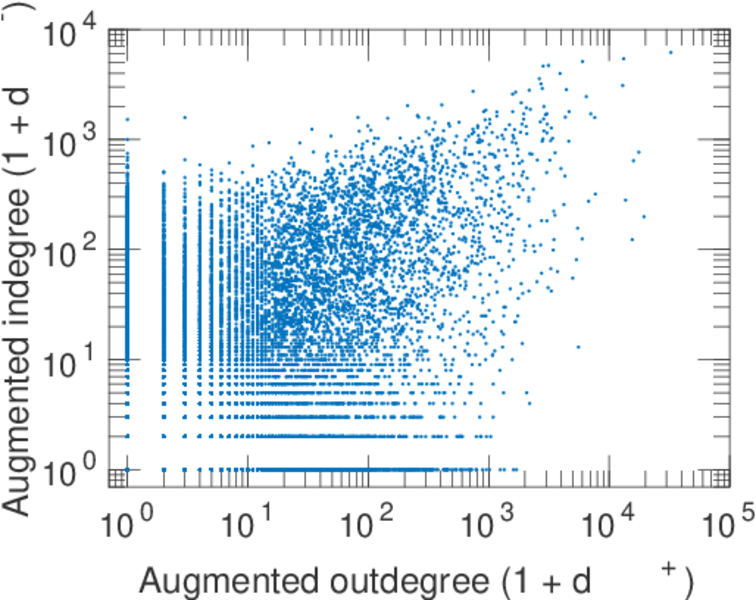
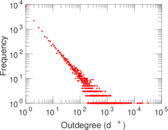
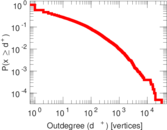
| Maximum outdegree | d+max = | 32,613
|
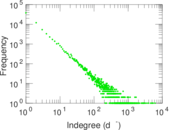
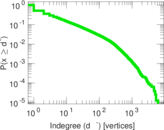
| Maximum indegree | d−max = | 6,165
|
| Average degree | d = | 26.288 2
|
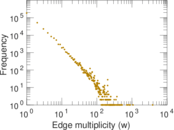
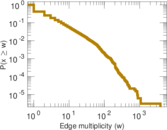
| Average edge multiplicity | m̃ = | 3.570 40
|
| Size of LCC | N = | 84,220
|
| Size of LSCC | Ns = | 9,160
|
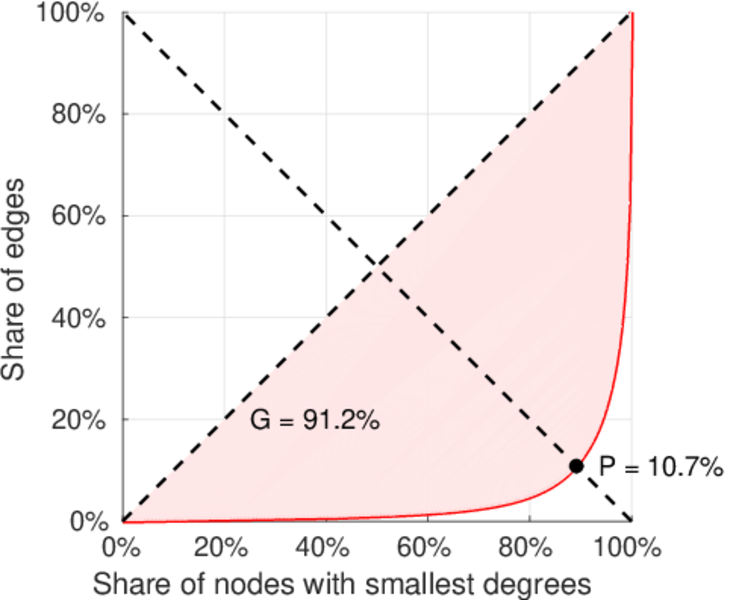
| Relative size of LSCC | Nrs = | 0.104 958
|
| Diameter | δ = | 14
|
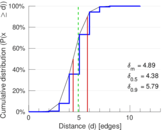
| 50-Percentile effective diameter | δ0.5 = | 4.383 96
|
| 90-Percentile effective diameter | δ0.9 = | 5.794 71
|
| Median distance | δM = | 5
|
| Mean distance | δm = | 4.890 80
|
| Relative edge distribution entropy | Her = | 0.827 659
|
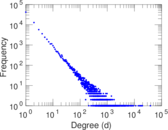
| Power law exponent | γ = | 2.650 47
|
| Tail power law exponent | γt = | 1.761 00
|
| Tail power law exponent with p | γ3 = | 1.761 00
|
| p-value | p = | 0.000 00
|
| Outdegree tail power law exponent with p | γ3,o = | 2.301 00
|
| Outdegree p-value | po = | 0.000 00
|
| Indegree tail power law exponent with p | γ3,i = | 2.871 00
|
| Indegree p-value | pi = | 0.400 000
|
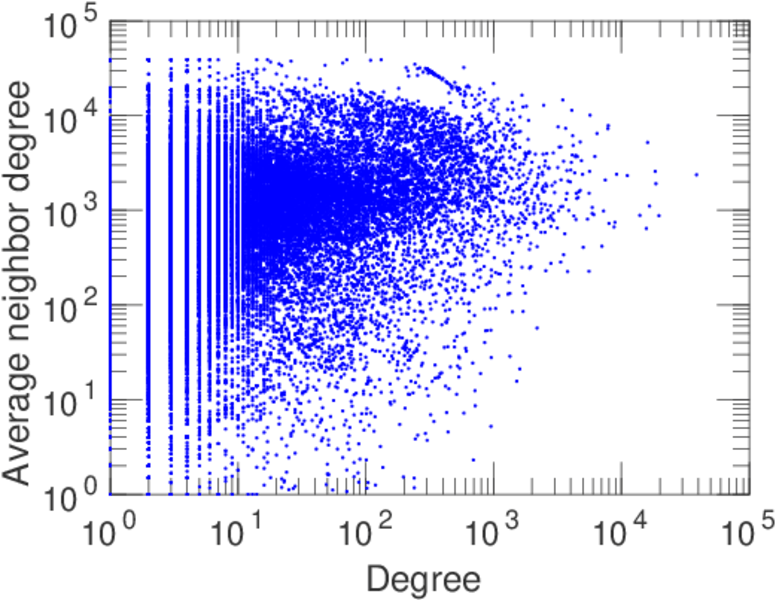
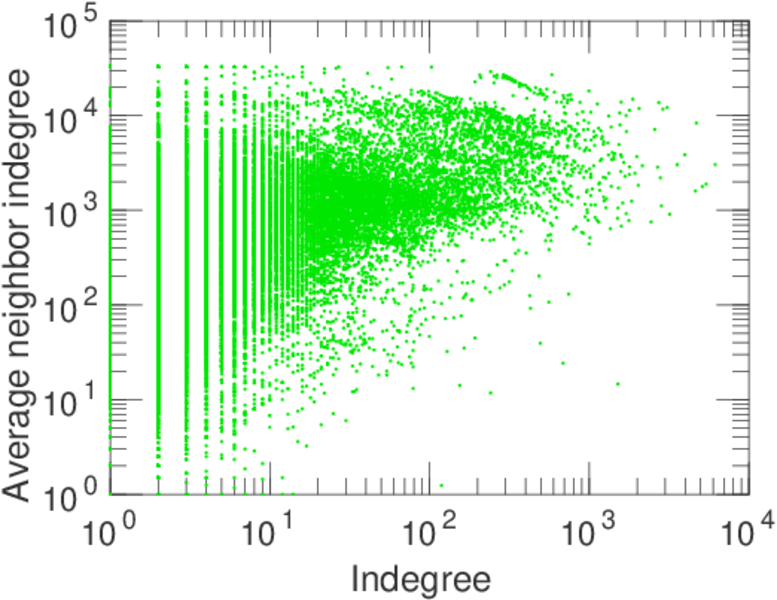
| Degree assortativity | ρ = | −0.166 816
|
| Degree assortativity p-value | pρ = | 0.000 00
|
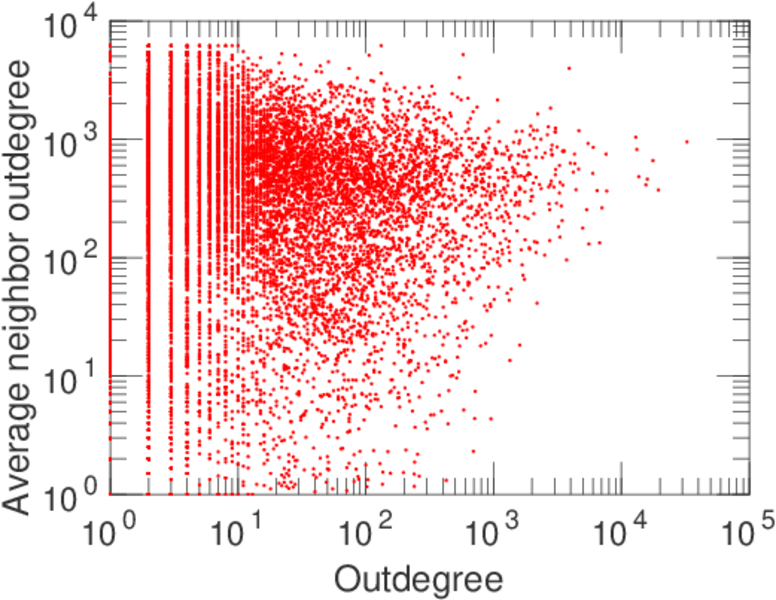
| In/outdegree correlation | ρ± = | +0.403 460
|
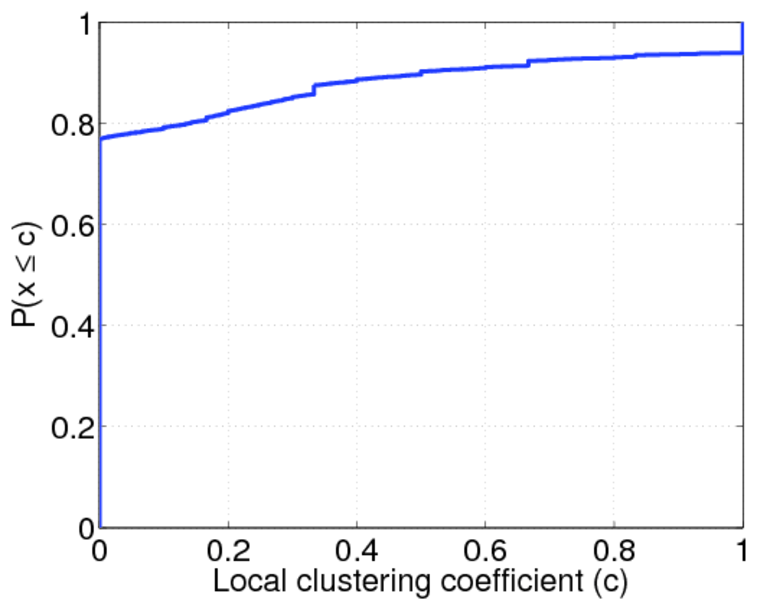
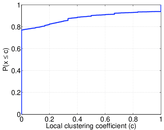
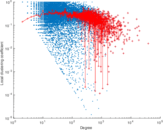
| Clustering coefficient | c = | 0.071 948 7
|
| Directed clustering coefficient | c± = | 0.111 155
|
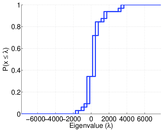
| Spectral norm | α = | 7,808.15
|
| Operator 2-norm | ν = | 3,904.14
|
| Cyclic eigenvalue | π = | 3,904.00
|
| Algebraic connectivity | a = | 0.004 229 27
|
| Spectral separation | |λ1[A] / λ2[A]| = | 1.702 98
|
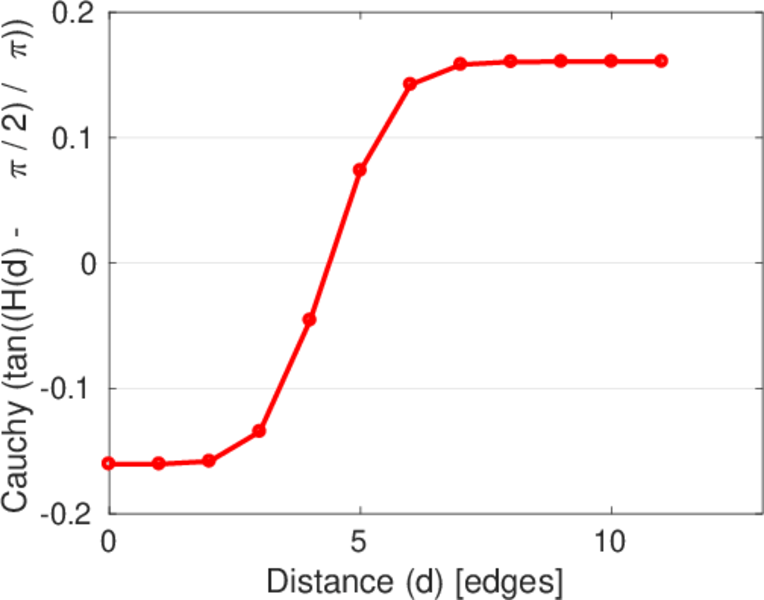
| Reciprocity | y = | 0.146 678
|
| Non-bipartivity | bA = | 0.622 351
|
| Controllability | C = | 77,426
|
| Relative controllability | Cr = | 0.888 922
|
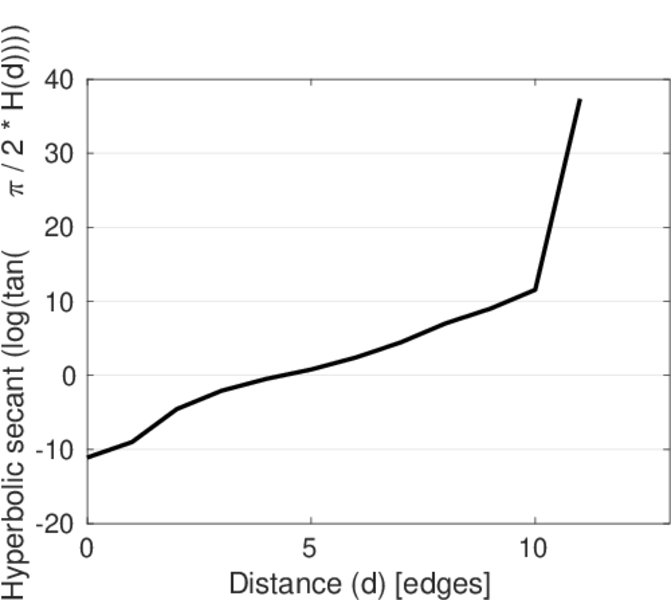
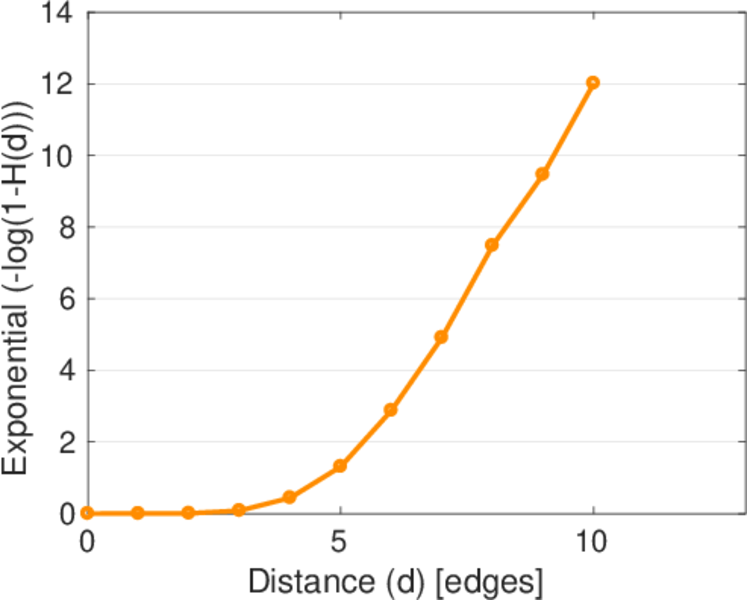
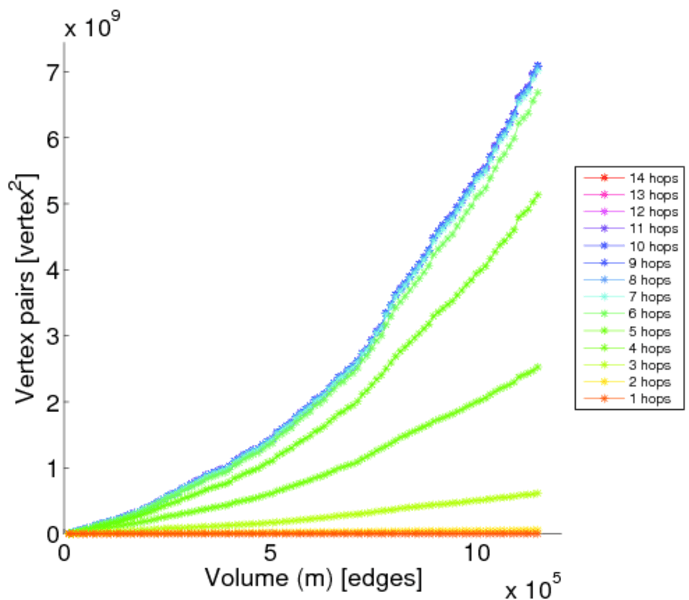
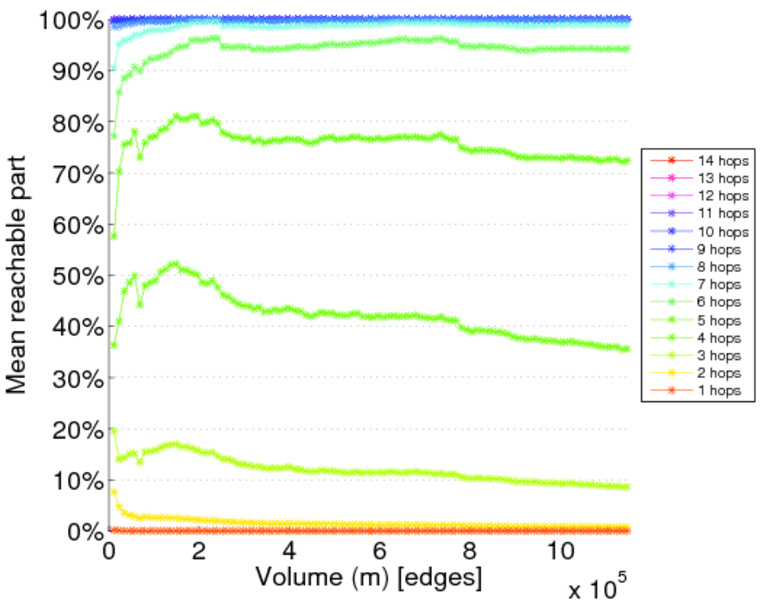
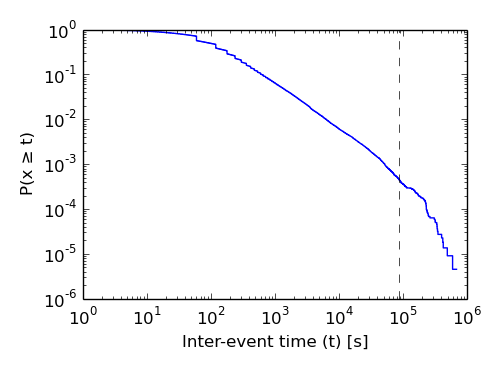
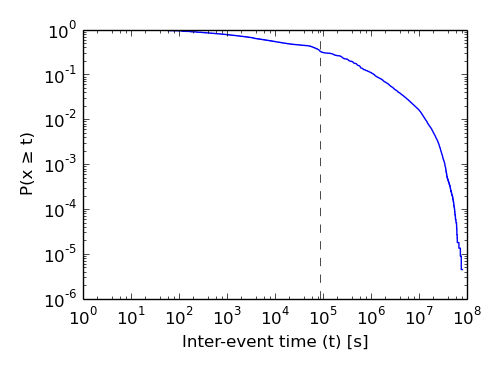
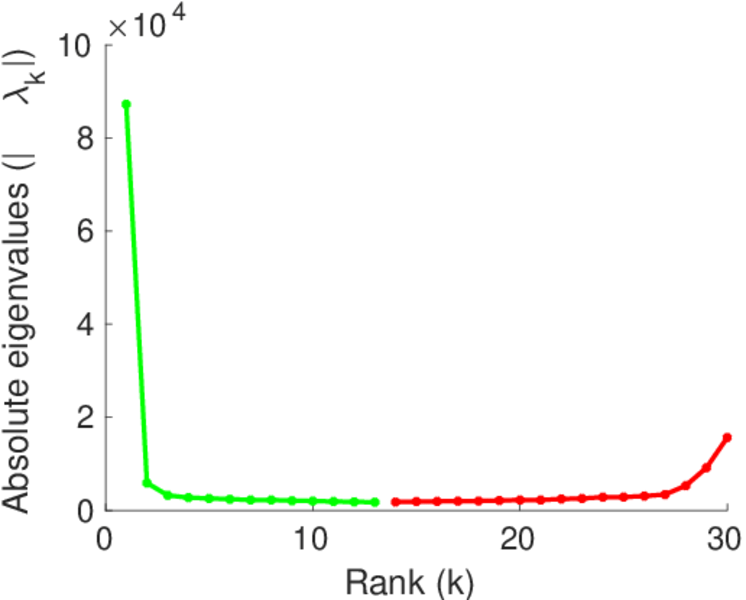
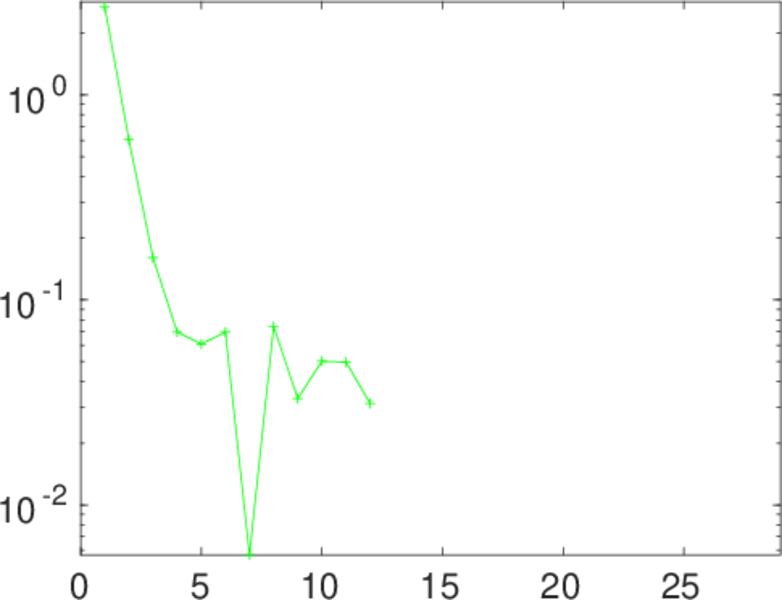
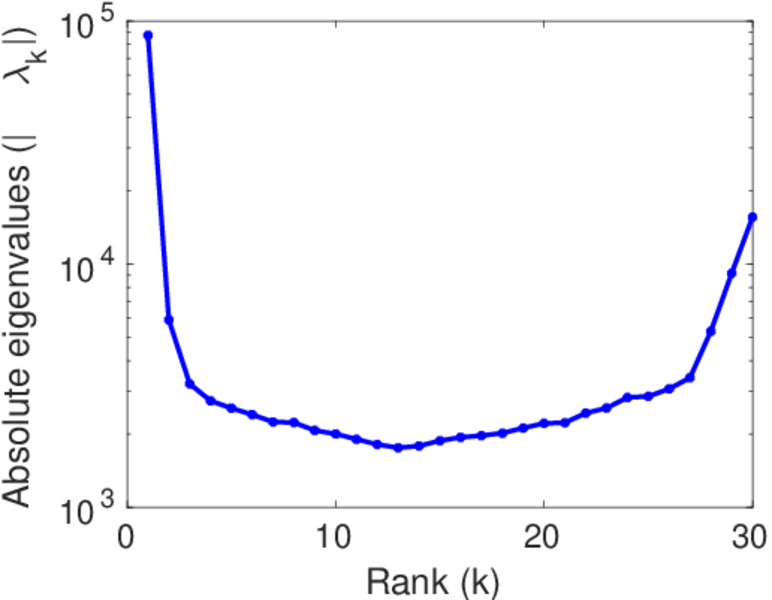
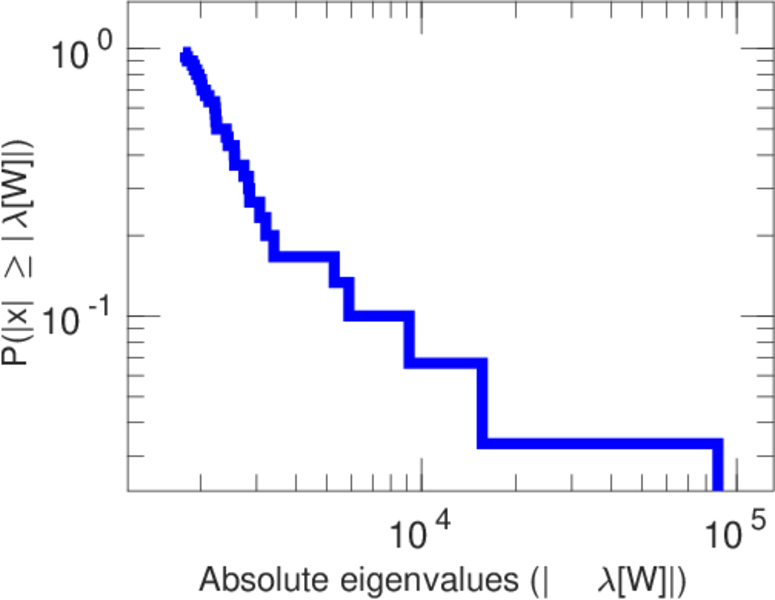
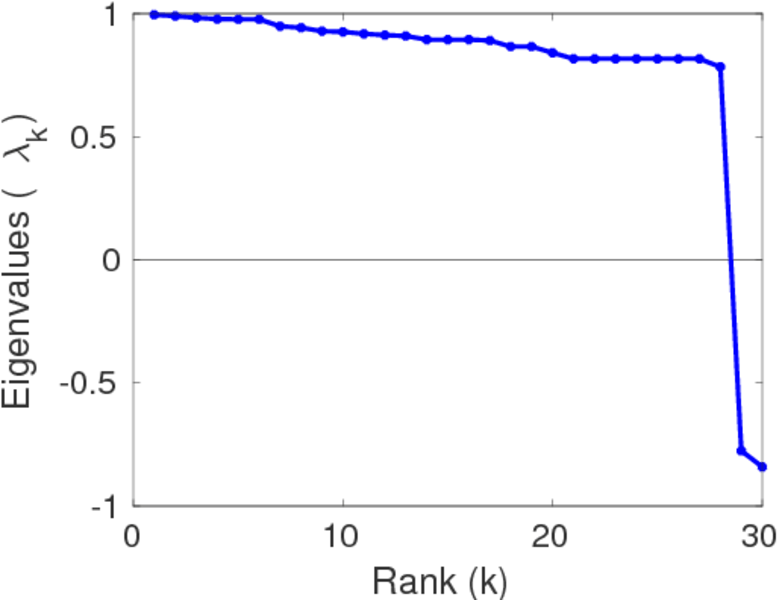
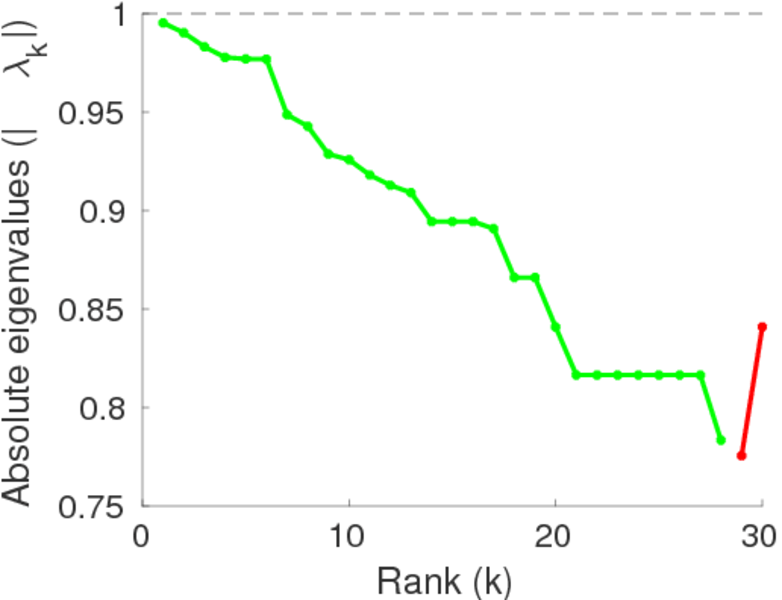
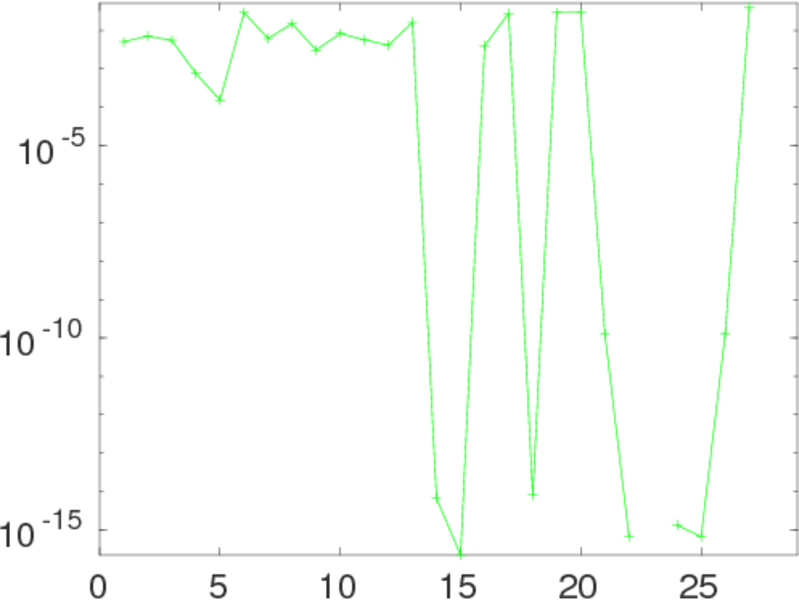
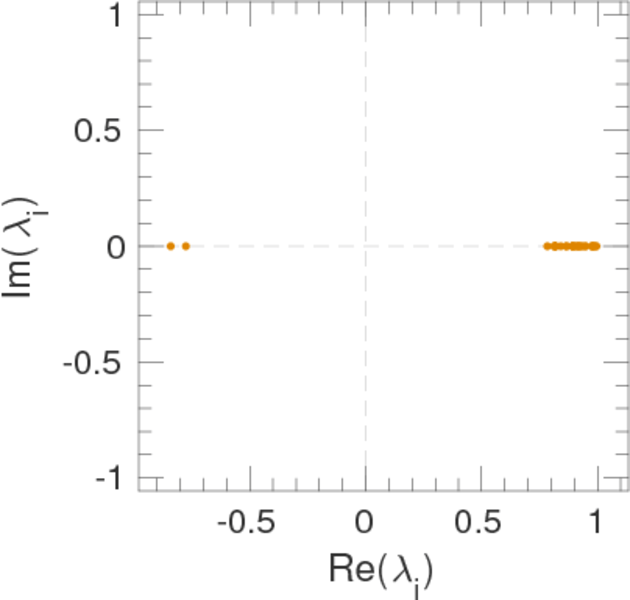
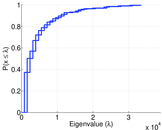
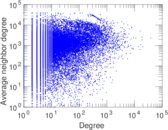
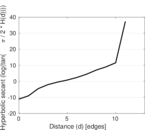
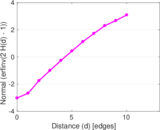
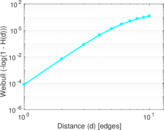
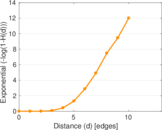
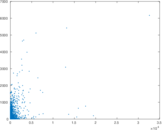
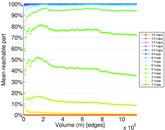
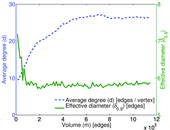
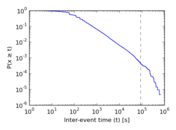
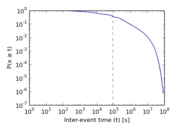
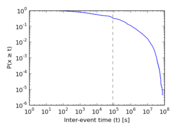
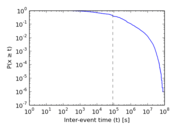
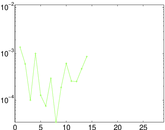
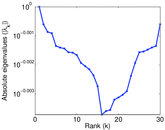
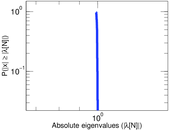
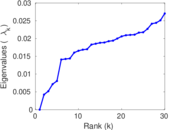
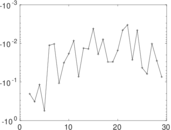
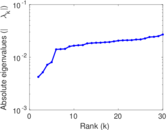
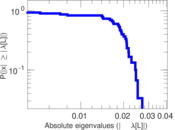
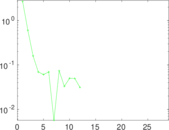
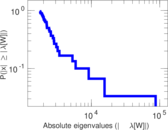
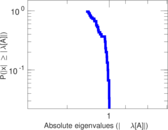
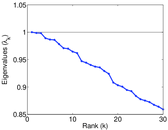
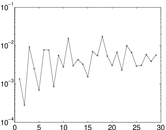
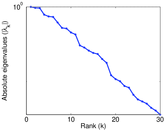
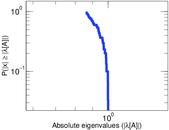
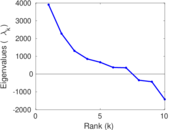
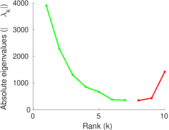
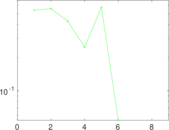
Plots


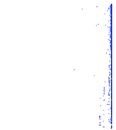

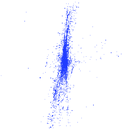


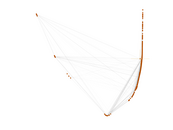
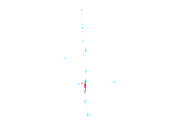


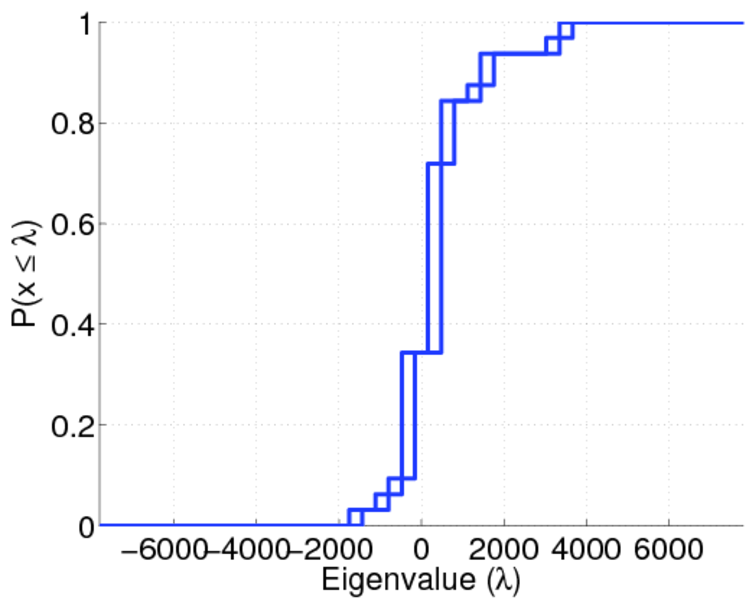
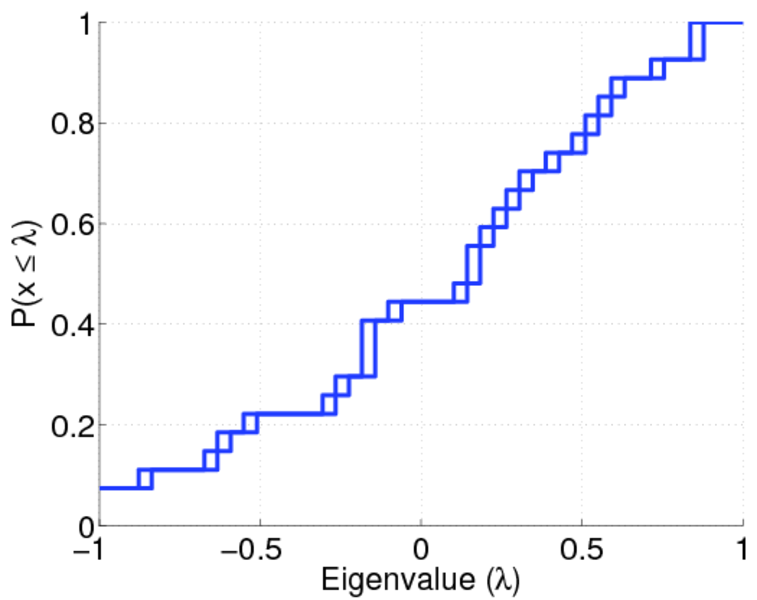
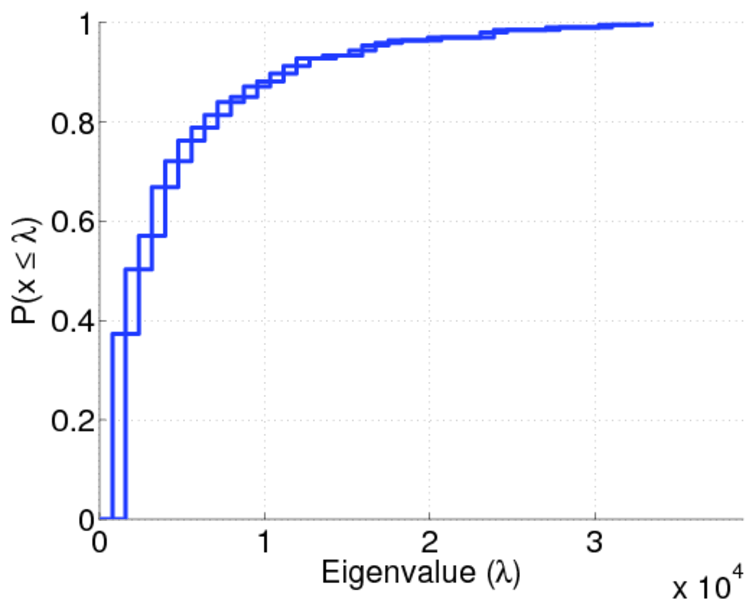
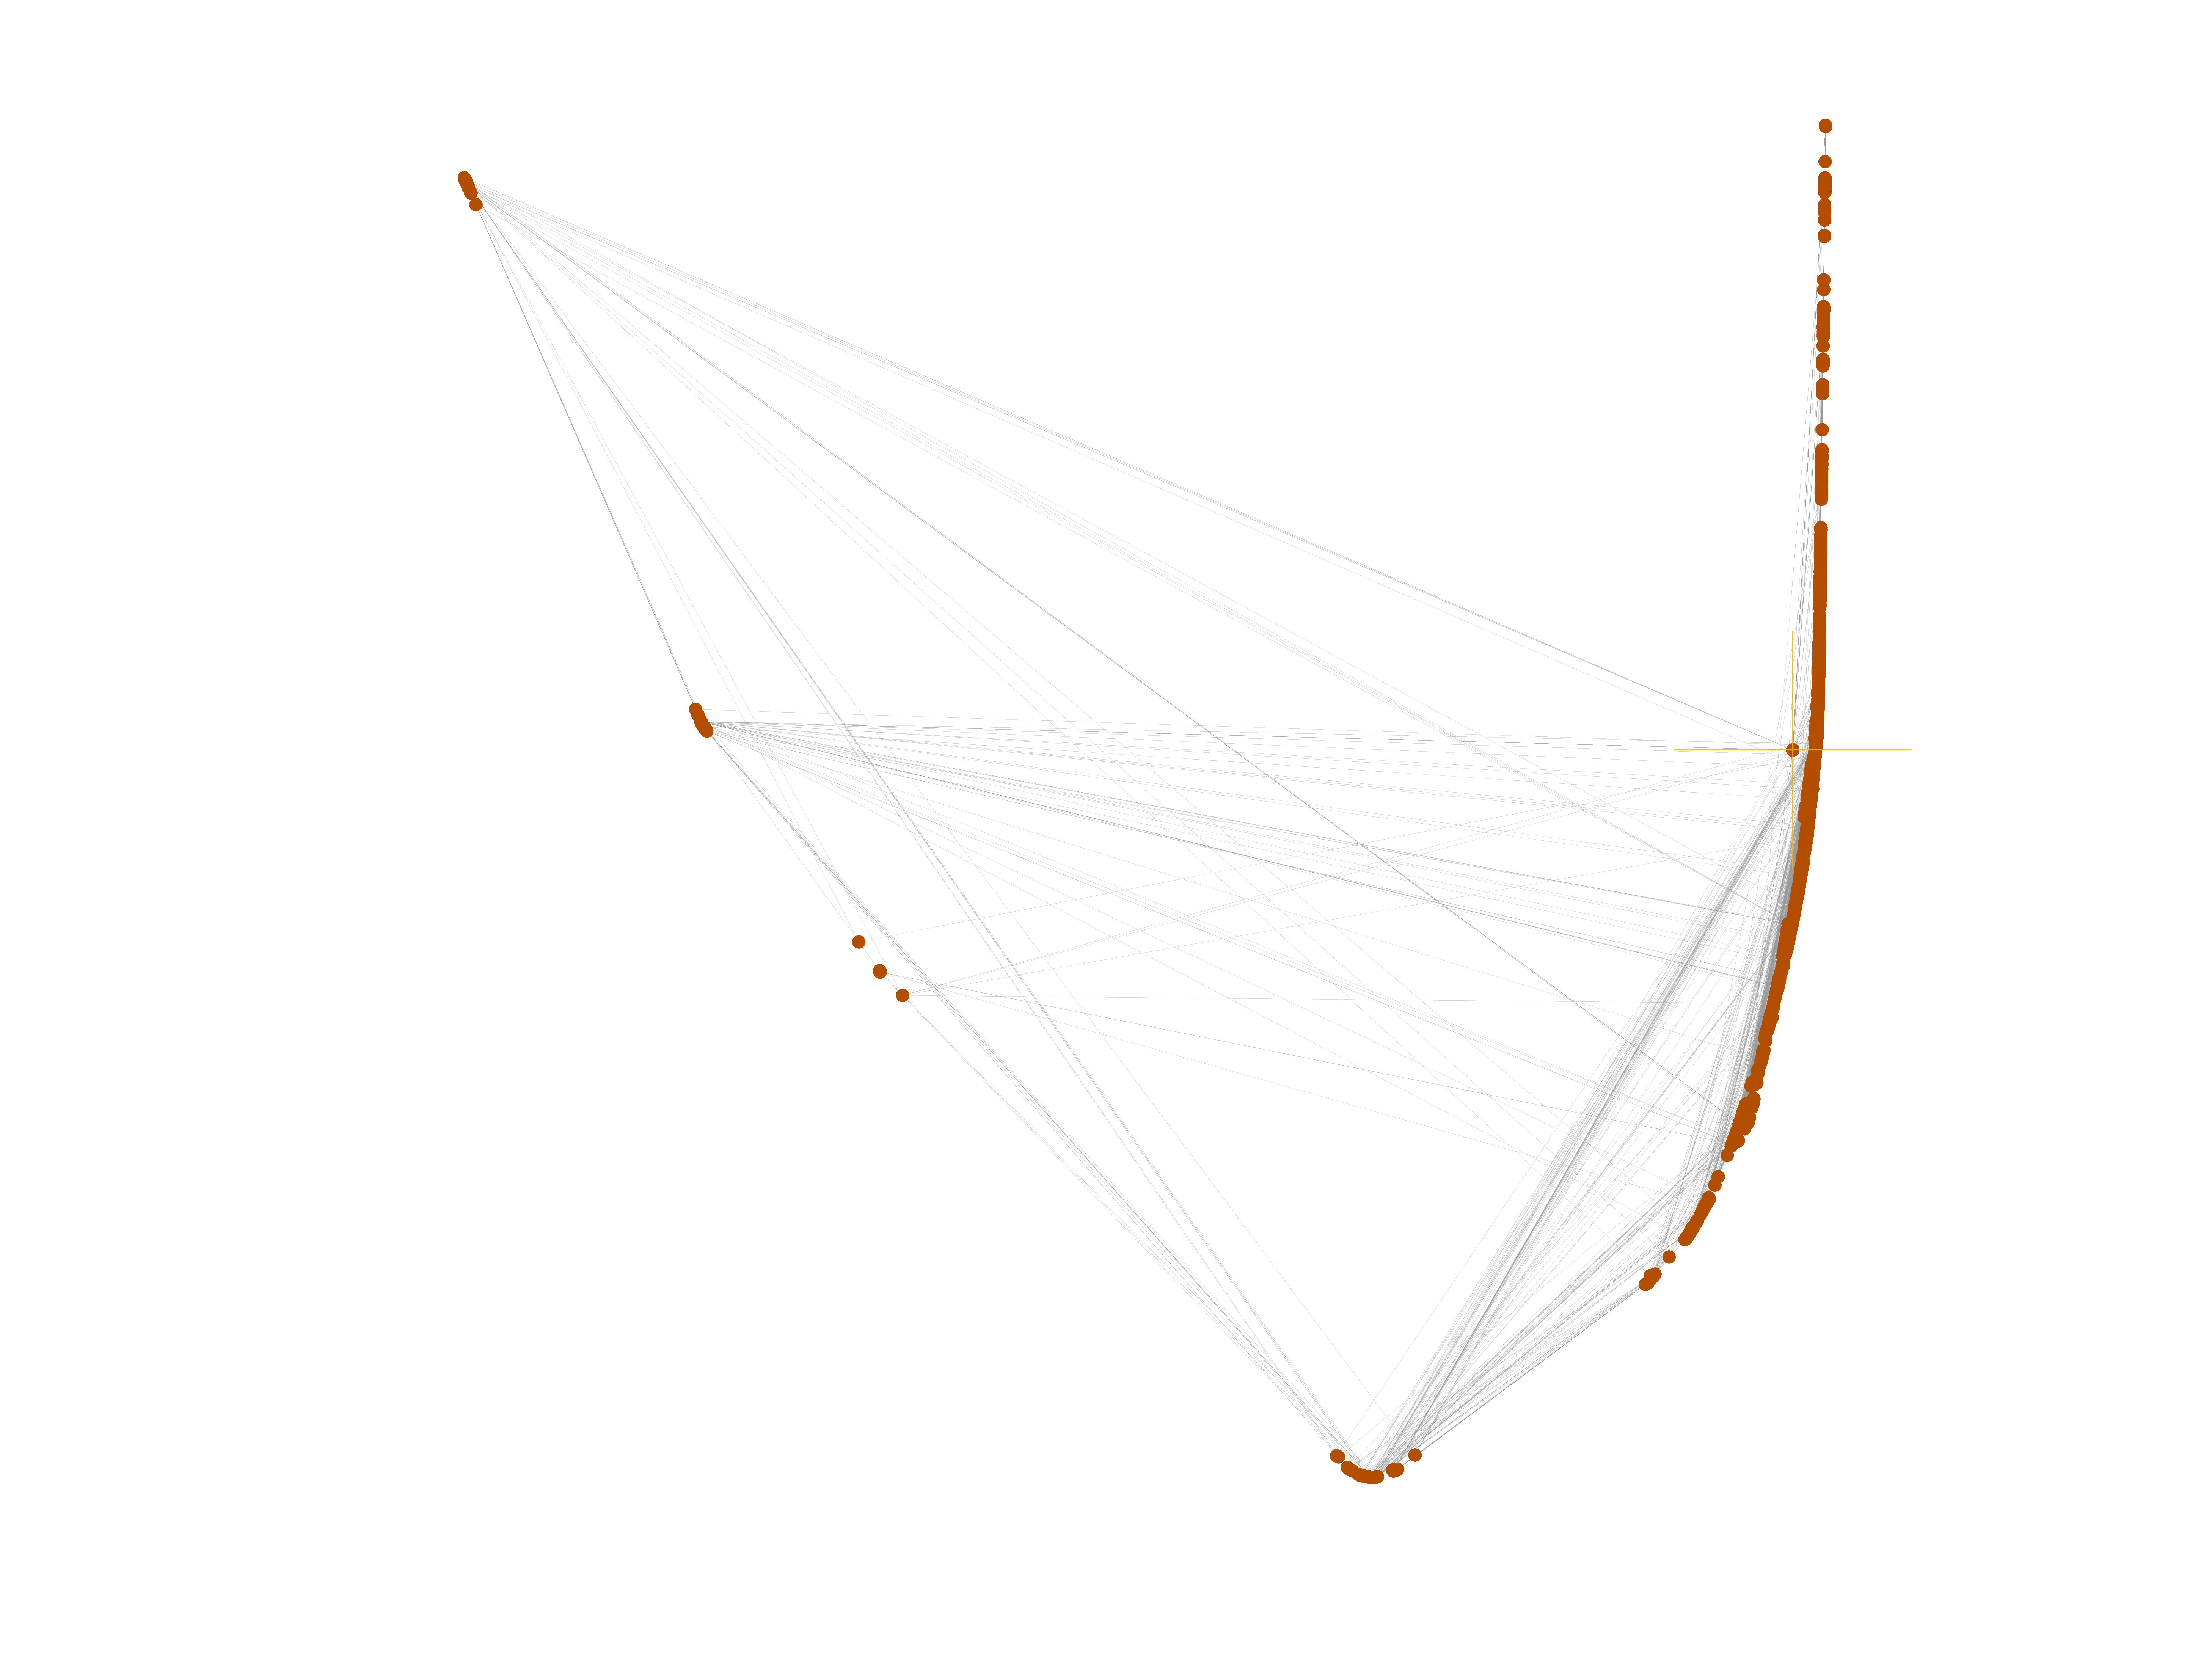
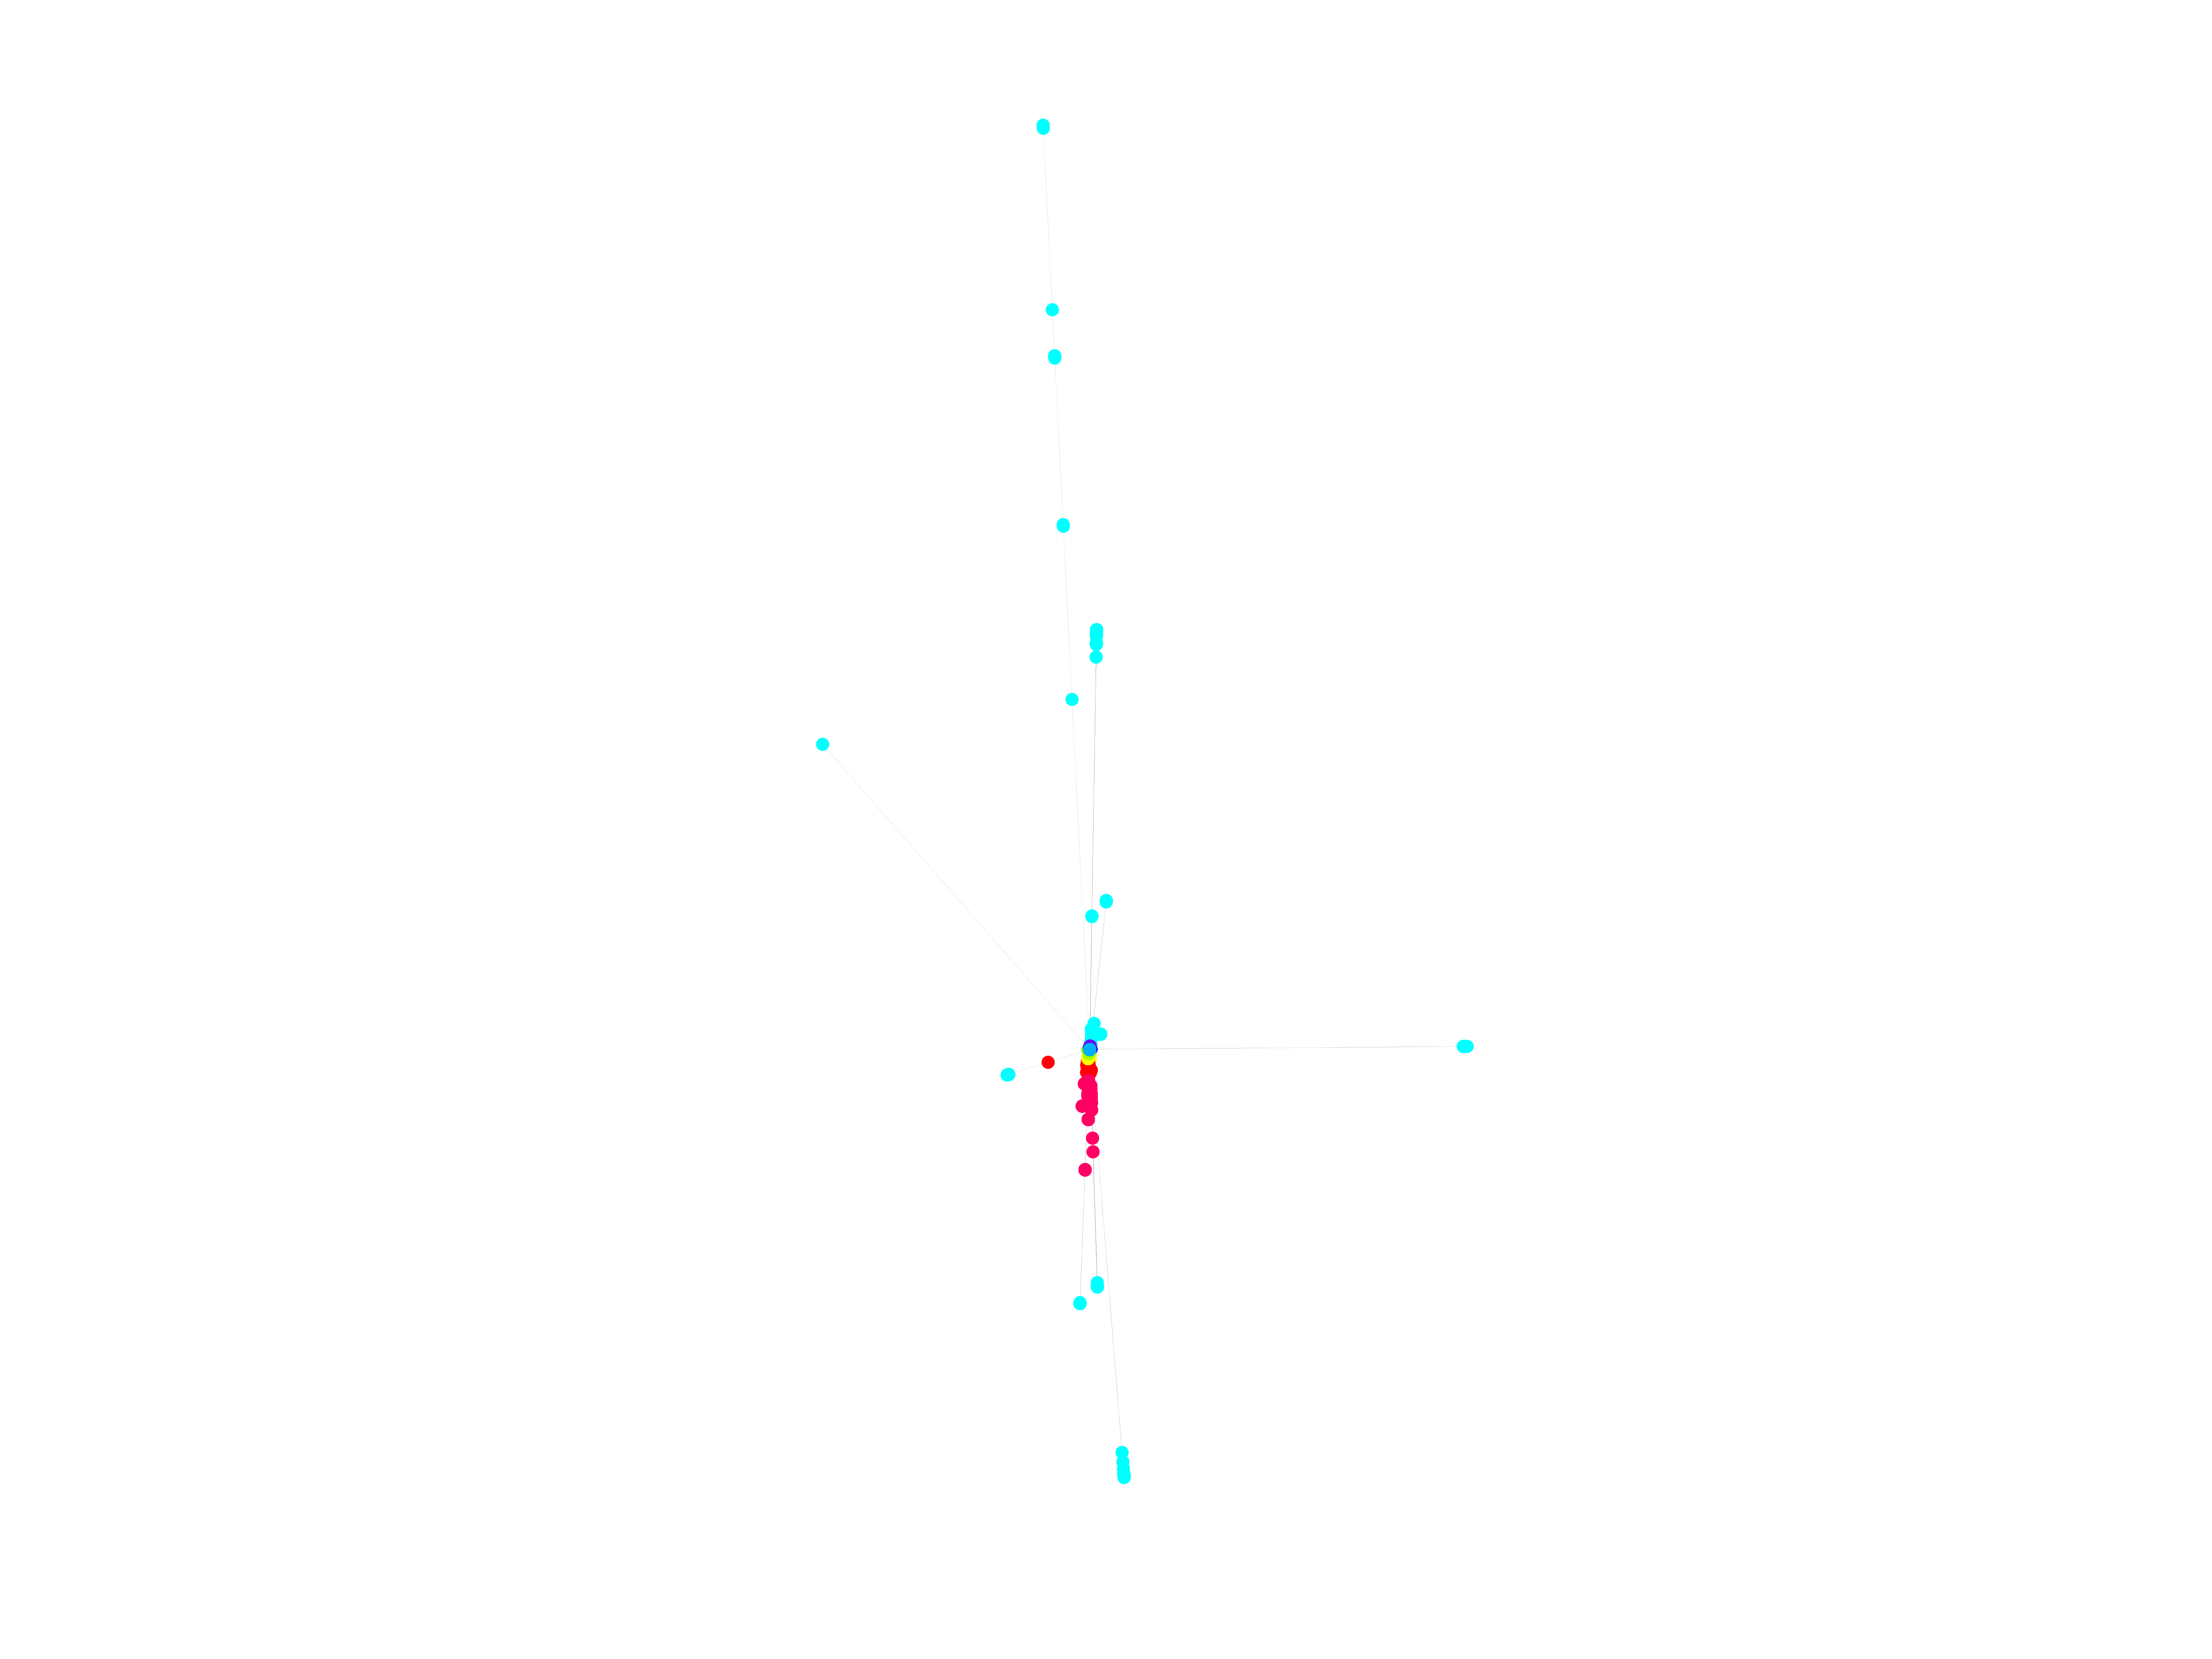
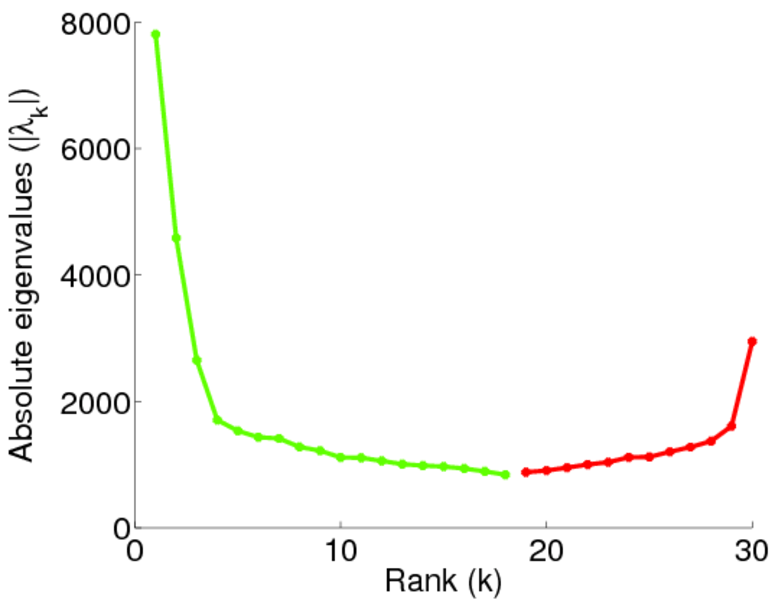
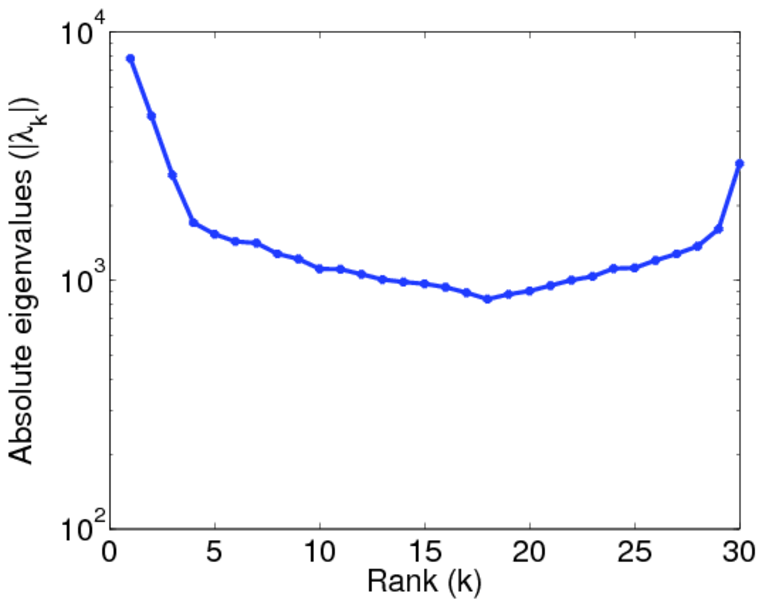
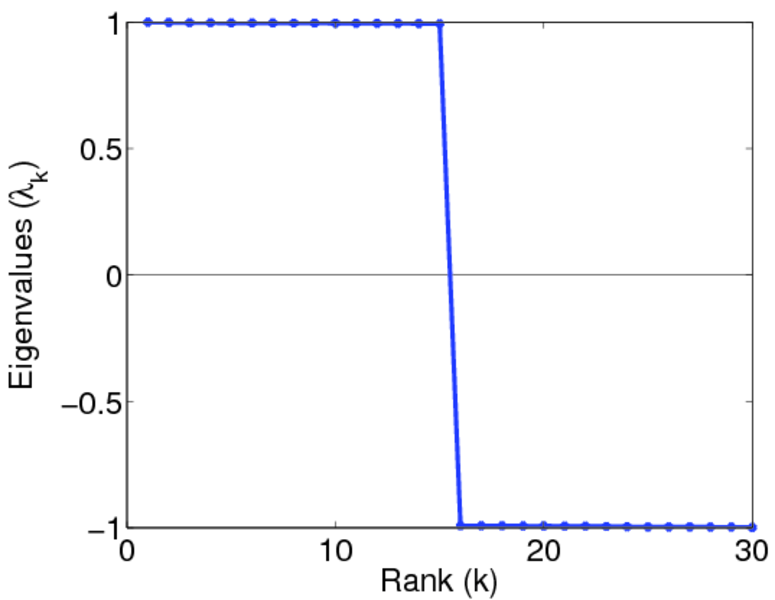
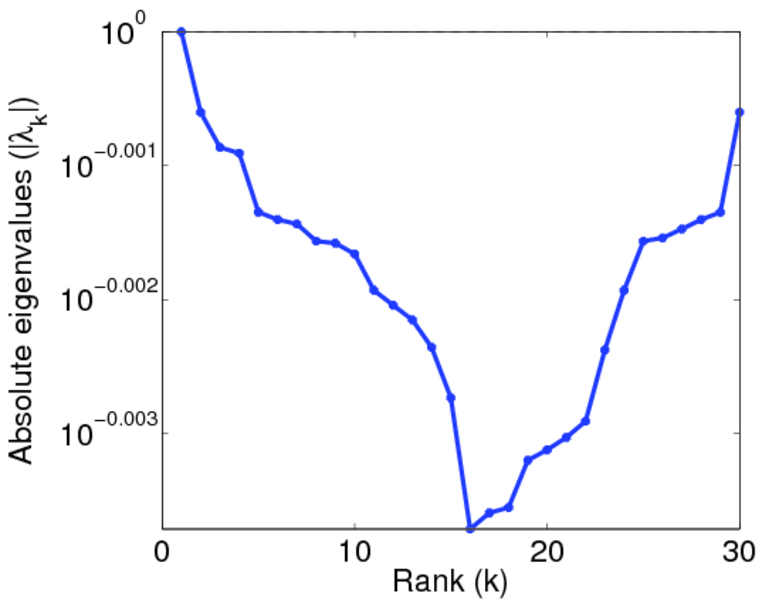
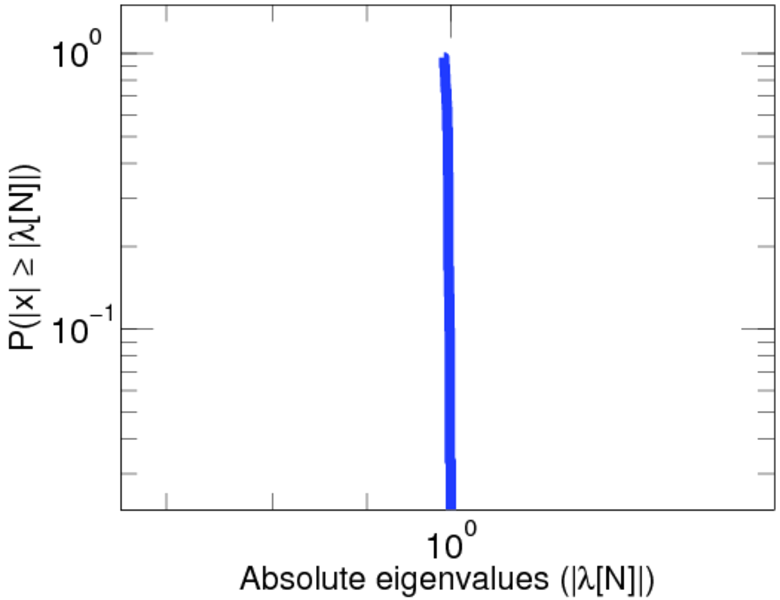
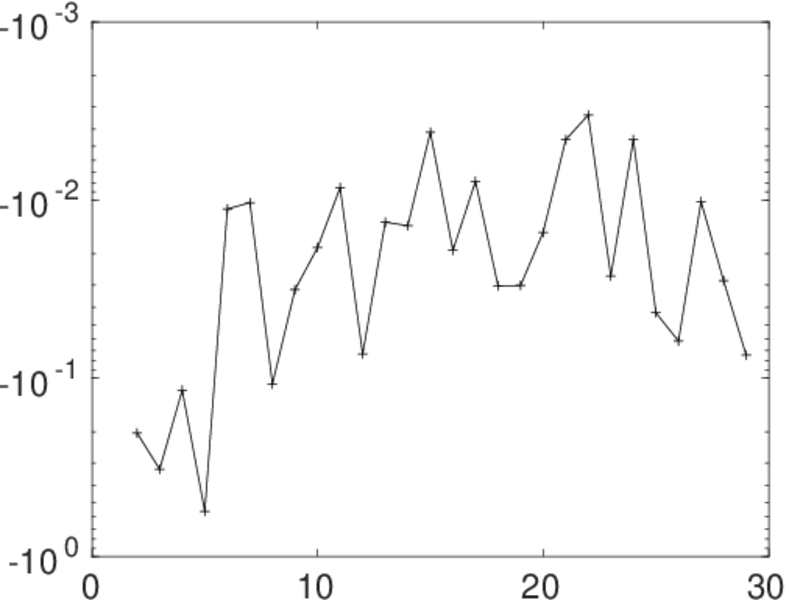
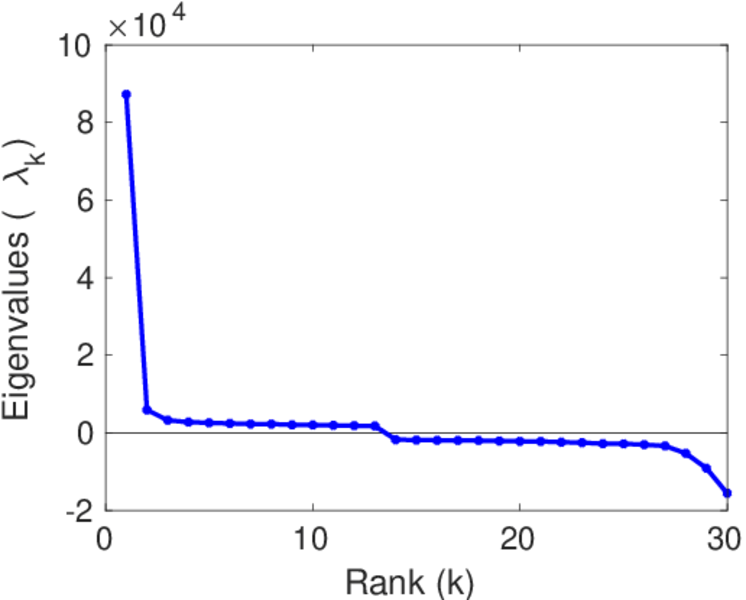
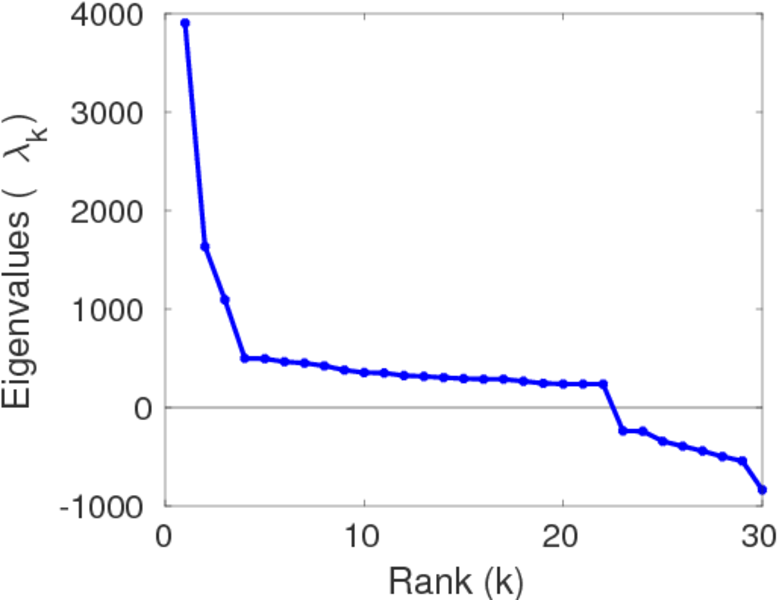
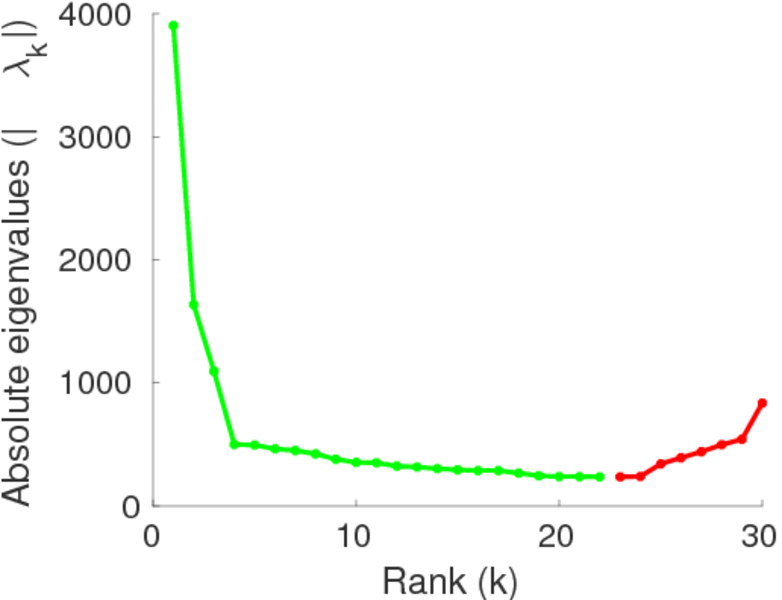
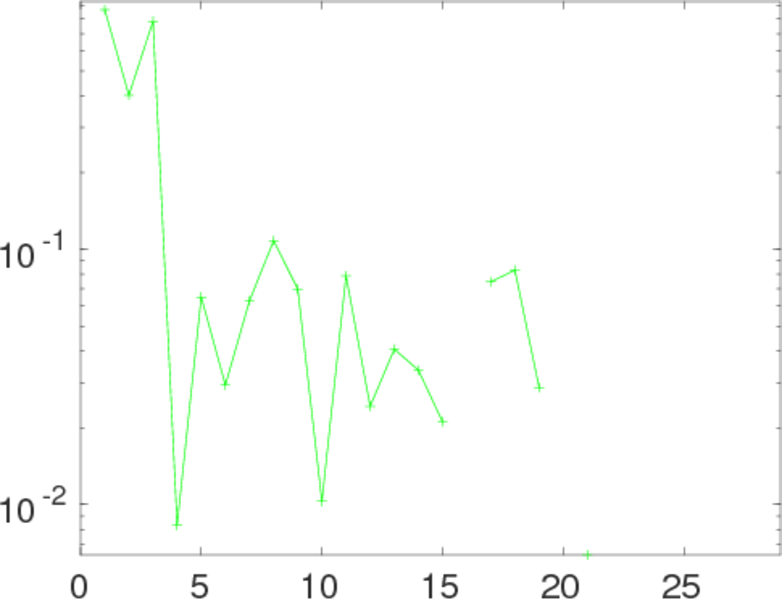
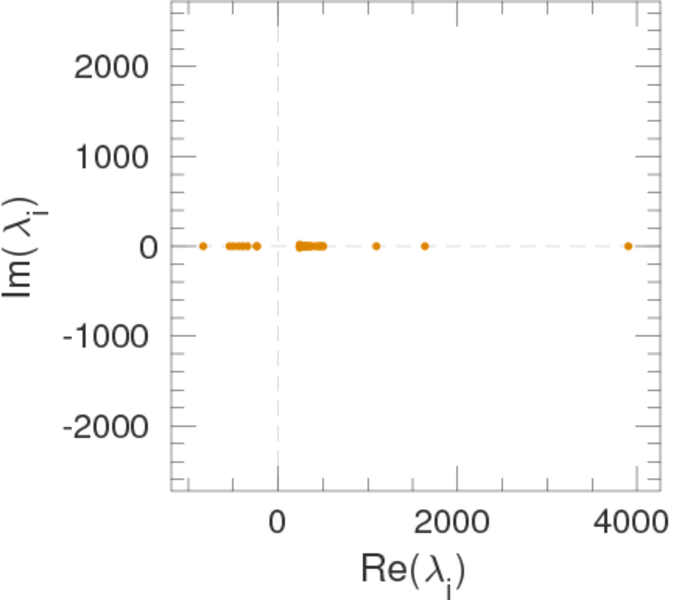
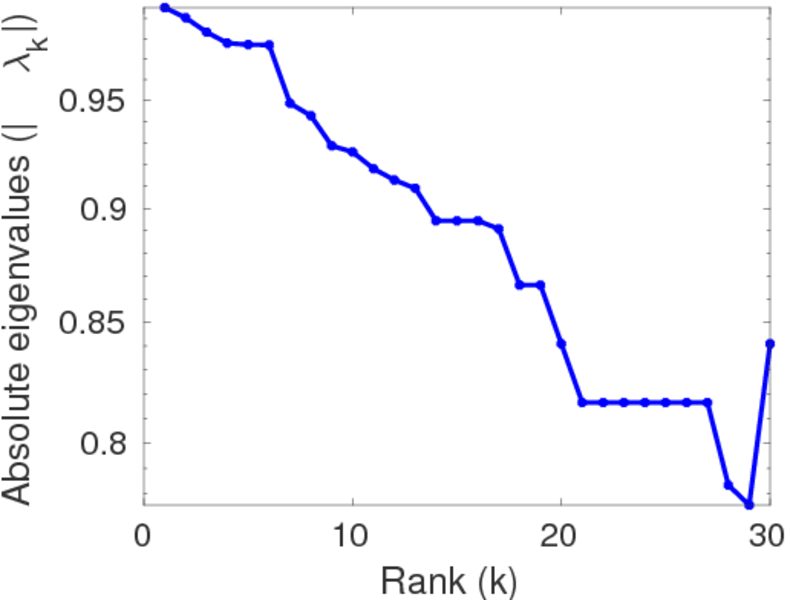
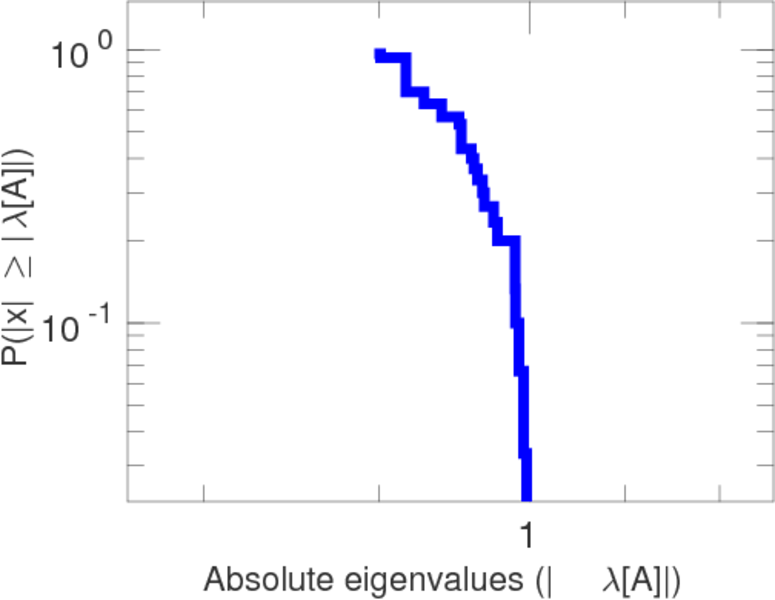
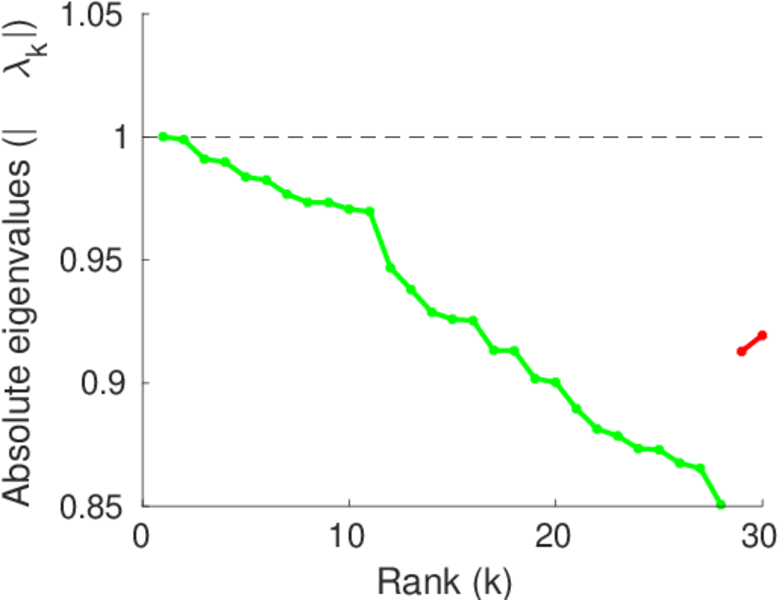
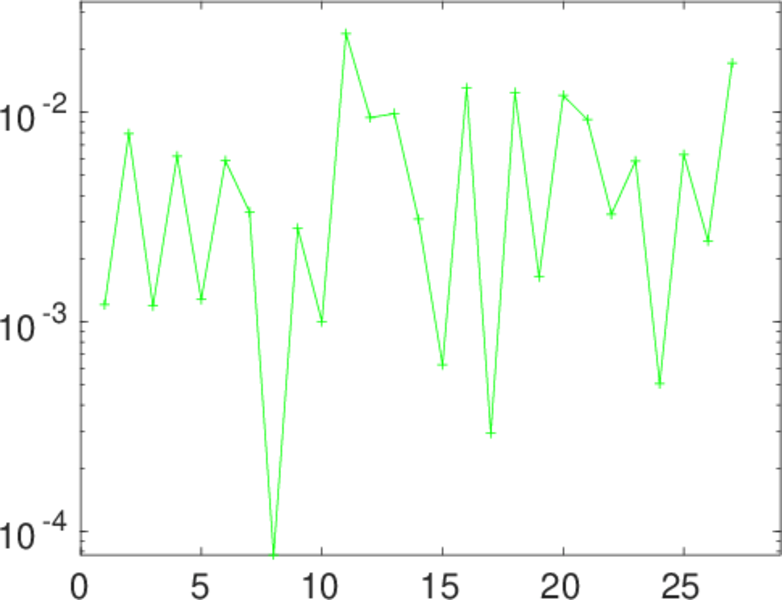
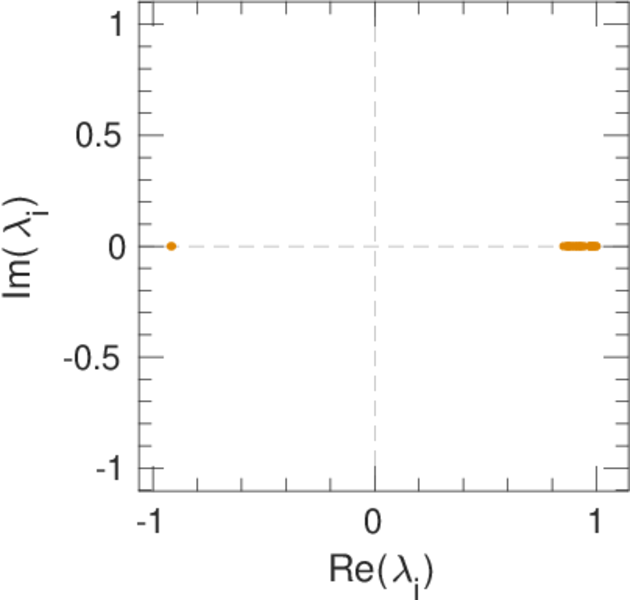
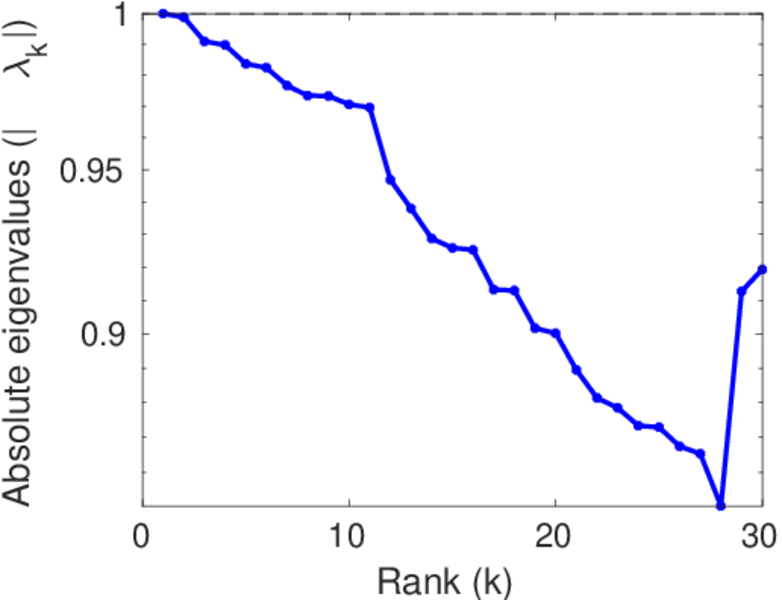
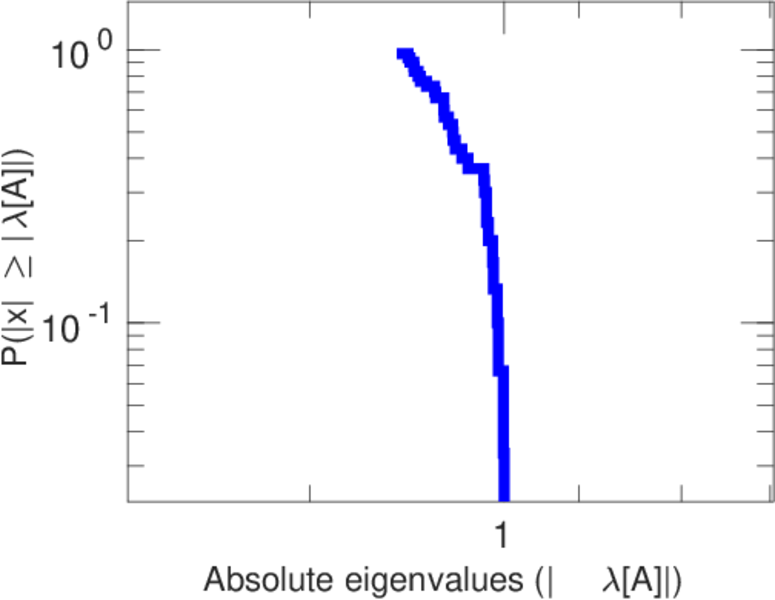
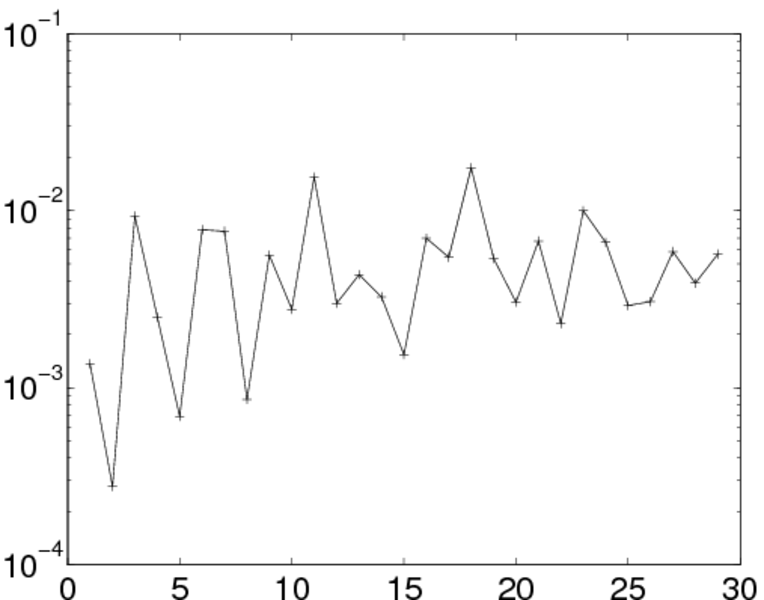
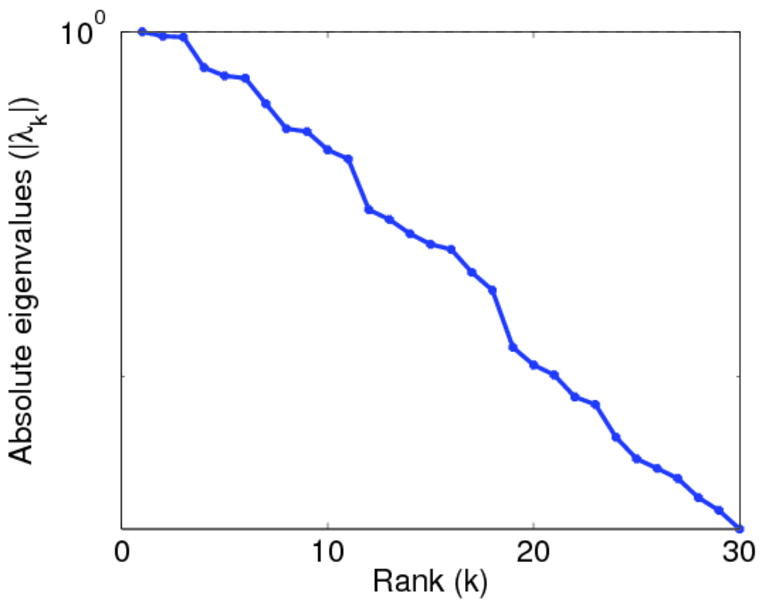
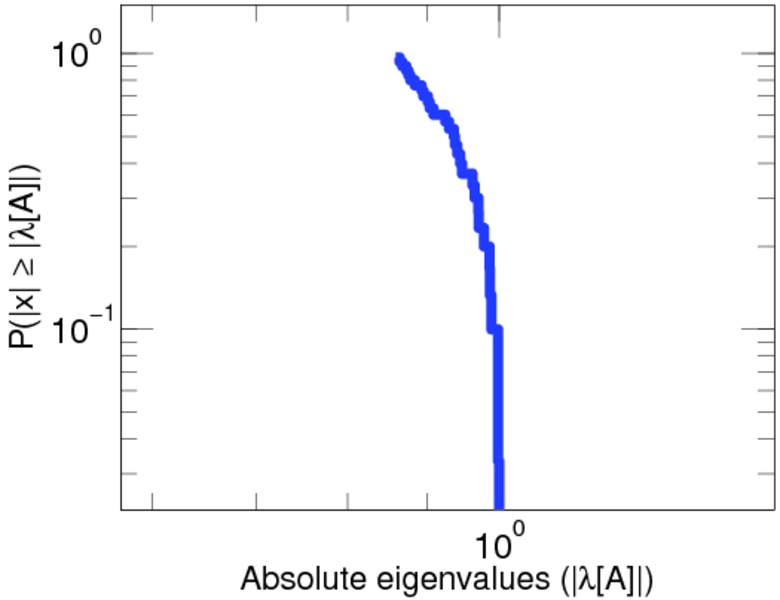
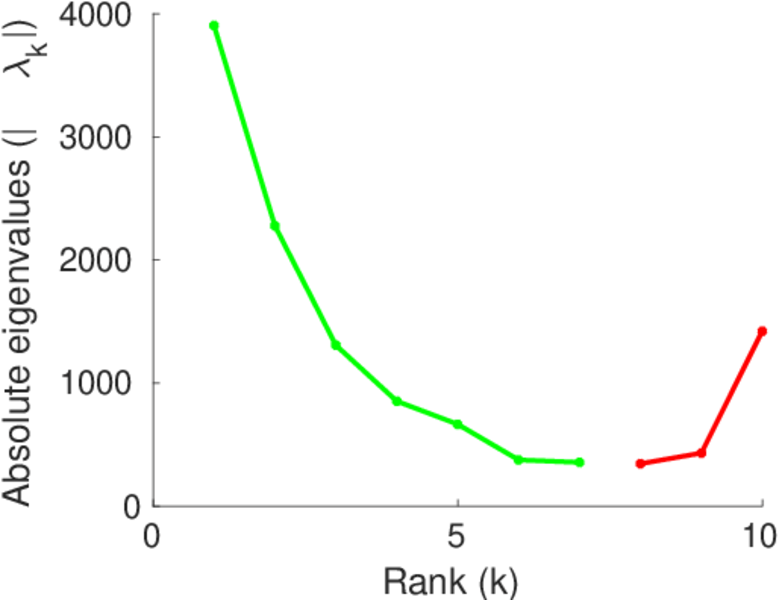
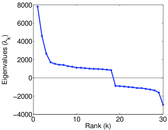
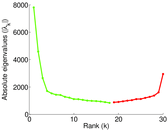
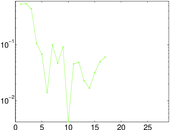
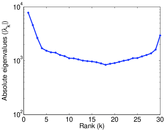
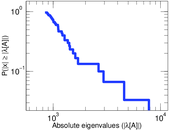
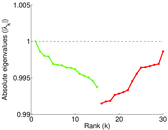
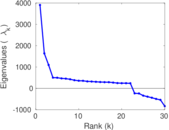
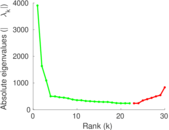
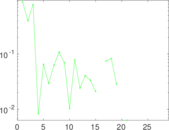
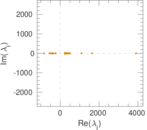
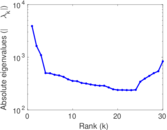
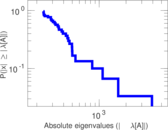
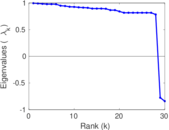
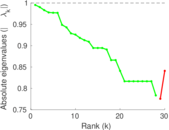
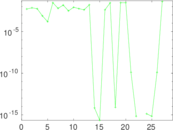
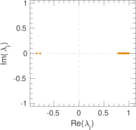
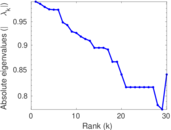
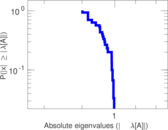
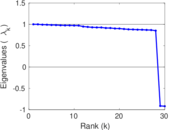
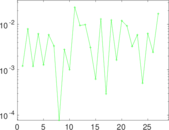
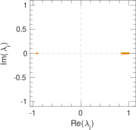
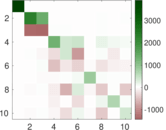
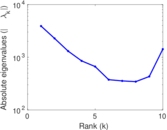
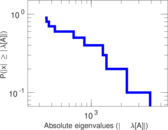
Matrix decompositions plots


Downloads
References
|
[1]
|
Jérôme Kunegis.
KONECT – The Koblenz Network Collection.
In Proc. Int. Conf. on World Wide Web Companion, pages
1343–1350, 2013.
[ http ]
|
|
[2]
|
Bryan Klimt and Yiming Yang.
The Enron corpus: A new dataset for email classification research.
In Proc. Eur. Conf. on Mach. Learn., pages 217–226, 2004.
|
 KONECT ‣ Networks ‣
Buy Me a Coffee
KONECT ‣ Networks ‣
Buy Me a Coffee