Facebook (WOSN)
This undirected network contains friendship data of Facebook users. A node
represents a user and an edge represents a friendship between two users. The
dataset is obviously not complete and contains a very small subset of the total
Facebook friendship graph.
Metadata
Statistics
| Size | n = | 63,731
|
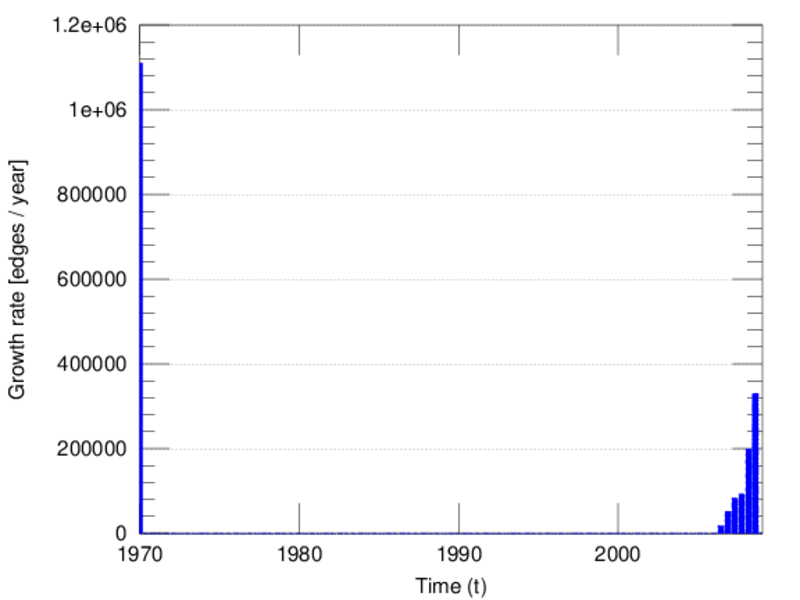
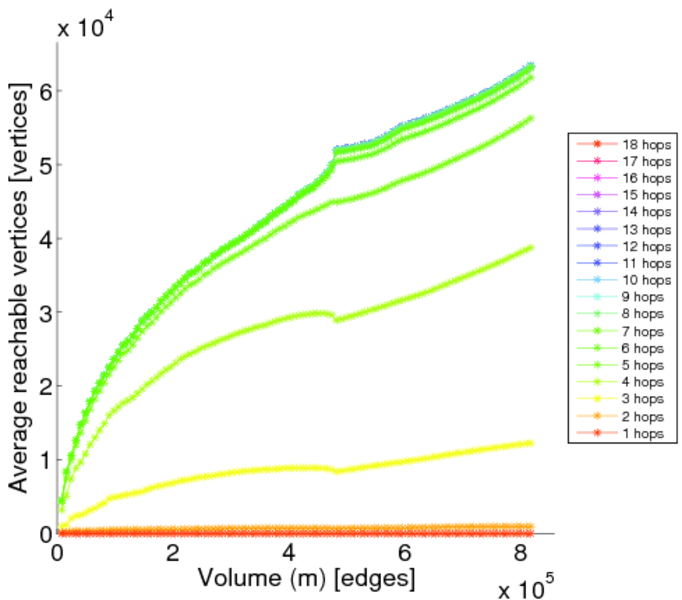
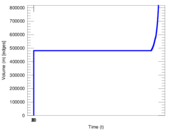
| Volume | m = | 817,035
|
| Loop count | l = | 0
|
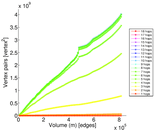
| Wedge count | s = | 71,097,140
|
| Claw count | z = | 4,499,481,578
|
| Cross count | x = | 422,832,581,040
|
| Triangle count | t = | 3,500,542
|
| Square count | q = | 151,719,237
|
| 4-Tour count | T4 = | 1,499,776,526
|
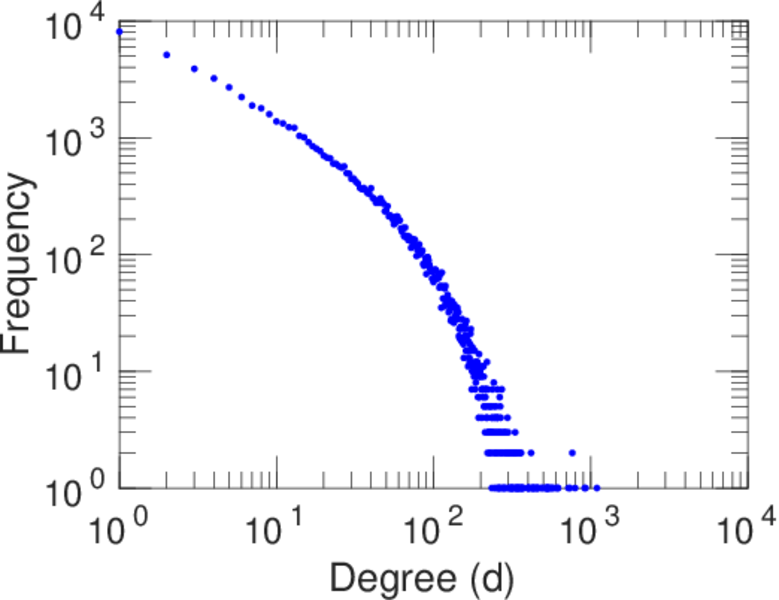
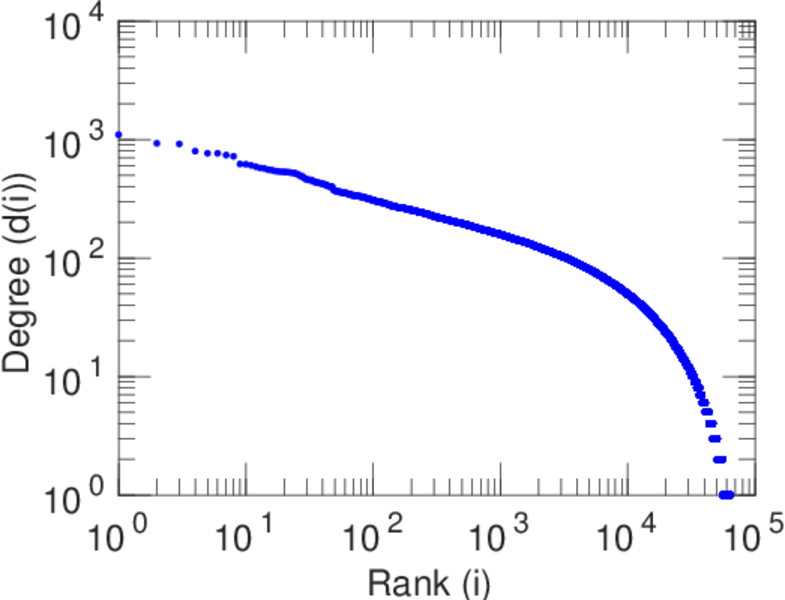
| Maximum degree | dmax = | 1,098
|
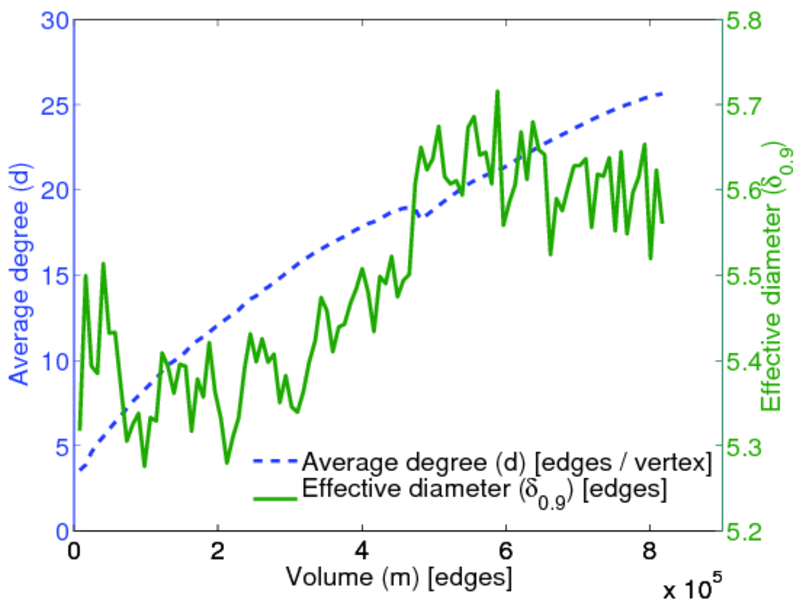
| Average degree | d = | 25.640 1
|
| Fill | p = | 0.000 402 324
|
| Size of LCC | N = | 63,392
|
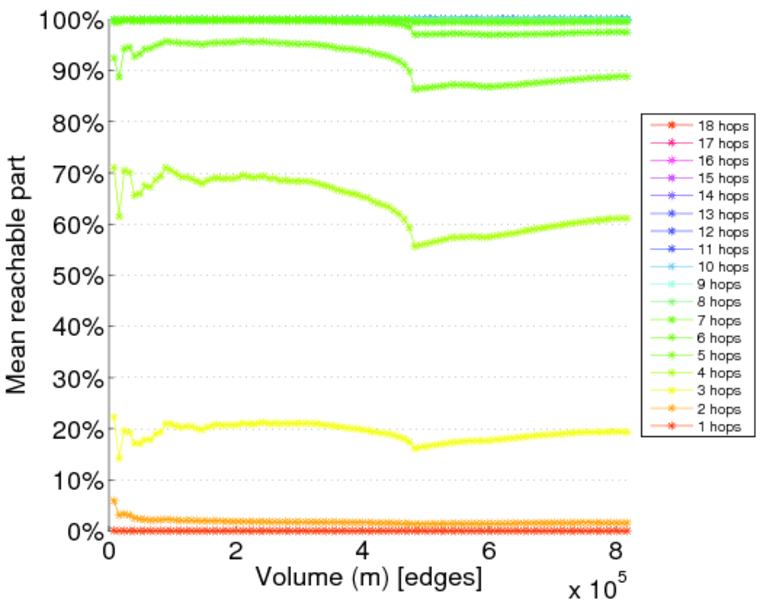
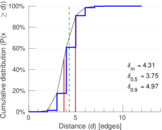
| Diameter | δ = | 15
|
| 50-Percentile effective diameter | δ0.5 = | 3.748 16
|
| 90-Percentile effective diameter | δ0.9 = | 4.968 12
|
| Median distance | δM = | 4
|
| Mean distance | δm = | 4.309 73
|
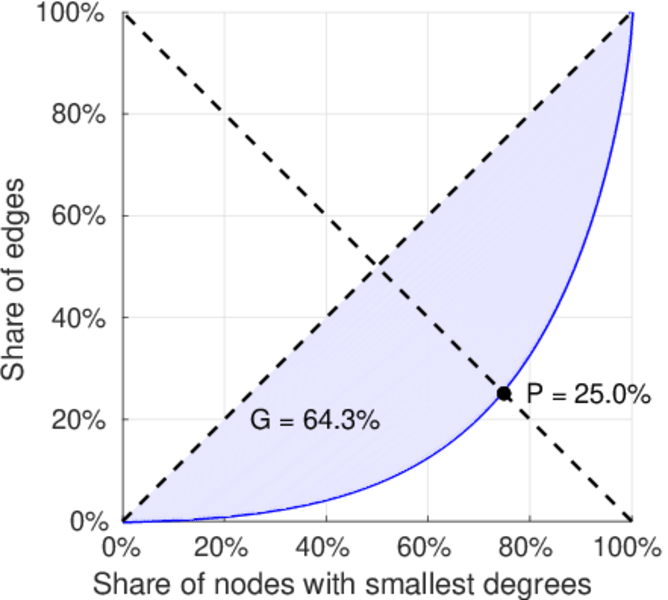
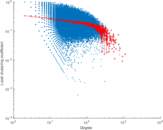
| Gini coefficient | G = | 0.642 926
|
| Balanced inequality ratio | P = | 0.249 527
|
| Relative edge distribution entropy | Her = | 0.931 429
|
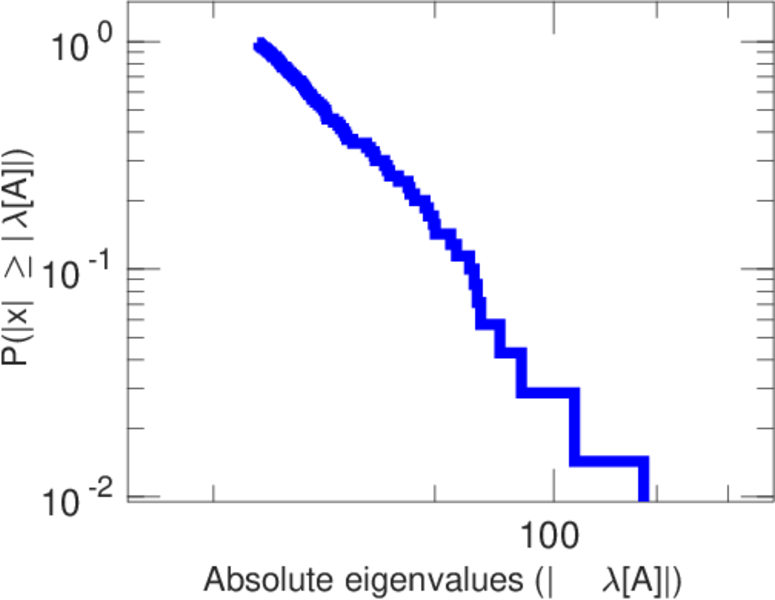
| Power law exponent | γ = | 1.432 97
|
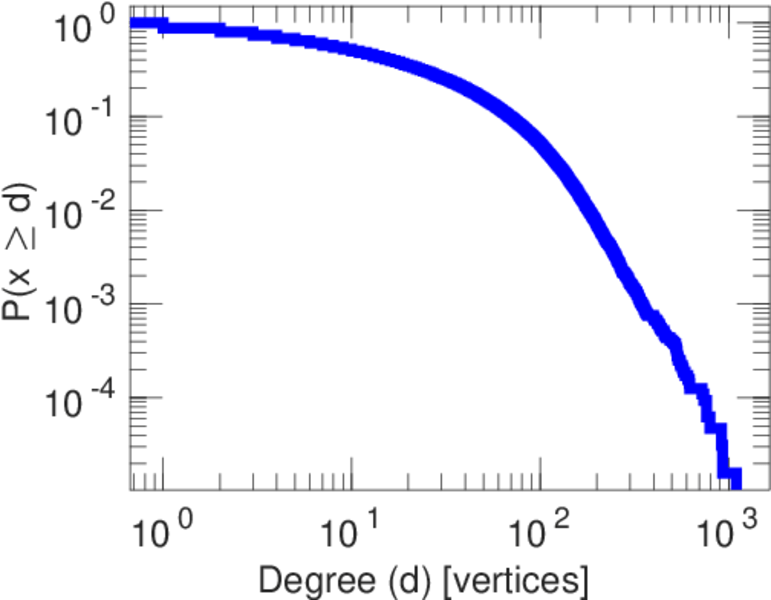
| Tail power law exponent | γt = | 2.941 00
|
| Tail power law exponent with p | γ3 = | 2.941 00
|
| p-value | p = | 0.000 00
|
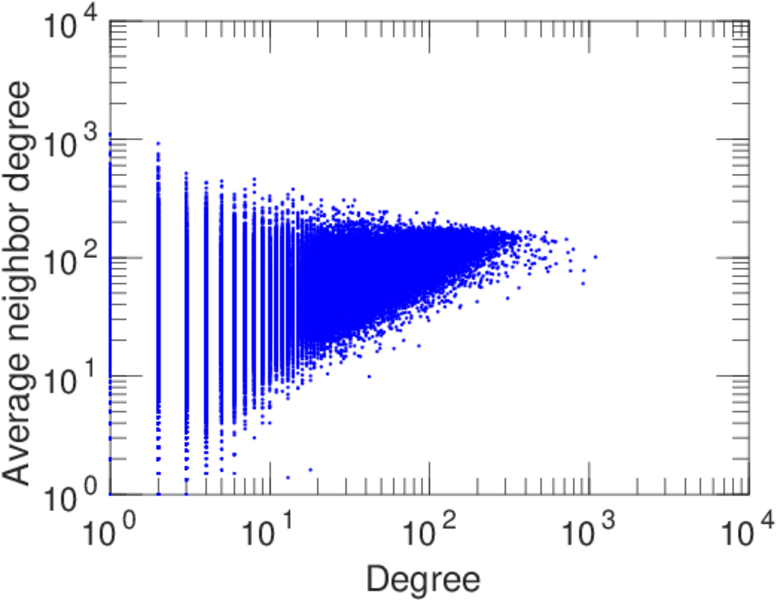
| Degree assortativity | ρ = | +0.177 015
|
| Degree assortativity p-value | pρ = | 0.000 00
|
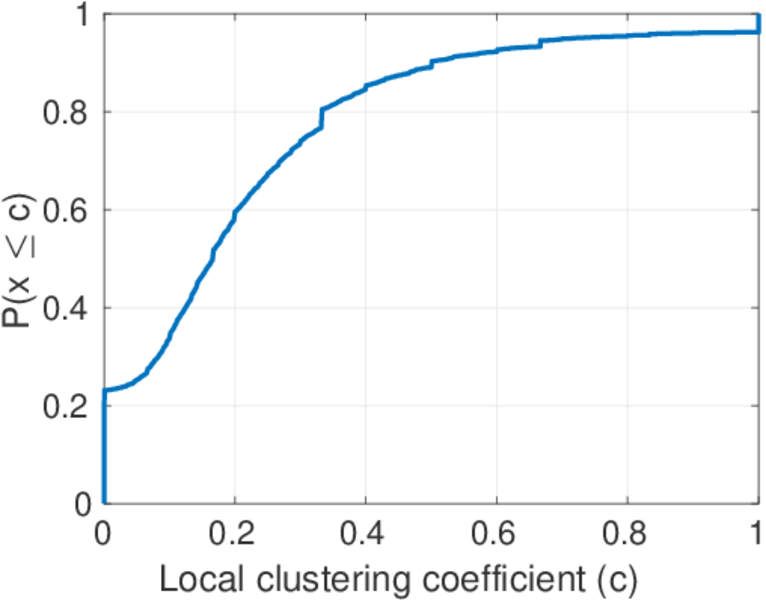
| Clustering coefficient | c = | 0.147 708
|
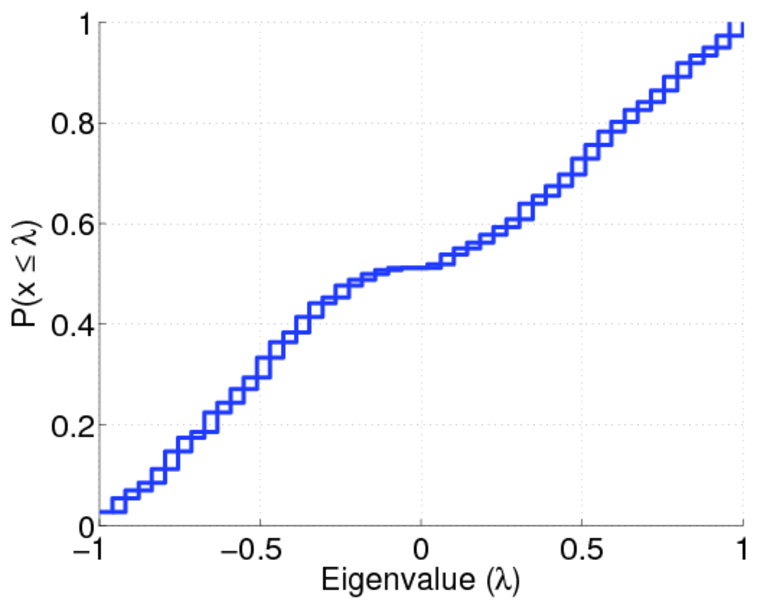
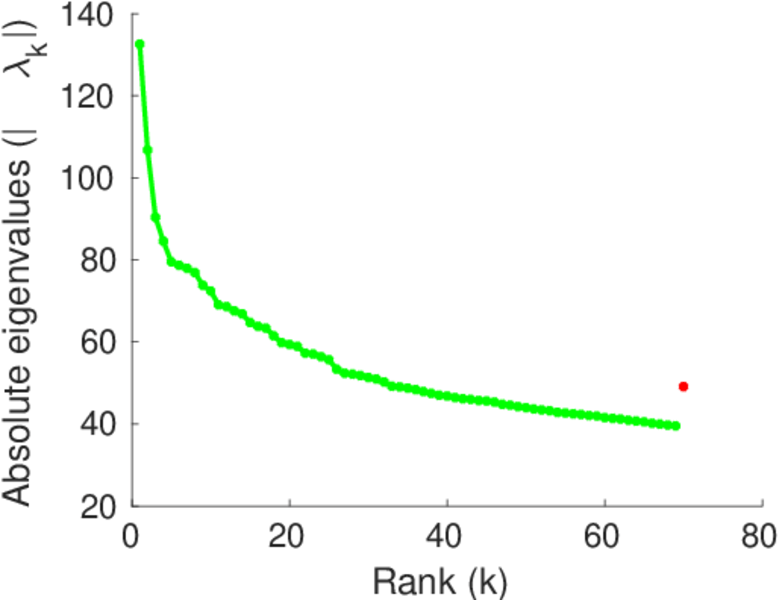
| Spectral norm | α = | 132.568
|
| Algebraic connectivity | a = | 0.046 404 4
|
| Spectral separation | |λ1[A] / λ2[A]| = | 1.241 96
|
| Normalized non-bipartivity | bN = | 0.031 728 7
|
| Spectral bipartite frustration | bK = | 0.000 572 139
|
| Controllability | C = | 1,821
|
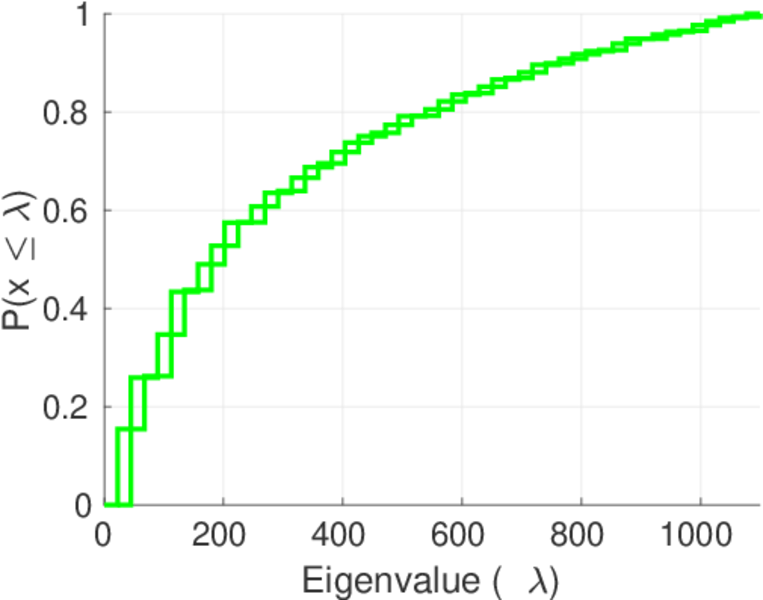
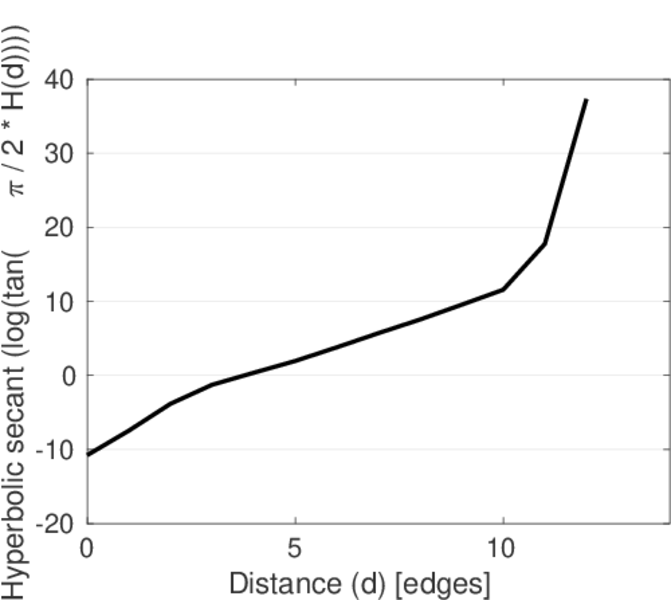
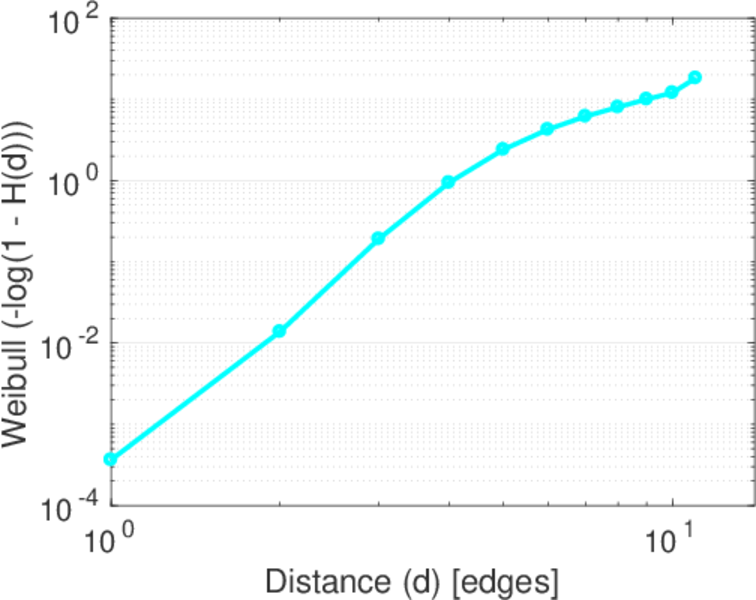
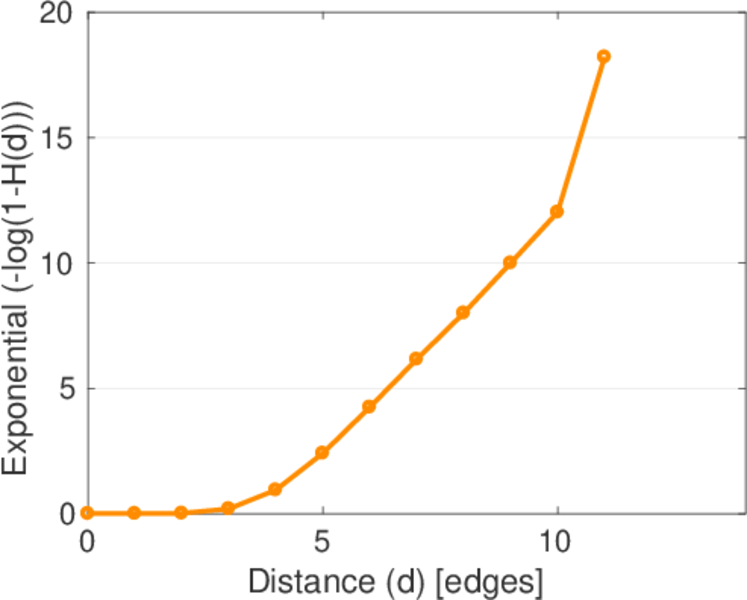
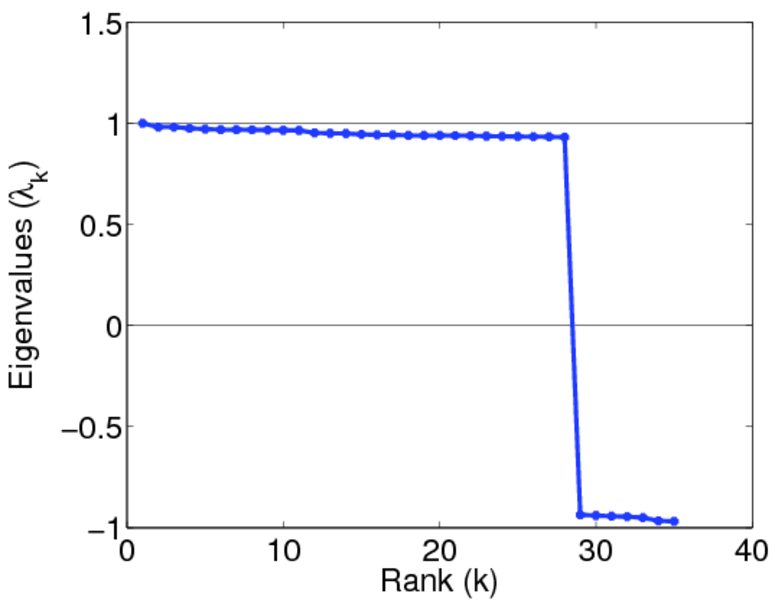
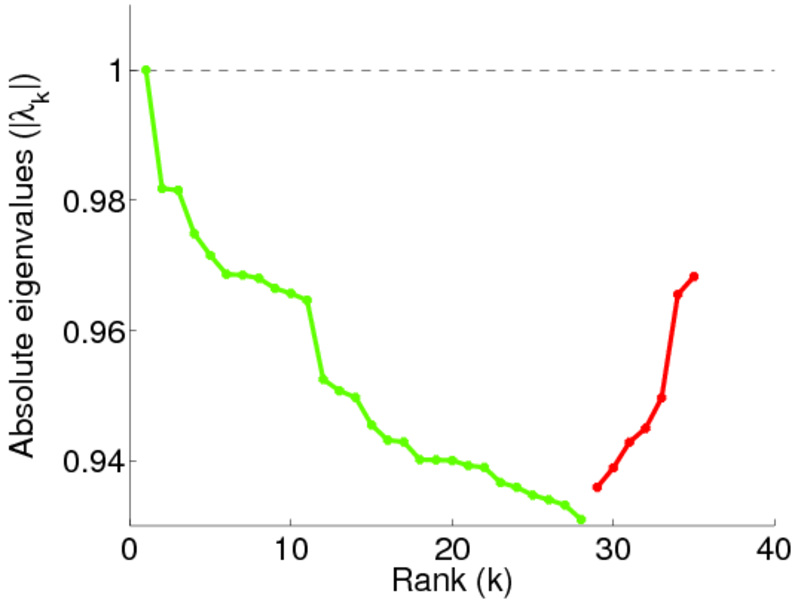
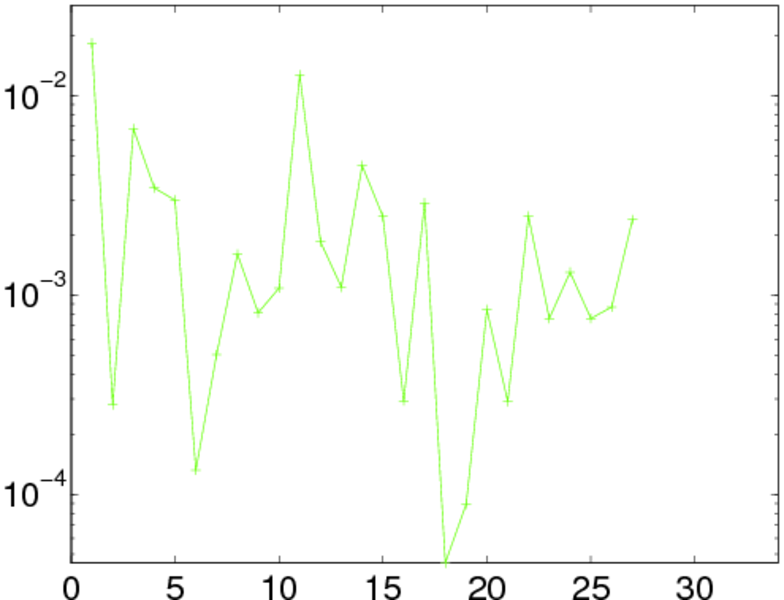
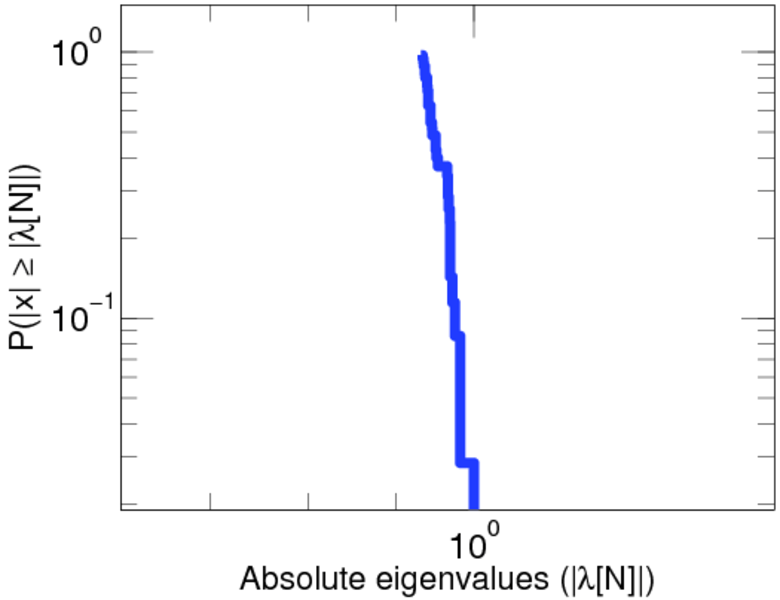
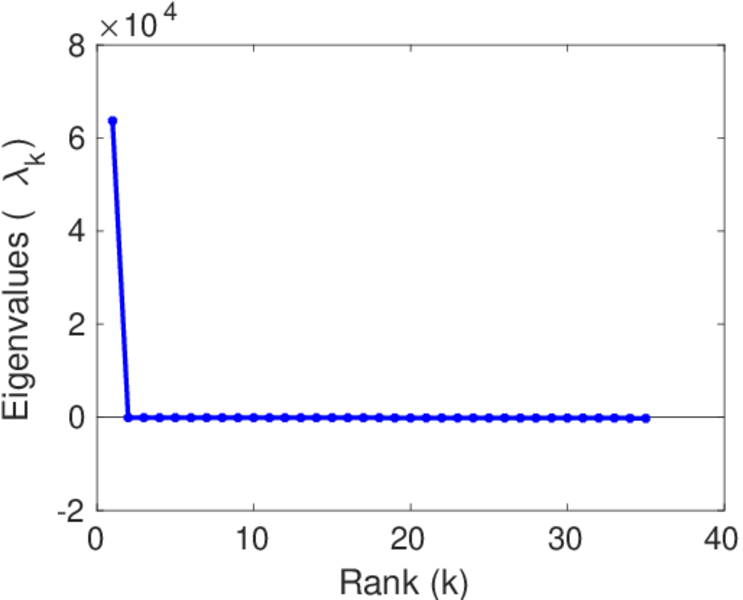
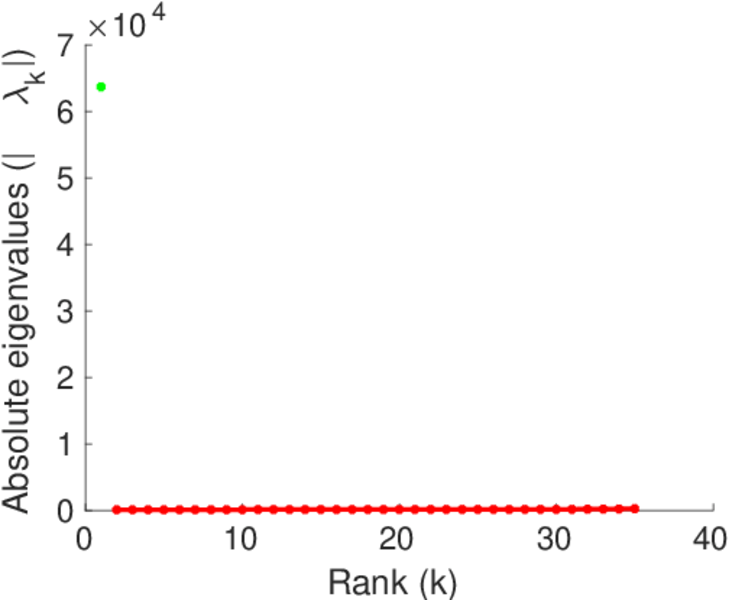
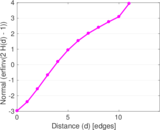
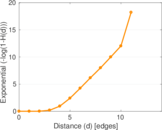
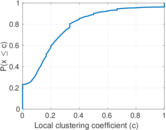
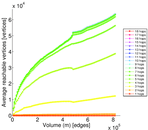
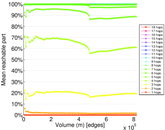
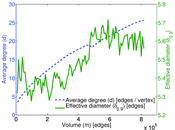
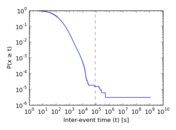
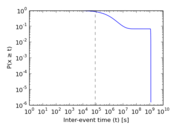
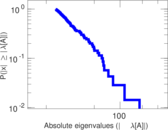
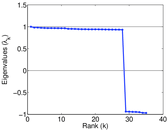
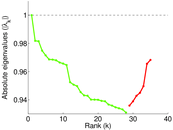
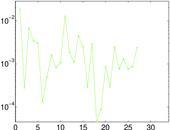
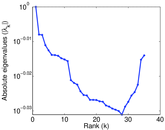
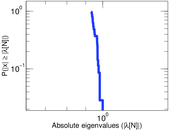
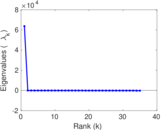
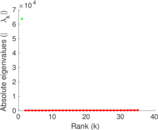
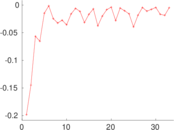
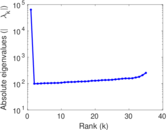
Plots


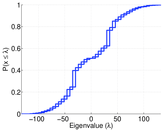

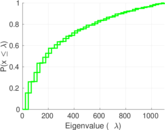


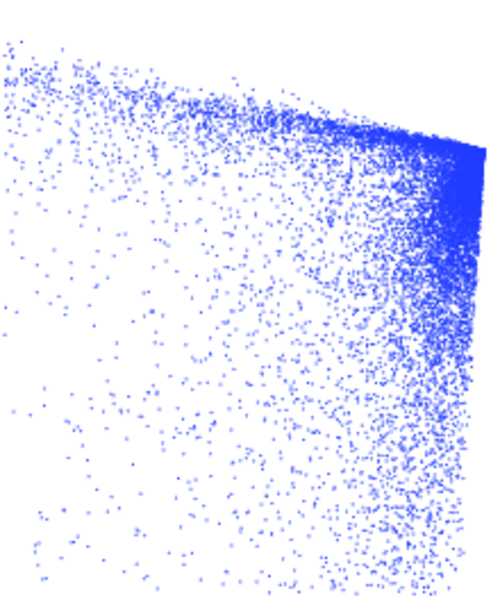
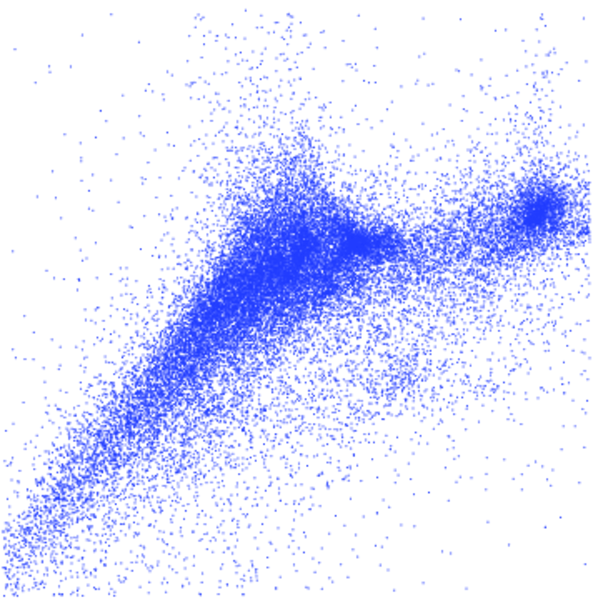
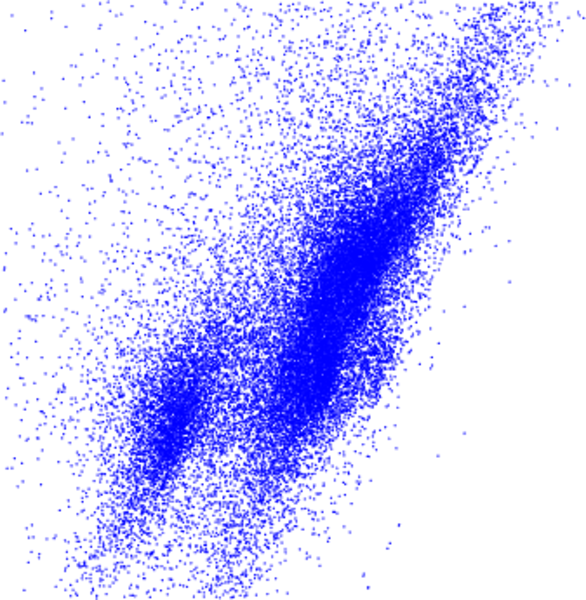
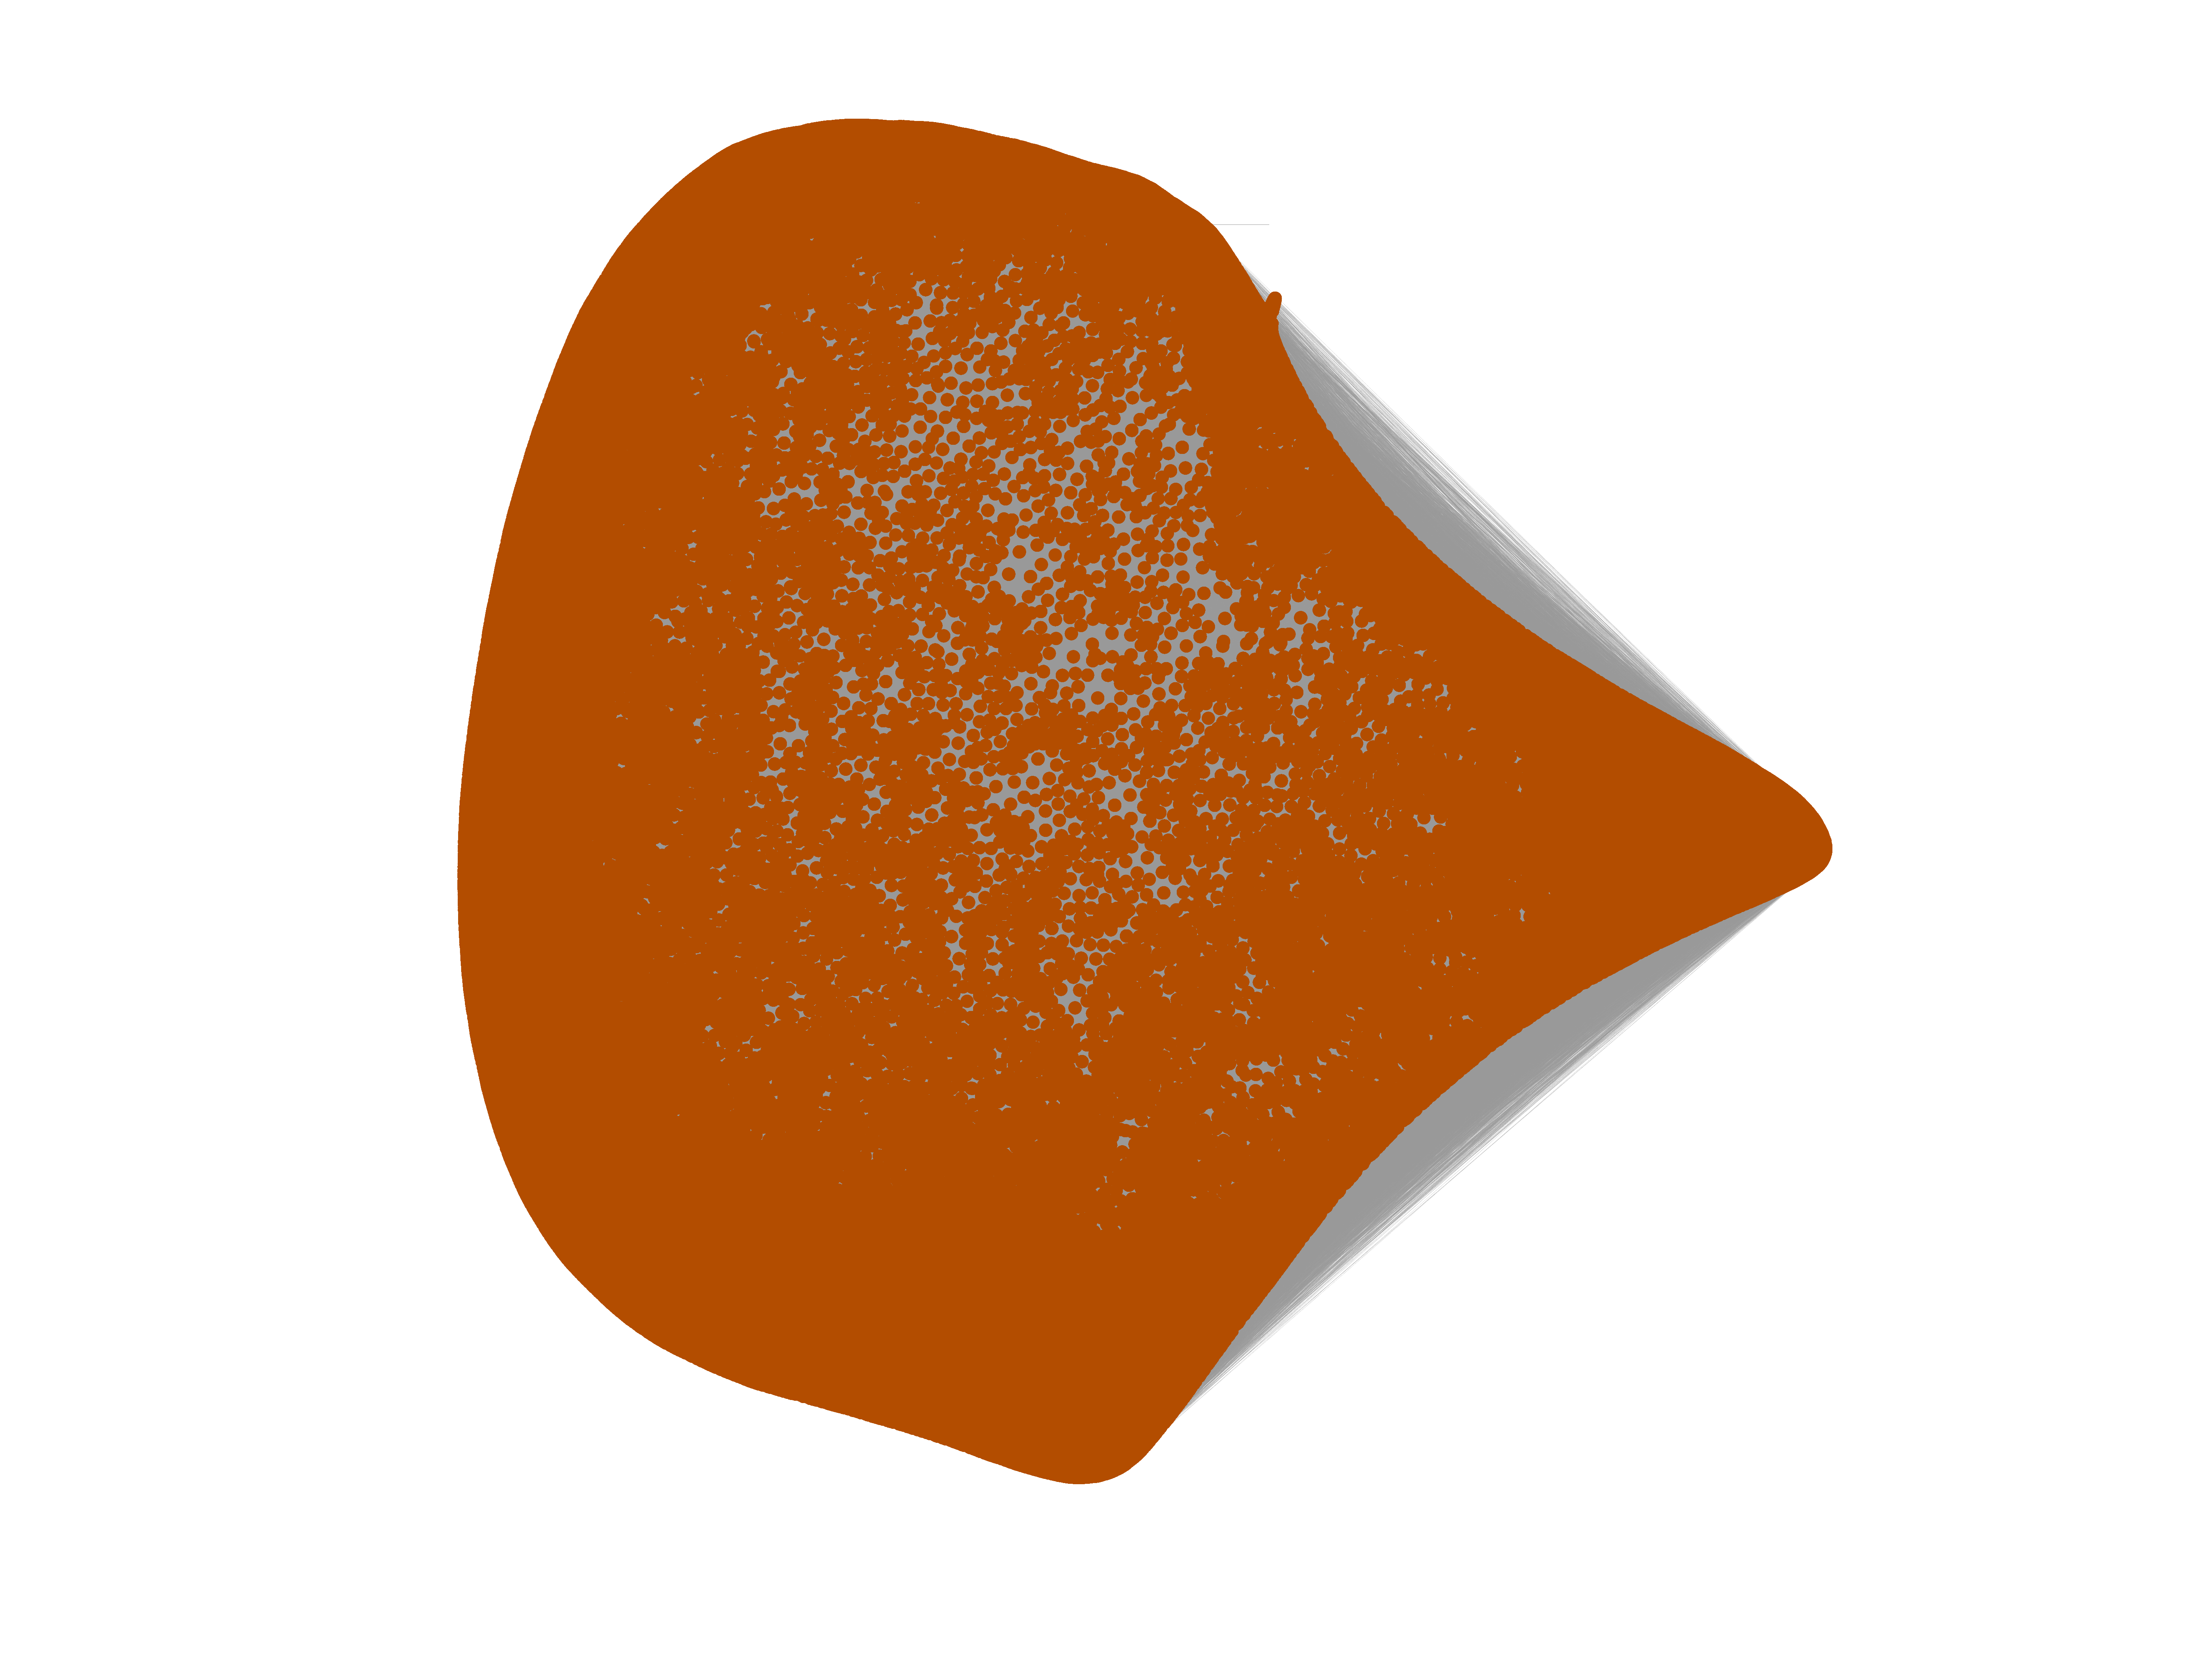
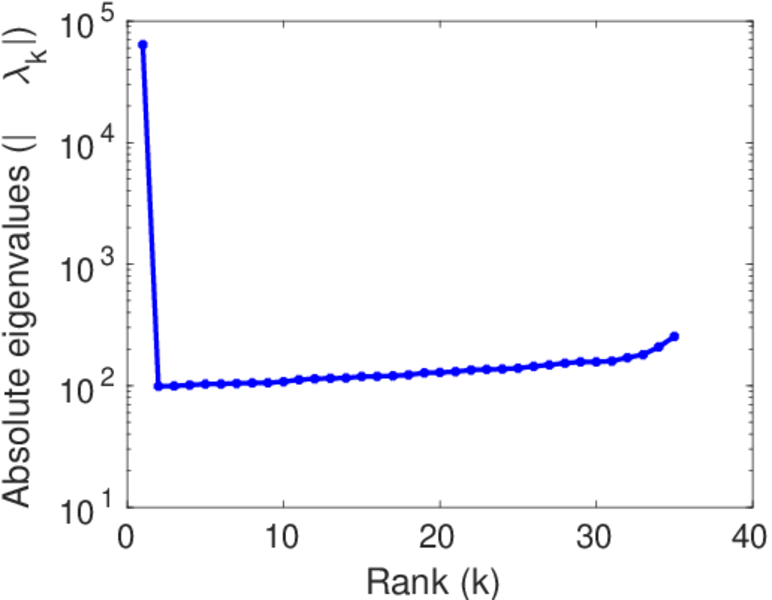
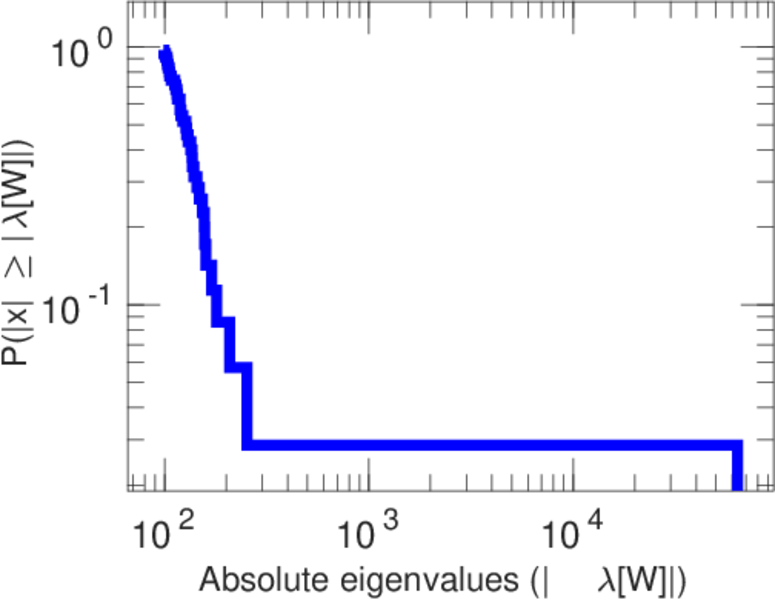
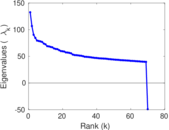
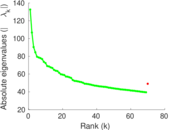
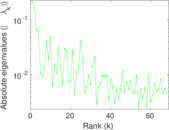
Matrix decompositions plots

Downloads
References
|
[1]
|
Jérôme Kunegis.
KONECT – The Koblenz Network Collection.
In Proc. Int. Conf. on World Wide Web Companion, pages
1343–1350, 2013.
[ http ]
|
|
[2]
|
Bimal Viswanath, Alan Mislove, Meeyoung Cha, and Krishna P. Gummadi.
On the evolution of user interaction in Facebook.
In Proc. Workshop on Online Soc. Netw., pages 37–42, 2009.
|
 KONECT ‣ Networks ‣
Buy Me a Coffee
KONECT ‣ Networks ‣
Buy Me a Coffee