 KONECT ‣ Networks ‣
Buy Me a Coffee
KONECT ‣ Networks ‣
Buy Me a Coffee
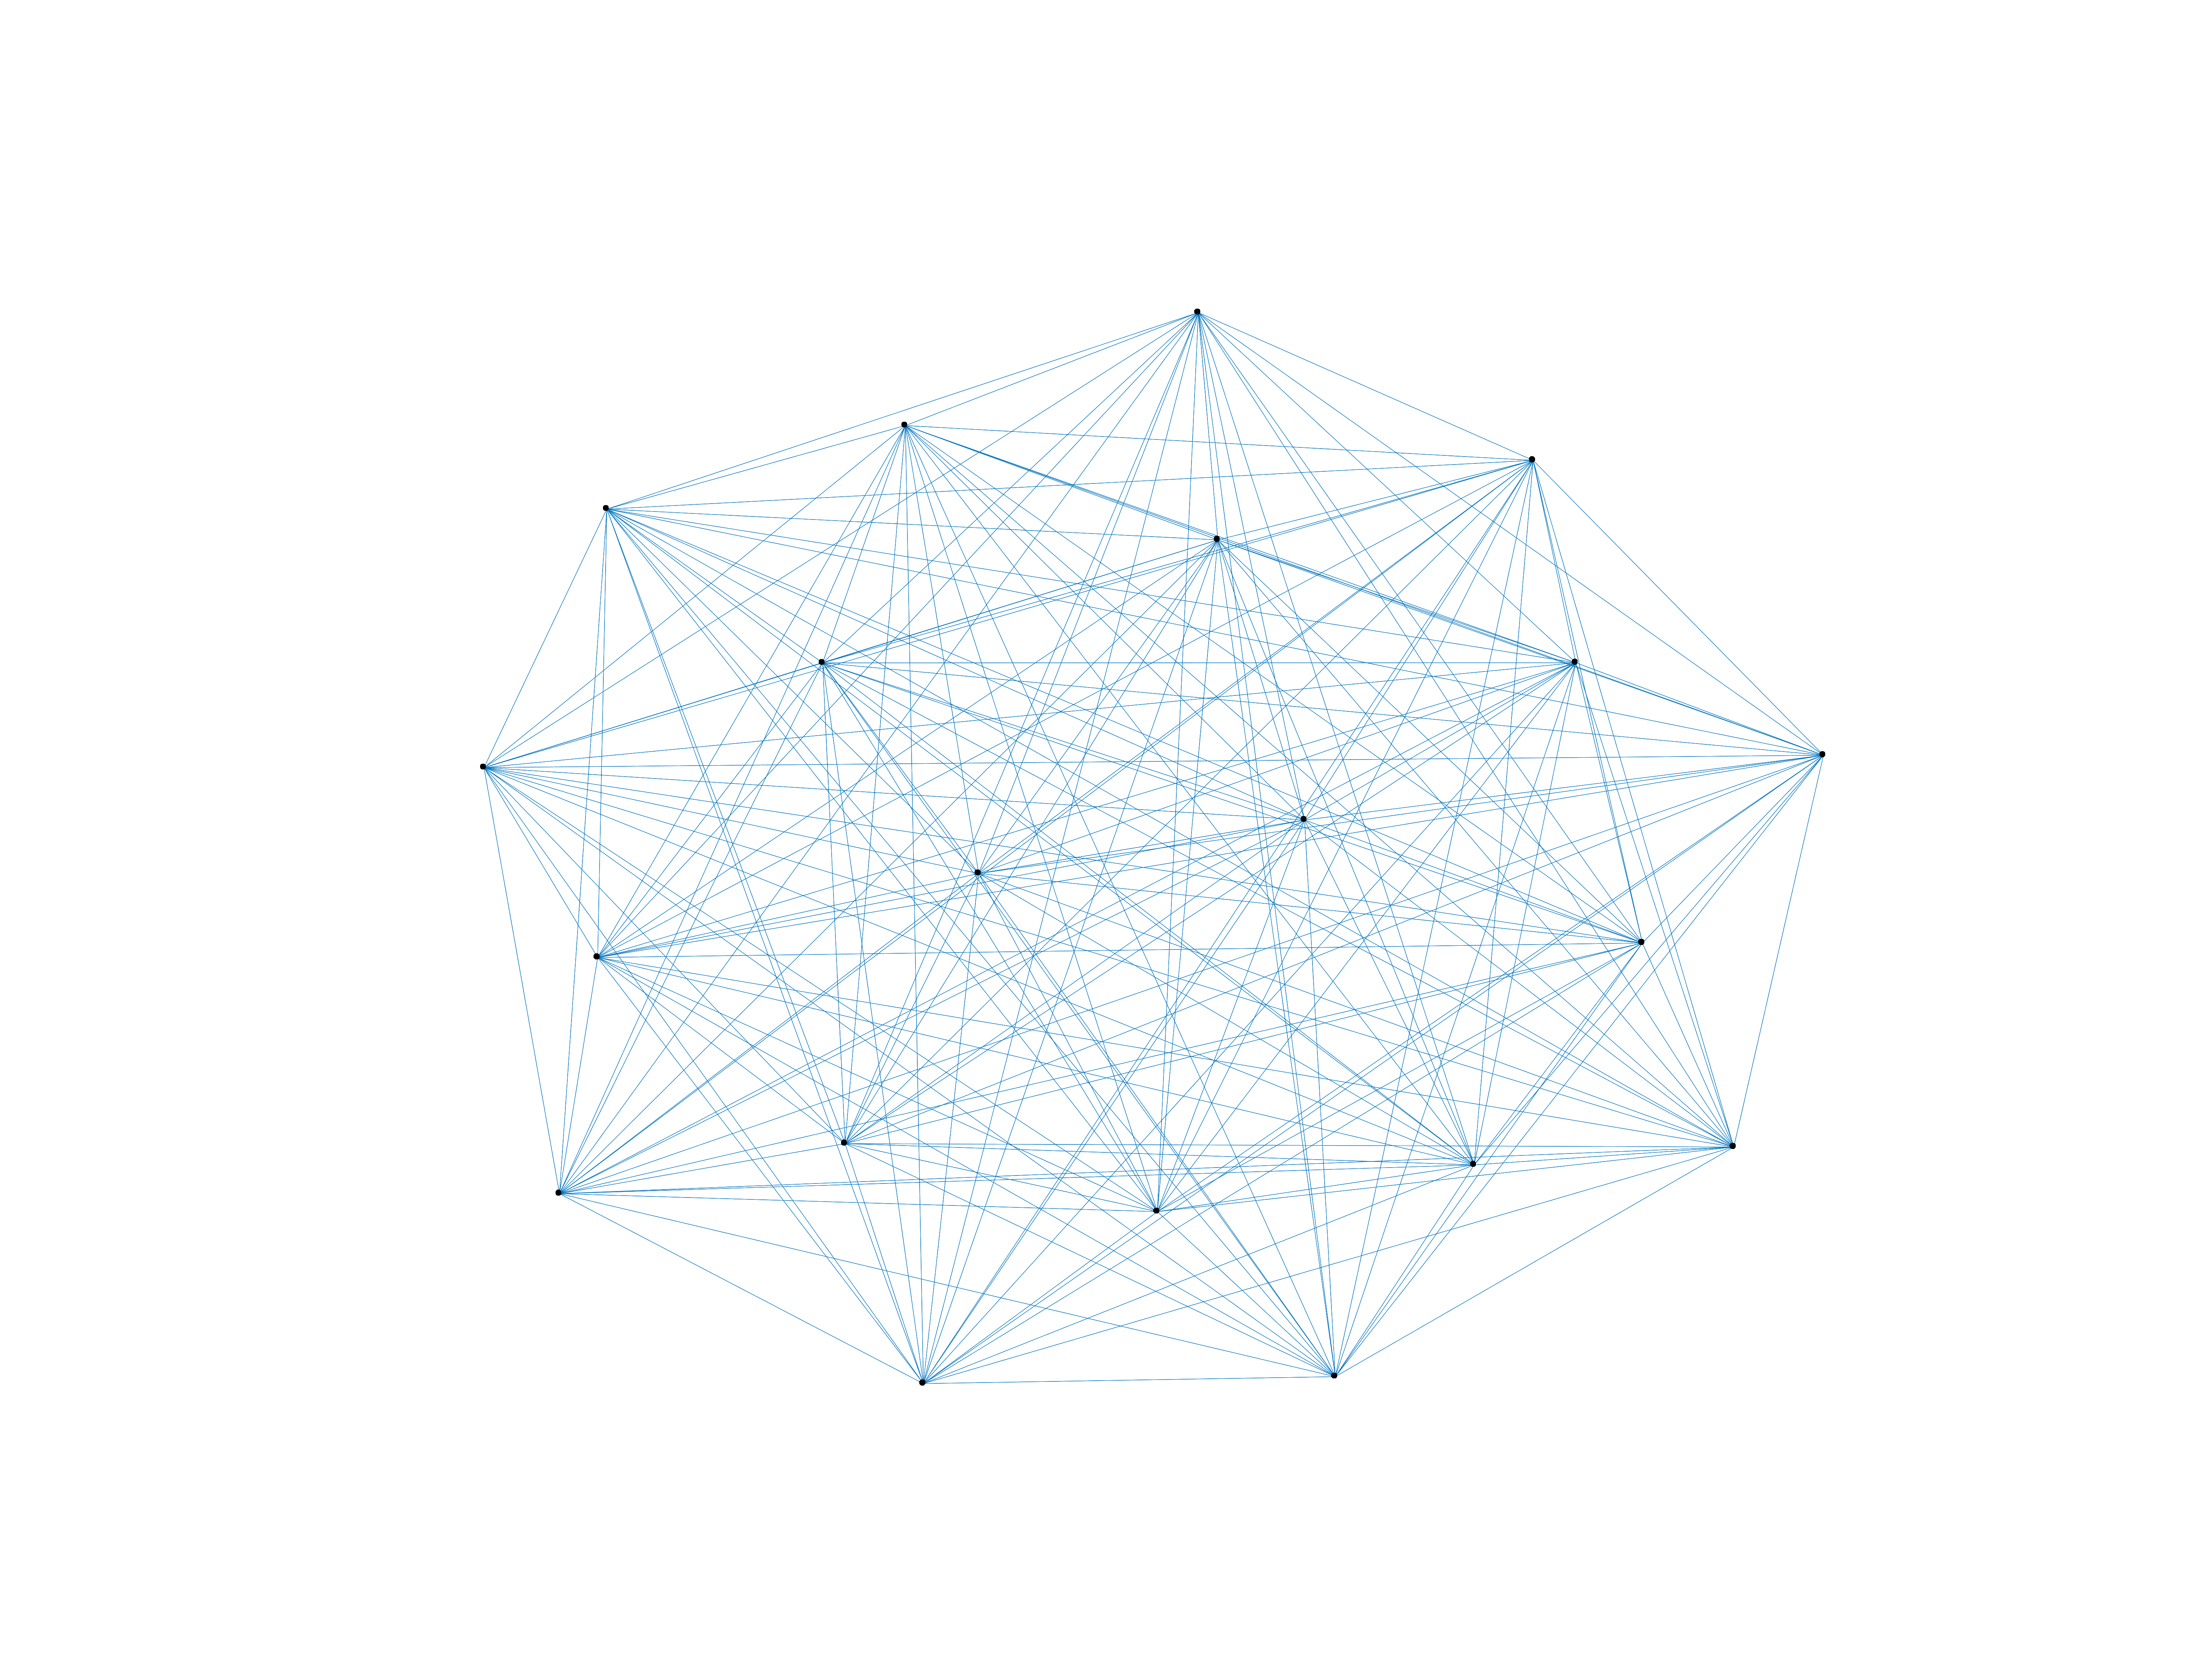
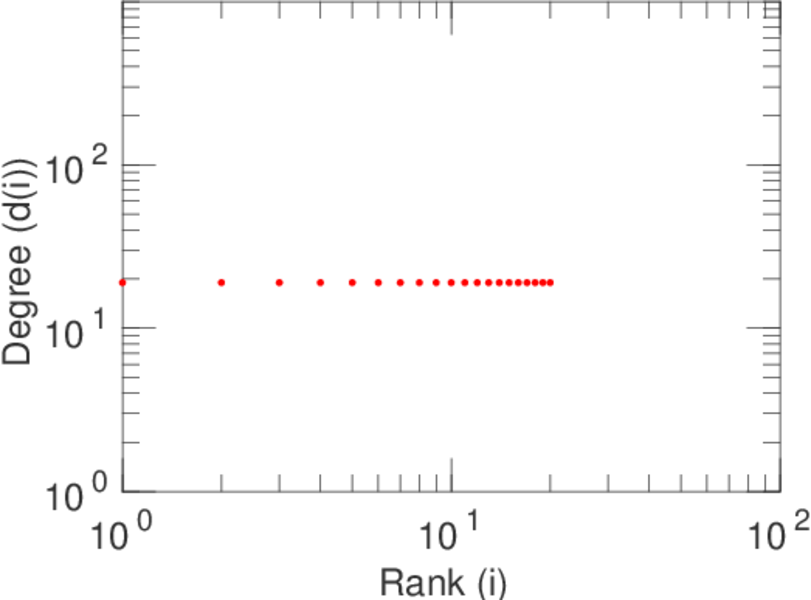
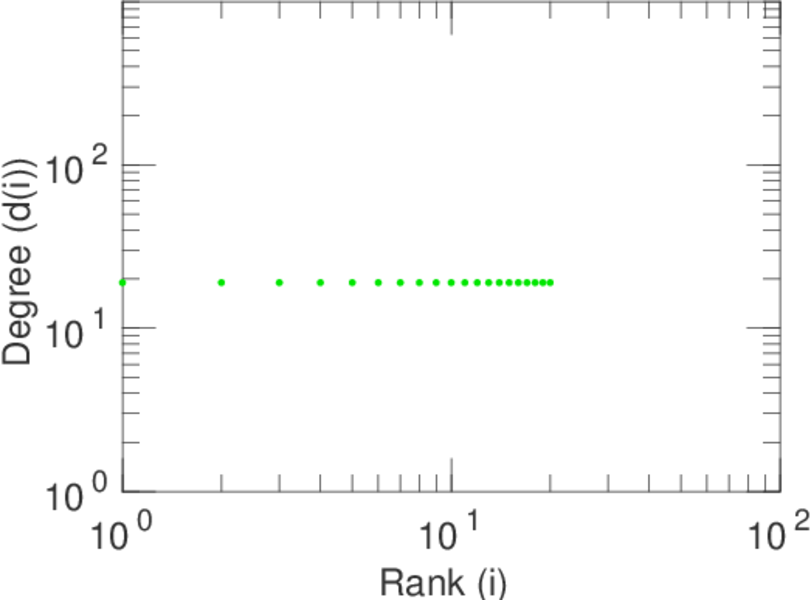
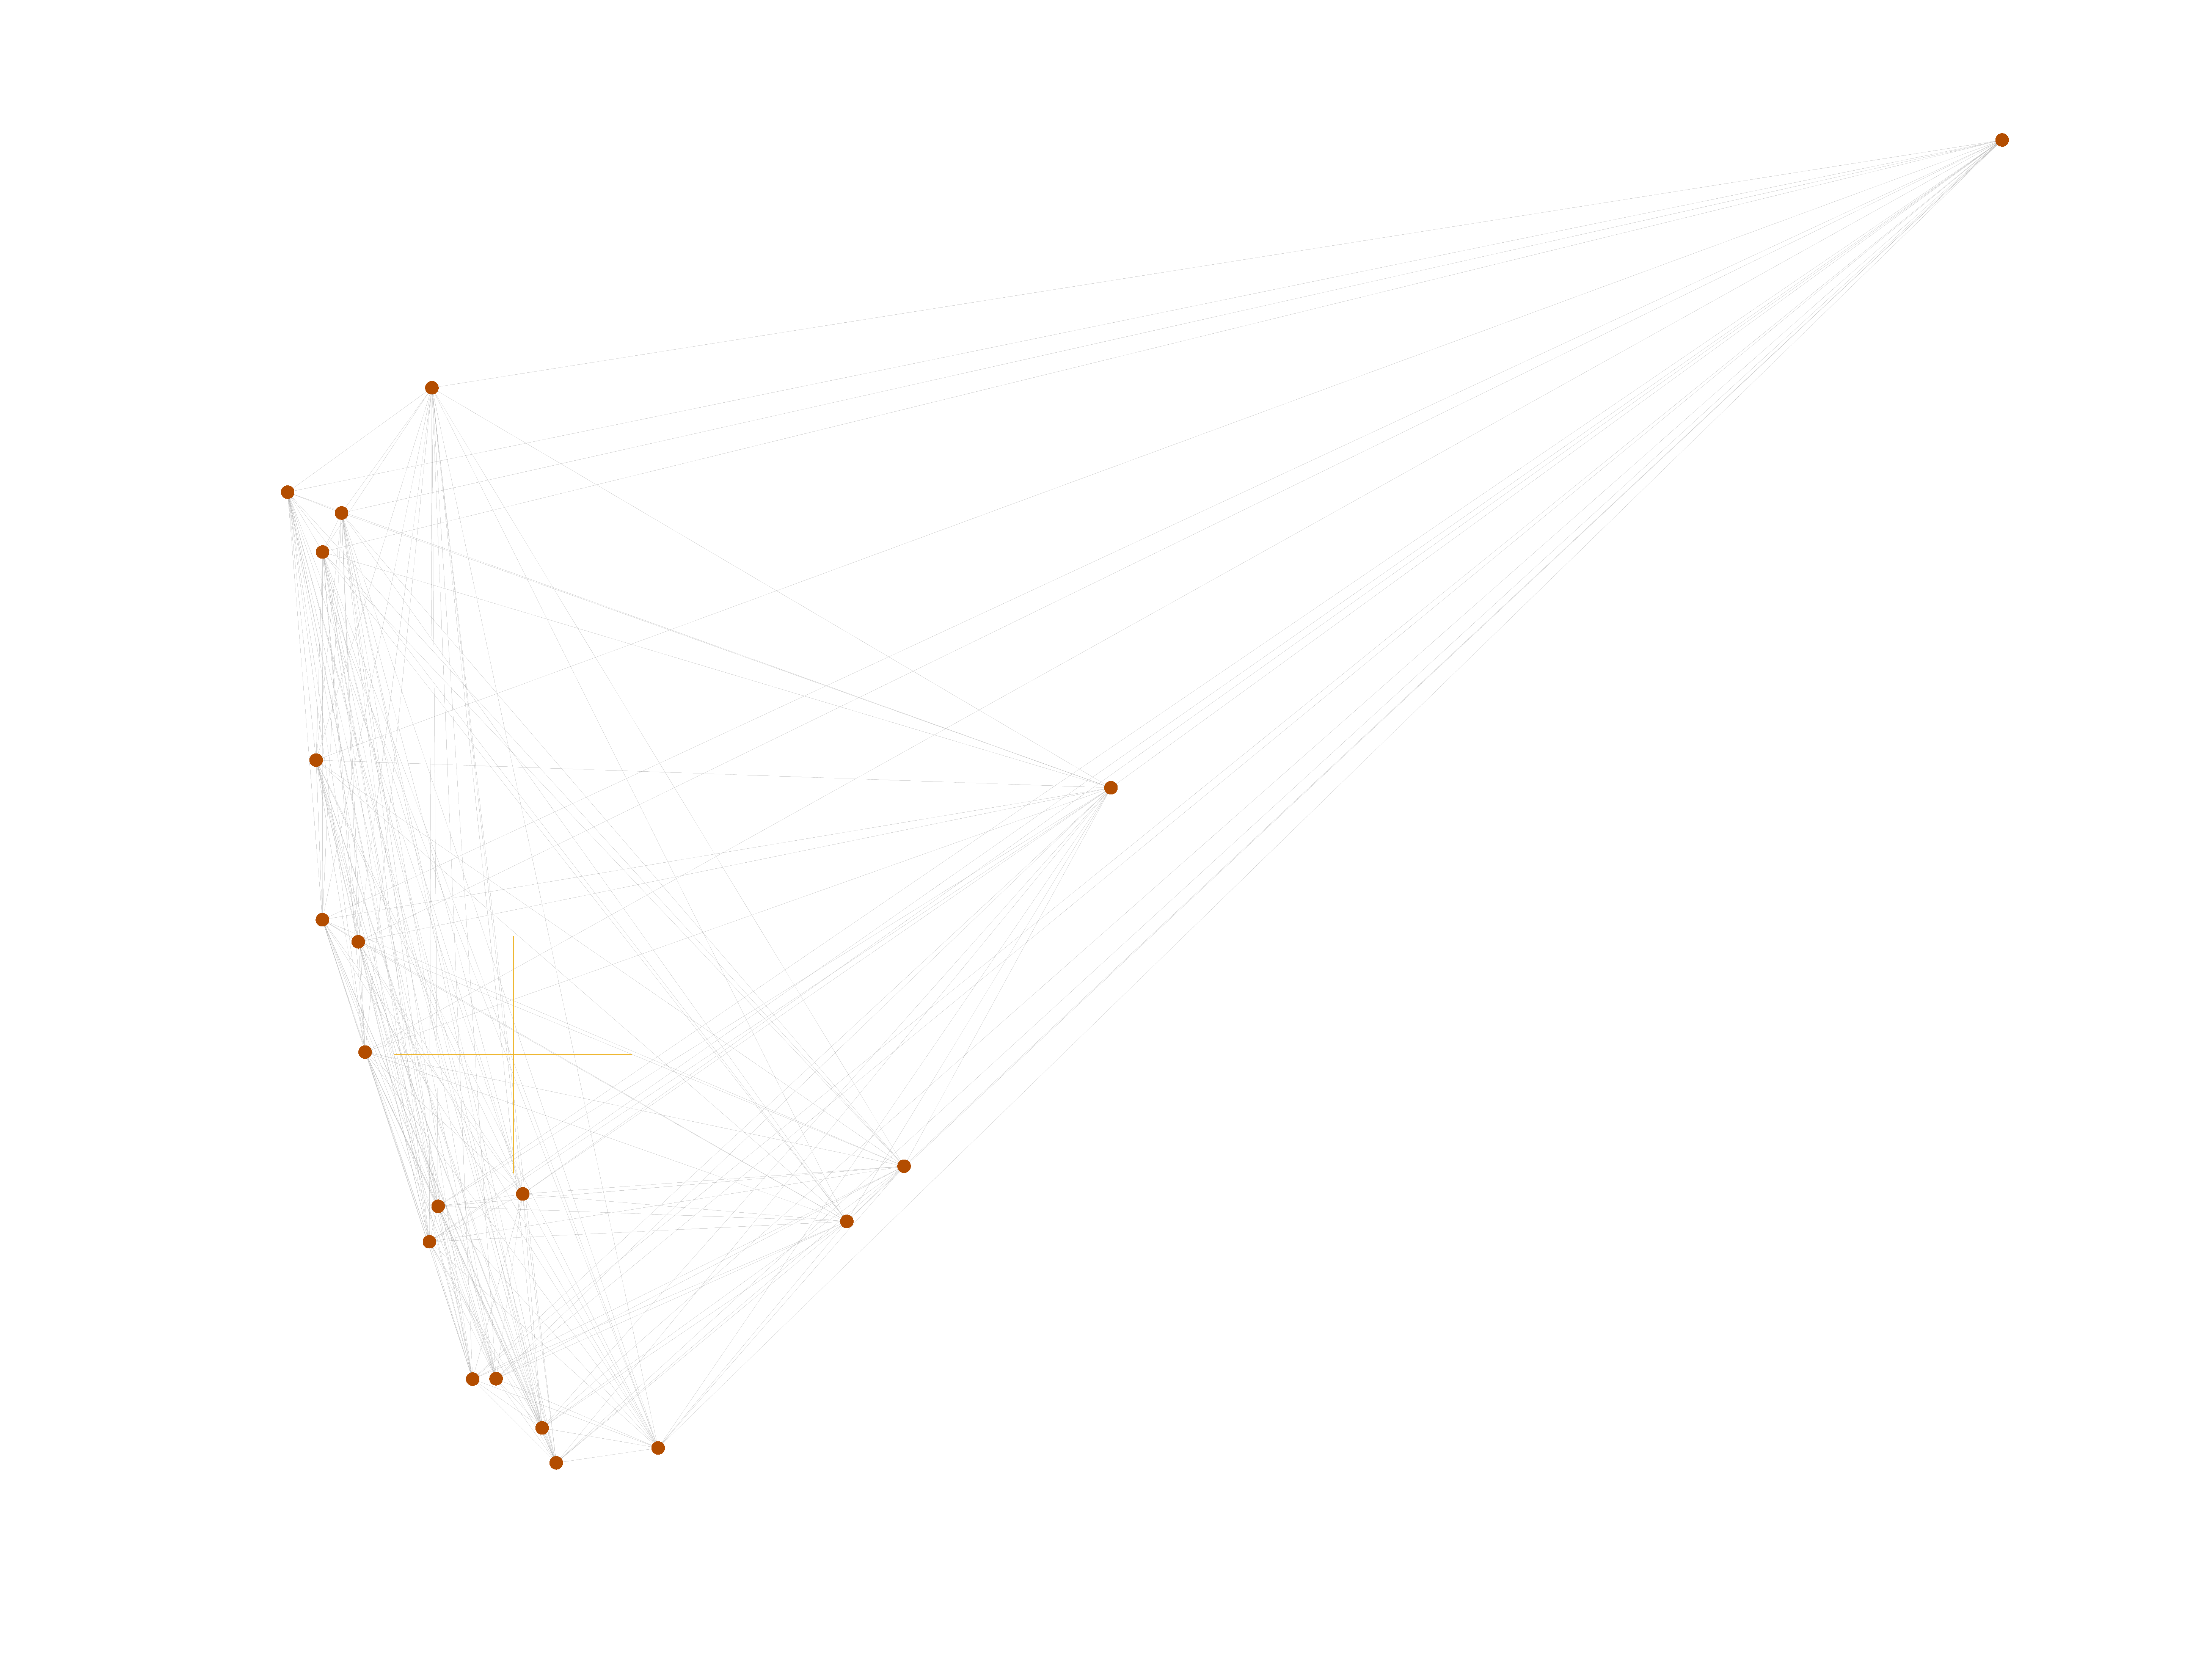
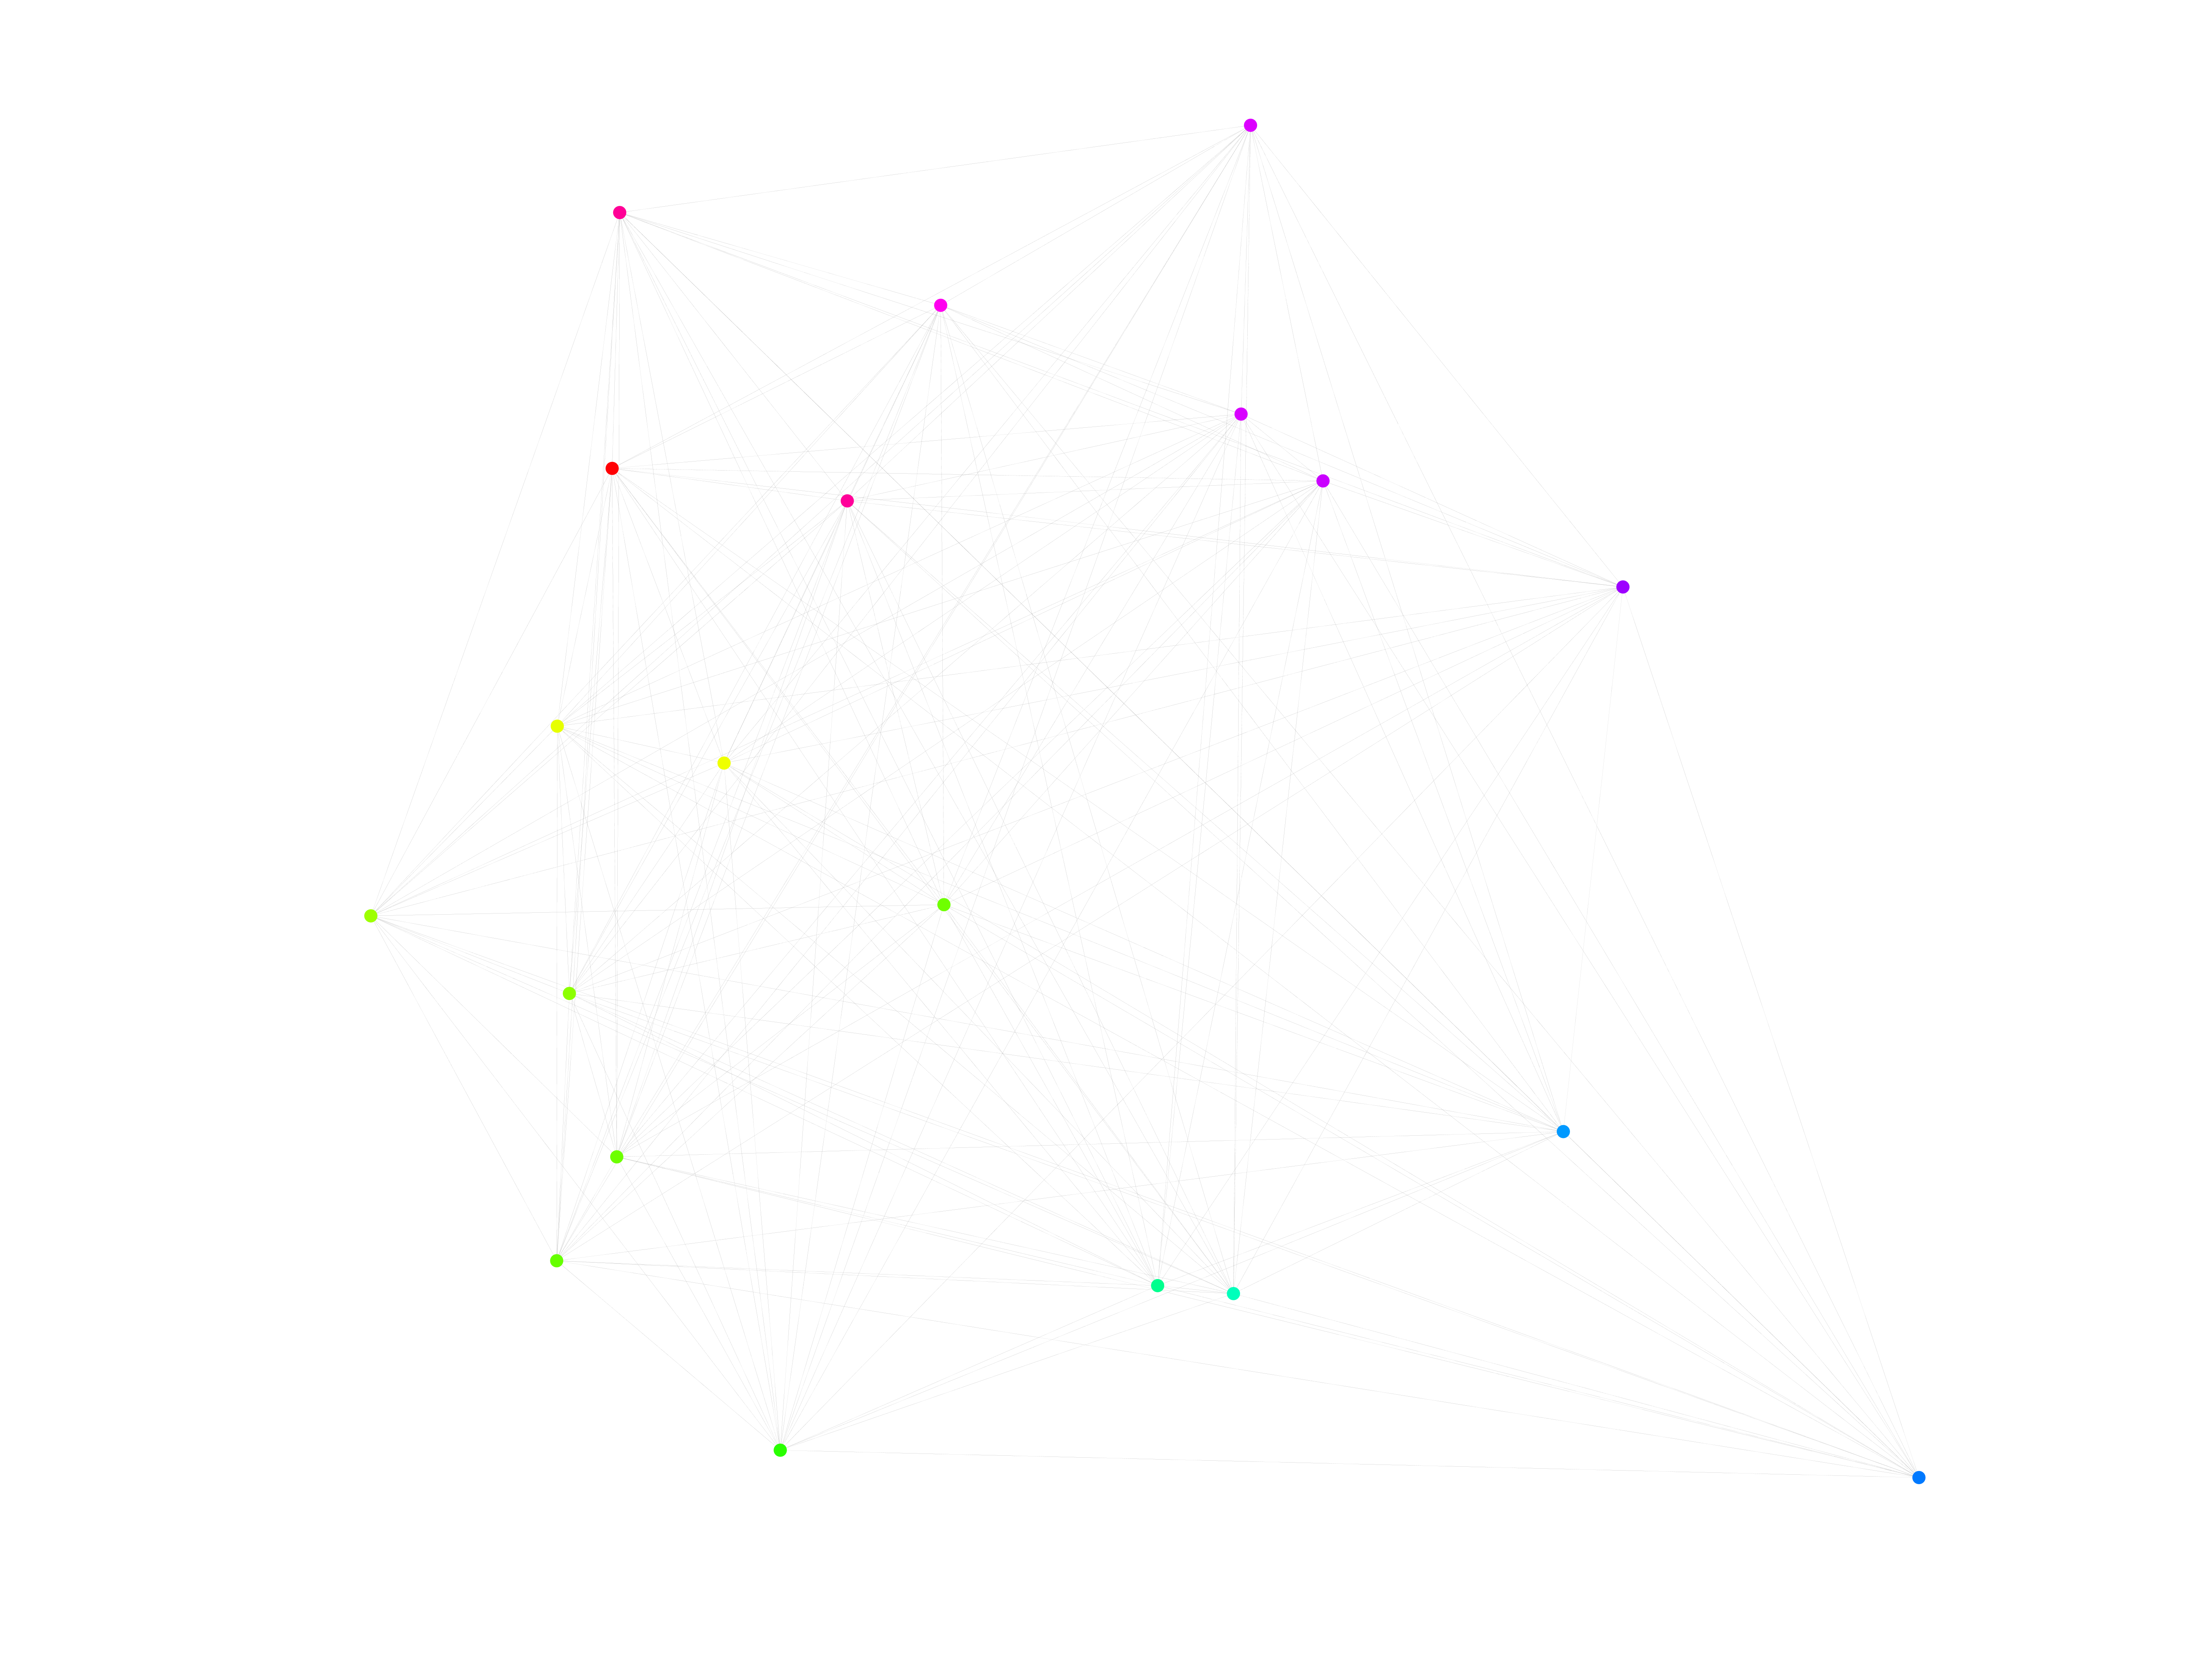
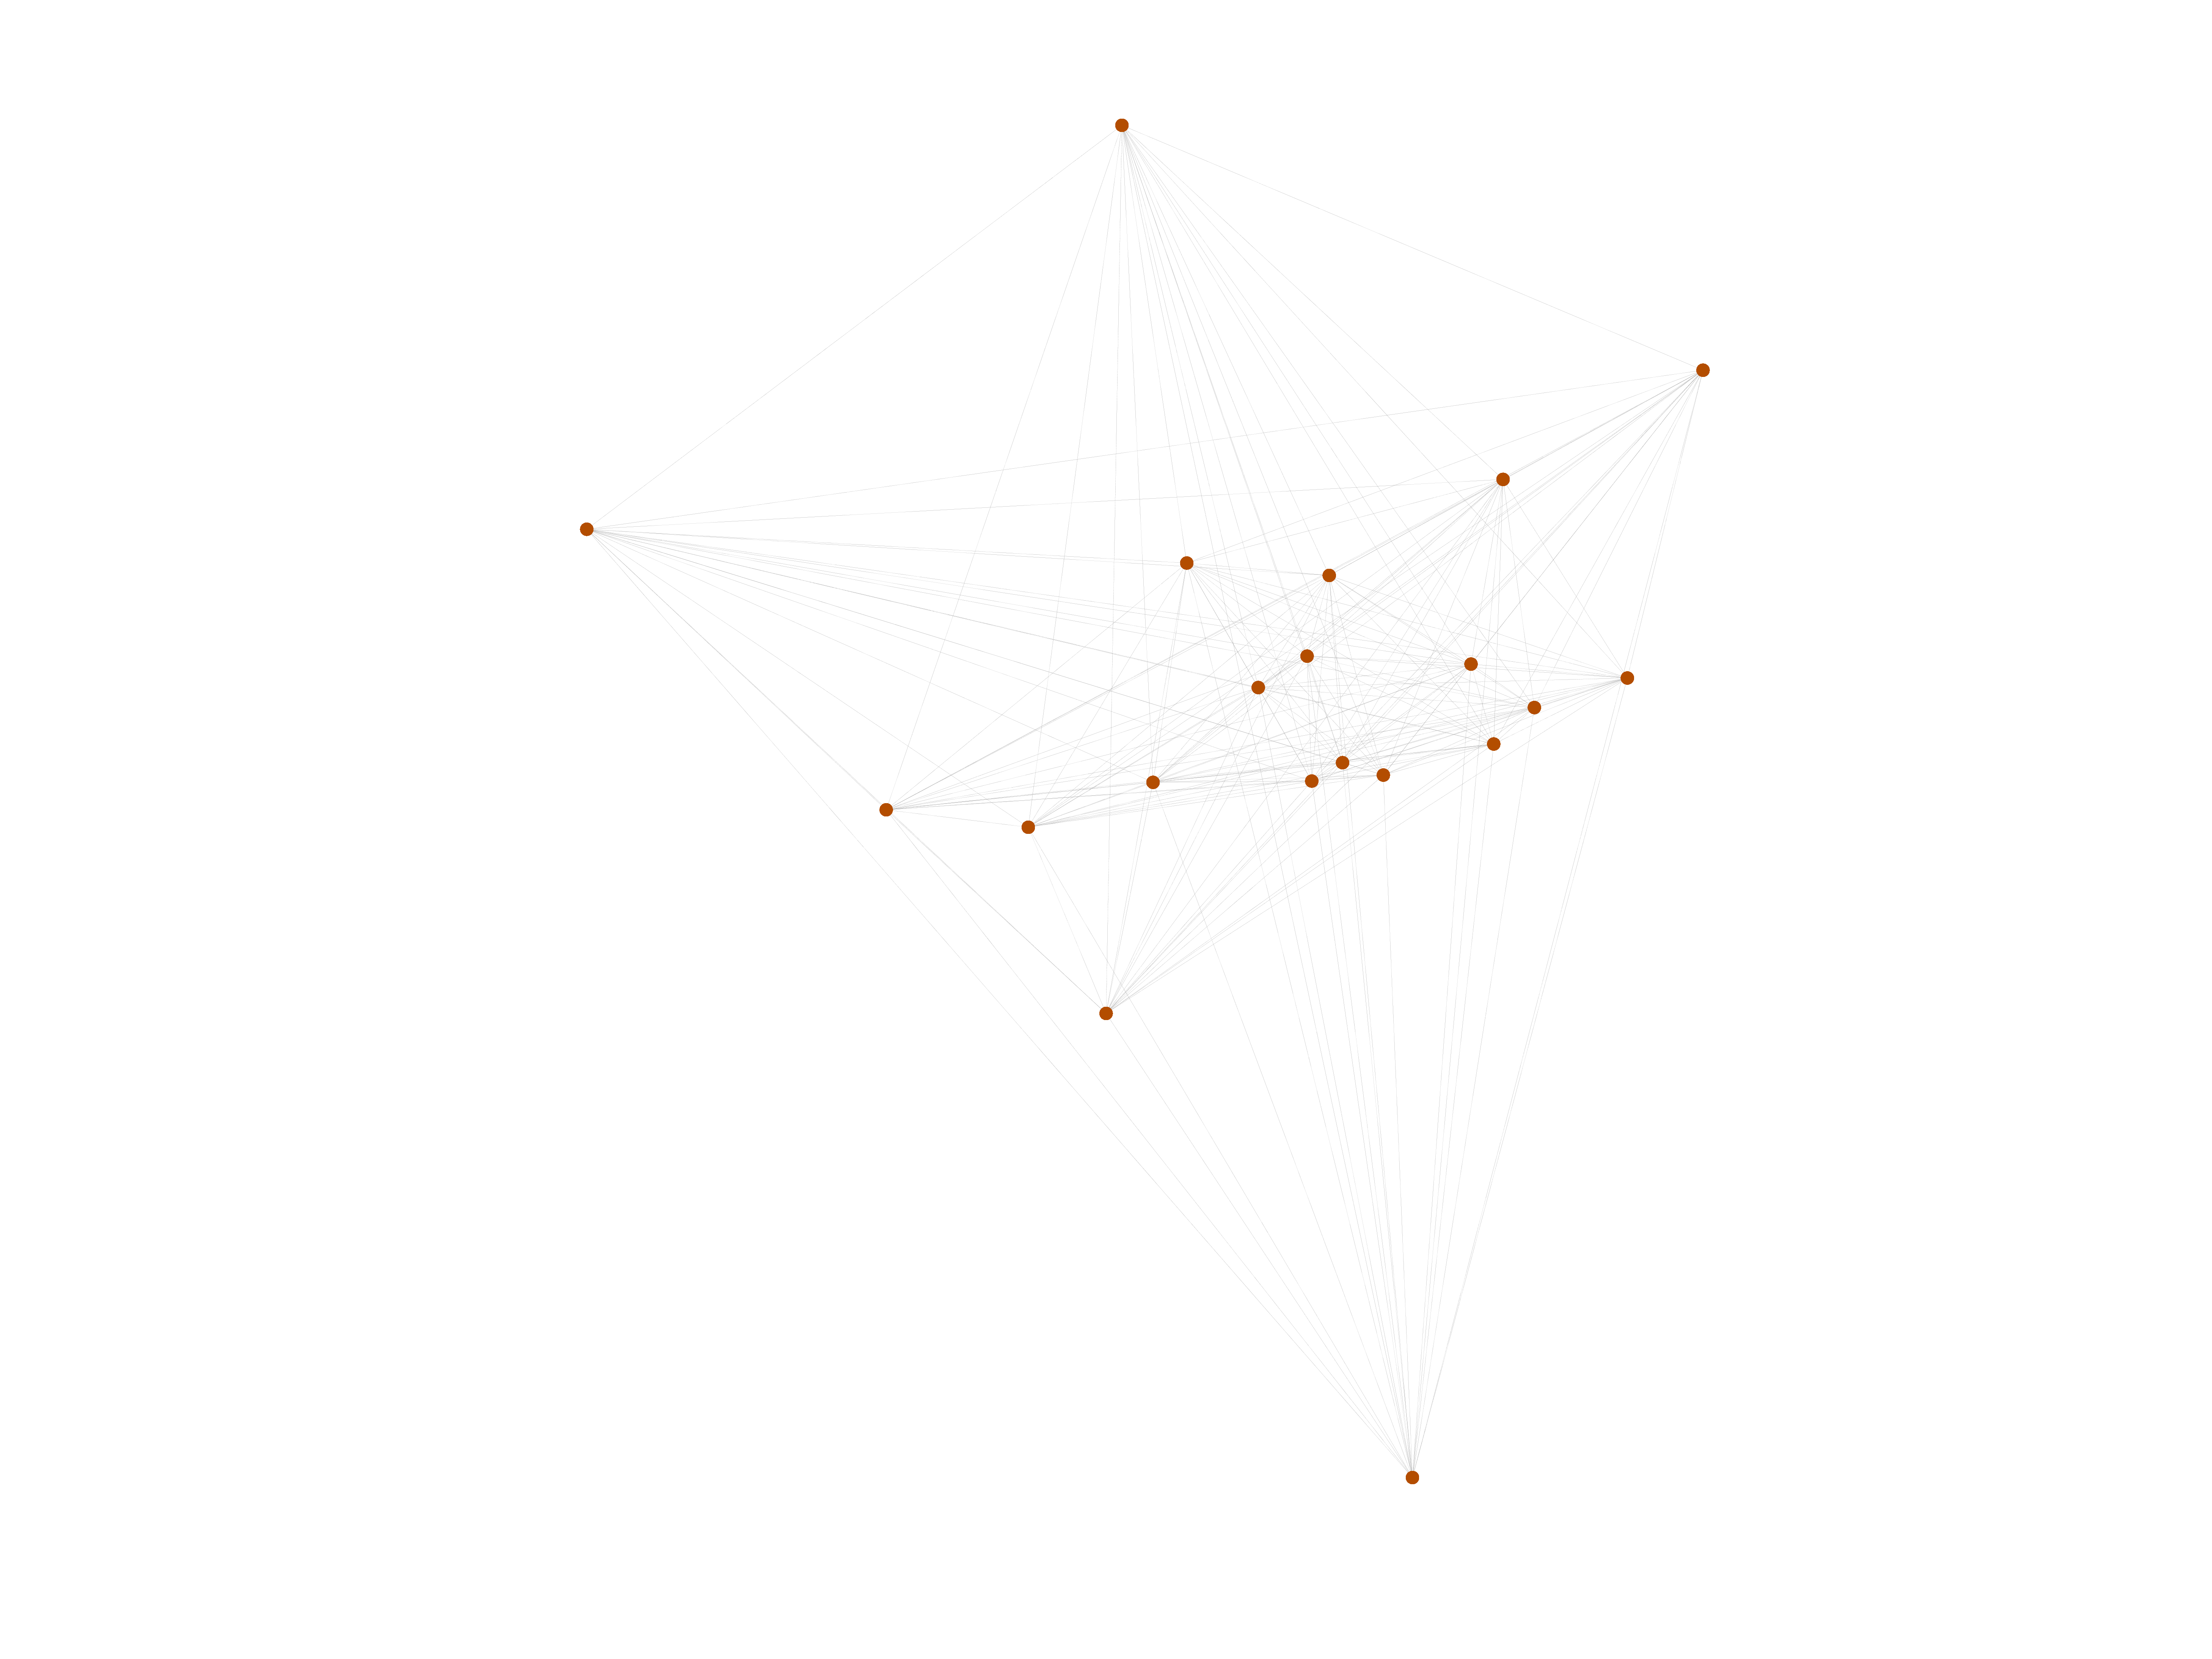
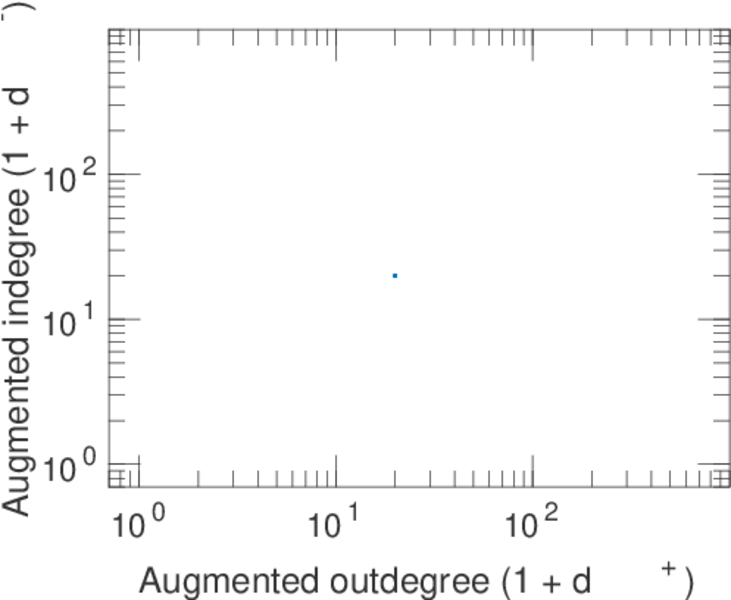
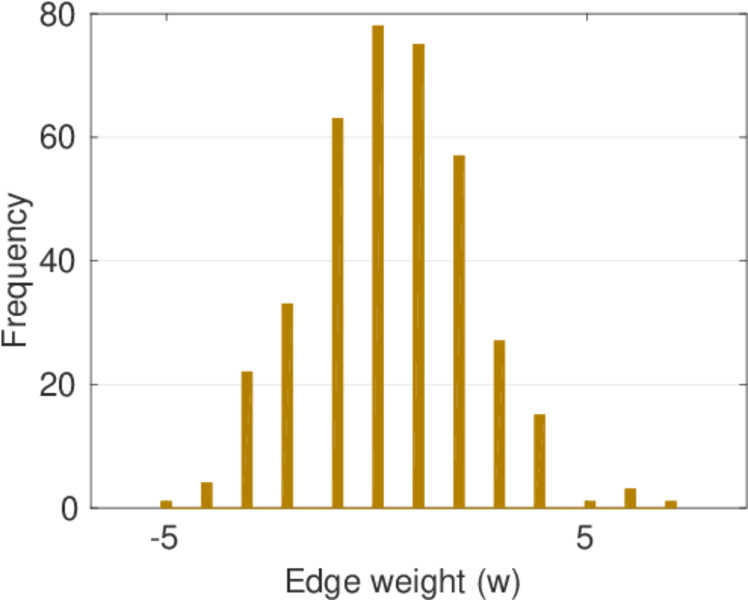
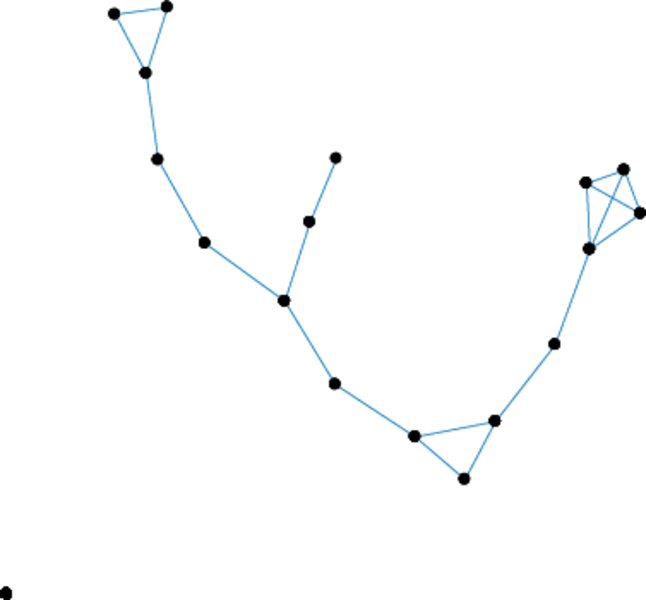
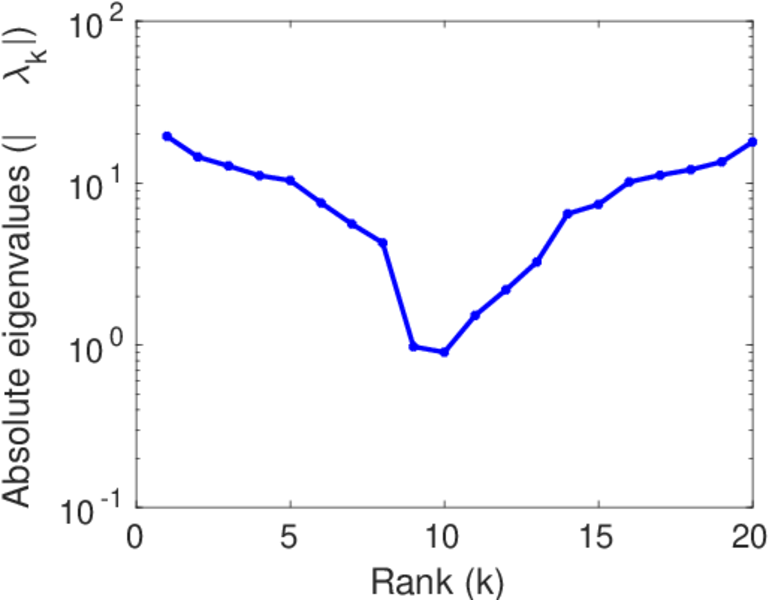
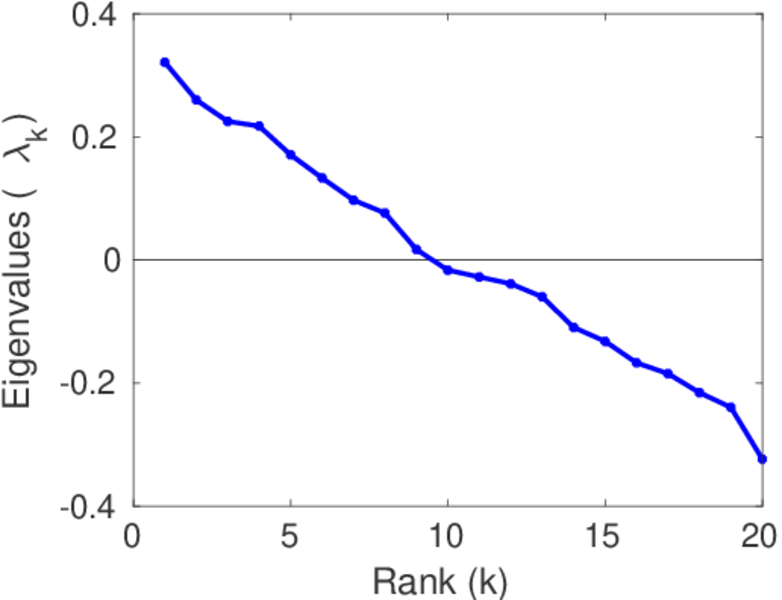
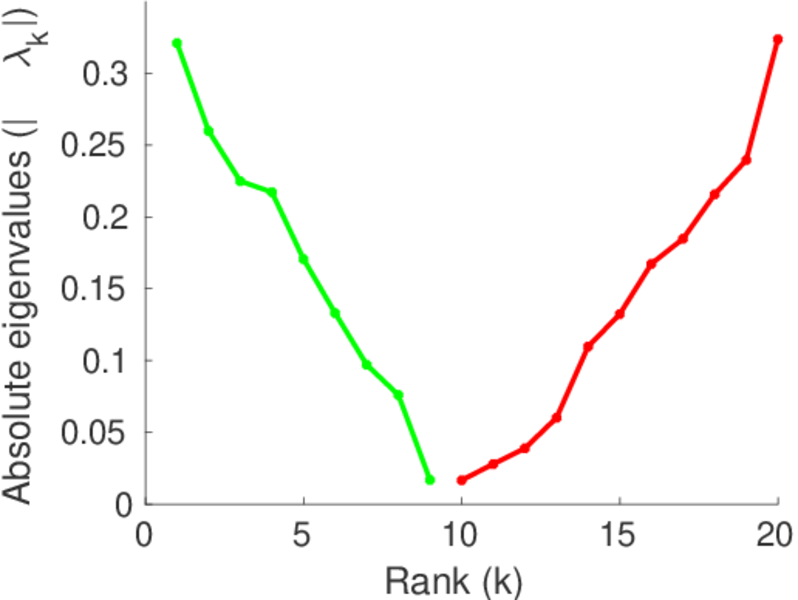
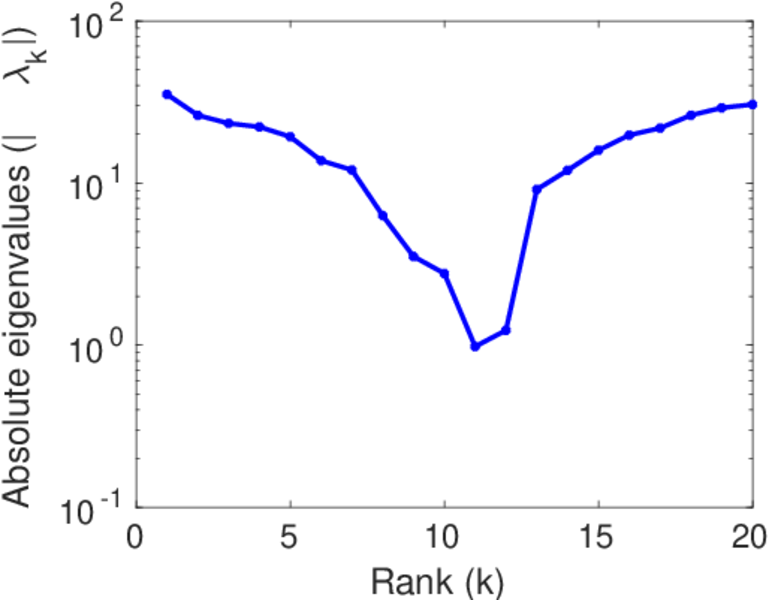
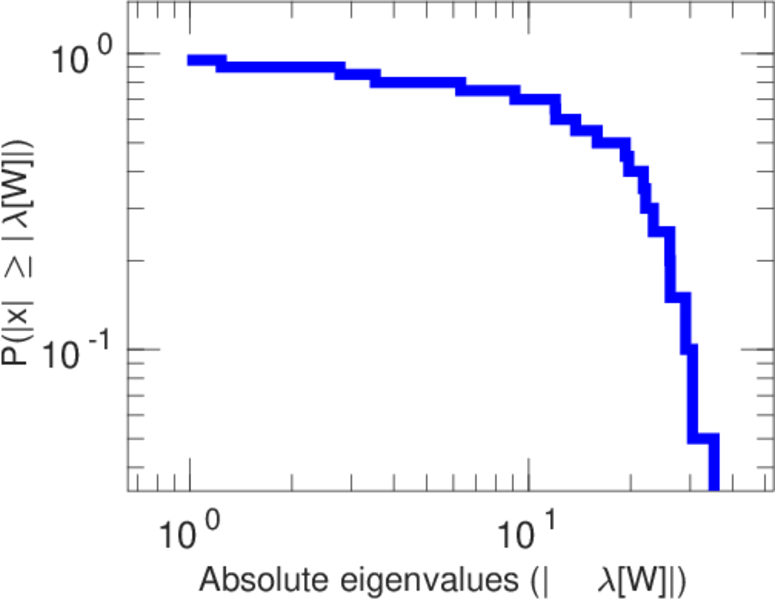
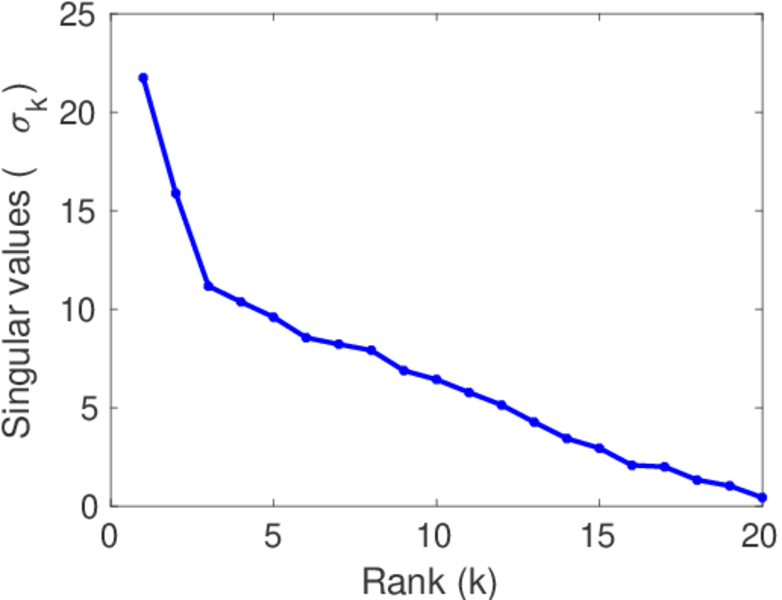
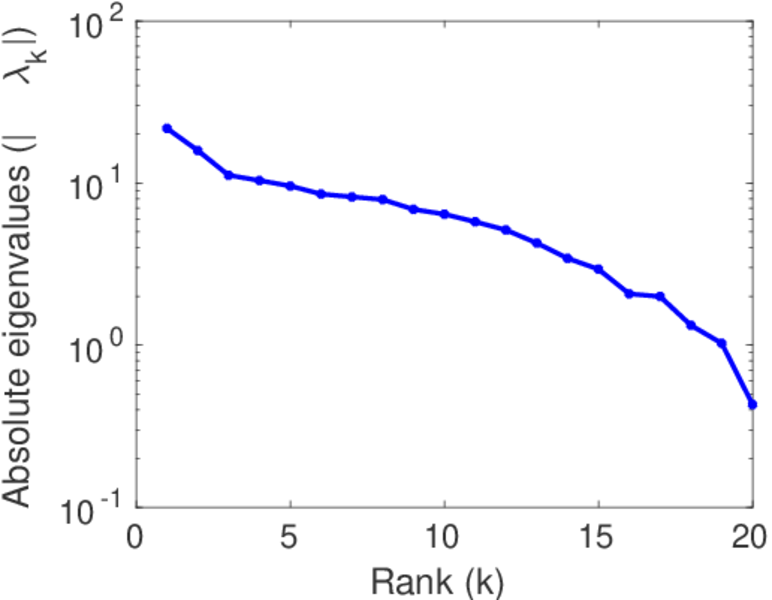
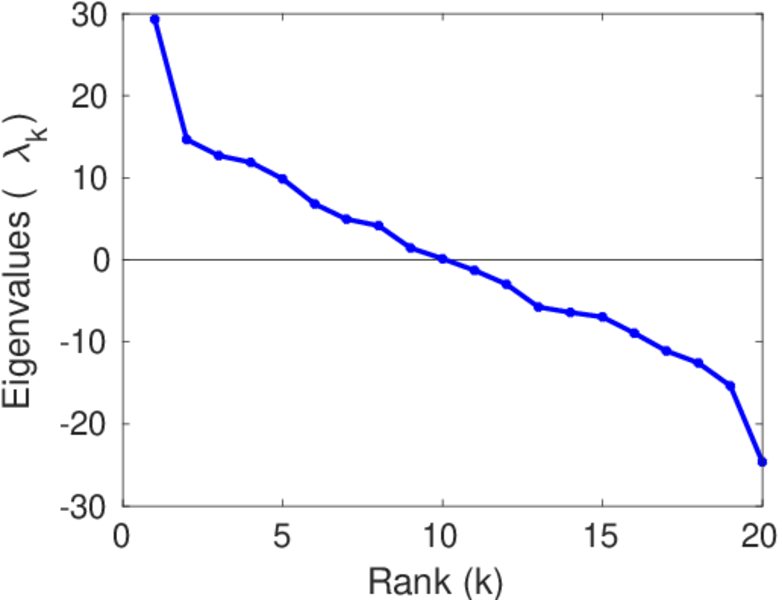
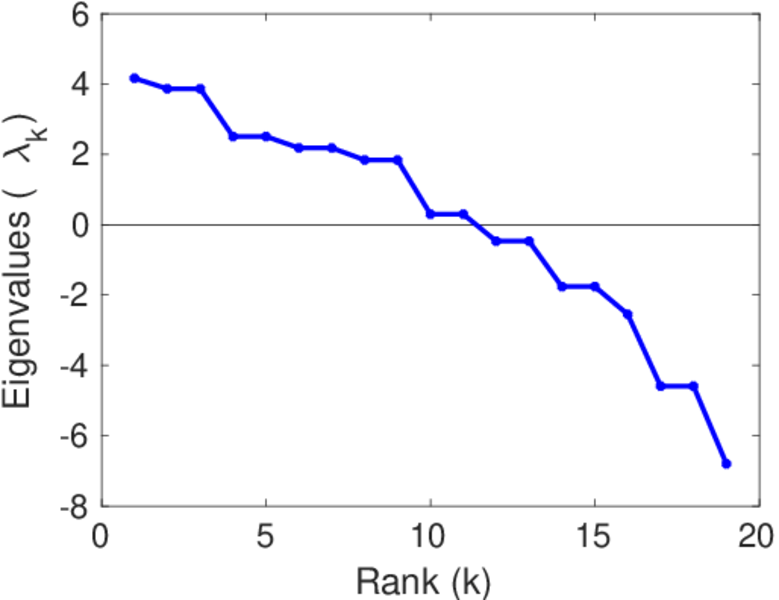
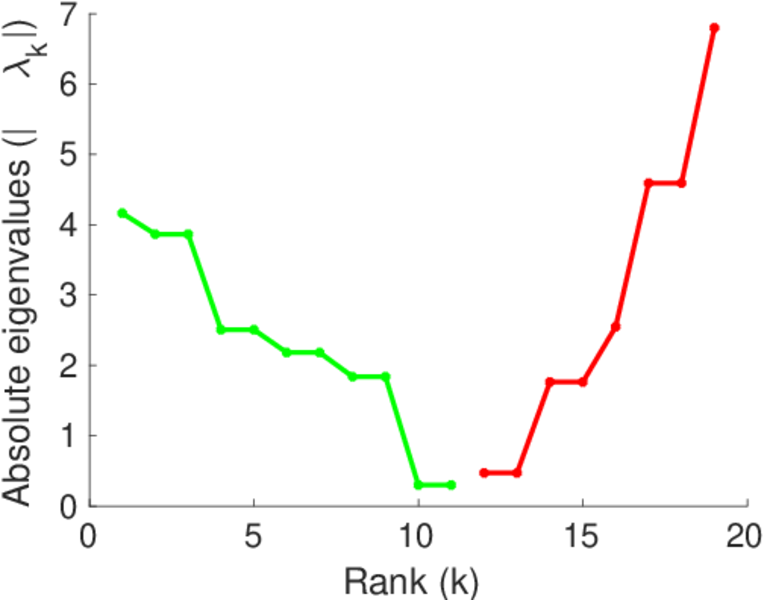
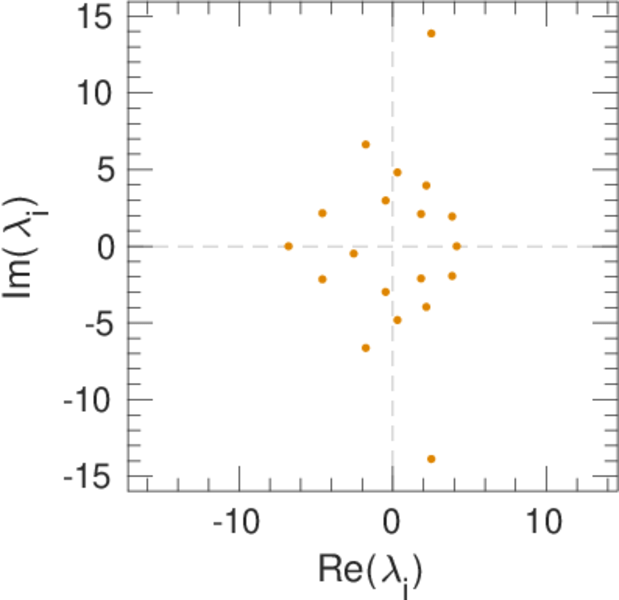
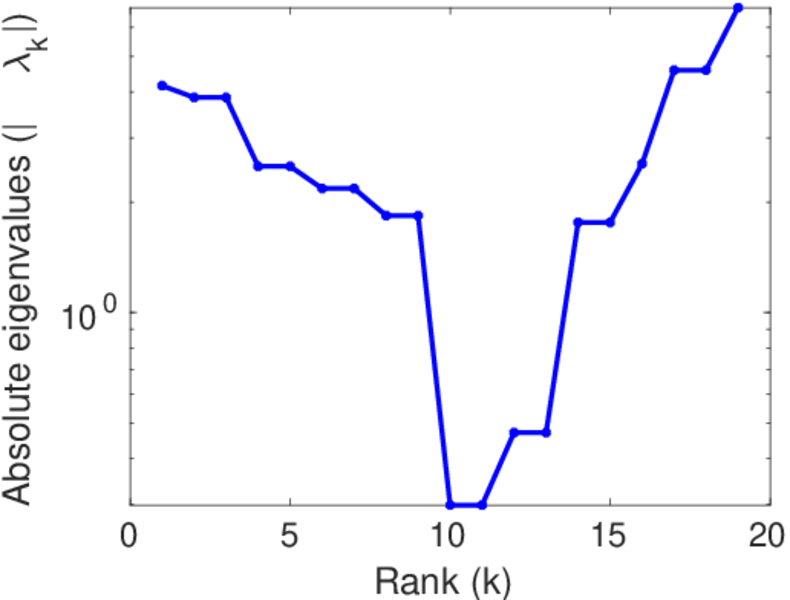
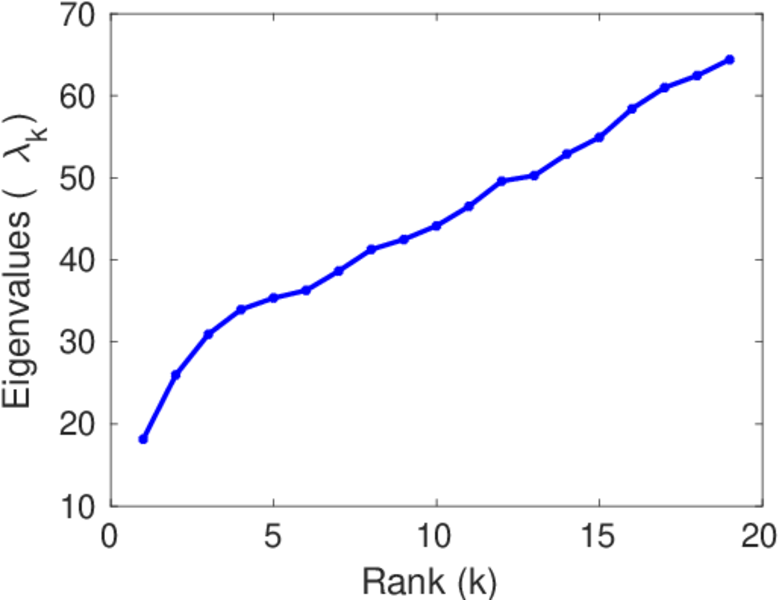
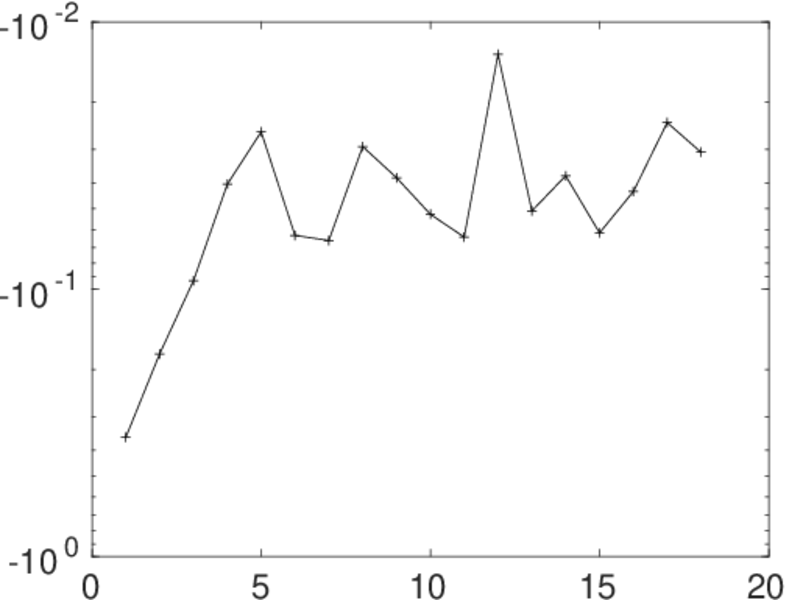
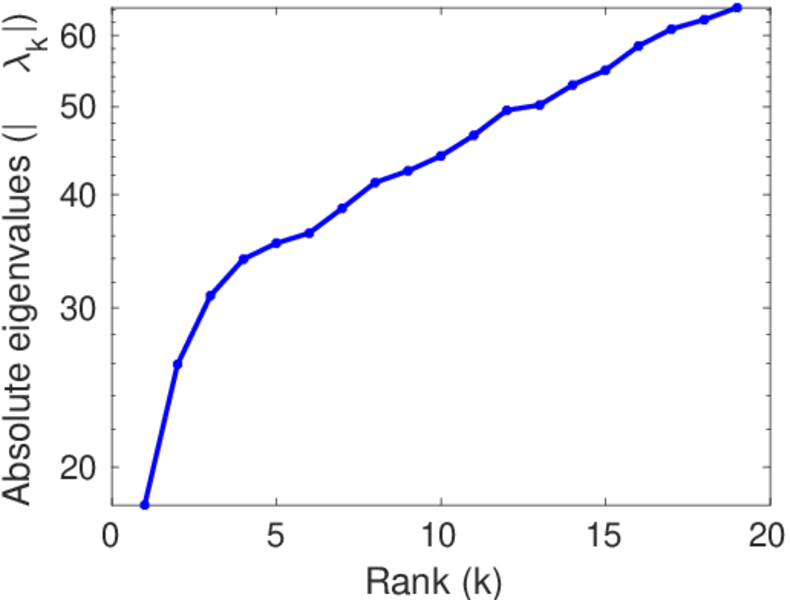
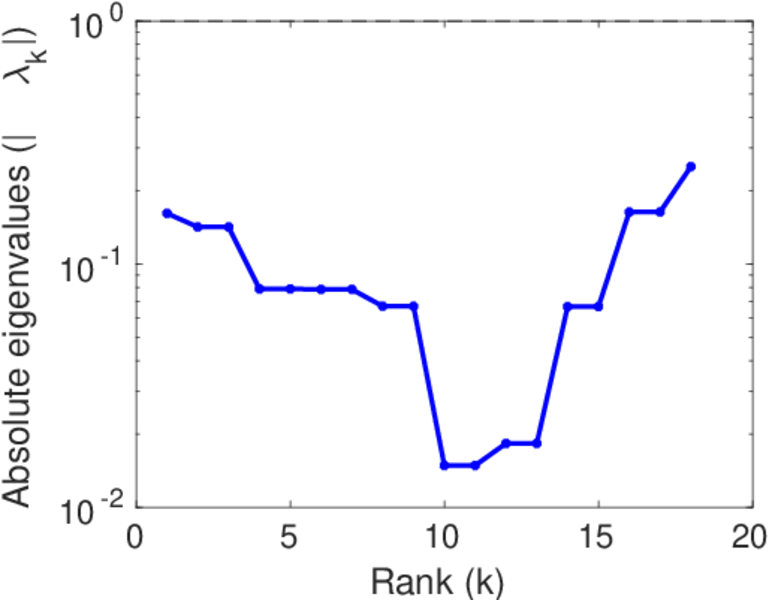
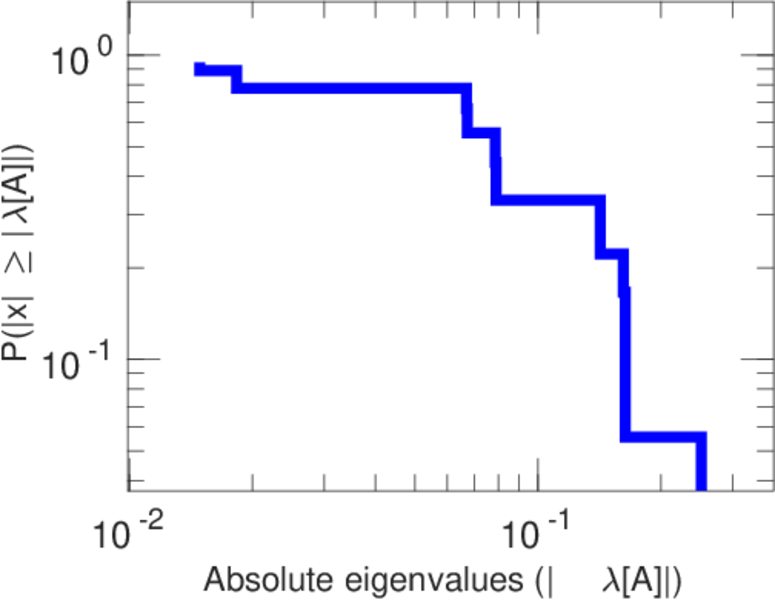
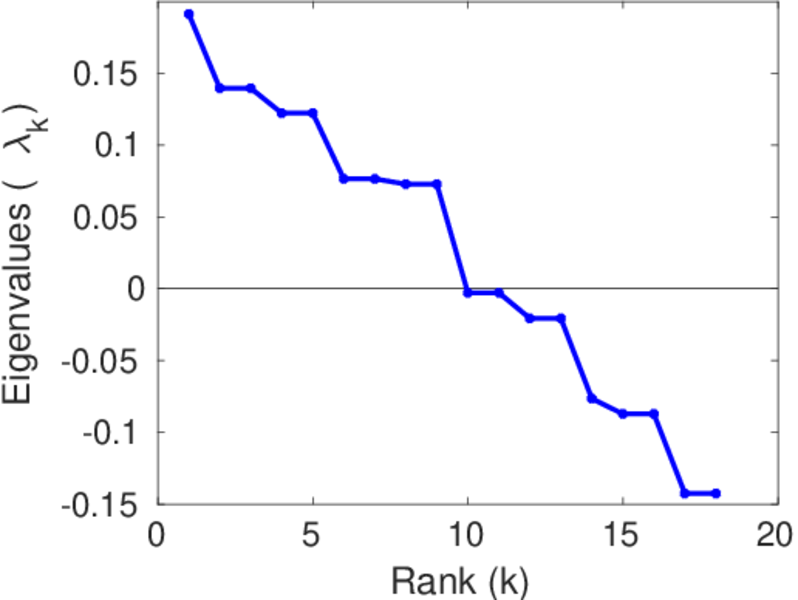
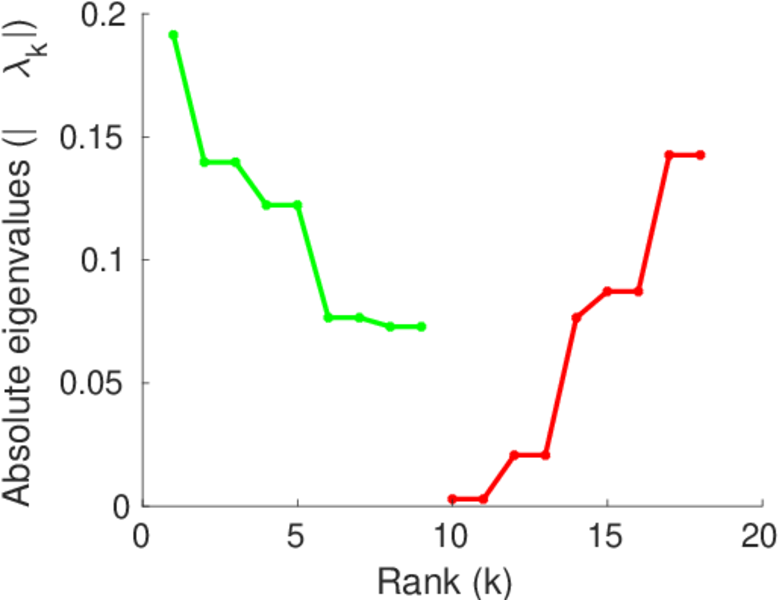
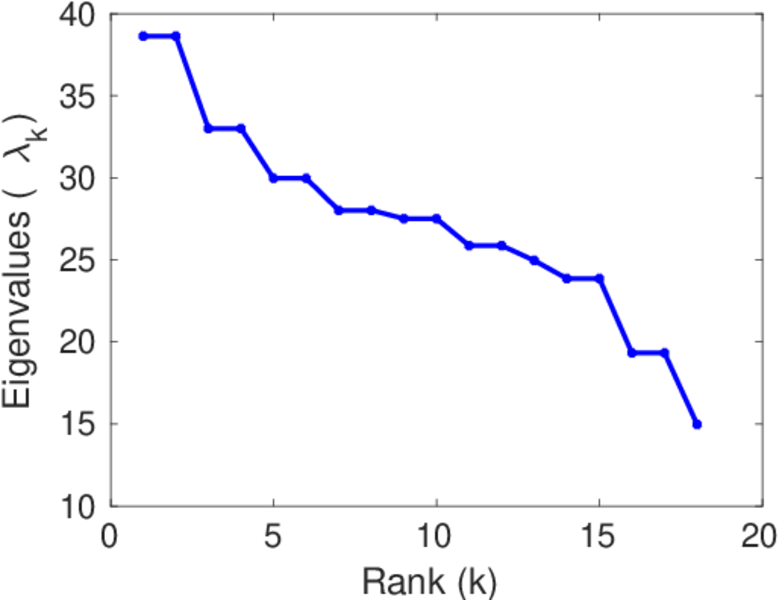
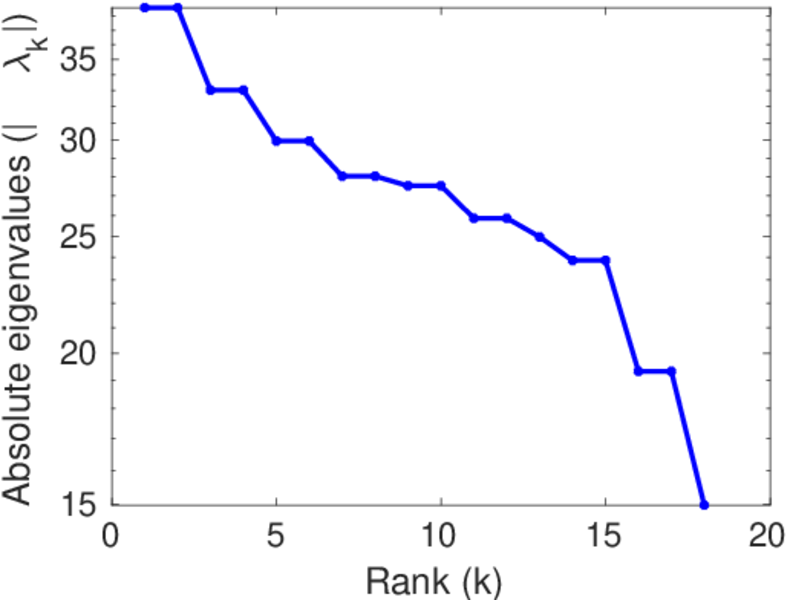
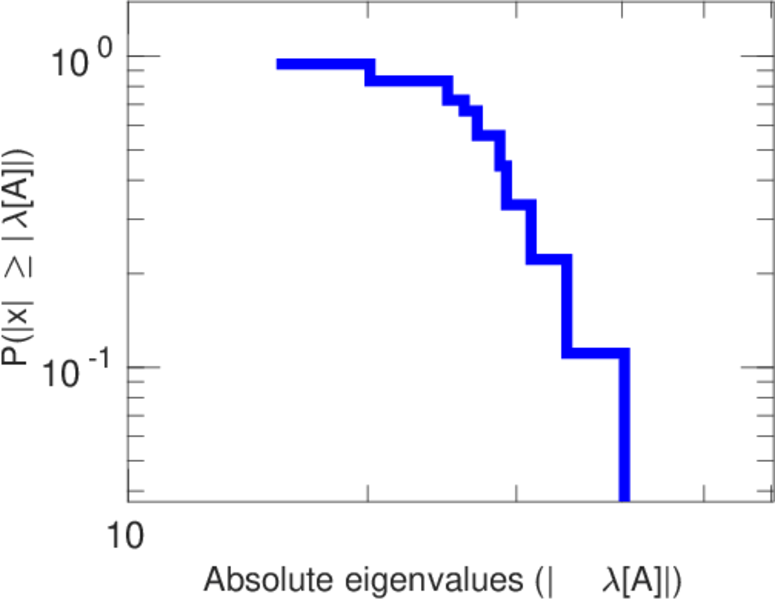
These are results of football games in England and Wales from the Premier League in the season 2013/2014, in form of a directed, signed graph. Nodes are teams, and each directed edge from A to B denotes that team A played at home against team B. The edge weights are the goal difference, and thus positive if the home team wins, negative when the away team wins, and zero for a draw. The exact game results are not represented; only the goal differences are. The data was copied by hand from Wikipedia.
| Code | u3
| |
| Internal name | league-uk1-2013
| |
| Name | Premier League (2013/2014) | |
| Availability | Dataset is available for download | |
| Consistency check | Dataset passed all tests | |
| Category | Interaction network | |
| Dataset timestamp | 2013 ⋯ 2014 | |
| Node meaning | Team | |
| Edge meaning | Game | |
| Network format | Unipartite, directed | |
| Edge type | Signed, possibly weighted, multiple edges | |
| Reciprocal | Contains reciprocal edges | |
| Directed cycles | Contains directed cycles | |
| Loops | Does not contain loops | |
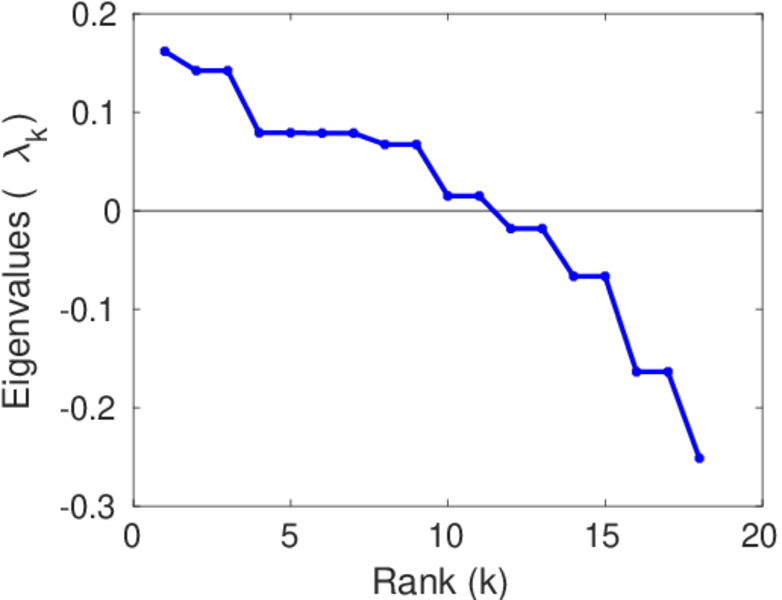
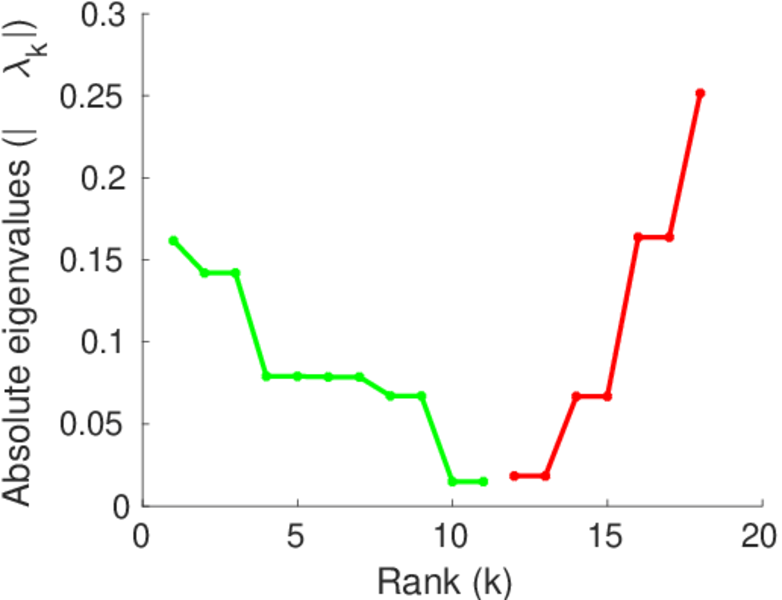
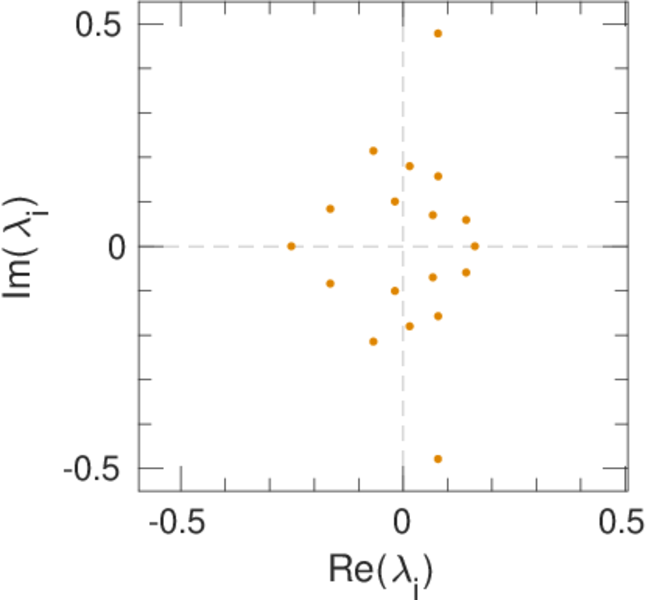
| Skew-symmetry | Inverted edges can be interpreted as negated edges | |
| Complete | Edges exist between all possible nodes | |
| Zero weights | Edges may have weight zero |


| [1] | Jérôme Kunegis. KONECT – The Koblenz Network Collection. In Proc. Int. Conf. on World Wide Web Companion, pages 1343–1350, 2013. [ http ] |
| [2] | Michaël Fanuel and Johan A. K. Suykens. Deformed Laplacians and spectral ranking in directed networks. Applied and Computational Harmonic Analysis, 2017. In press. |