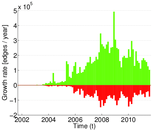
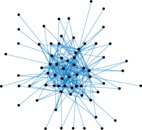
Wikipedia dynamic (simple)
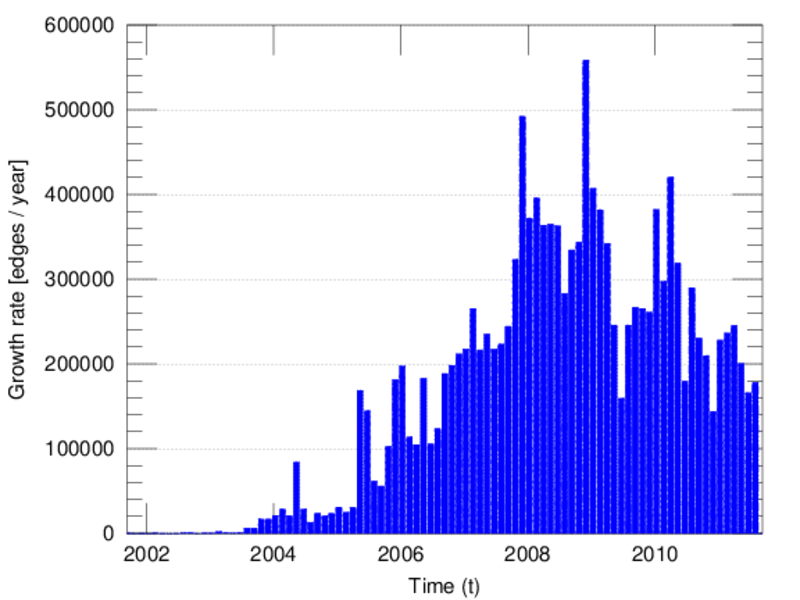
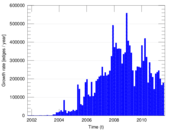
This network shows the evolution of hyperlinks between articles of the Simple
English Wikipedia. The nodes represent articles. An edge indicates that a
hyperlink was added or removed depending on the edge weight (−1 for removal
or +1 for addition).
Metadata
Statistics
| Size | n = | 100,312
|
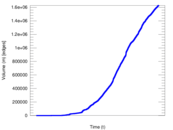
| Volume | m = | 1,627,472
|
| Unique edge count | m̿ = | 746,086
|
| Loop count | l = | 306
|
| Wedge count | s = | 320,147,664
|
| Claw count | z = | 422,387,316,406
|
| Cross count | x = | 834,653,587,495,453
|
| Triangle count | t = | 2,020,060
|
| Square count | q = | 278,060,062
|
| 4-Tour count | T4 = | 3,276,402,818
|
| Maximum degree | dmax = | 33,633
|
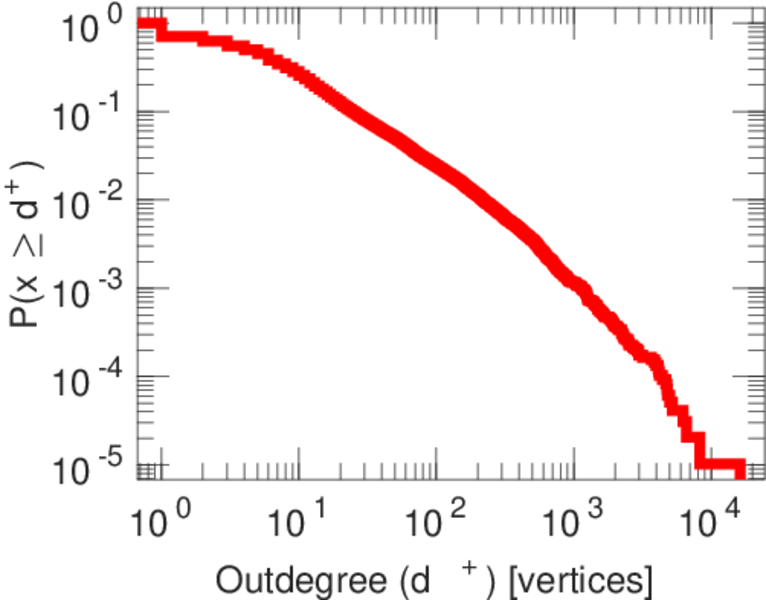
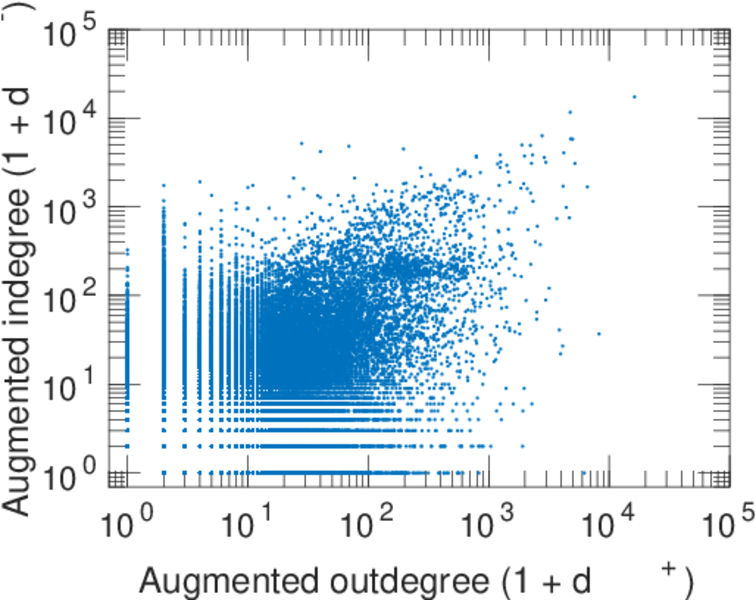
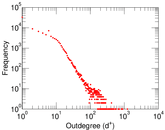
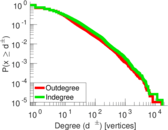
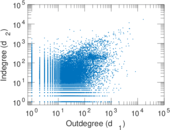
| Maximum outdegree | d+max = | 16,280
|
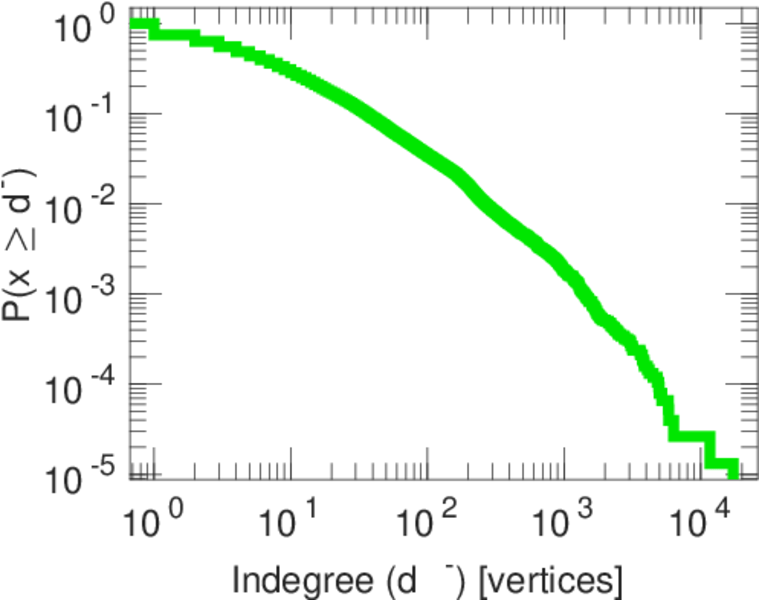
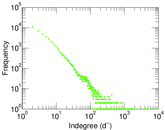
| Maximum indegree | d−max = | 17,353
|
| Average degree | d = | 32.448 2
|
| Fill | p = | 7.501 46 × 10−5
|
| Average edge multiplicity | m̃ = | 2.181 35
|
| Size of LCC | N = | 99,636
|
| Size of LSCC | Ns = | 54,524
|
| Relative size of LSCC | Nrs = | 0.543 544
|
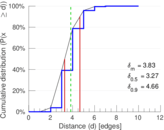
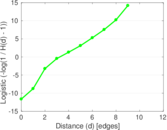
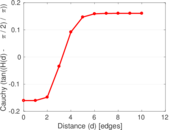
| Diameter | δ = | 12
|
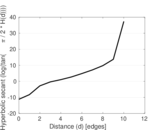
| 50-Percentile effective diameter | δ0.5 = | 3.274 16
|
| 90-Percentile effective diameter | δ0.9 = | 4.660 77
|
| Median distance | δM = | 4
|
| Mean distance | δm = | 3.830 55
|
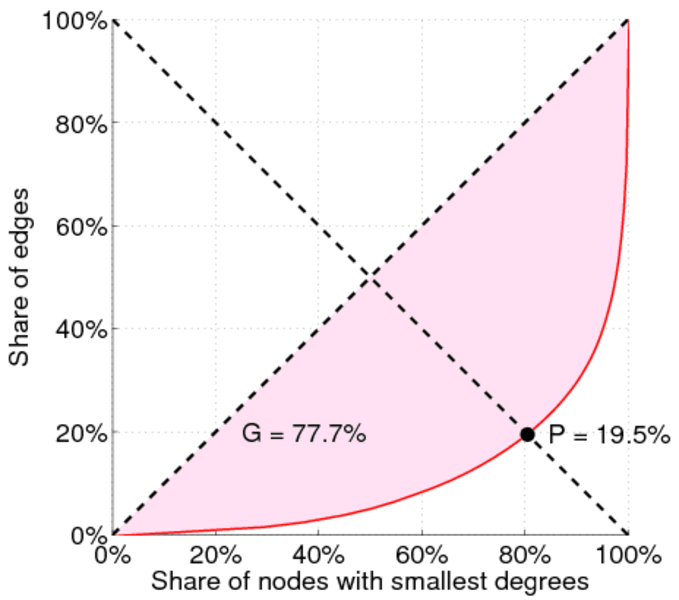
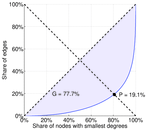
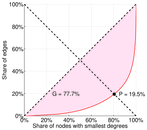
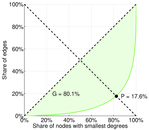
| Gini coefficient | G = | 0.695 197
|
| Balanced inequality ratio | P = | 0.236 269
|
| Outdegree balanced inequality ratio | P+ = | 0.259 175
|
| Indegree balanced inequality ratio | P− = | 0.194 740
|
| Relative edge distribution entropy | Her = | 0.888 087
|
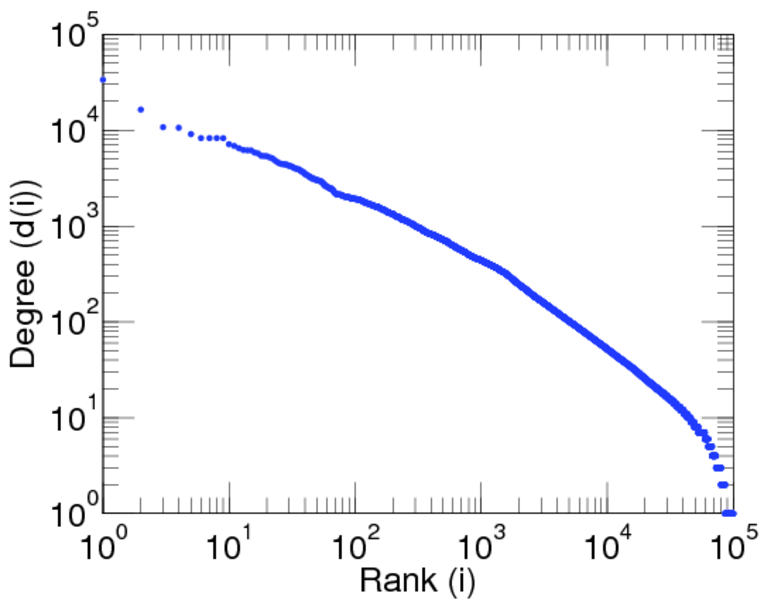
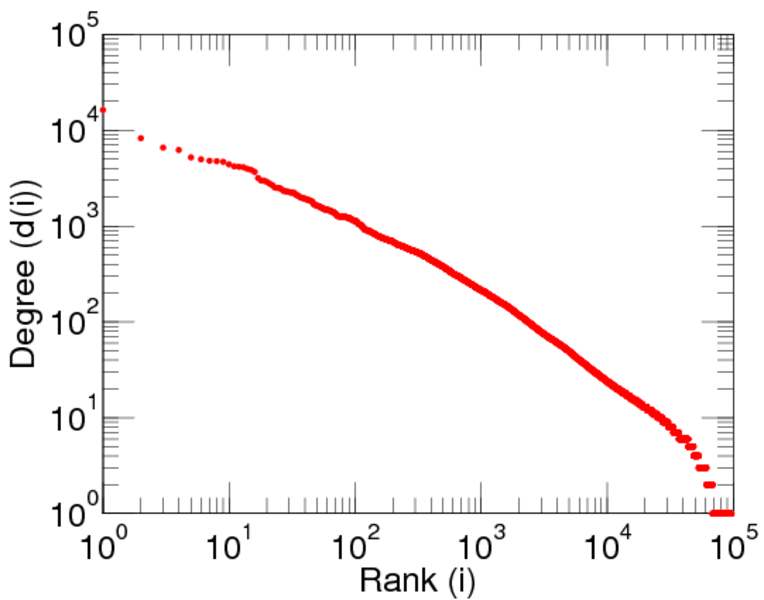
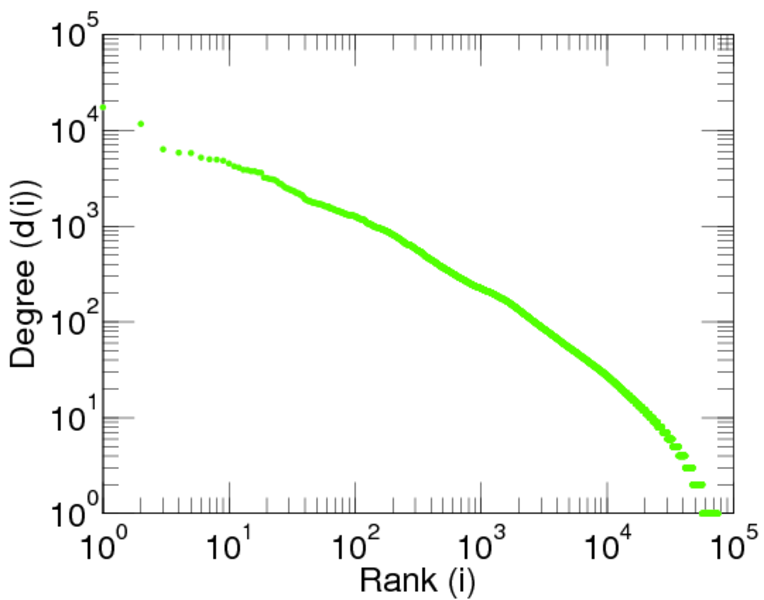
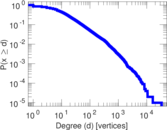
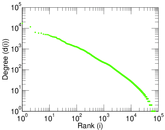
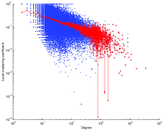
| Power law exponent | γ = | 1.596 15
|
| Tail power law exponent | γt = | 2.301 00
|
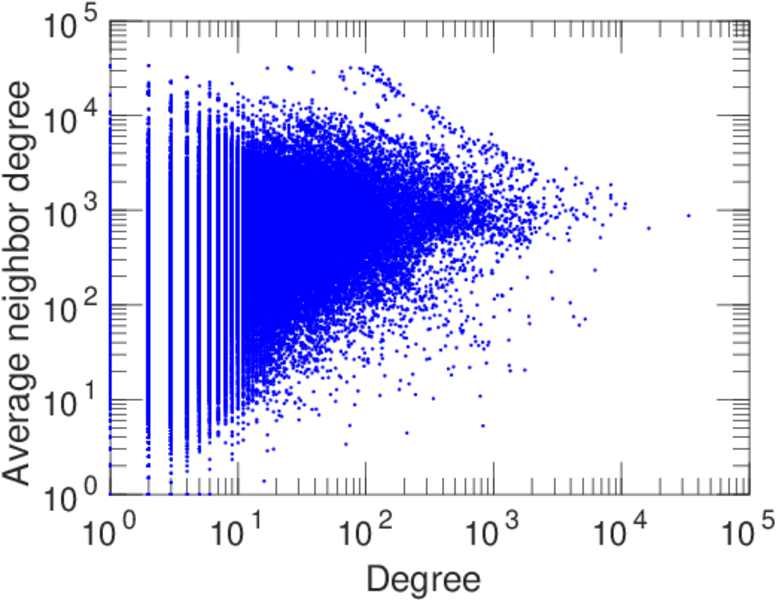
| Degree assortativity | ρ = | −0.070 451 9
|
| Degree assortativity p-value | pρ = | 0.000 00
|
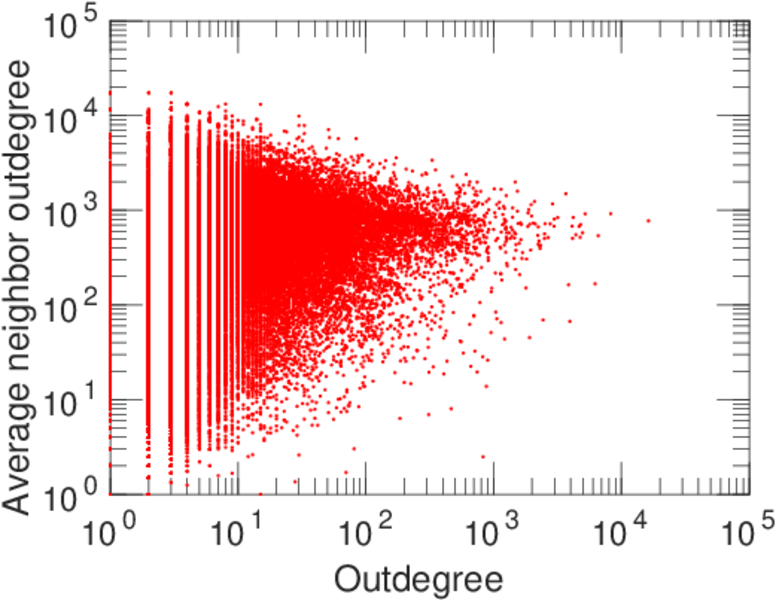
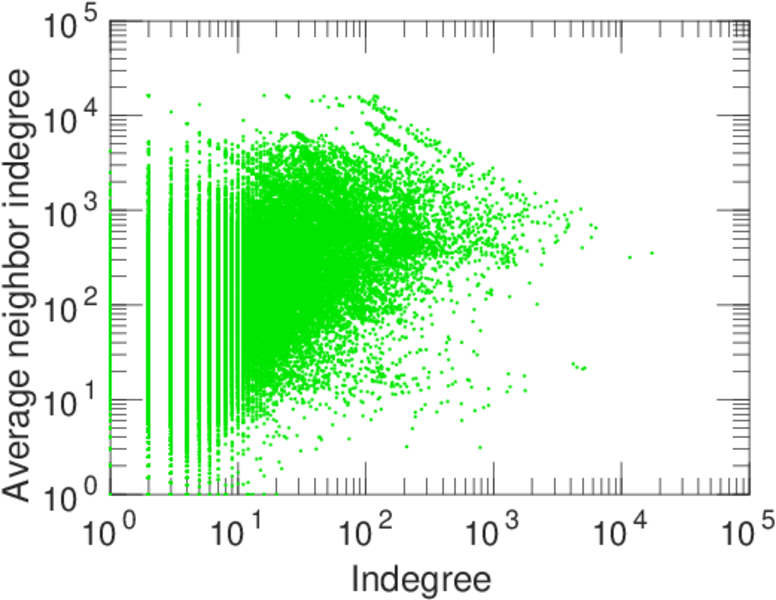
| In/outdegree correlation | ρ± = | +0.418 469
|
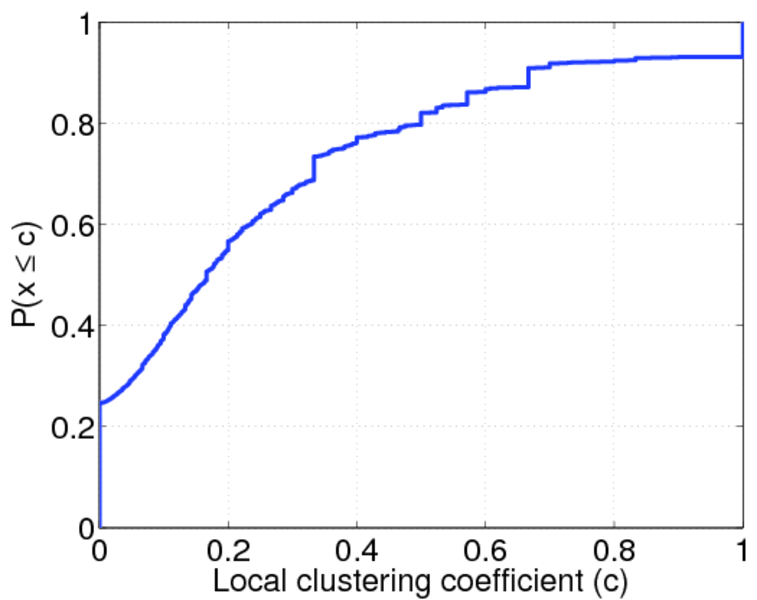
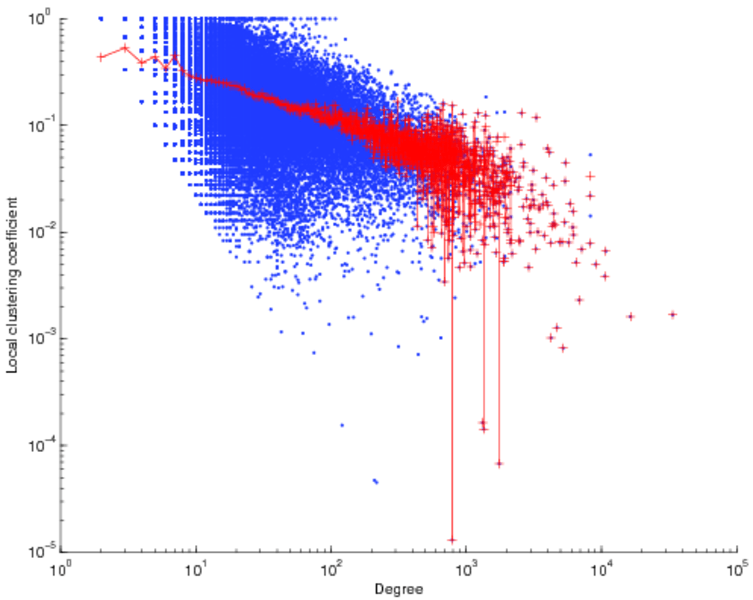
| Clustering coefficient | c = | 0.018 929 3
|
| Directed clustering coefficient | c± = | 0.050 361 1
|
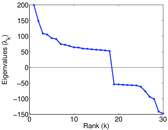
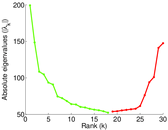
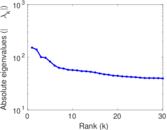
| Spectral norm | α = | 199.284
|
| Operator 2-norm | ν = | 147.945
|
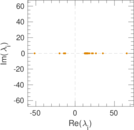
| Cyclic eigenvalue | π = | 65.652 3
|
| Algebraic connectivity | a = | 0.047 159 5
|
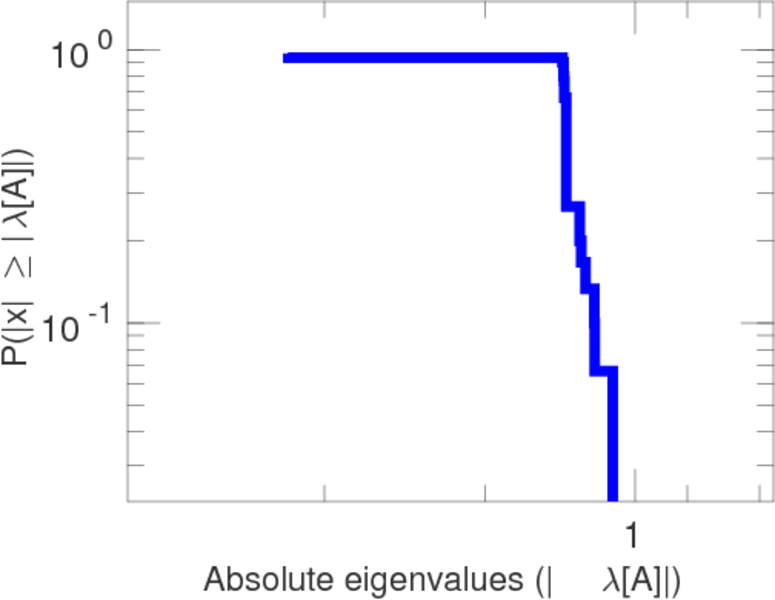
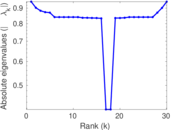
| Spectral separation | |λ1[A] / λ2[A]| = | 1.342 24
|
| Reciprocity | y = | 0.126 581
|
| Non-bipartivity | bA = | 0.260 291
|
| Normalized non-bipartivity | bN = | 0.024 180 5
|
| Algebraic non-bipartivity | χ = | 0.047 159 5
|
| Spectral bipartite frustration | bK = | 0.000 833 824
|
| Controllability | C = | 49,186
|
| Relative controllability | Cr = | 0.493 197
|
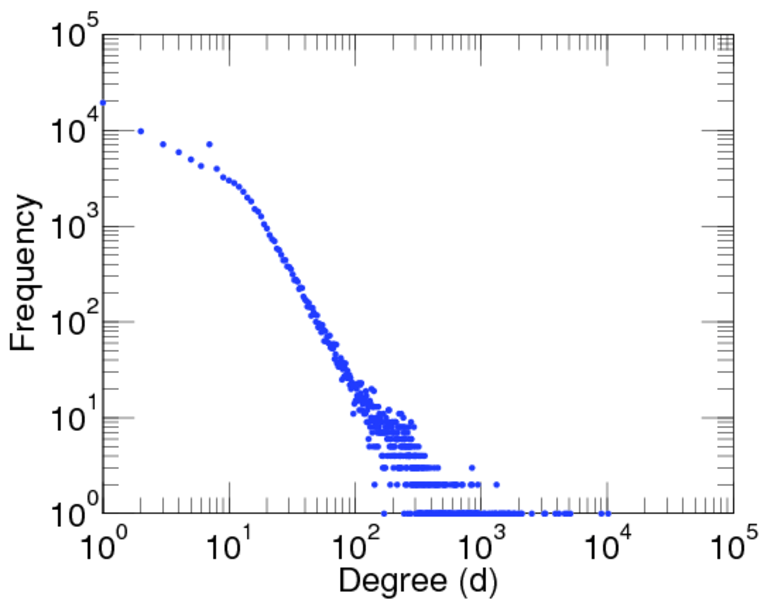
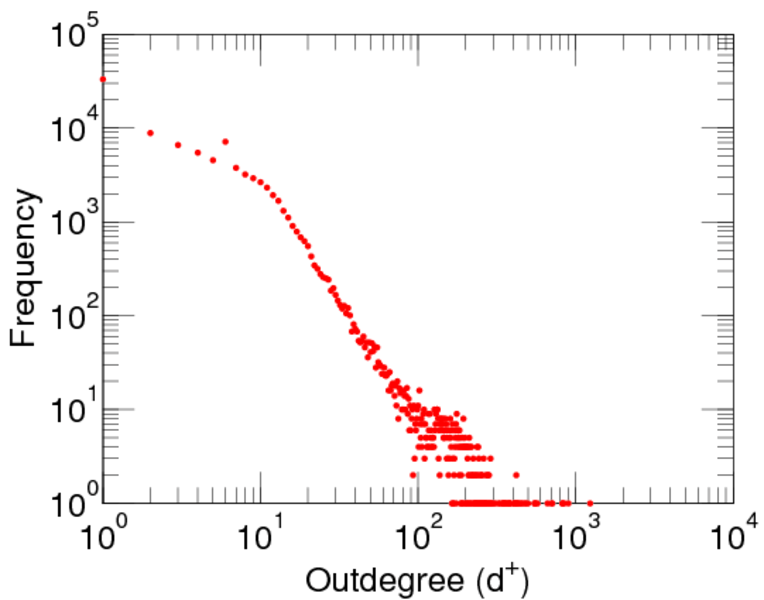
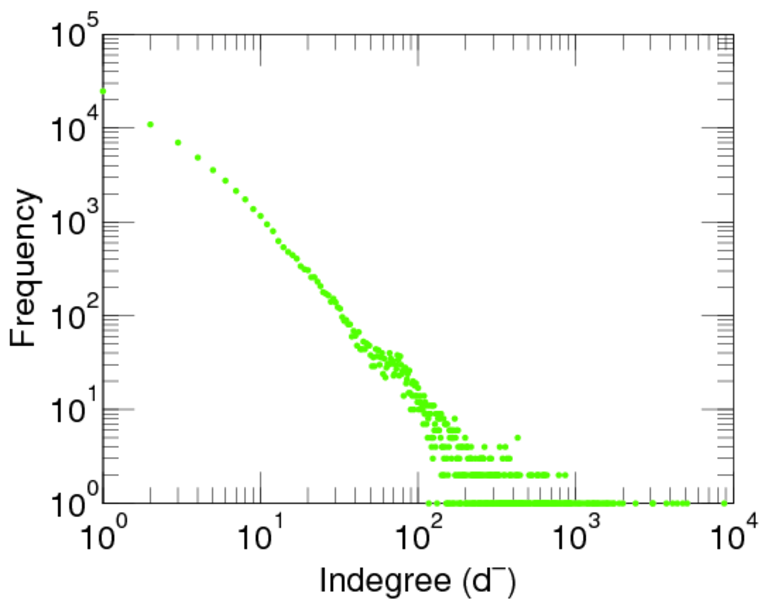
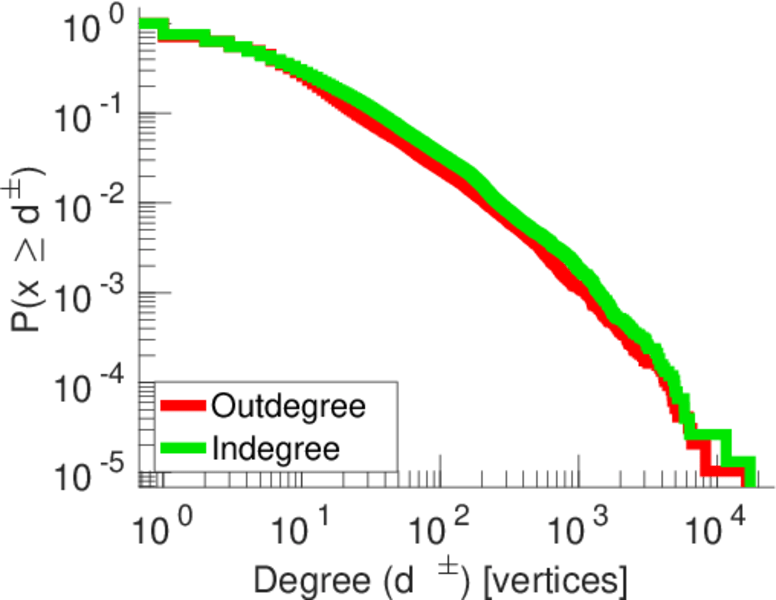
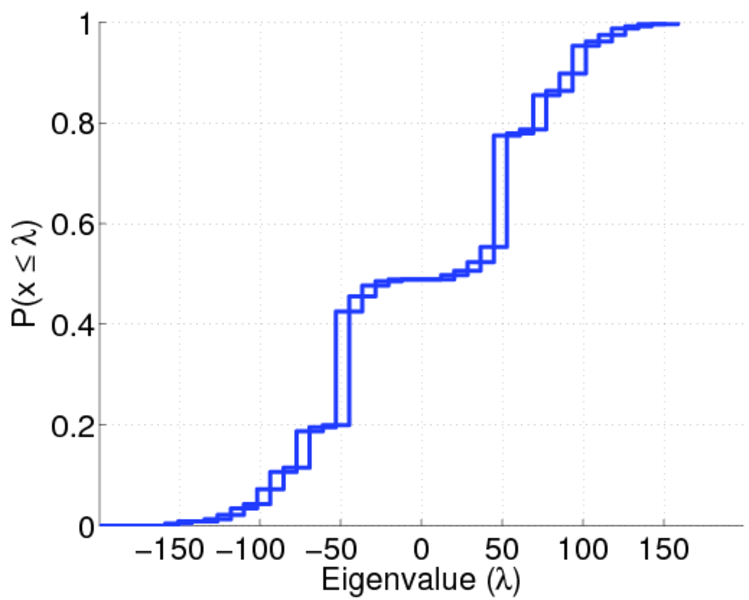
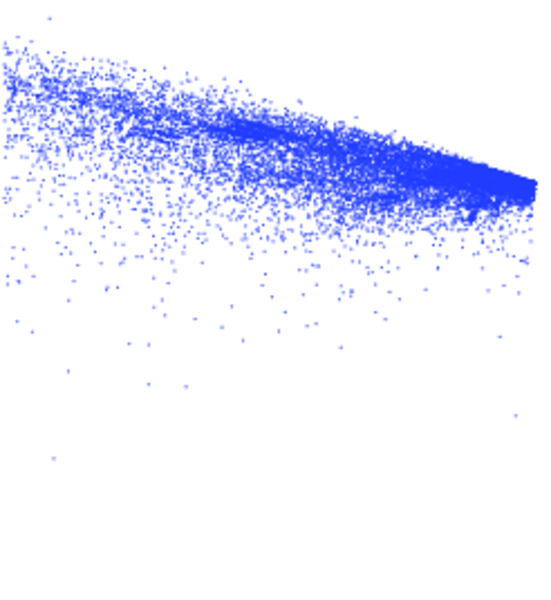
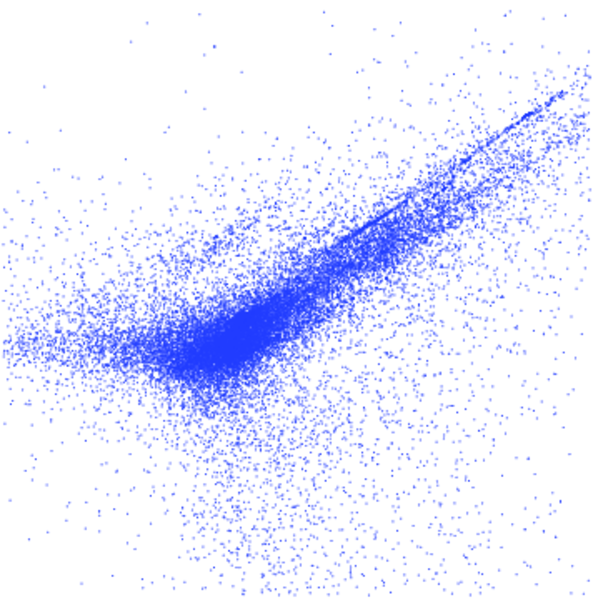
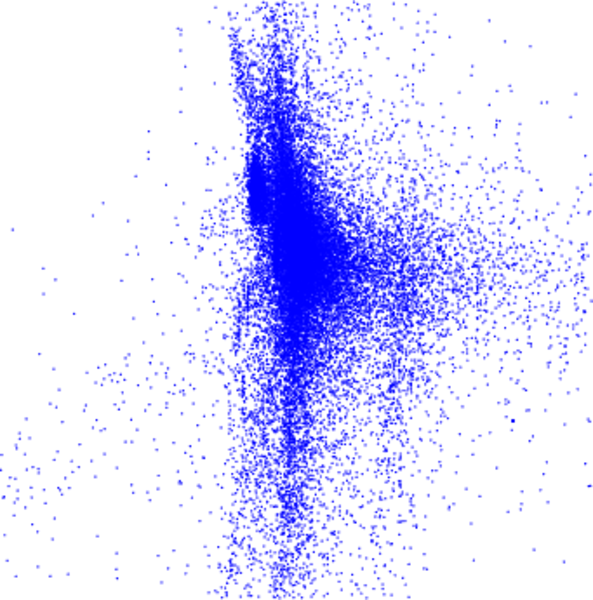
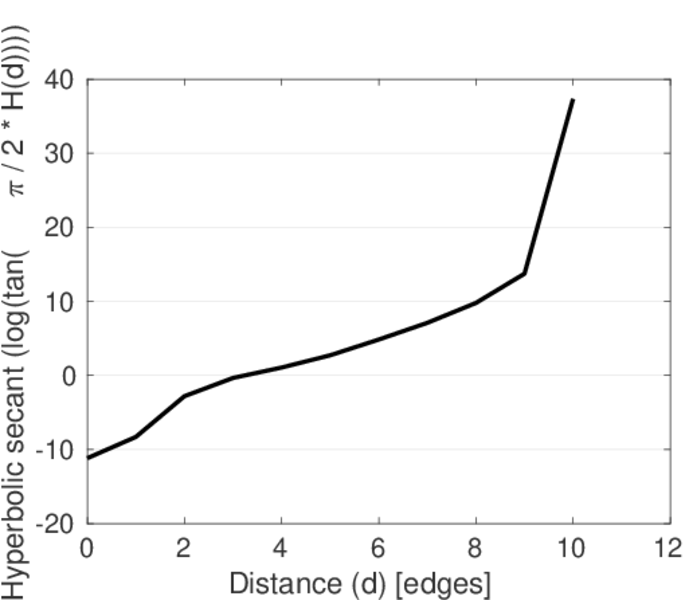
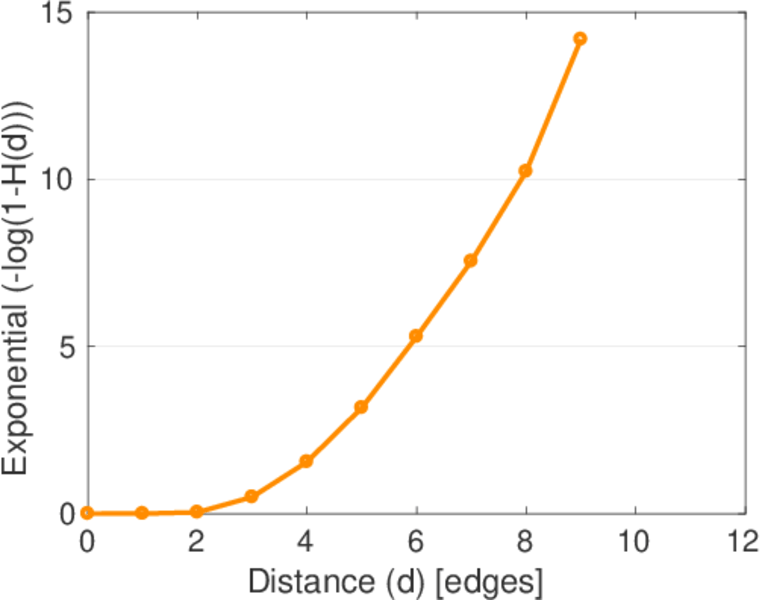
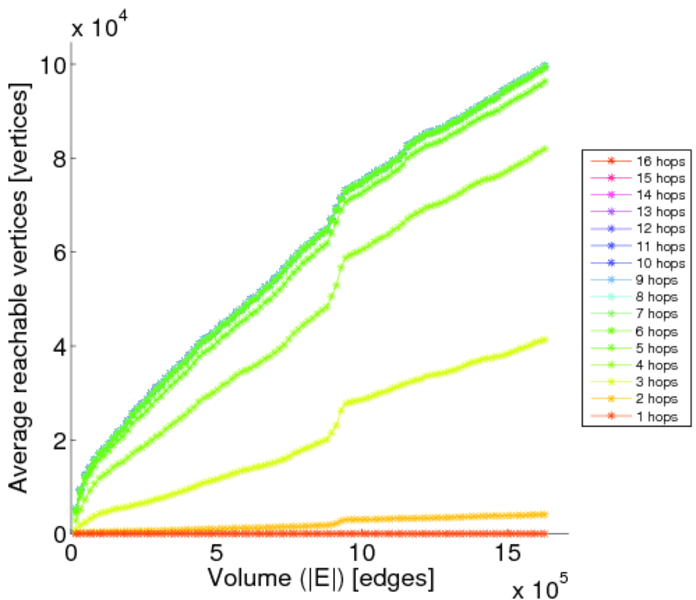
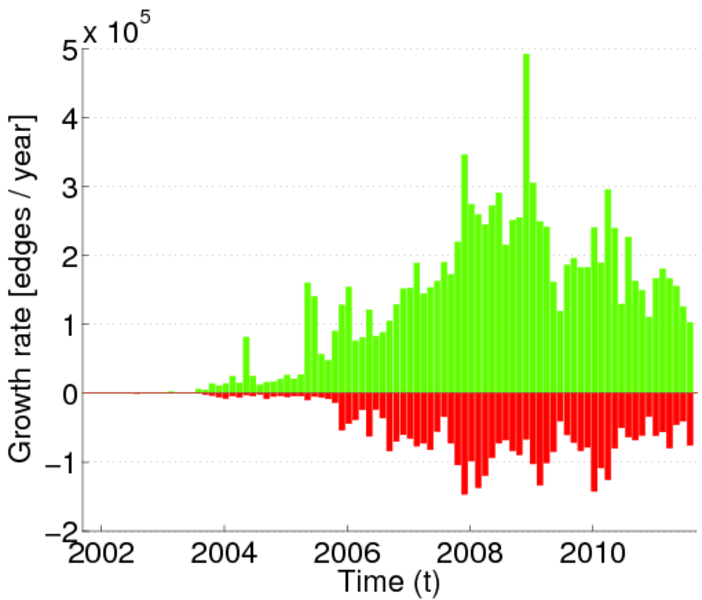
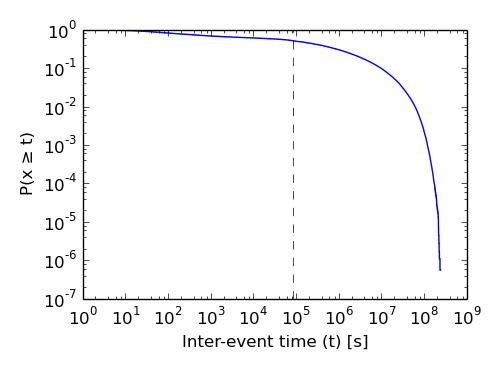
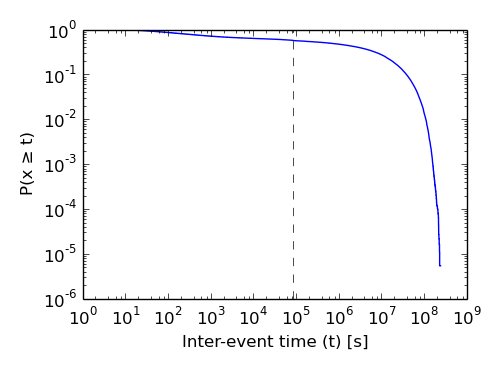
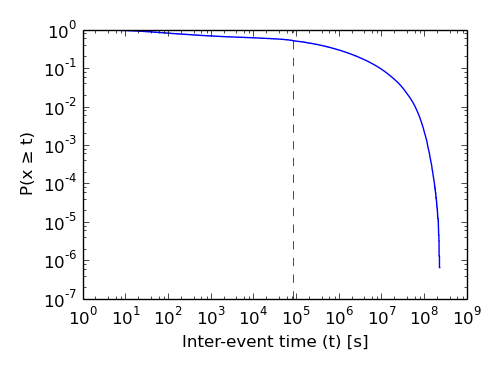
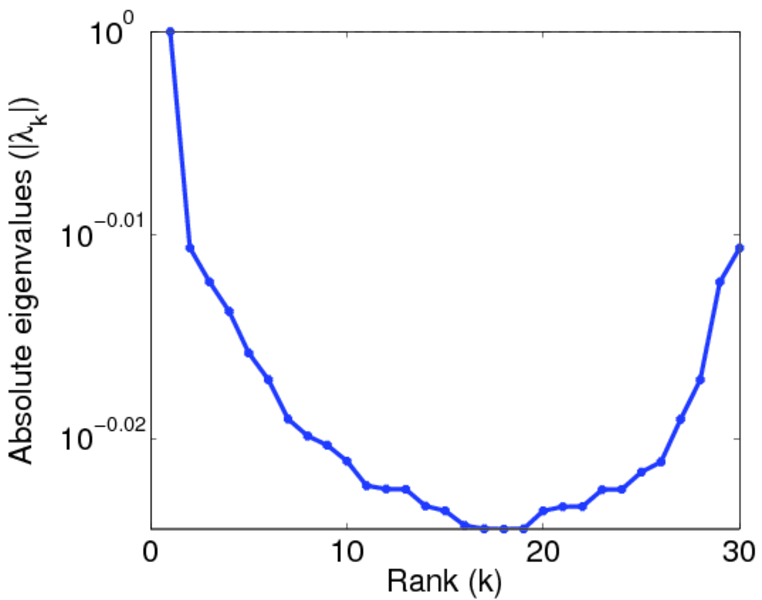
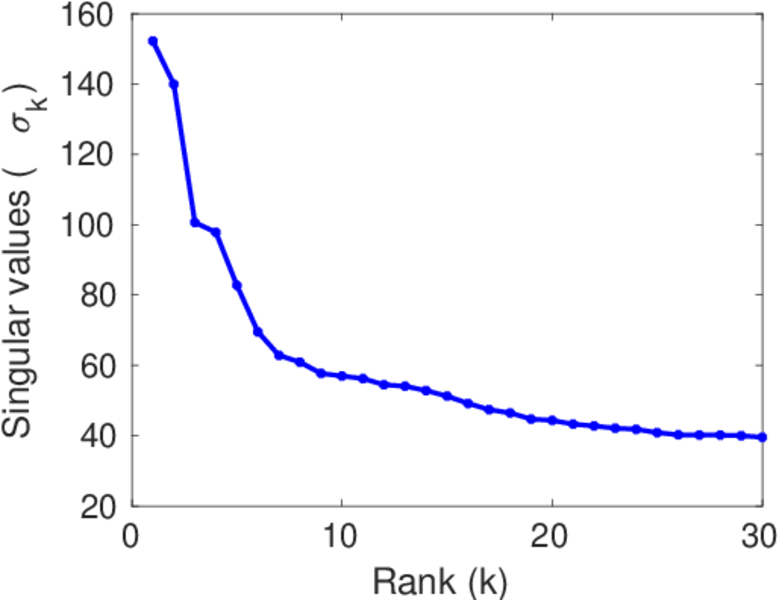
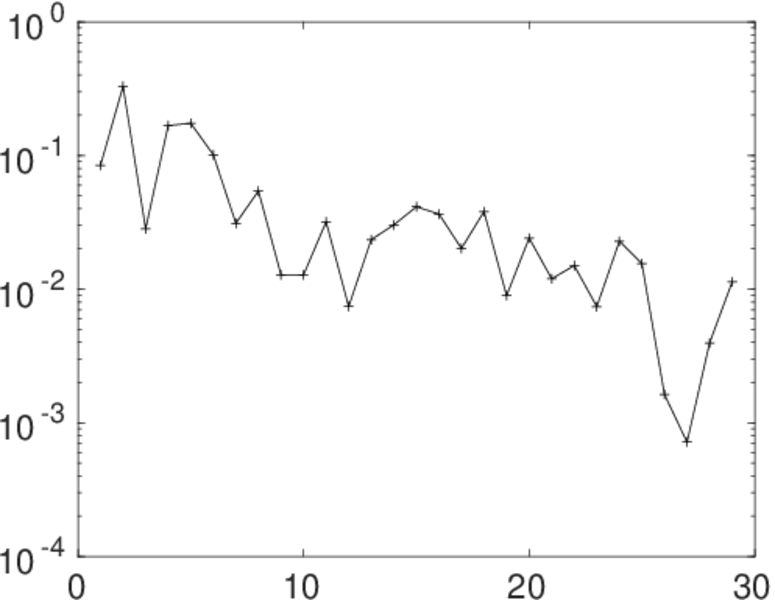
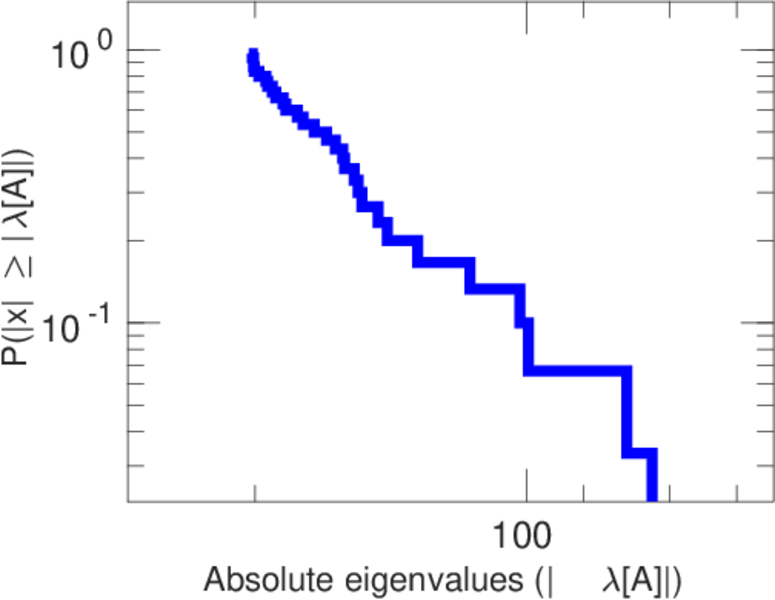
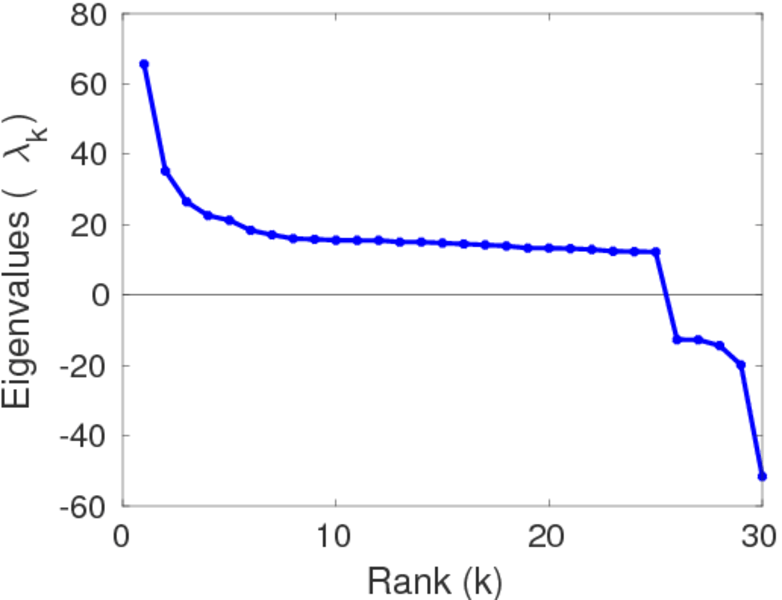
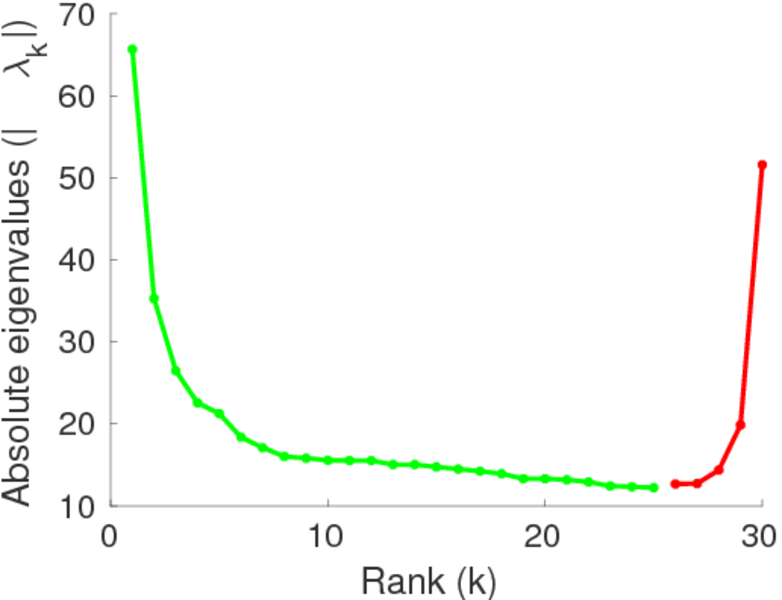
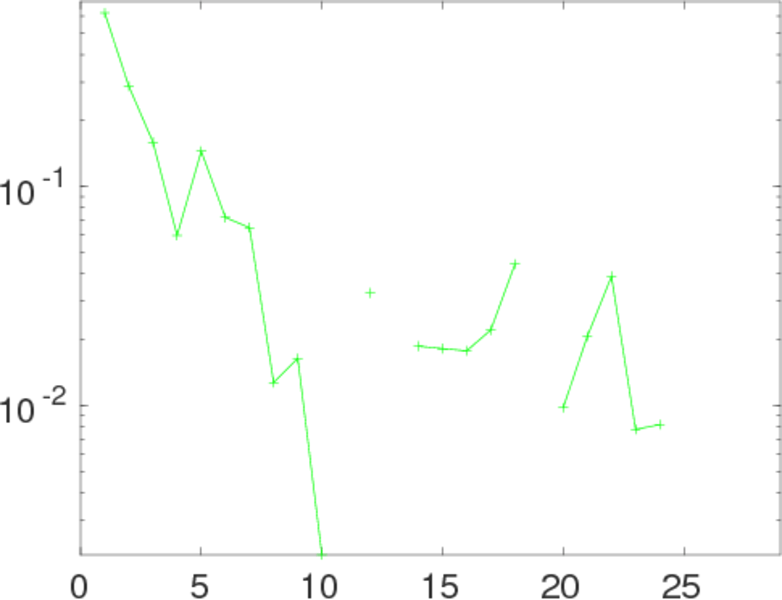
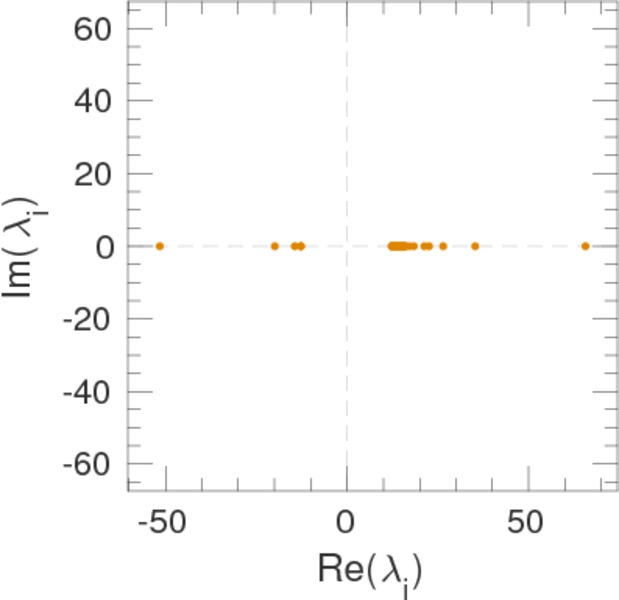
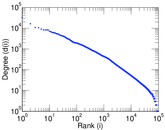
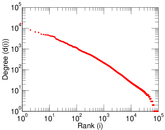
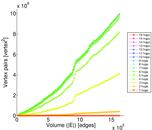
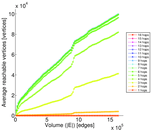
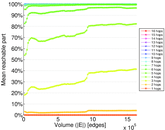
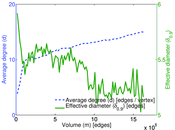
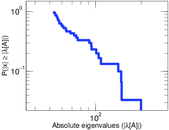
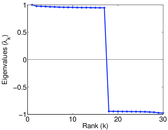
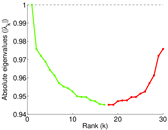
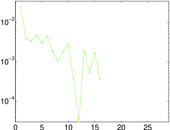
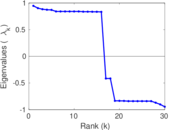
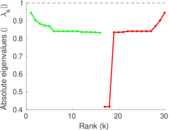
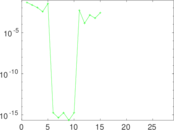
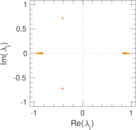
Plots


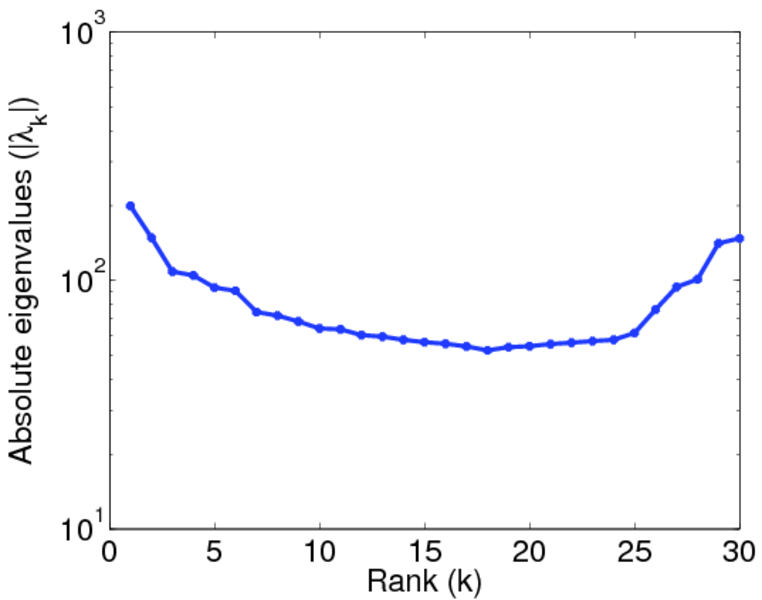
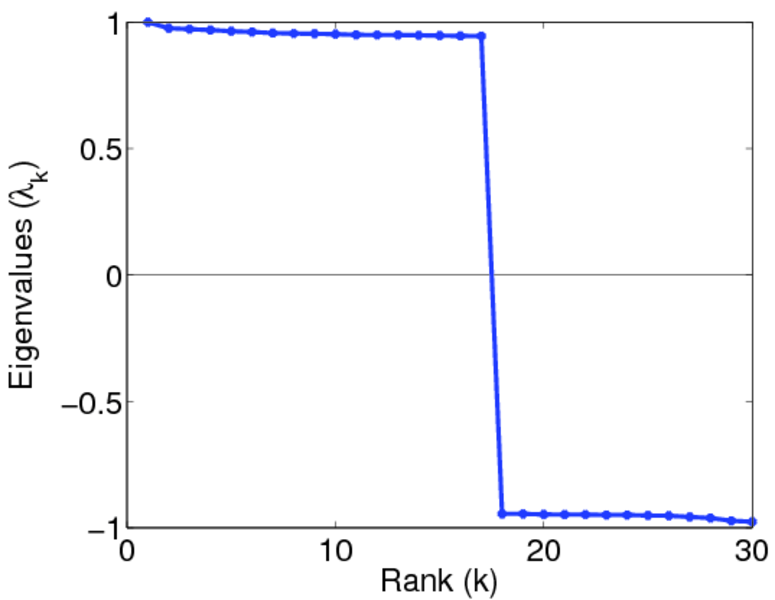
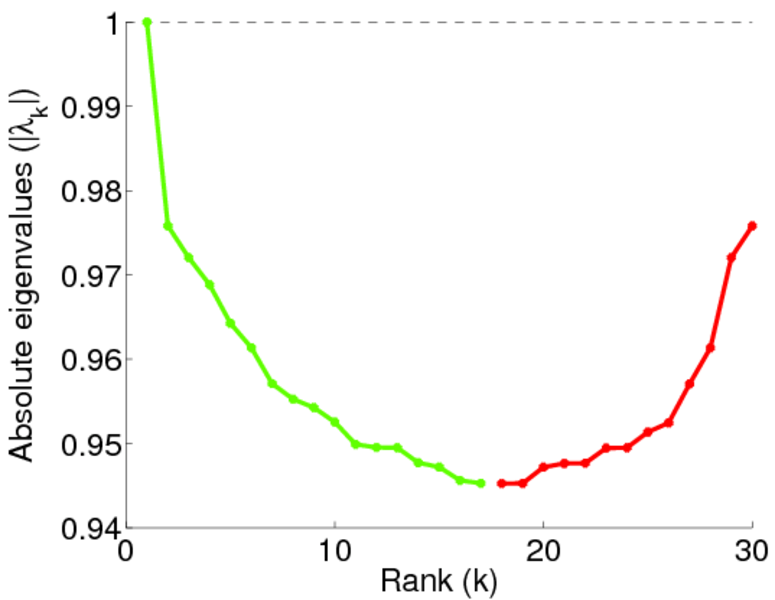
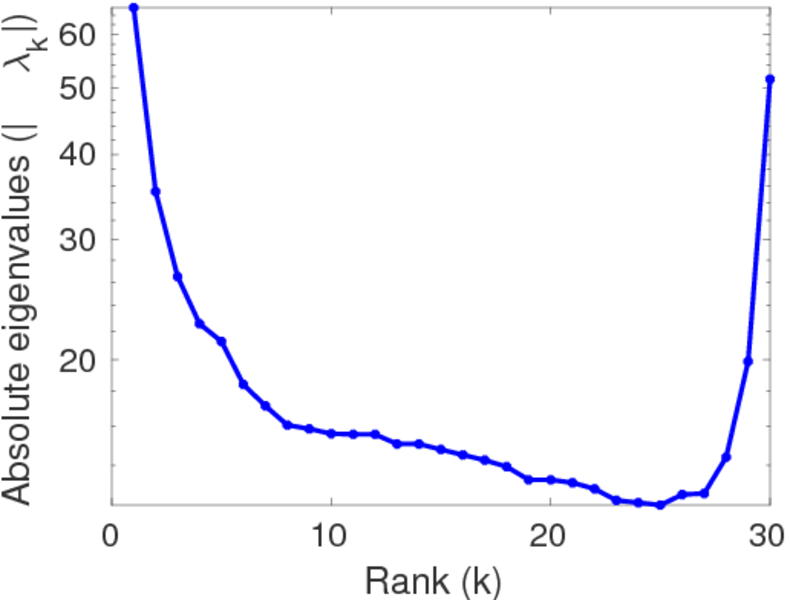
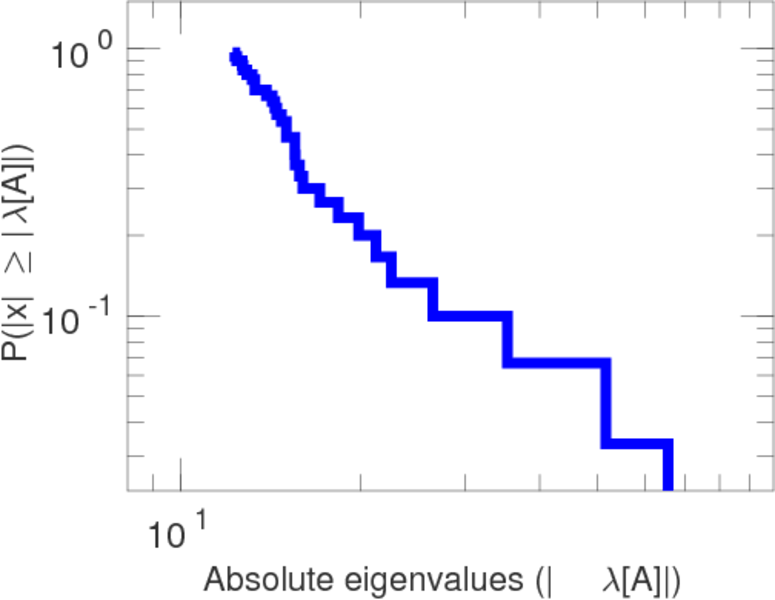
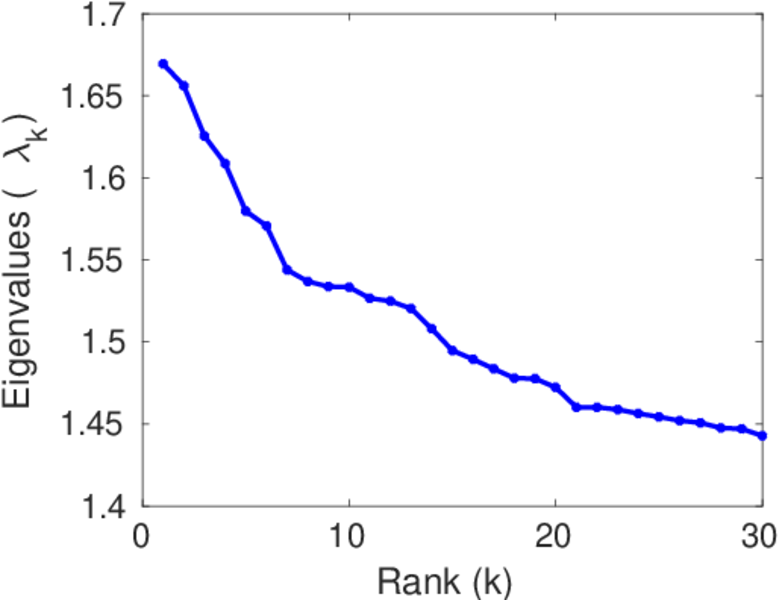
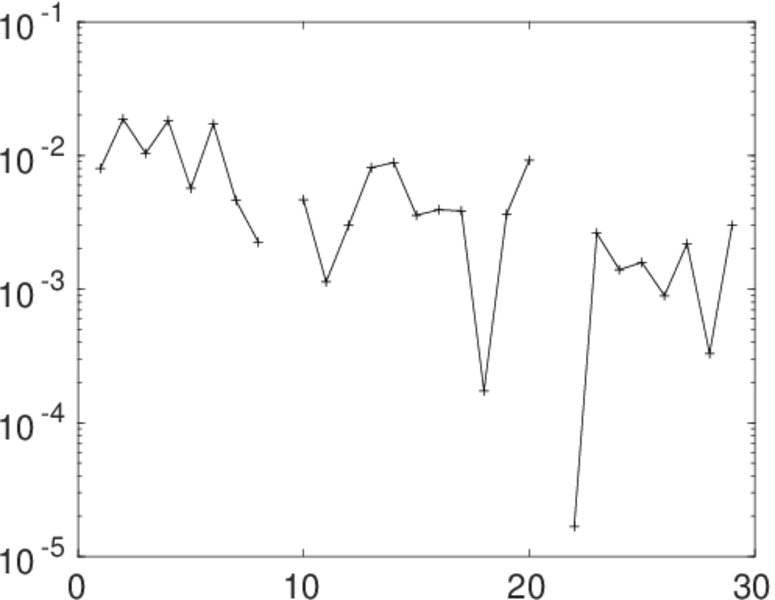
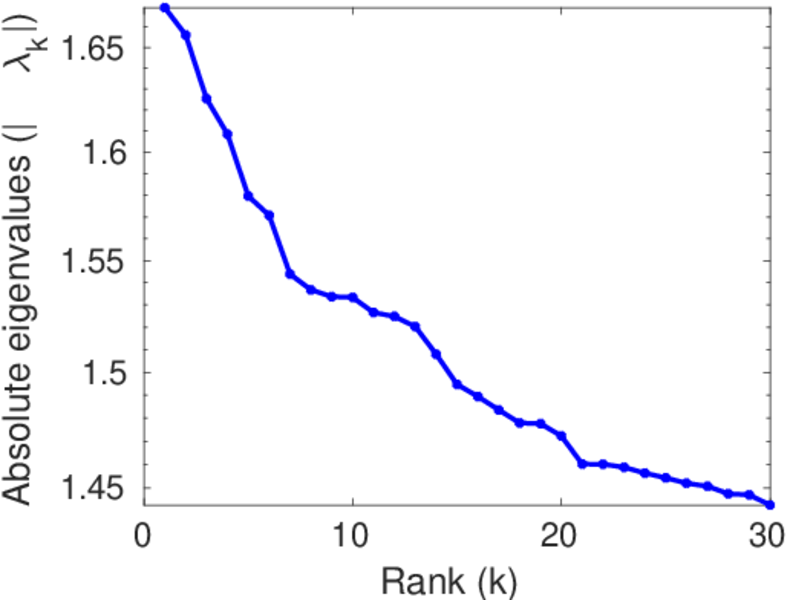
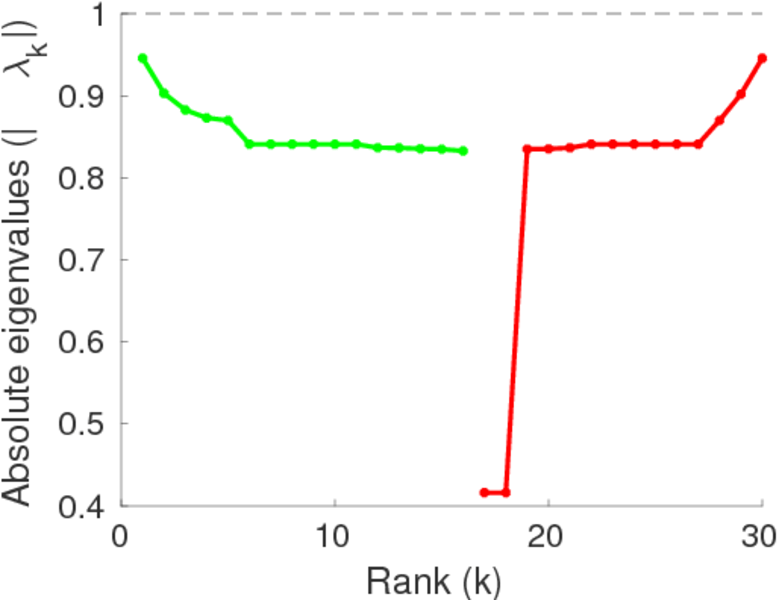
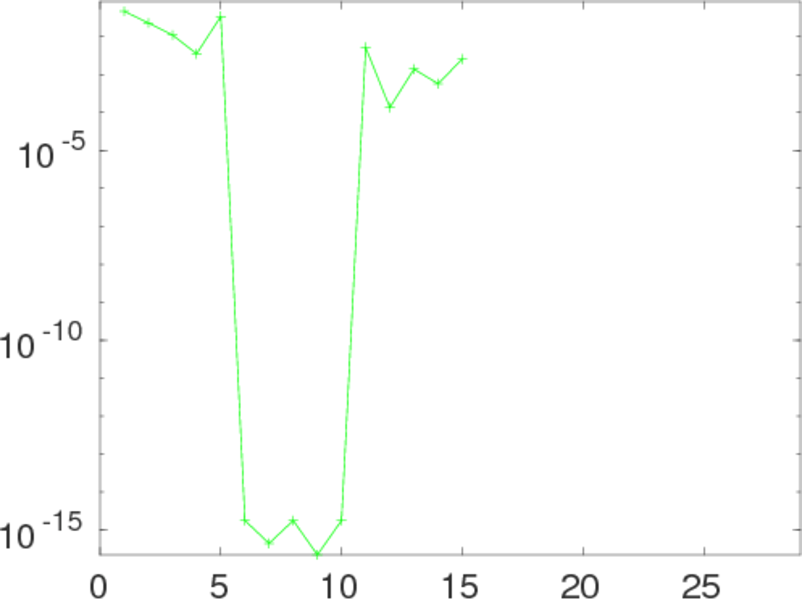
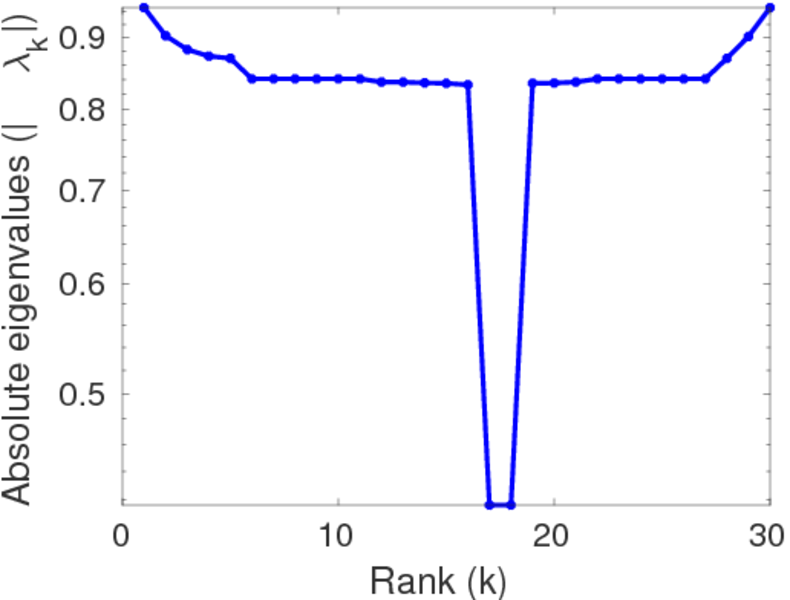
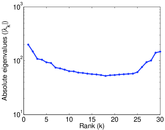
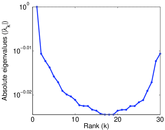
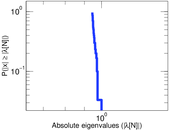
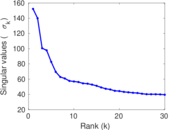
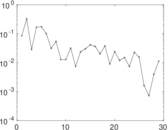
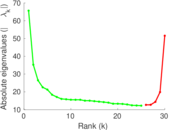
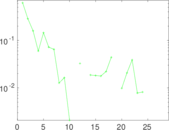
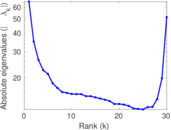
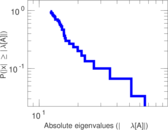
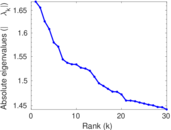
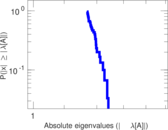
Matrix decompositions plots


Downloads
References
|
[1]
|
Jérôme Kunegis.
KONECT – The Koblenz Network Collection.
In Proc. Int. Conf. on World Wide Web Companion, pages
1343–1350, 2013.
[ http ]
|
|
[2]
|
Julia Preusse, Jérôme Kunegis, Matthias Thimm, Thomas Gottron, and Steffen
Staab.
Structural dynamics of knowledge networks.
In Proc. Int. Conf. on Weblogs and Soc. Media, 2013.
|
 KONECT ‣ Networks ‣
Buy Me a Coffee
KONECT ‣ Networks ‣
Buy Me a Coffee