Reality Mining
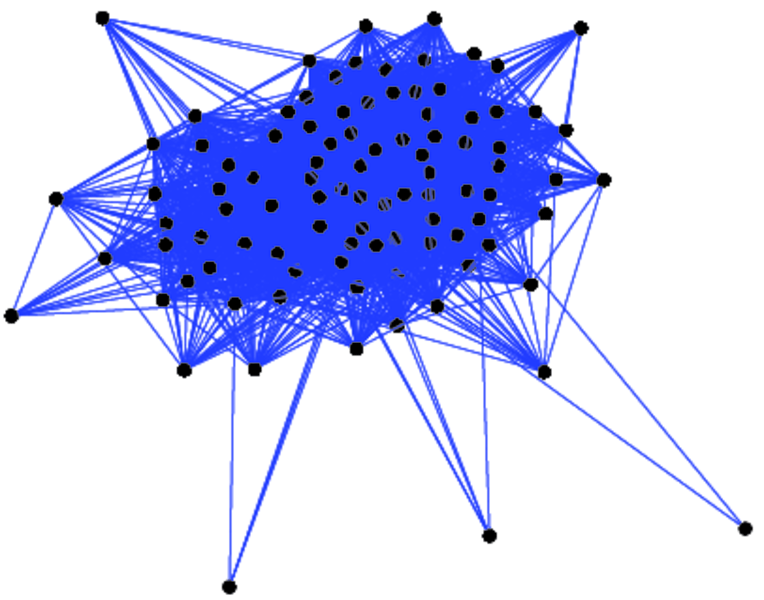
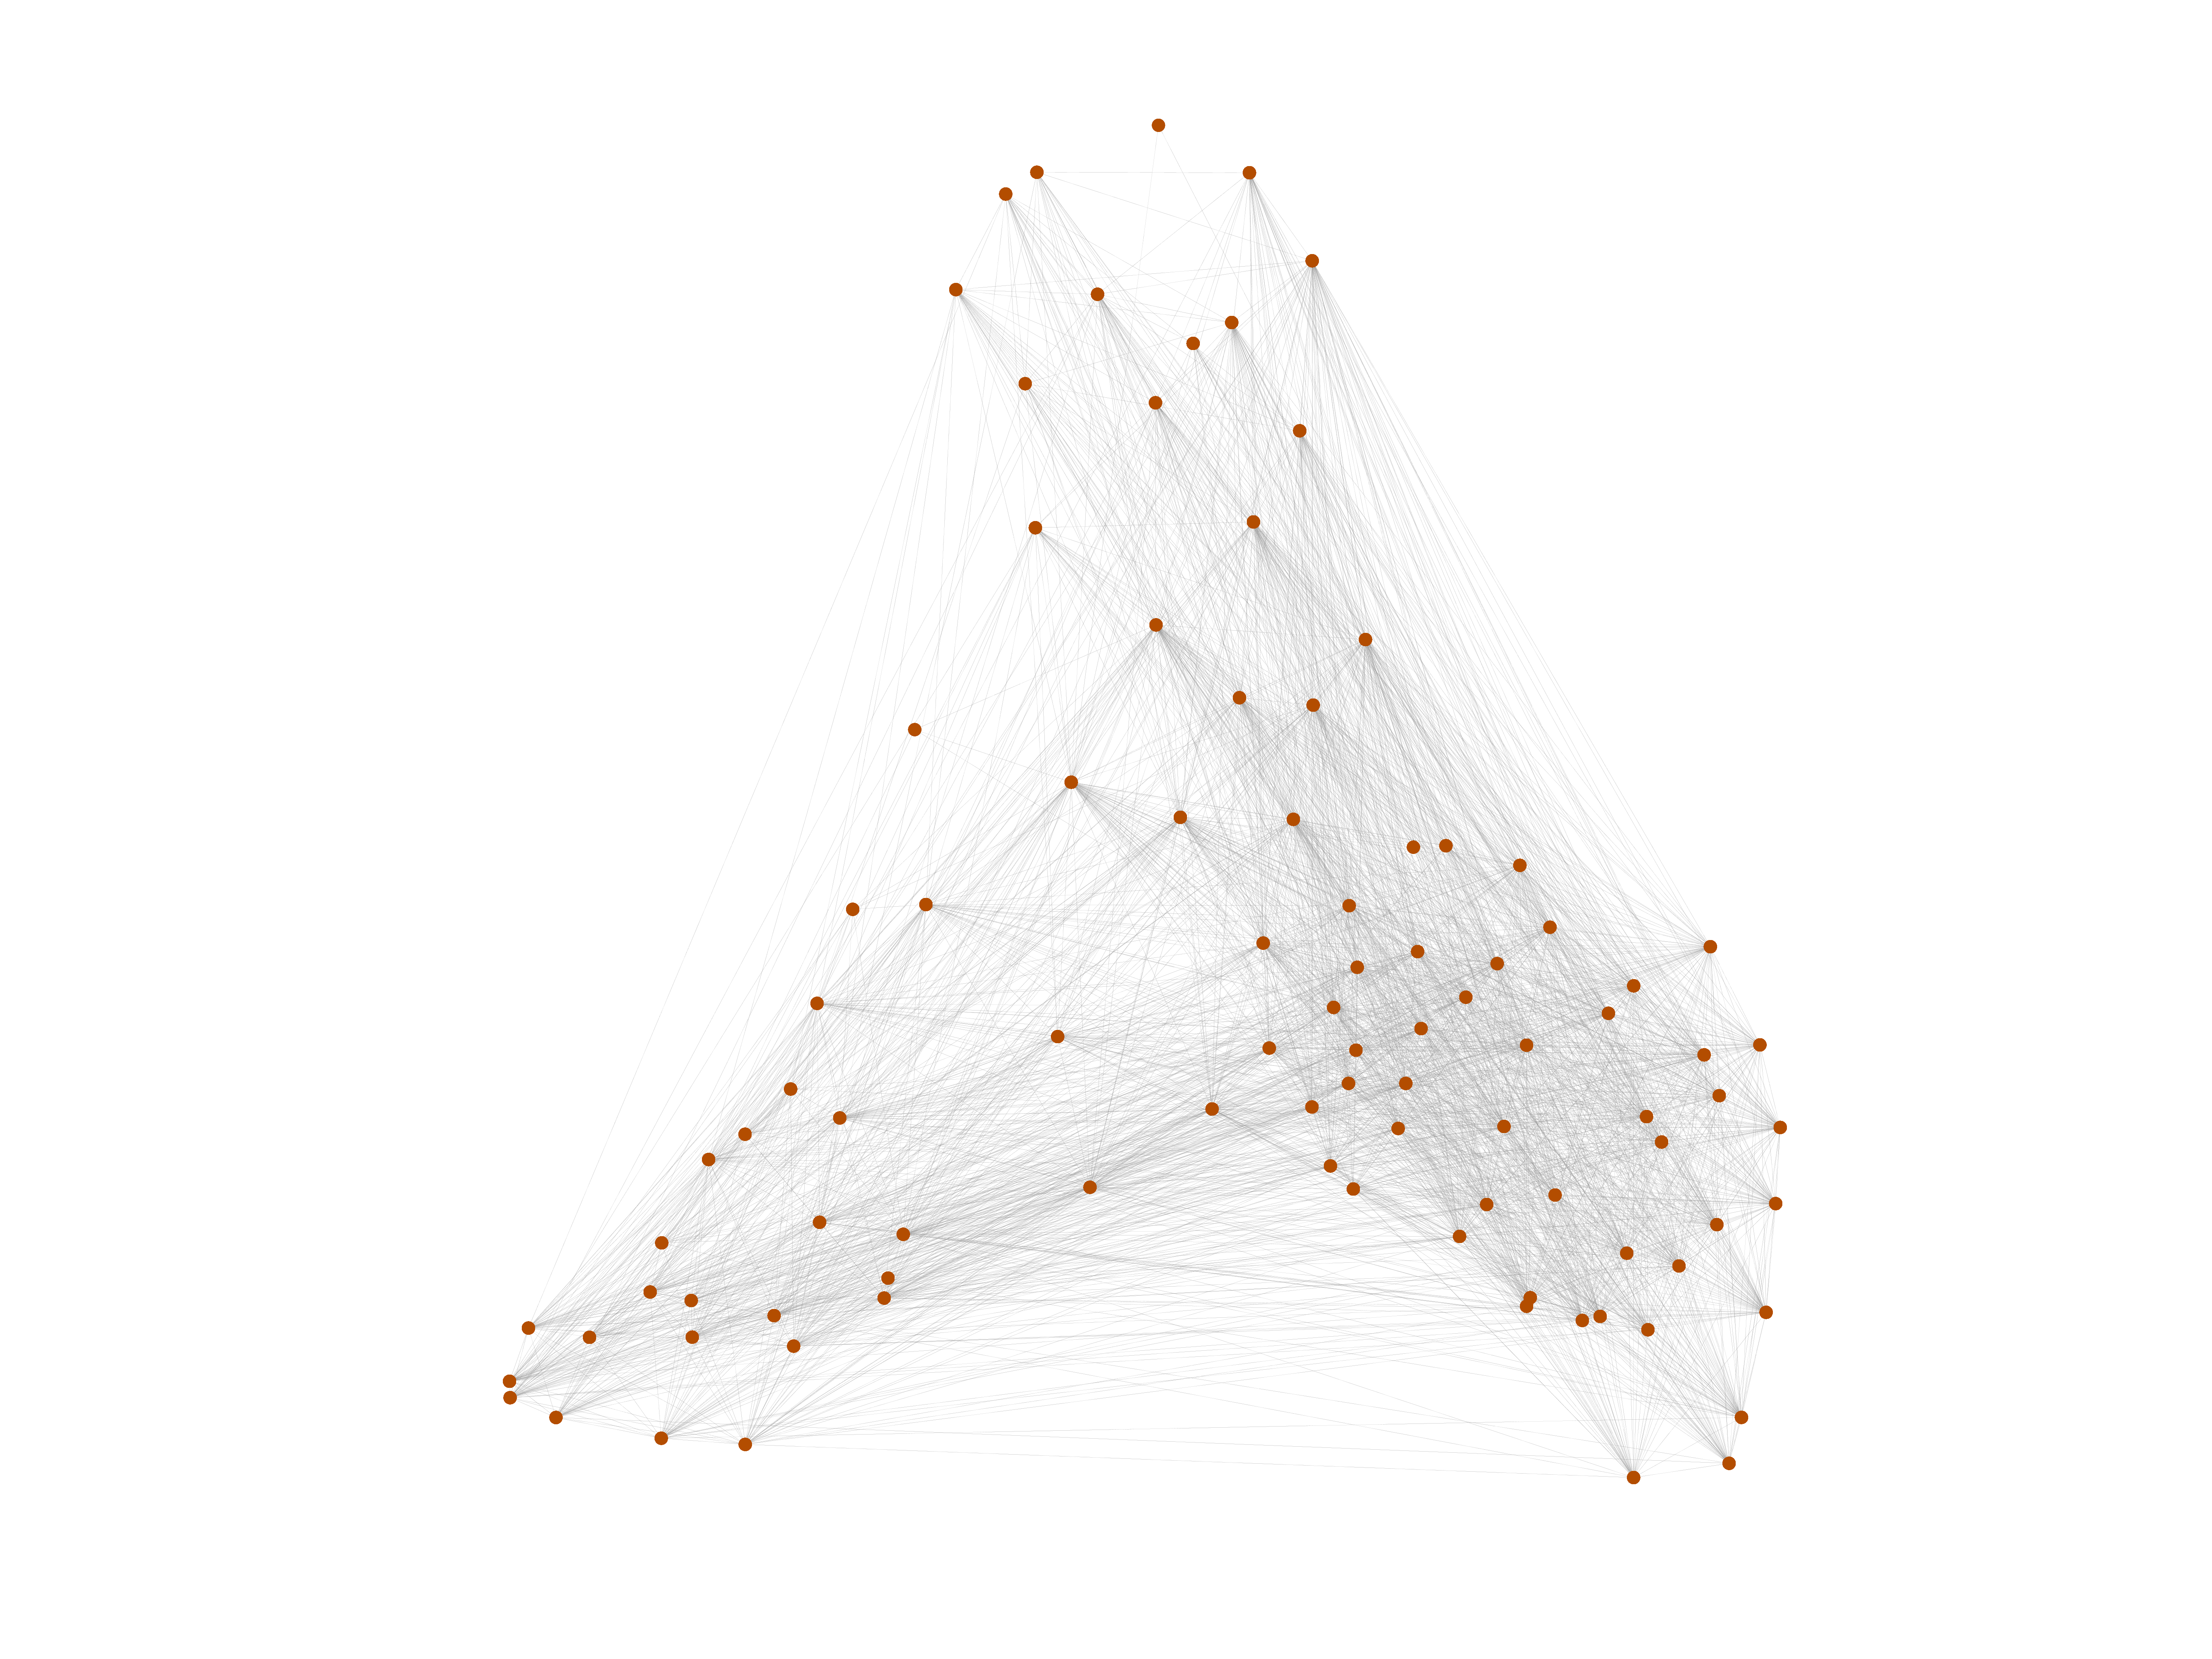
This undirected network contains human contact data among 100 students of the
Massachusetts Institute of Technology (MIT), collected by the Reality Mining
experiment performed in 2004 as part of the Reality Commons project. The data
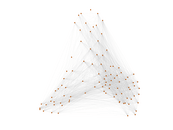
was collected over 9 months using 100 mobile phones. A node represents a
person; an edge indicates that the corresponding nodes had physical contact.
Metadata
Statistics
| Size | n = | 96
|
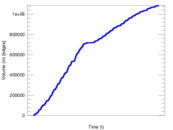
| Volume | m = | 1,086,404
|
| Unique edge count | m̿ = | 2,539
|
| Wedge count | s = | 149,335
|
| Claw count | z = | 3,073,975
|
| Cross count | x = | 48,933,259
|
| Triangle count | t = | 36,108
|
| Square count | q = | 1,534,878
|
| 4-Tour count | T4 = | 12,881,442
|
| Maximum degree | dmax = | 98,257
|
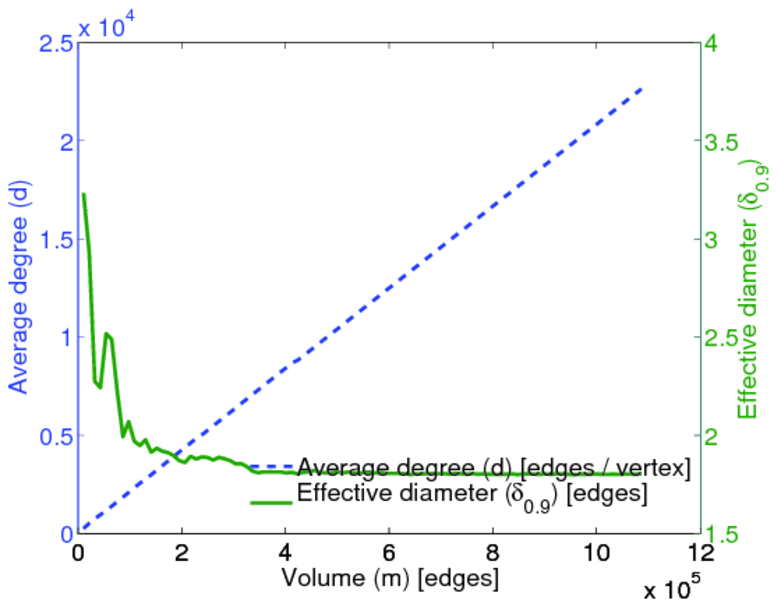
| Average degree | d = | 22,633.4
|
| Fill | p = | 0.556 798
|
| Average edge multiplicity | m̃ = | 427.887
|
| Size of LCC | N = | 96
|
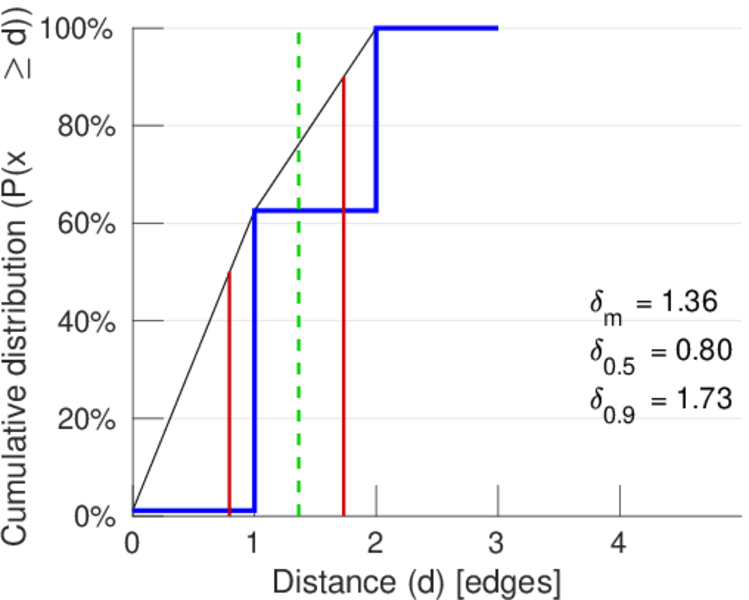
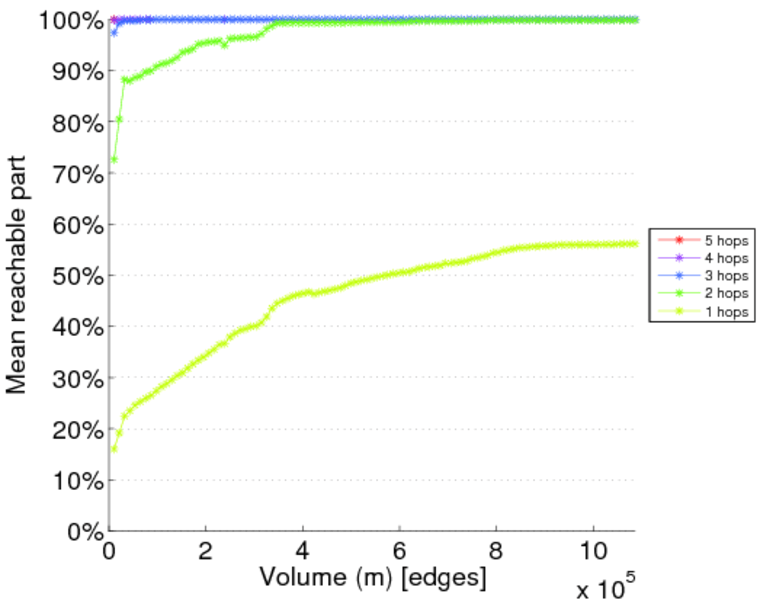
| Diameter | δ = | 3
|
| 50-Percentile effective diameter | δ0.5 = | 0.795 737
|
| 90-Percentile effective diameter | δ0.9 = | 1.733 01
|
| Median distance | δM = | 1
|
| Mean distance | δm = | 1.363 27
|
| Relative edge distribution entropy | Her = | 0.982 596
|
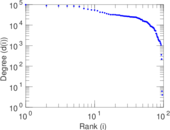
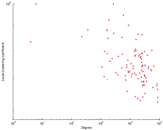
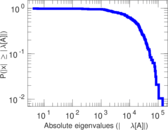
| Power law exponent | γ = | 1.317 13
|
| Tail power law exponent | γt = | 2.611 00
|
| Tail power law exponent with p | γ3 = | 2.611 00
|
| p-value | p = | 0.000 00
|
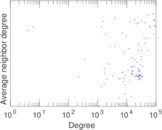
| Degree assortativity | ρ = | −0.055 486 2
|
| Degree assortativity p-value | pρ = | 7.620 70 × 10−5
|
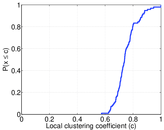
| Clustering coefficient | c = | 0.725 376
|
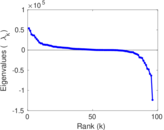
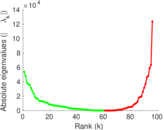
| Spectral norm | α = | 61,801.9
|
| Algebraic connectivity | a = | 4.041 03
|
| Spectral separation | |λ1[A] / λ2[A]| = | 1.950 75
|
| Non-bipartivity | bA = | 0.563 644
|
| Normalized non-bipartivity | bN = | 0.783 795
|
| Algebraic non-bipartivity | χ = | 1.973 50
|
| Spectral bipartite frustration | bK = | 0.009 327 28
|
| Controllability | C = | 1
|
| Relative controllability | Cr = | 0.010 416 7
|
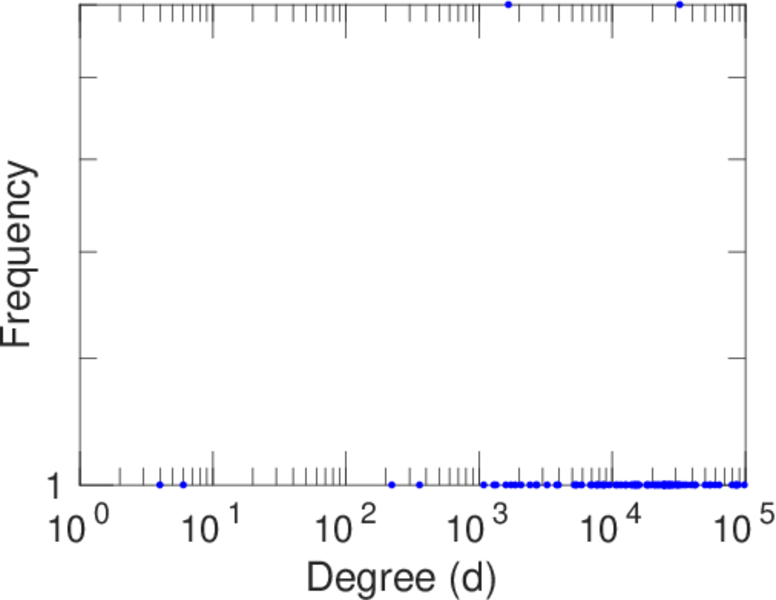
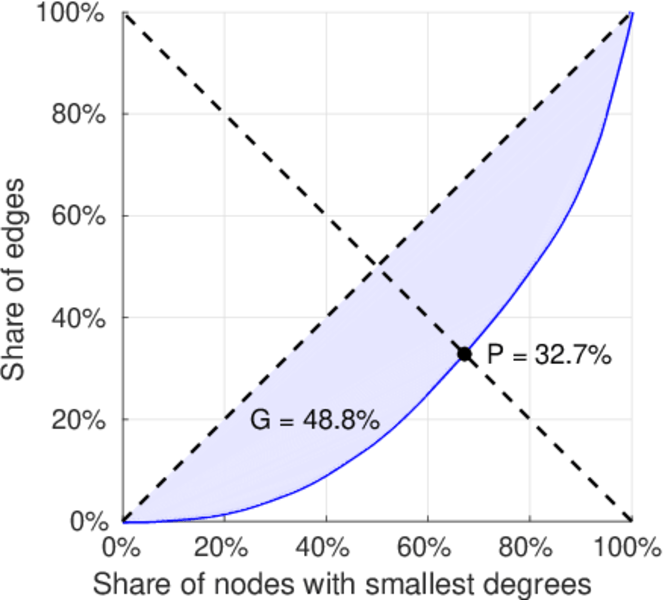
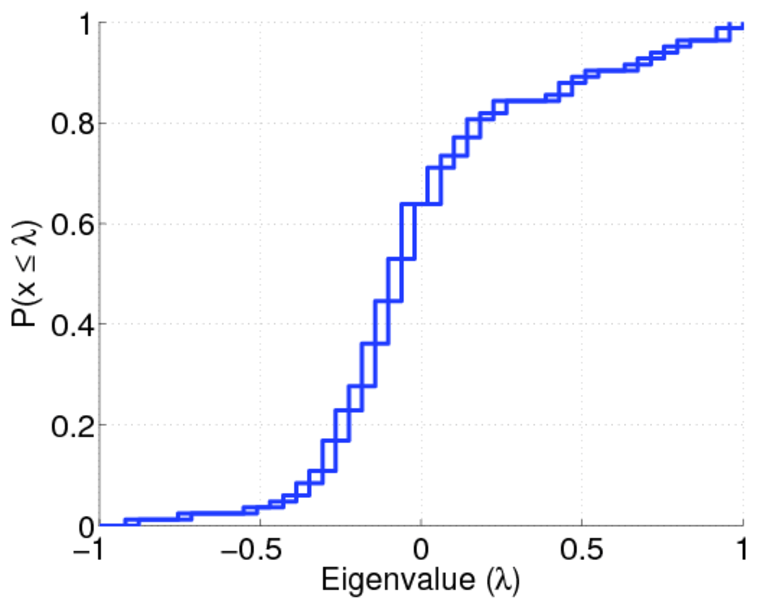
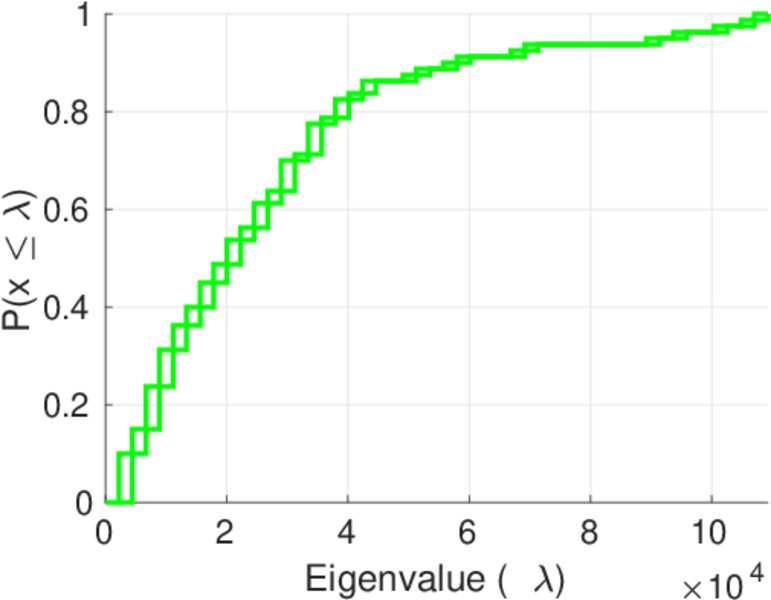
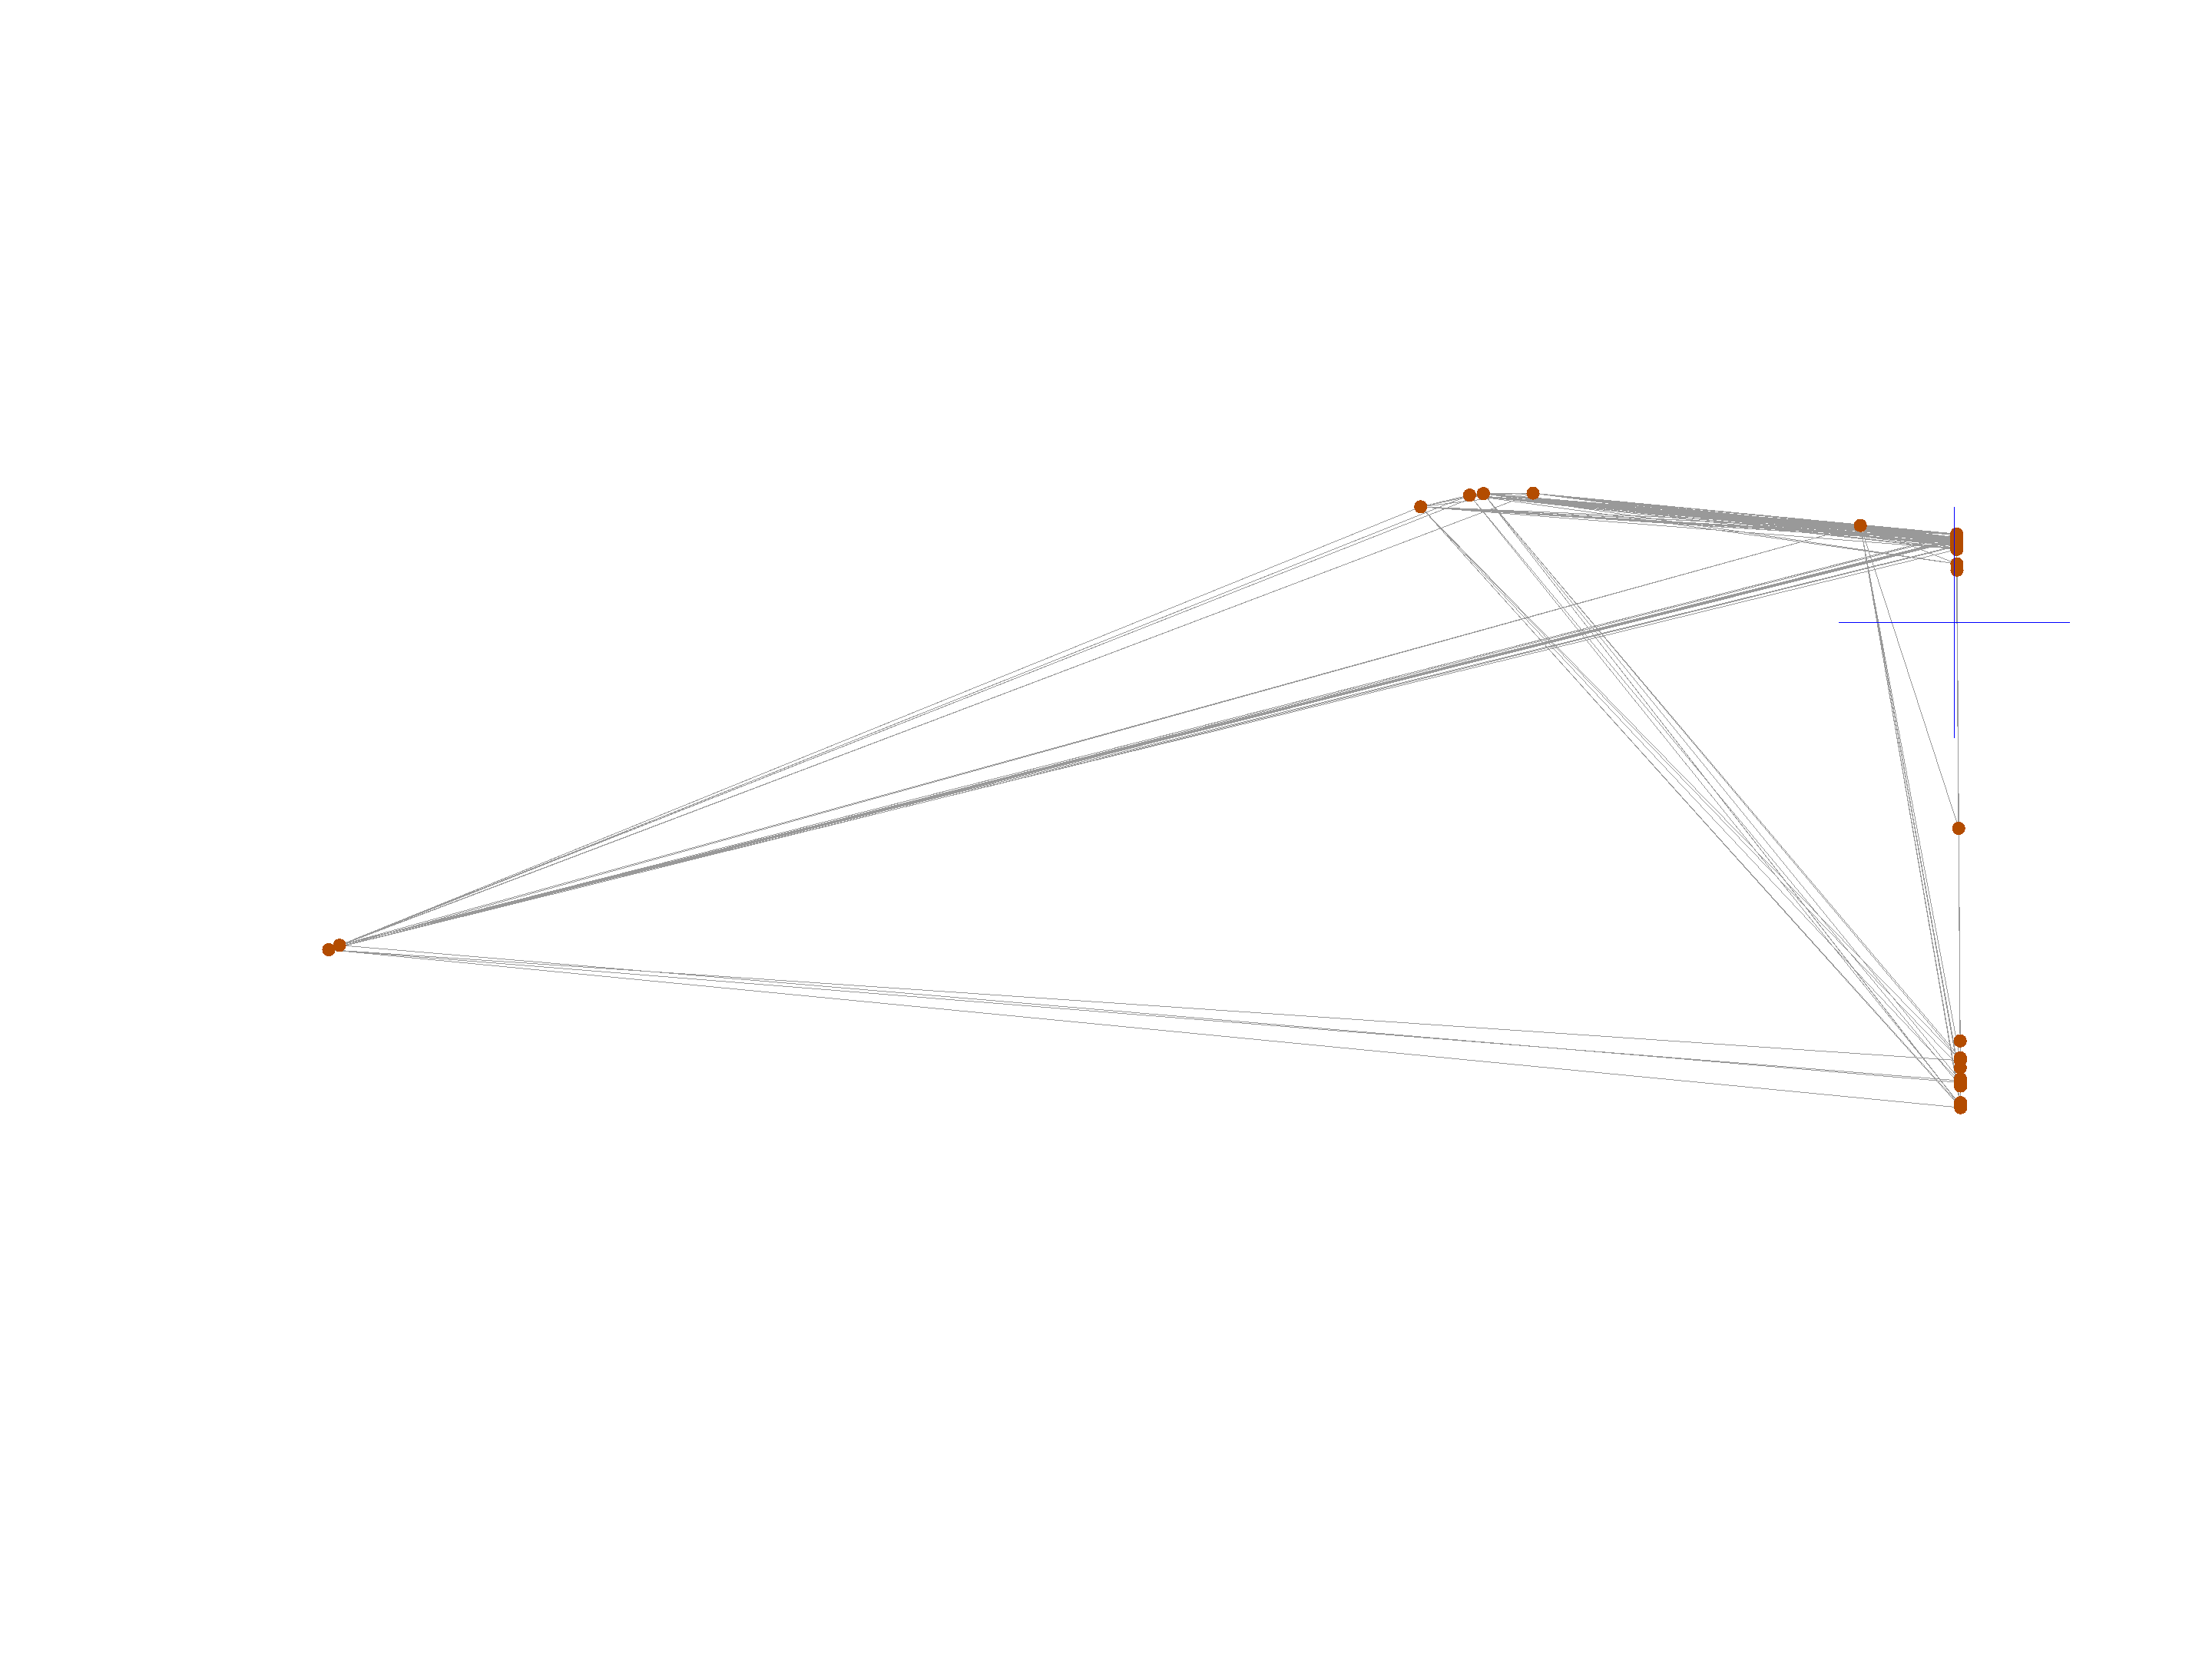
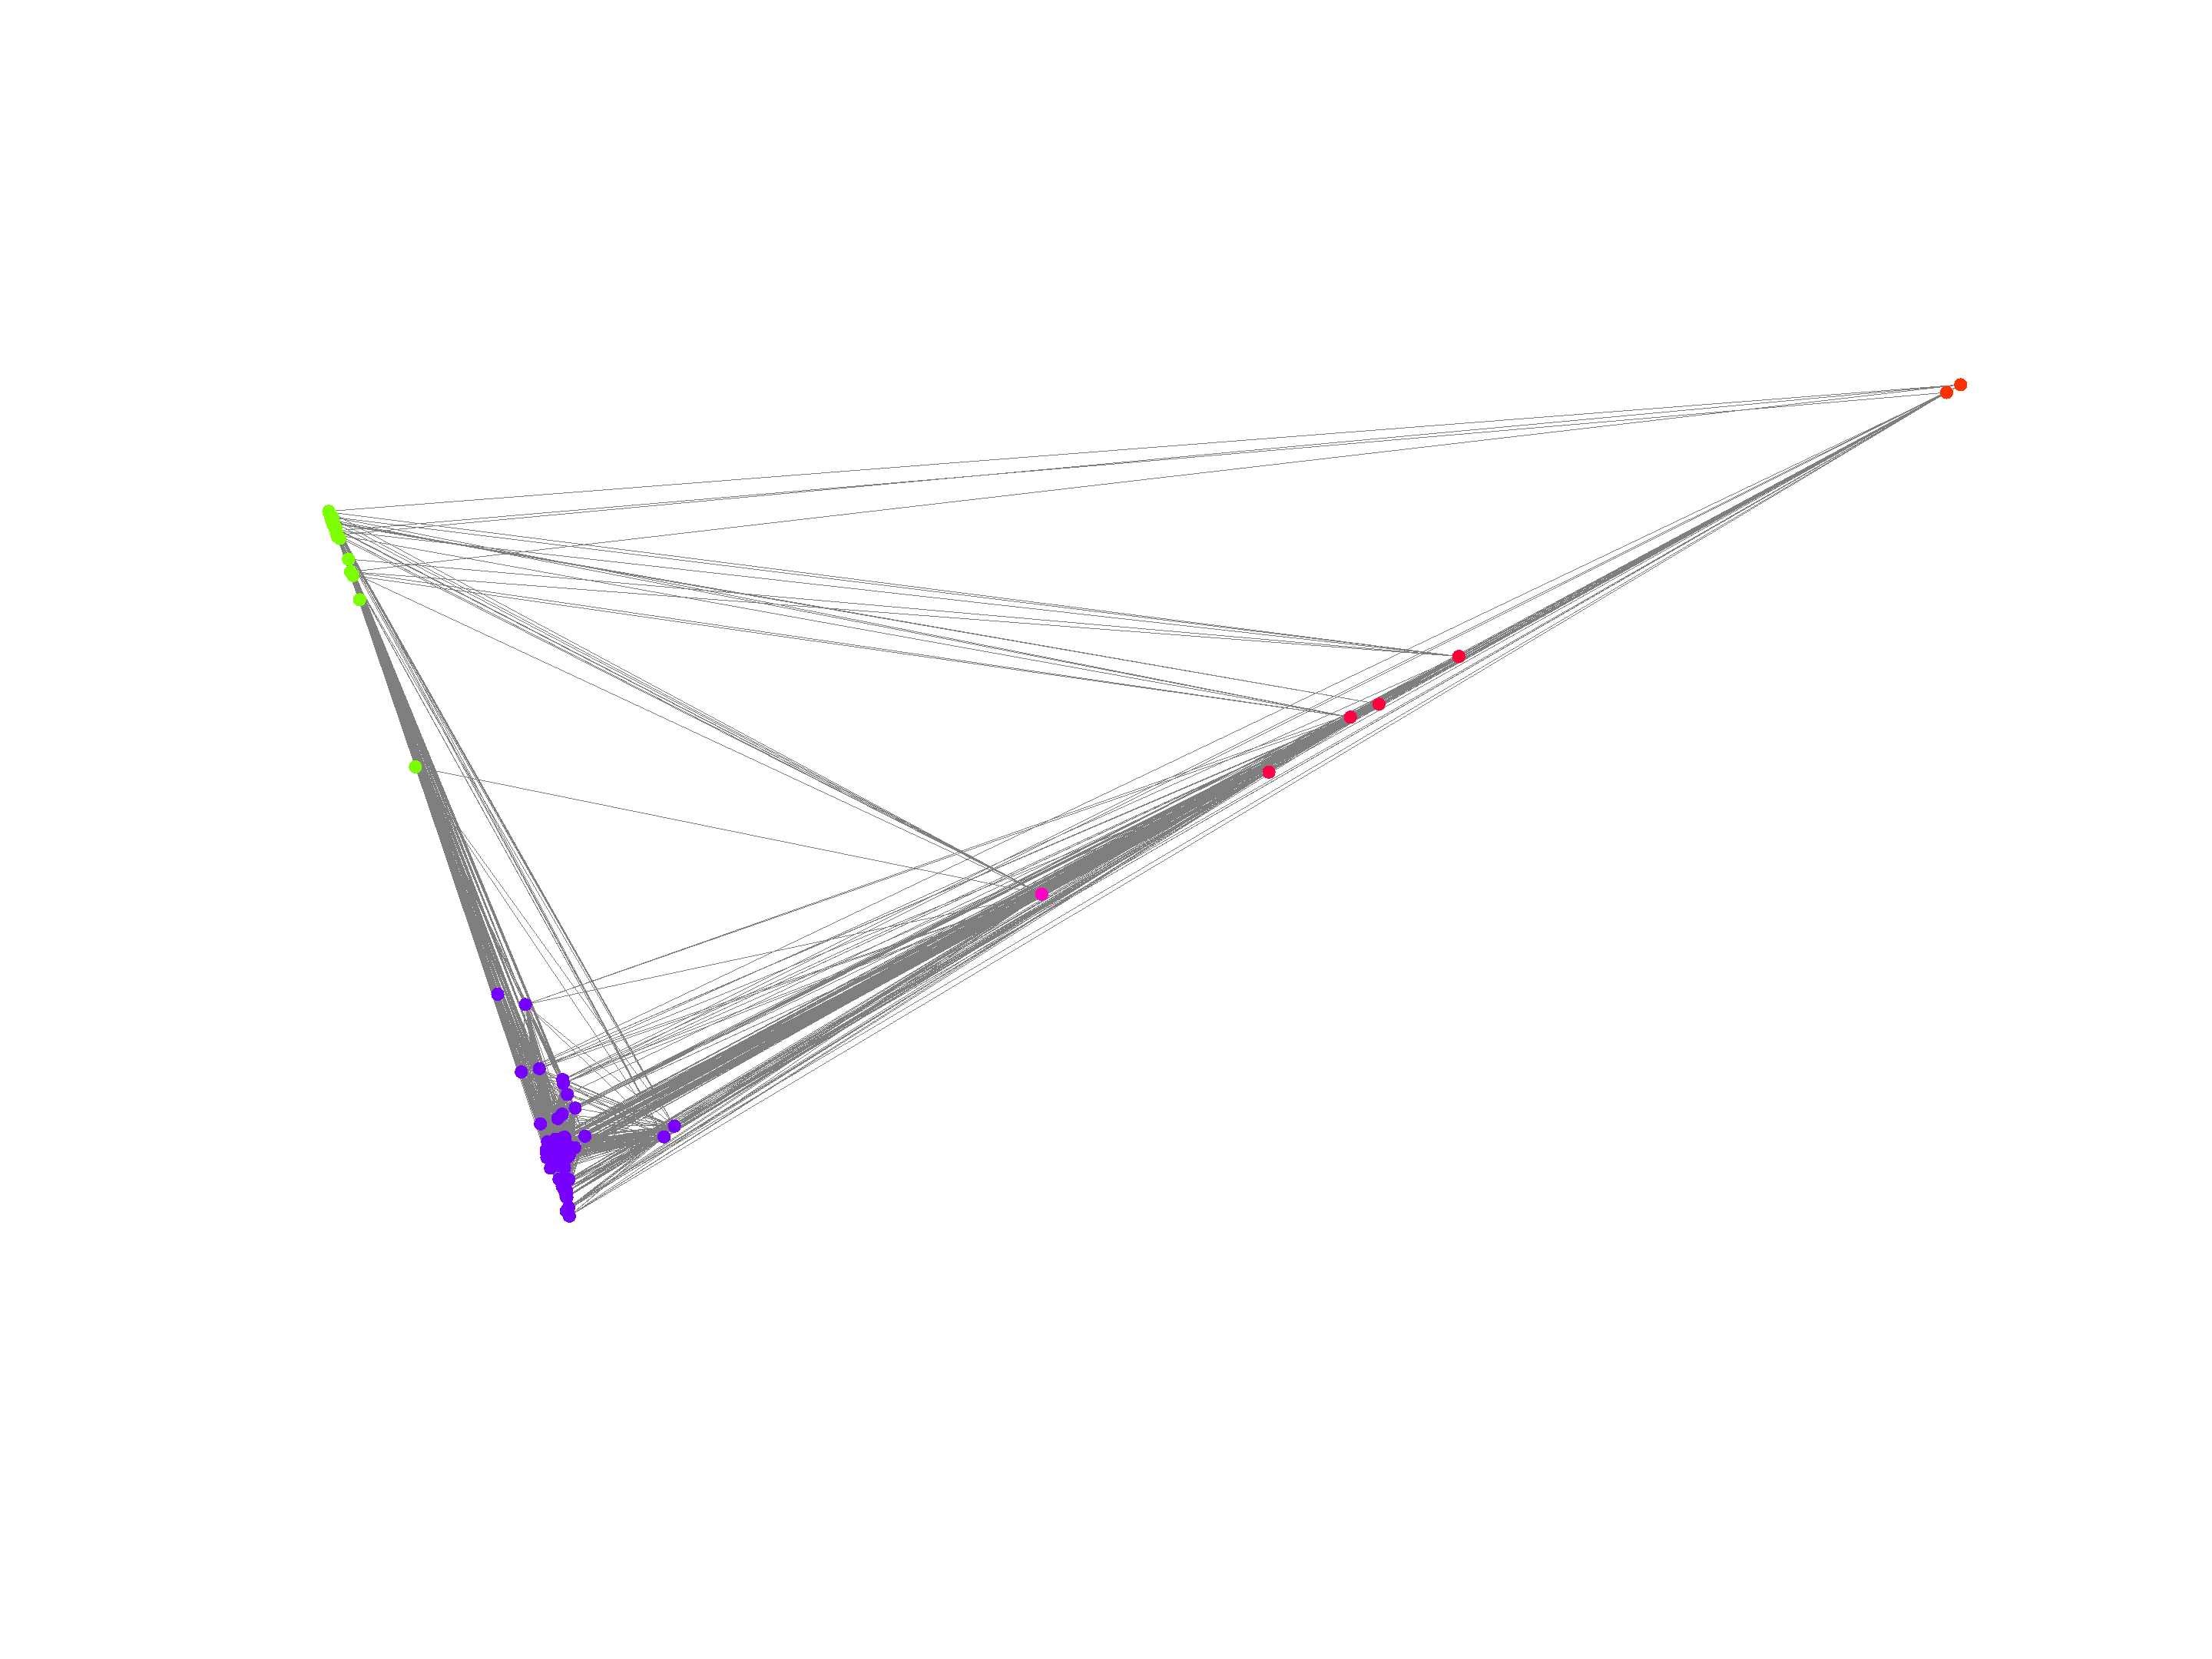
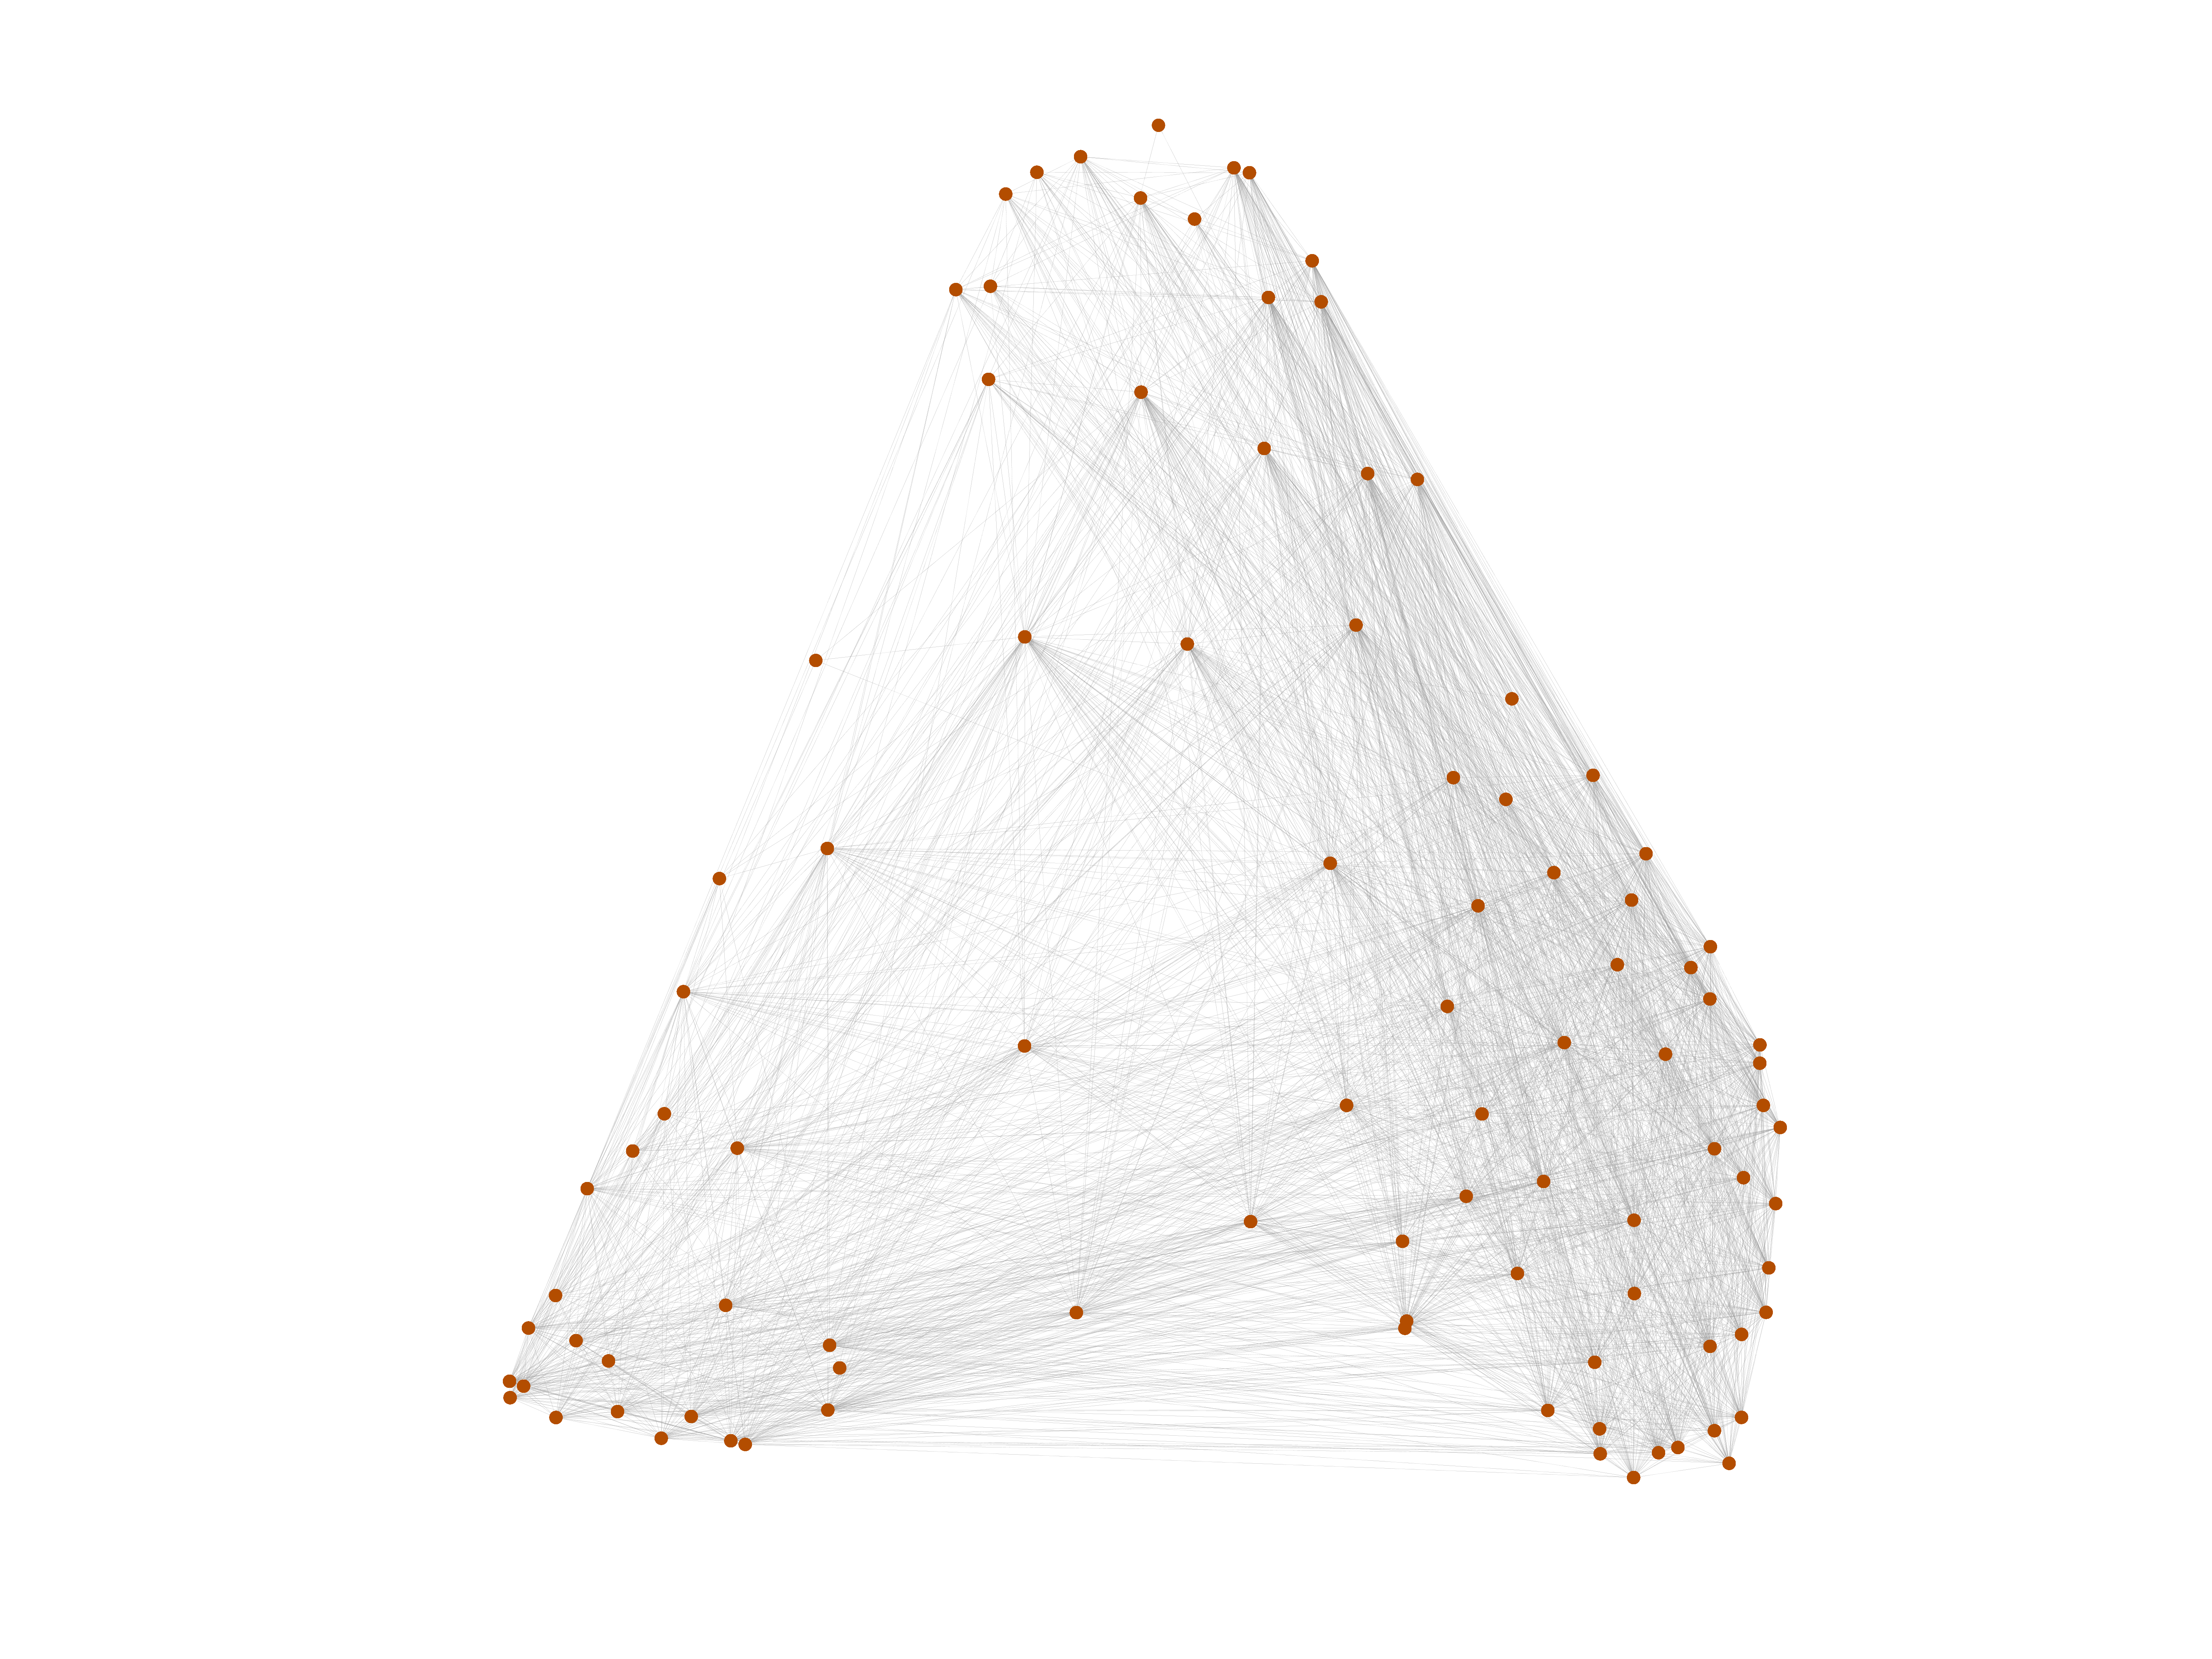
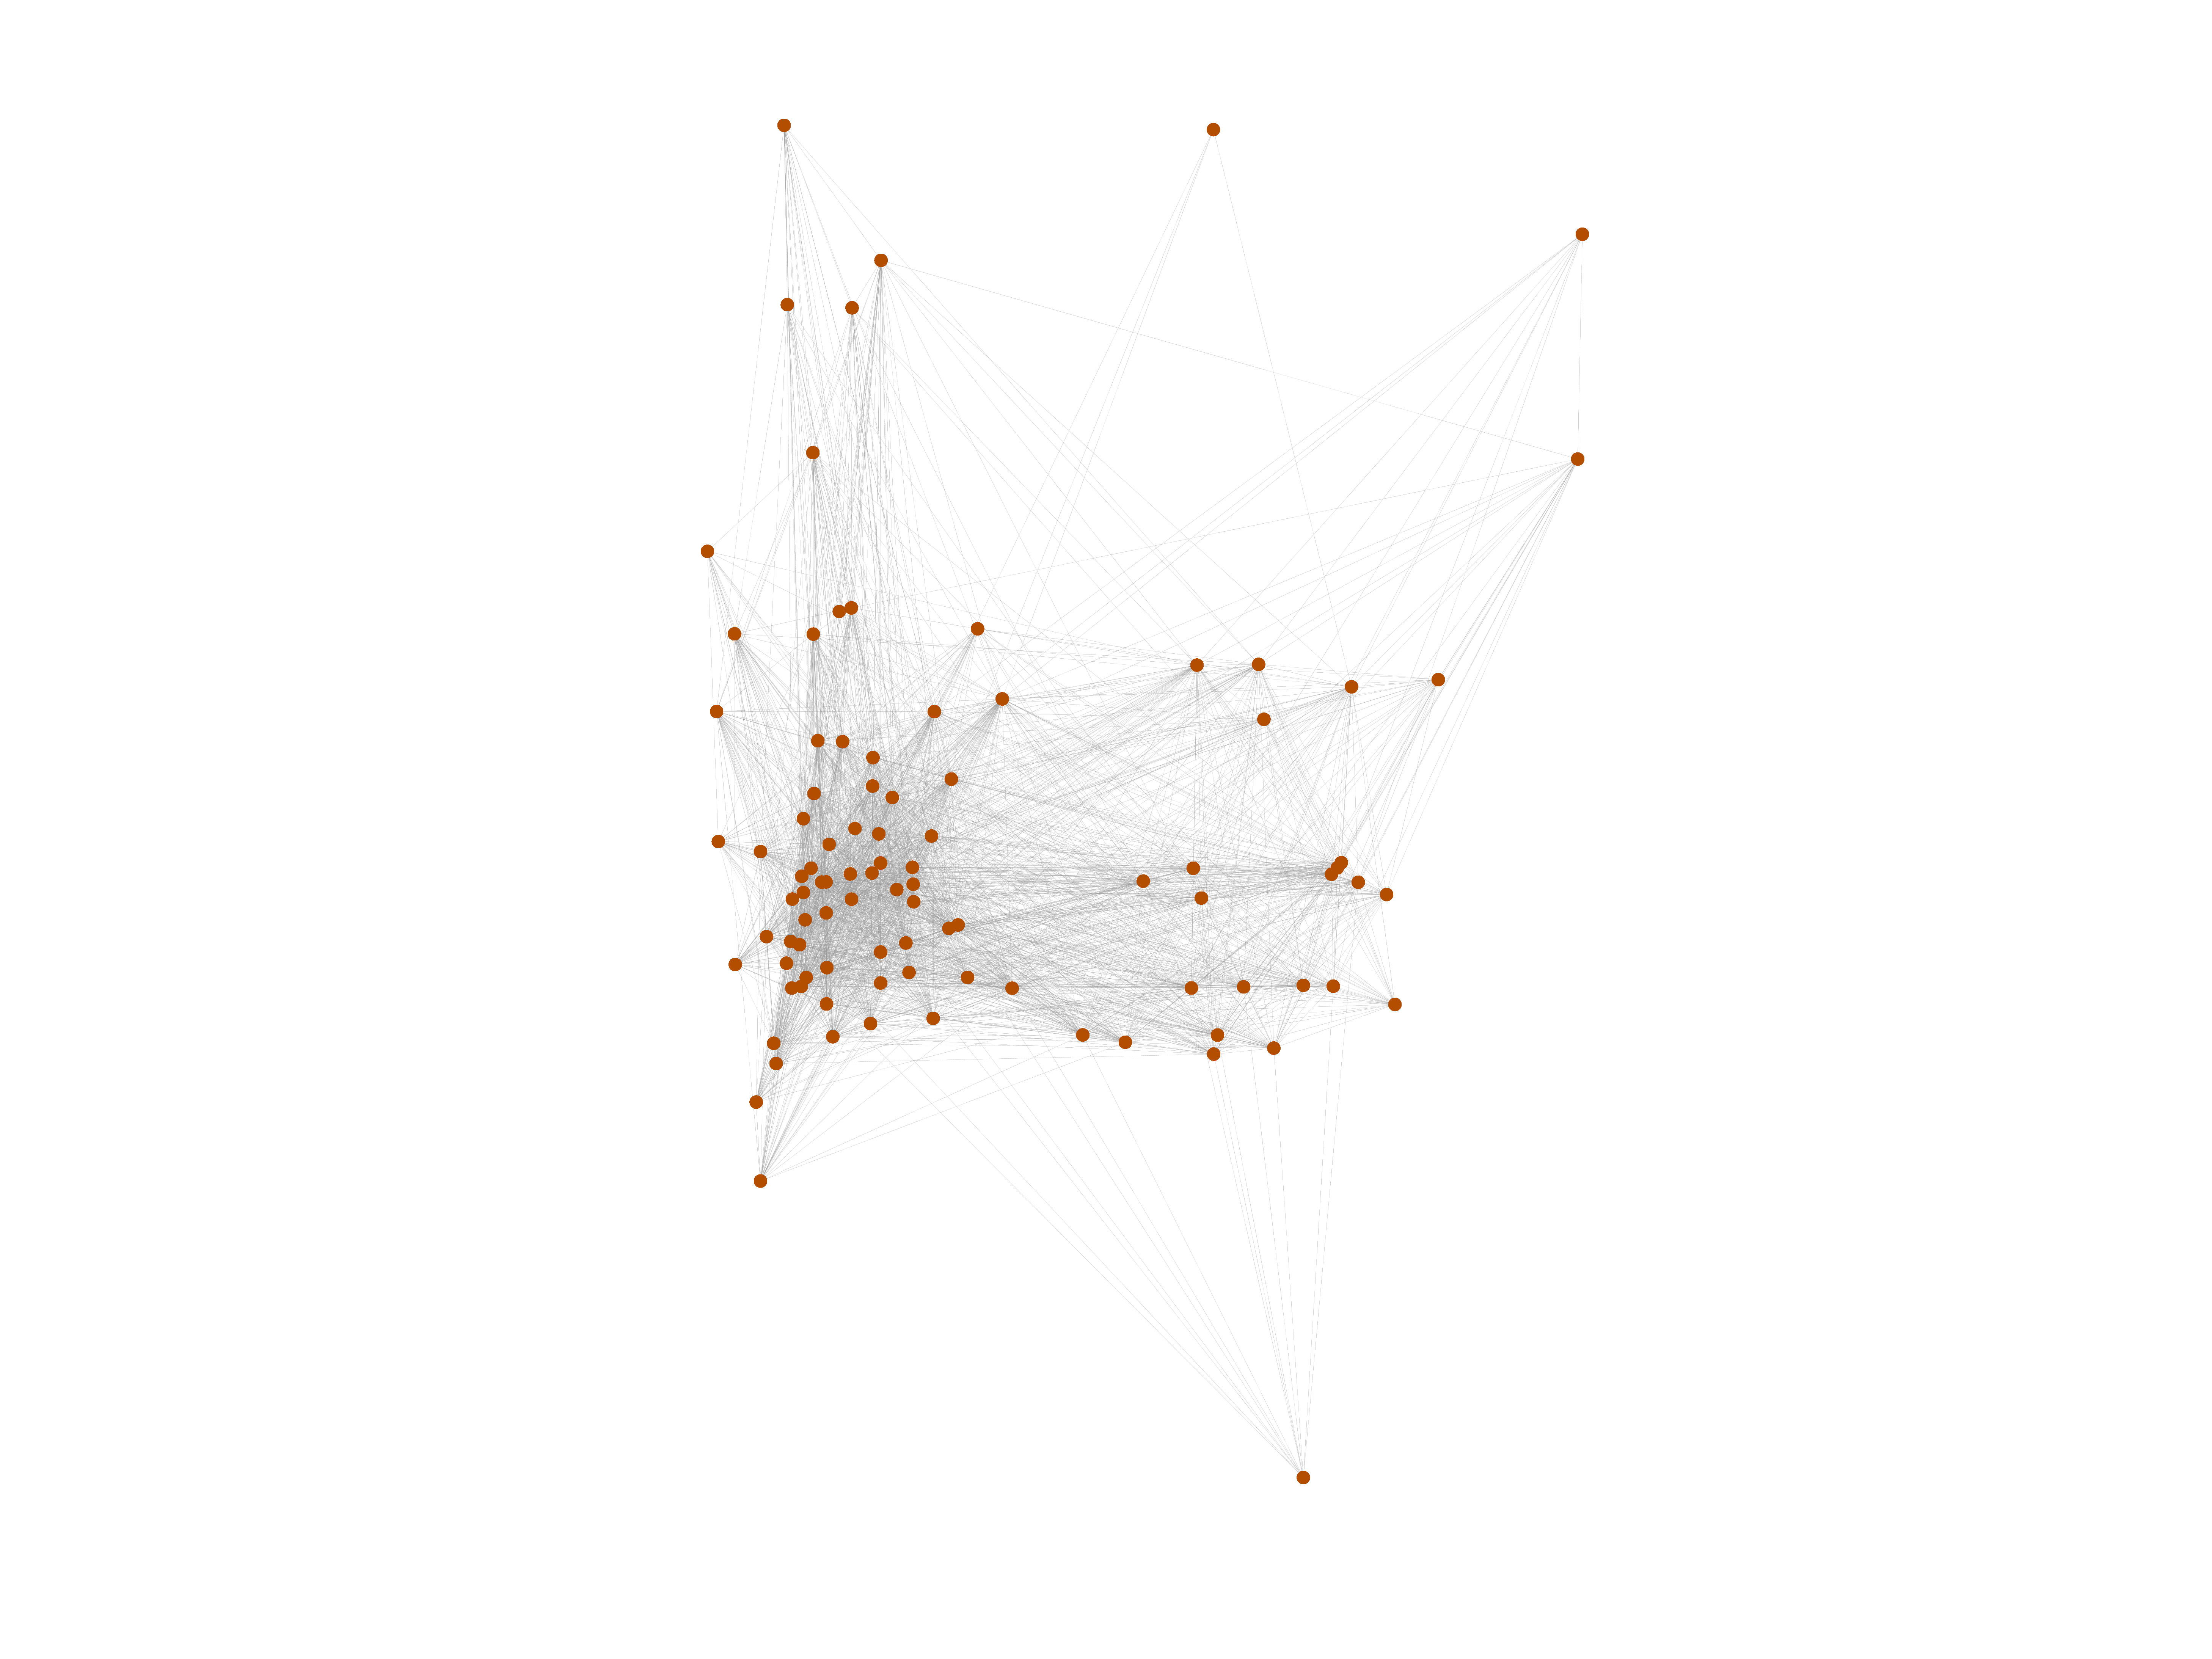
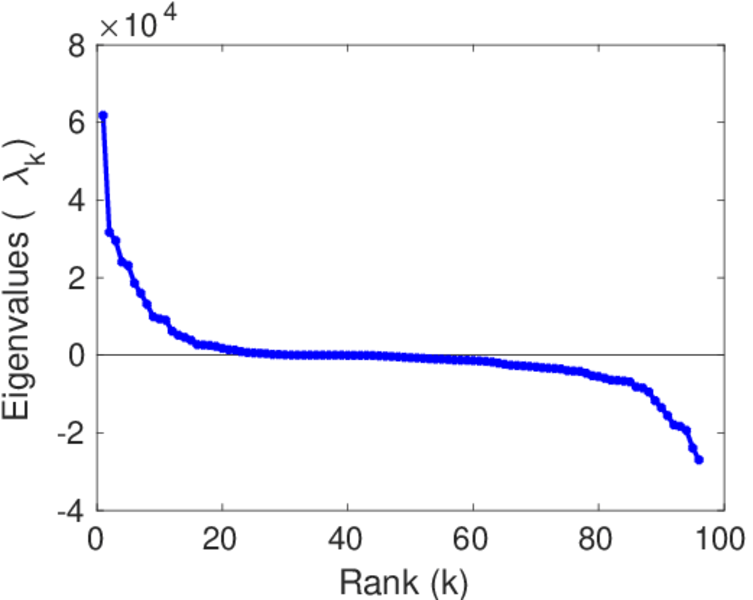
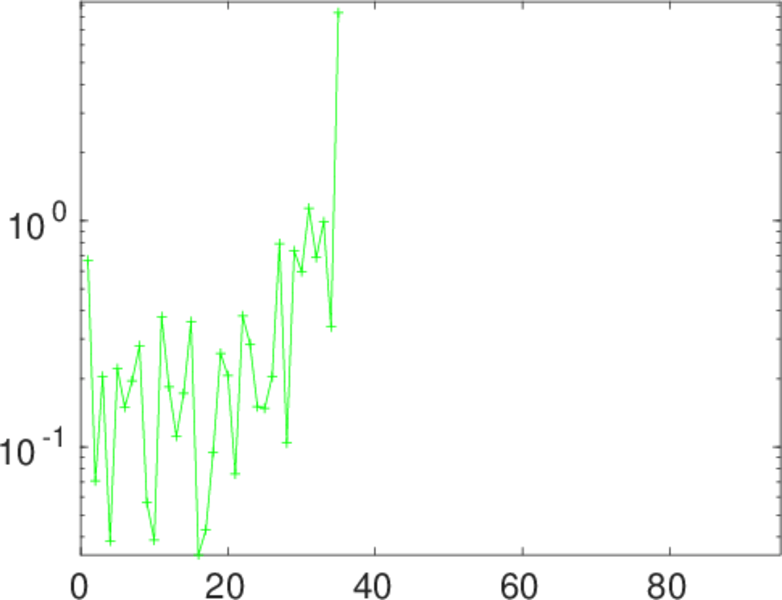
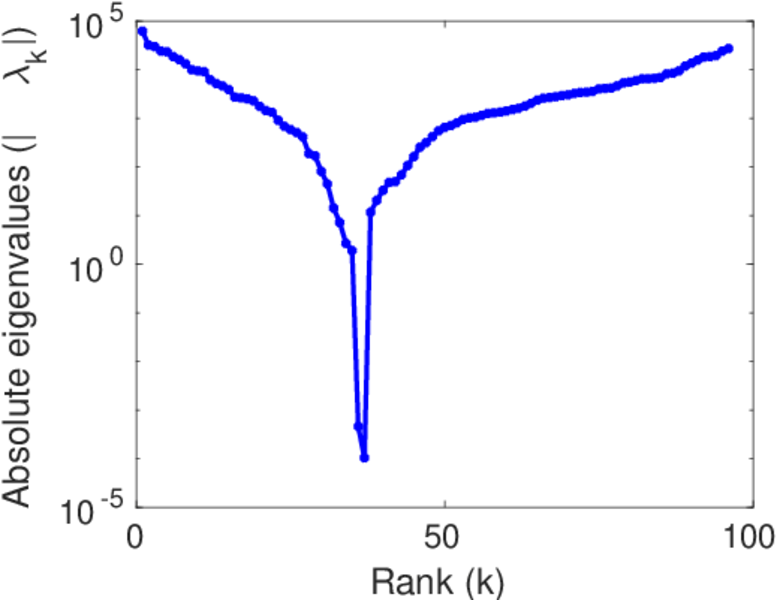
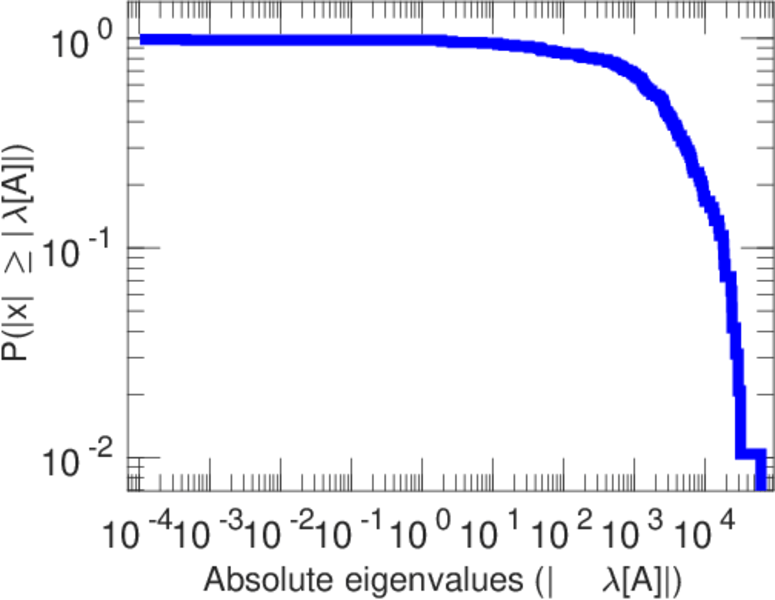
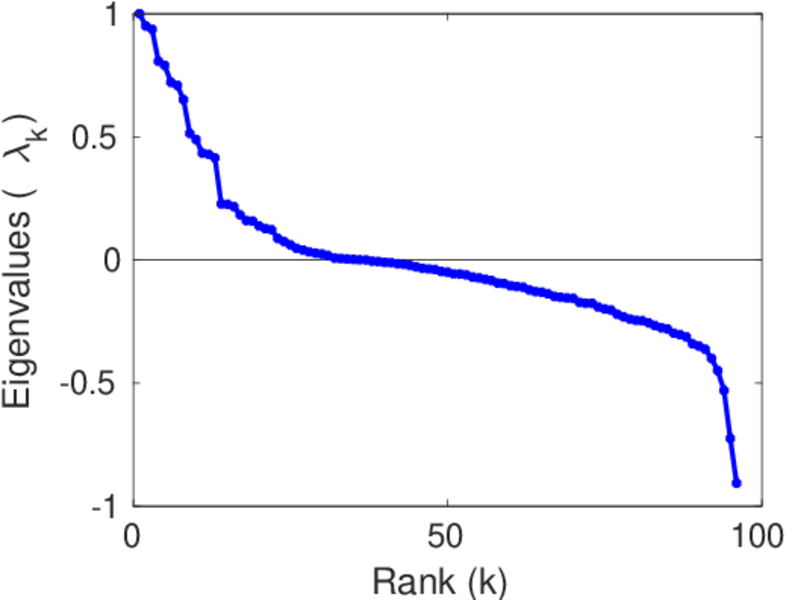
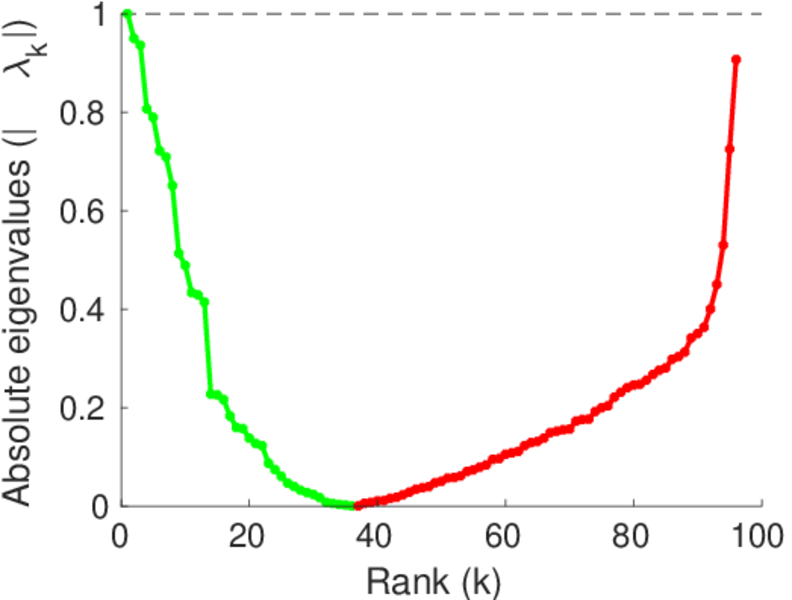
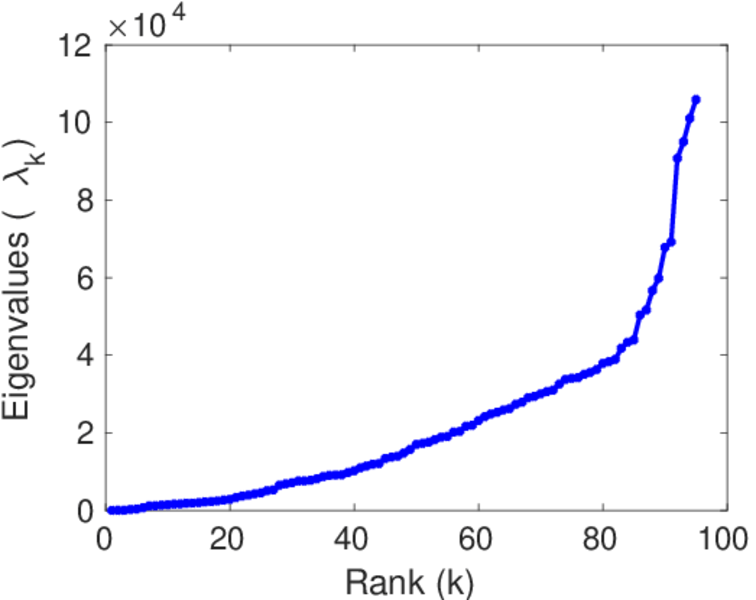
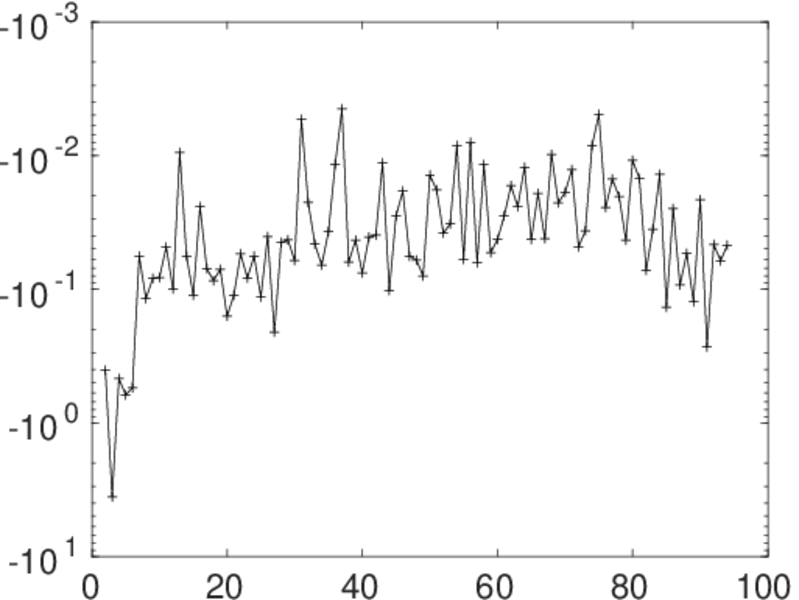
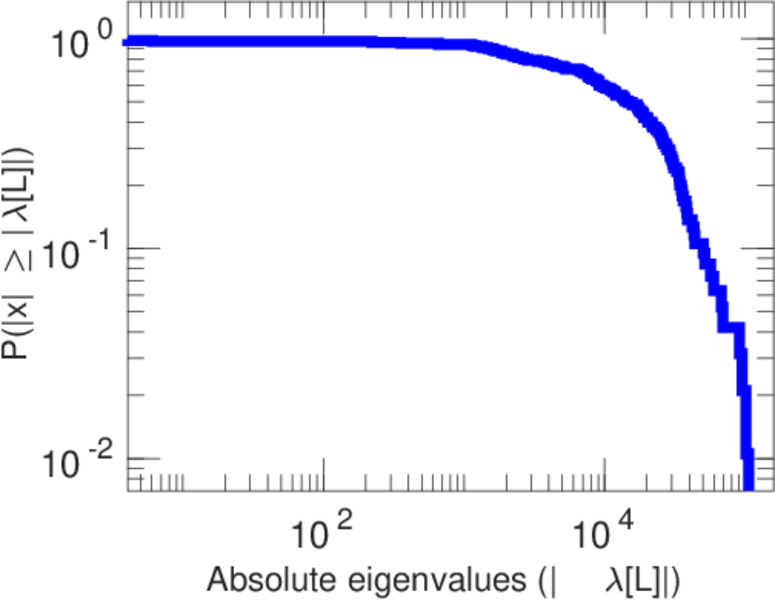
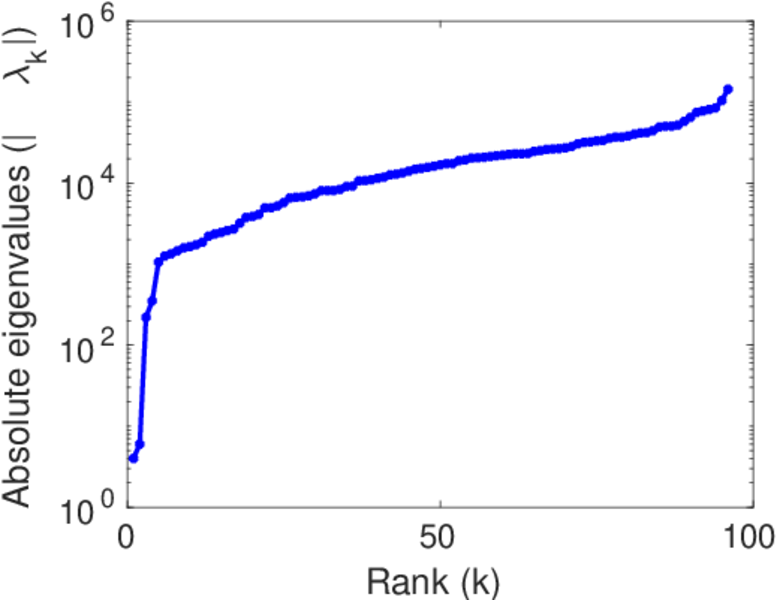
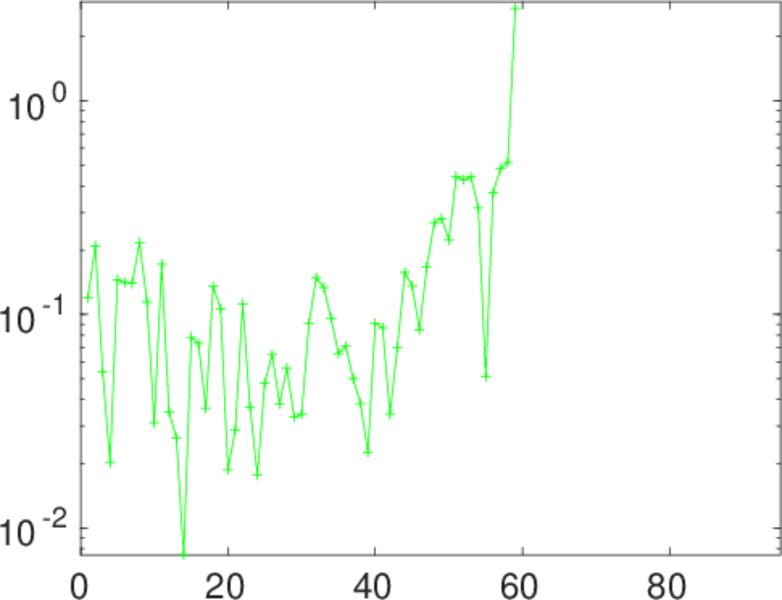
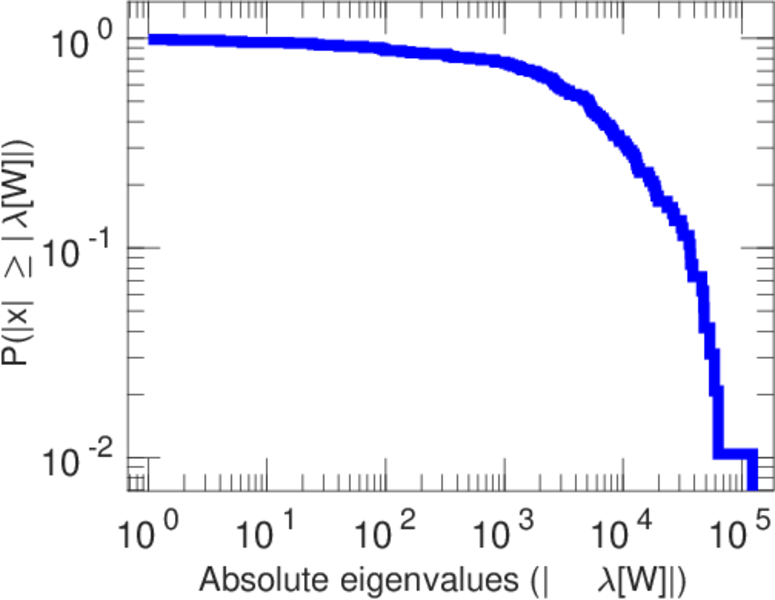
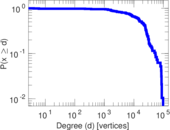
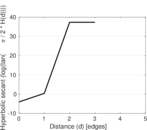
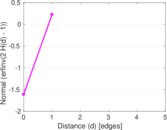
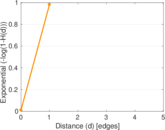
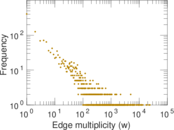
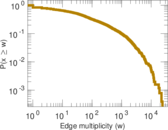
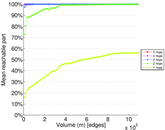
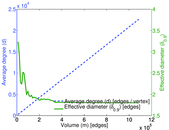
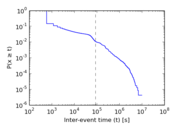
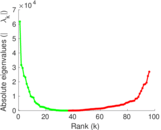
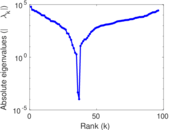
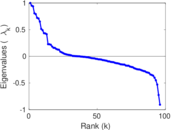
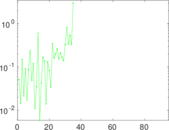
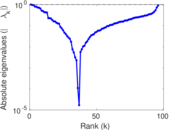
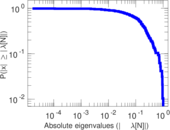
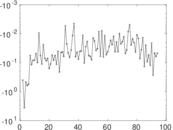
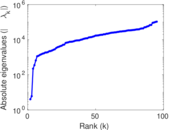
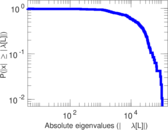
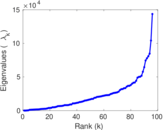
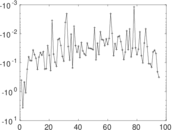
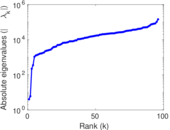
Plots


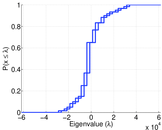
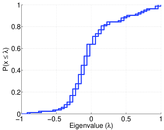


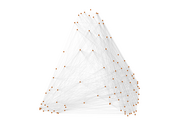
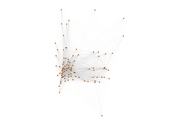


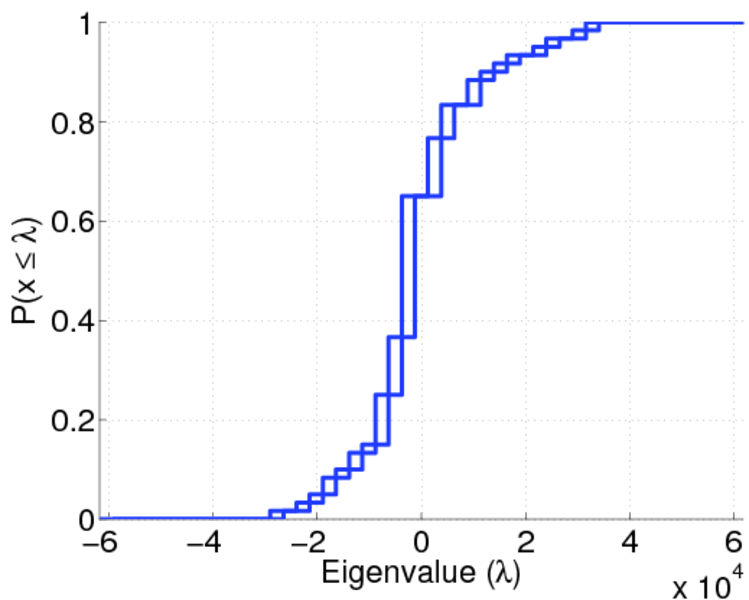
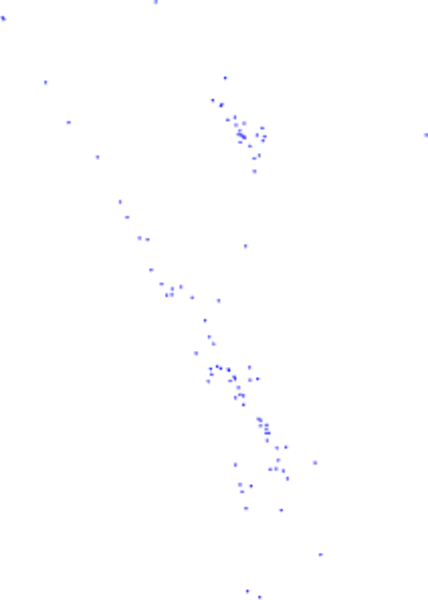
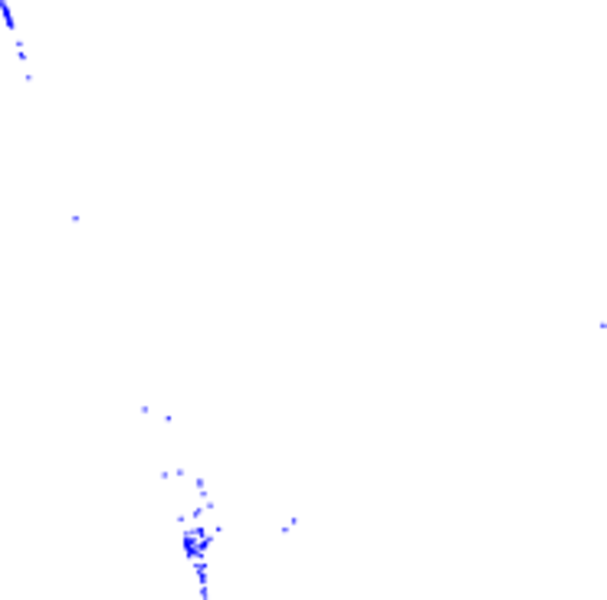
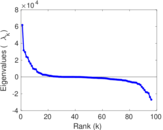
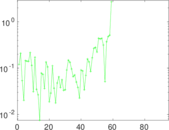
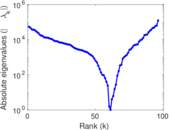
Matrix decompositions plots


Downloads
References
|
[1]
|
Jérôme Kunegis.
KONECT – The Koblenz Network Collection.
In Proc. Int. Conf. on World Wide Web Companion, pages
1343–1350, 2013.
[ http ]
|
|
[2]
|
Nathan Eagle and Alex (Sandy) Pentland.
Reality Mining: Sensing complex social systems.
Personal Ubiquitous Comput., 10(4):255–268, 2006.
|
 KONECT ‣ Networks ‣
Buy Me a Coffee
KONECT ‣ Networks ‣
Buy Me a Coffee