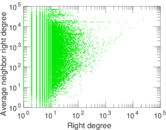
Twitter tag–item
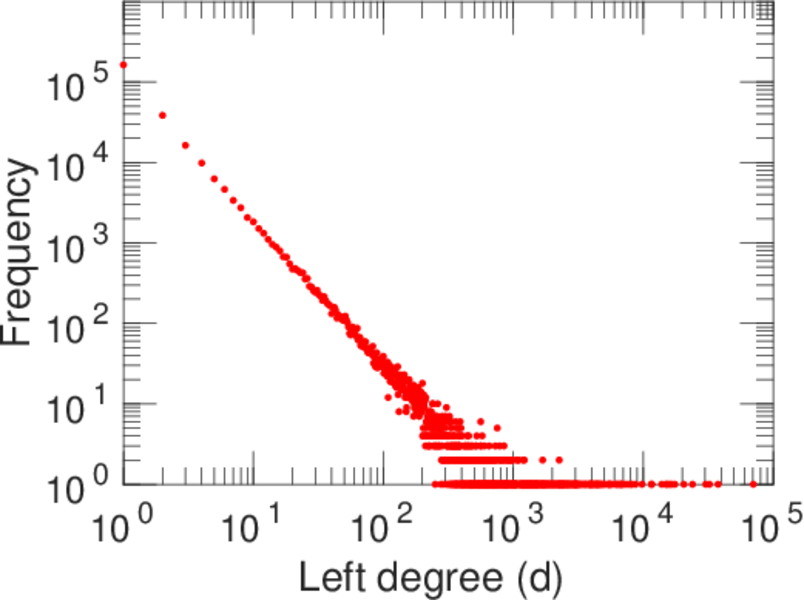
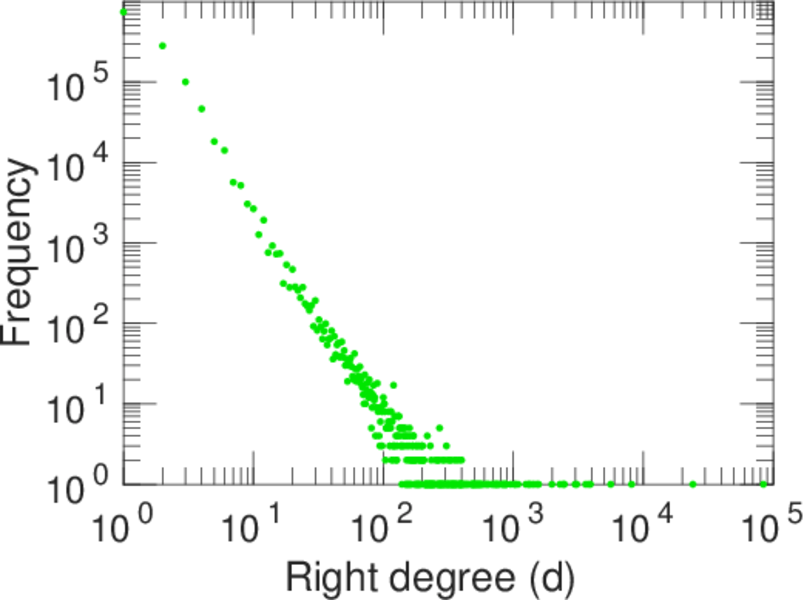
This is a bipartite network of tag–URL relations in Twitter. Left nodes
represent tags and right nodes represent URLs. An edge shows that an URL was
mentioned together with a given tag in a tweet.
Metadata
Statistics
| Size | n = | 1,502,611
|
| Left size | n1 = | 270,582
|
| Right size | n2 = | 1,232,029
|
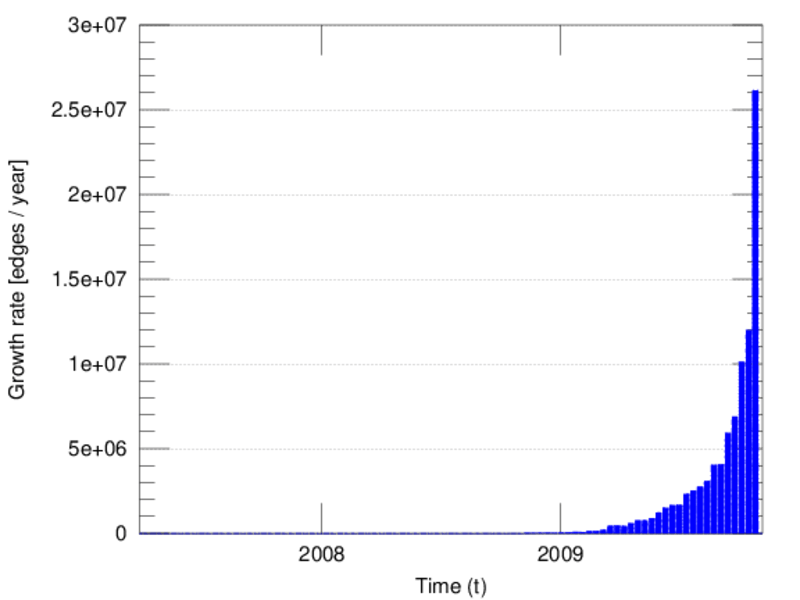
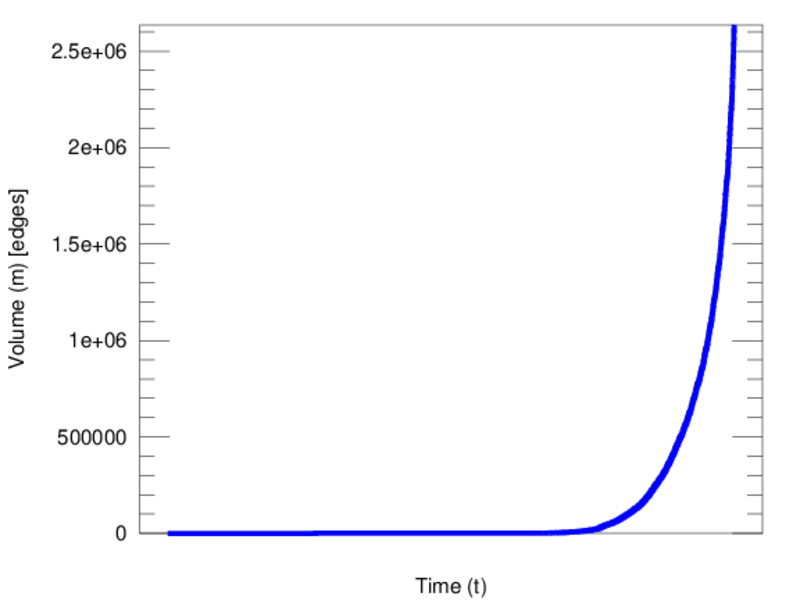
| Volume | m = | 2,635,885
|
| Unique edge count | m̿ = | 1,996,158
|
| Wedge count | s = | 4,418,323,415
|
| Claw count | z = | 51,877,537,933,158
|
| Square count | q = | 70,327,726
|
| 4-Tour count | T4 = | 18,239,948,076
|
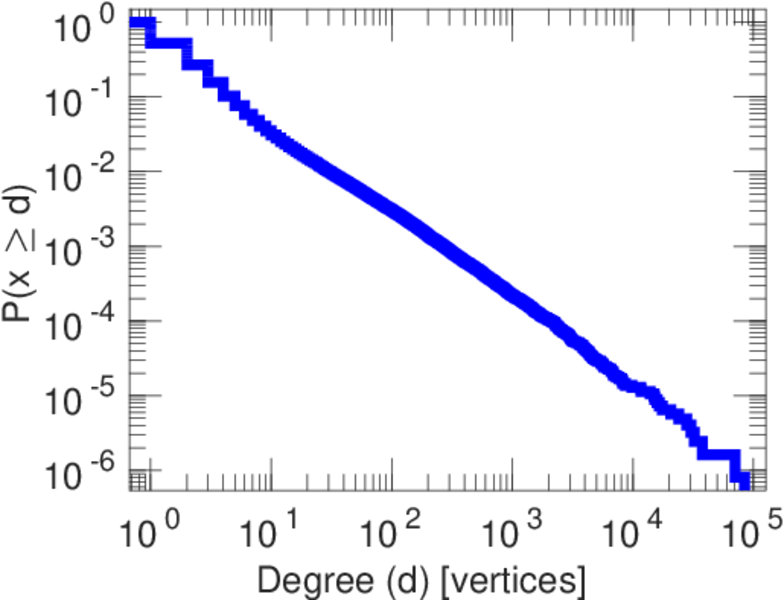
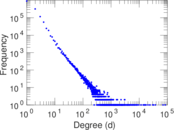
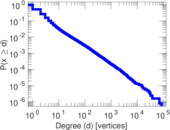
| Maximum degree | dmax = | 84,158
|
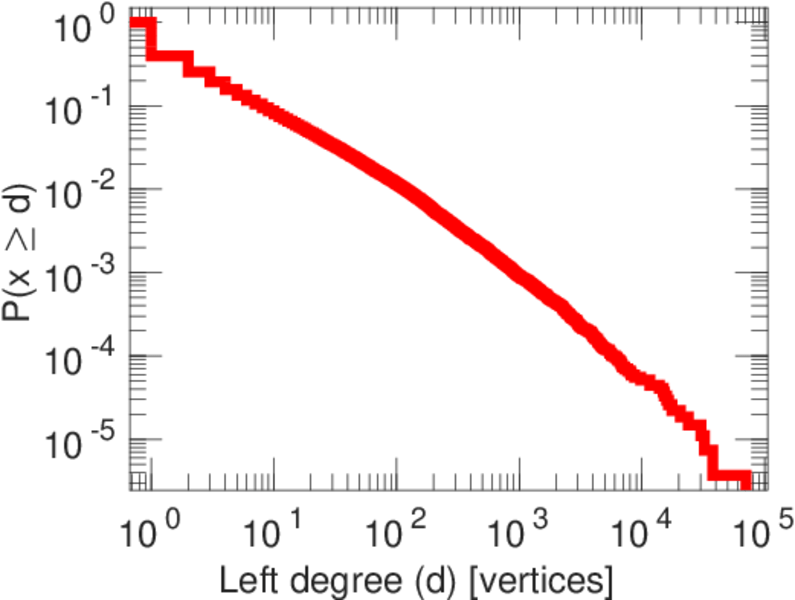
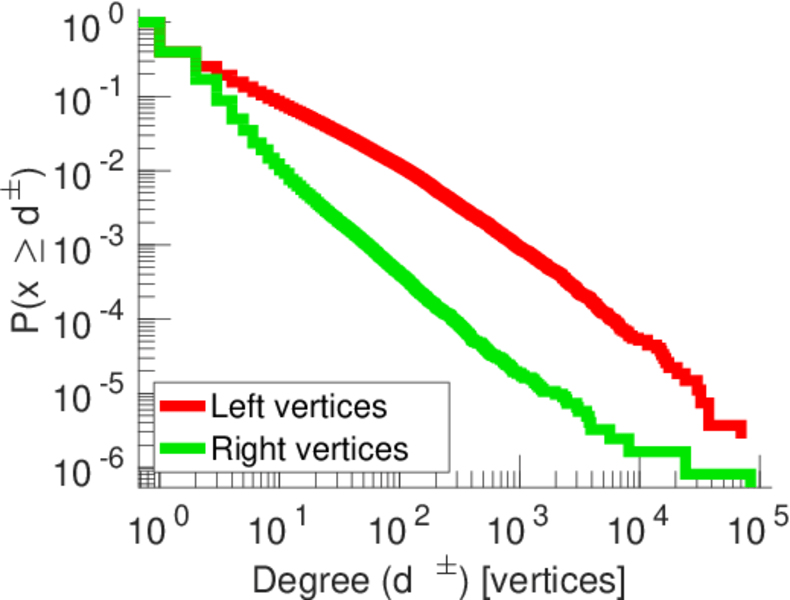
| Maximum left degree | d1max = | 70,377
|
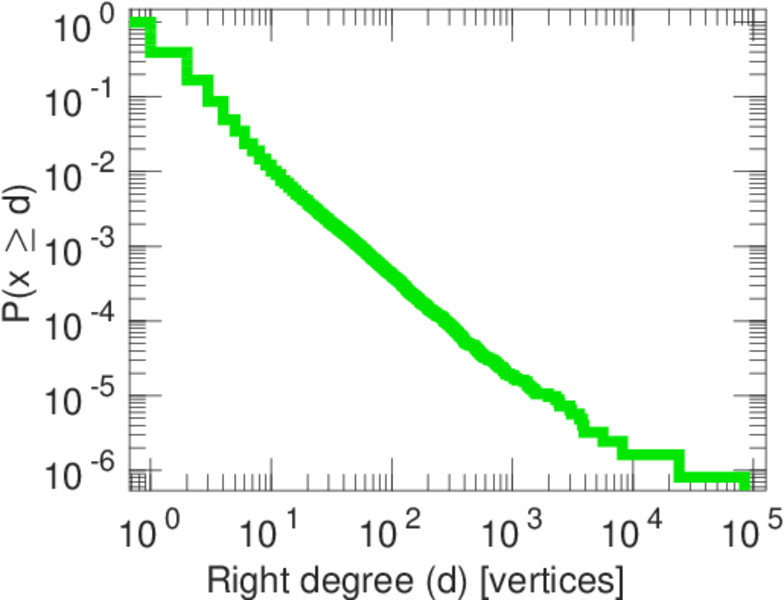
| Maximum right degree | d2max = | 84,158
|
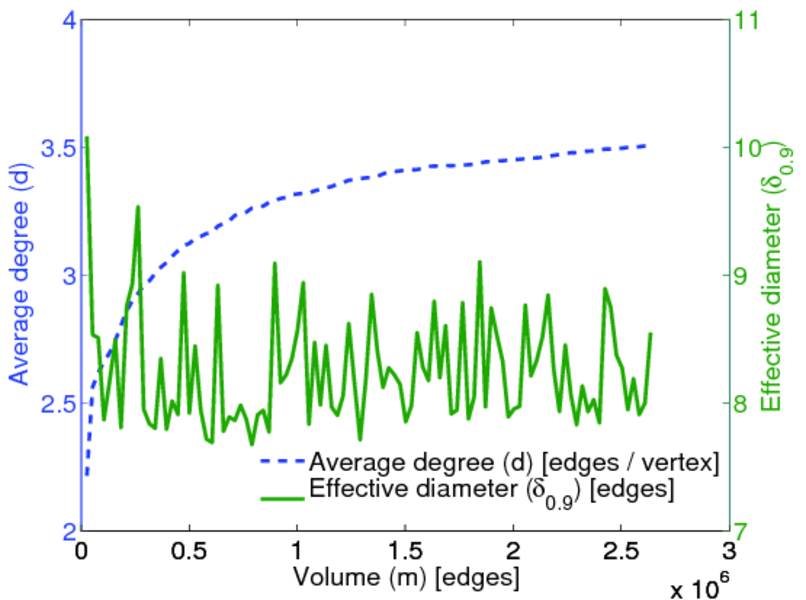
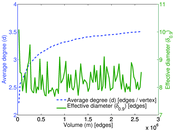
| Average degree | d = | 3.508 41
|
| Average left degree | d1 = | 9.741 54
|
| Average right degree | d2 = | 2.139 47
|
| Fill | p = | 5.987 91 × 10−6
|
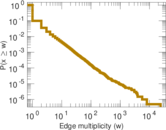
| Average edge multiplicity | m̃ = | 1.320 48
|
| Size of LCC | N = | 1,234,934
|
| Diameter | δ = | 31
|
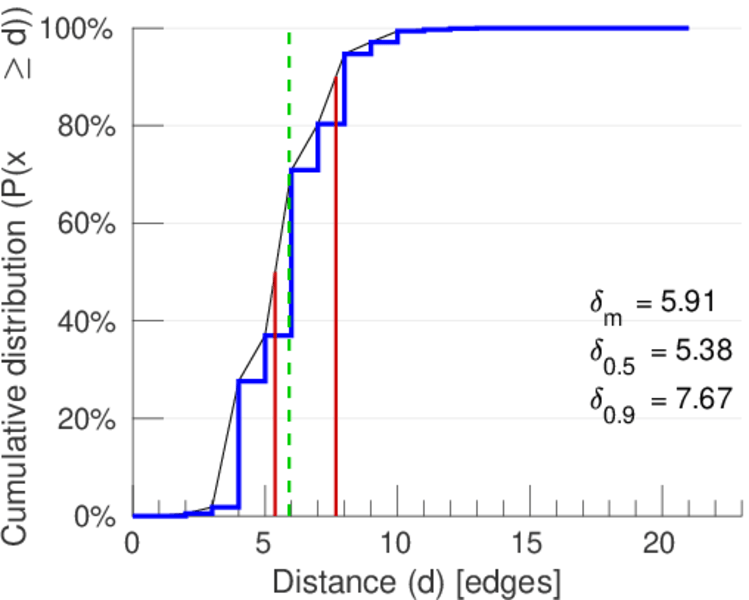
| 50-Percentile effective diameter | δ0.5 = | 5.383 58
|
| 90-Percentile effective diameter | δ0.9 = | 7.672 44
|
| Median distance | δM = | 6
|
| Mean distance | δm = | 5.911 57
|
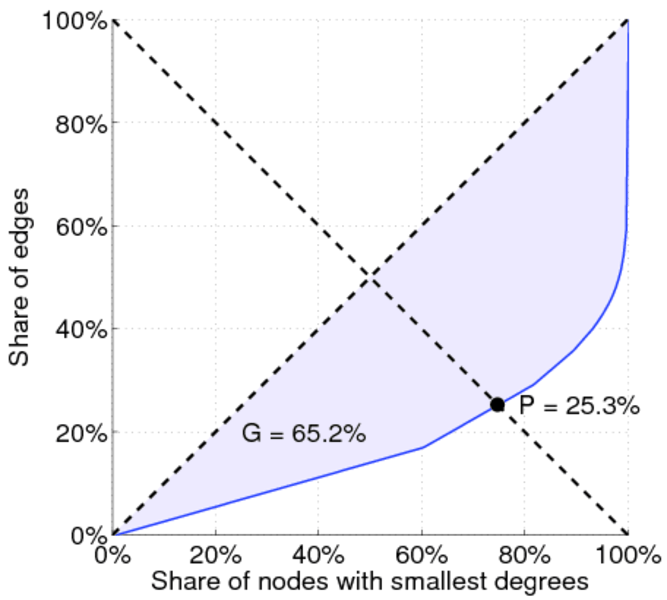
| Gini coefficient | G = | 0.671 119
|
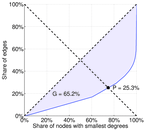
| Balanced inequality ratio | P = | 0.244 057
|
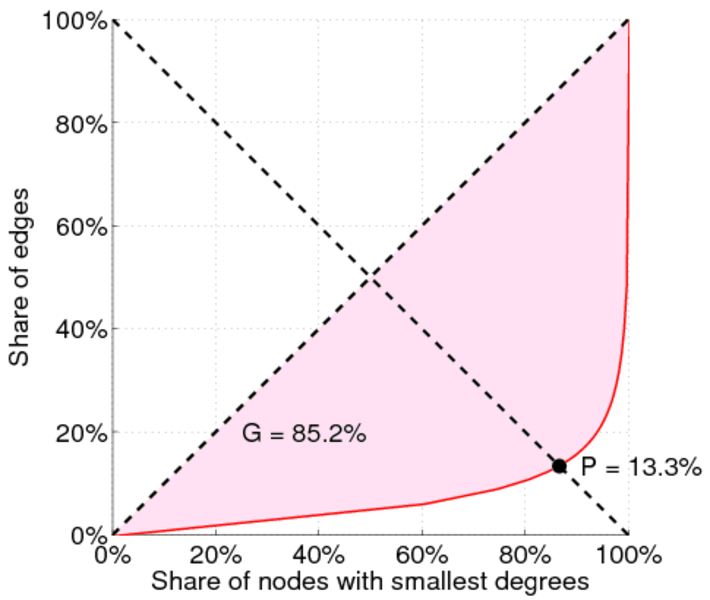
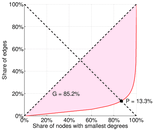
| Left balanced inequality ratio | P1 = | 0.133 490
|
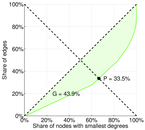
| Right balanced inequality ratio | P2 = | 0.335 298
|
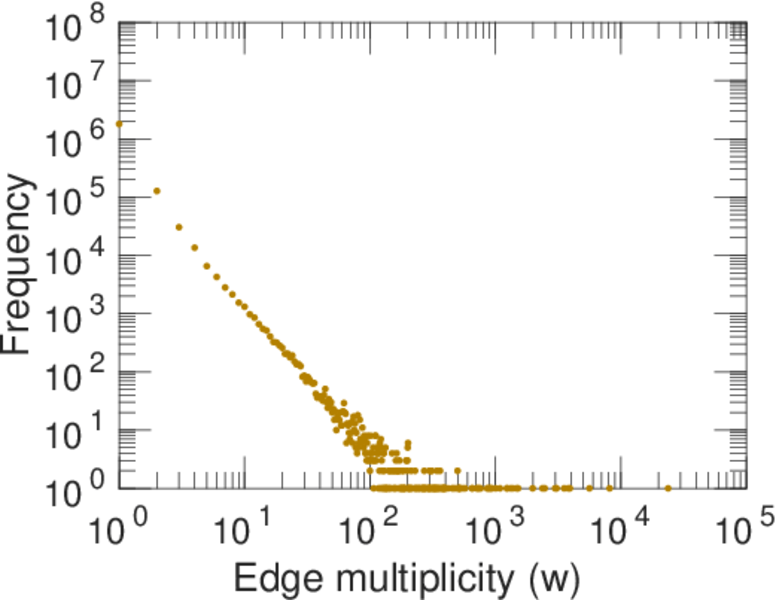
| Power law exponent | γ = | 3.792 46
|
| Tail power law exponent | γt = | 1.941 00
|
| Degree assortativity | ρ = | −0.036 948 5
|
| Degree assortativity p-value | pρ = | 0.000 00
|
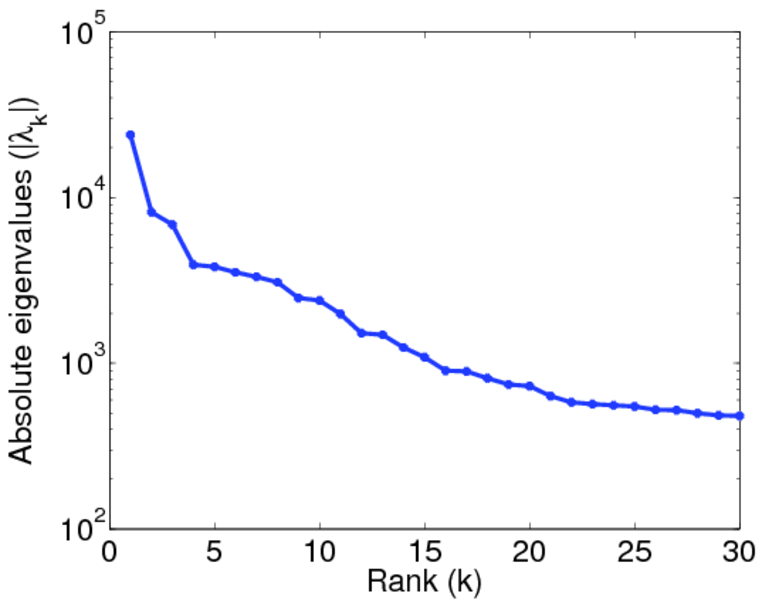
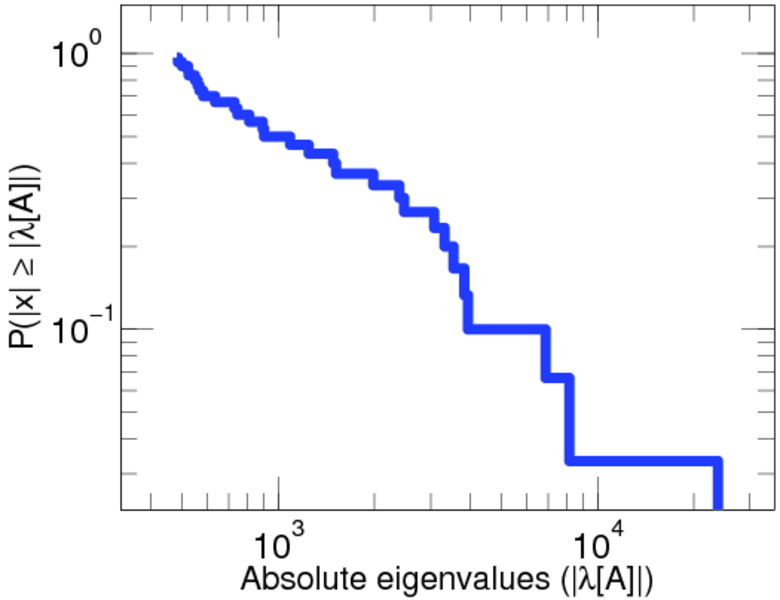
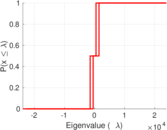
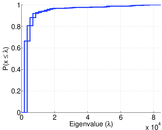
| Spectral norm | α = | 23,853.3
|
| Algebraic connectivity | a = | 0.000 301 907
|
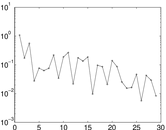
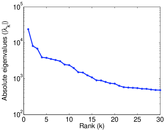
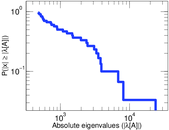
| Spectral separation | |λ1[A] / λ2[A]| = | 2.926 07
|
| Controllability | C = | 1,040,405
|
| Relative controllability | Cr = | 0.692 398
|
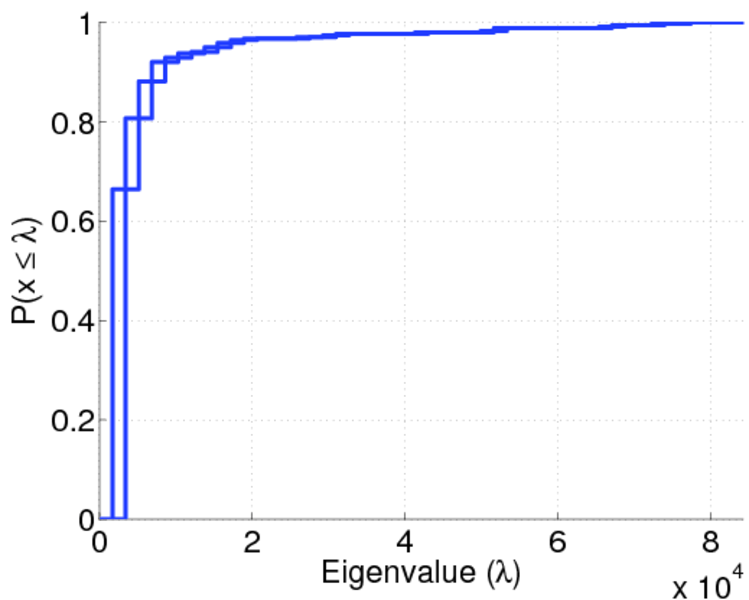
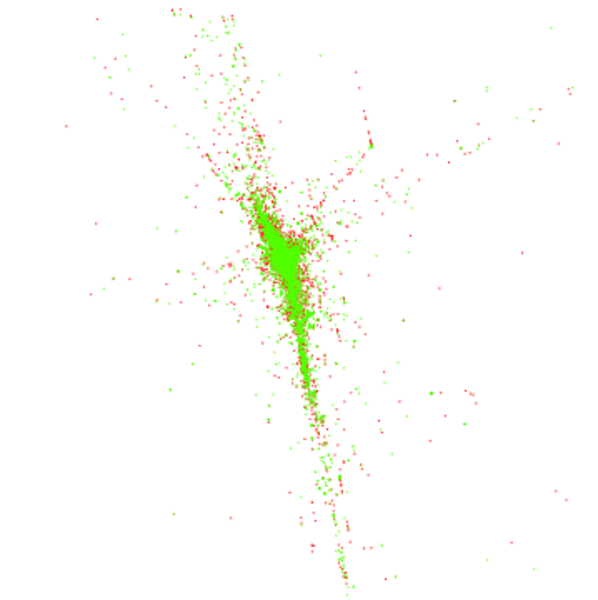
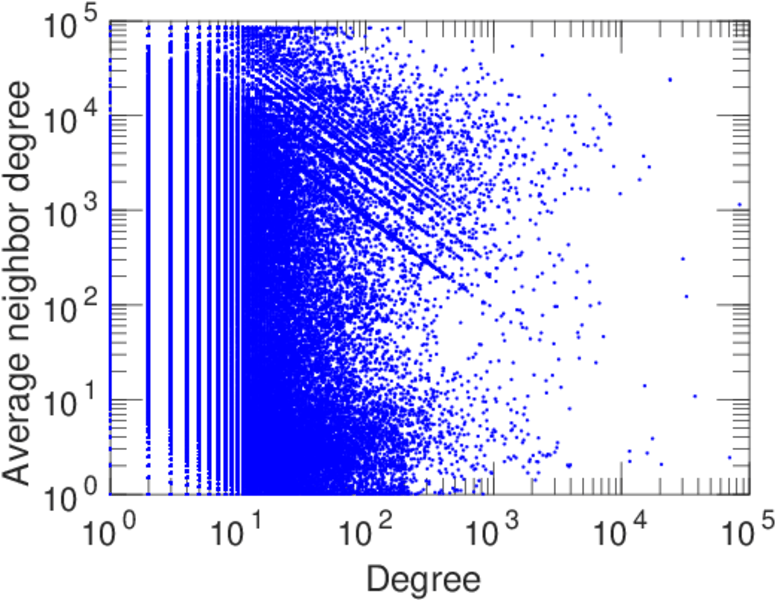
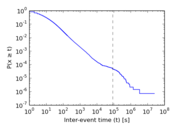
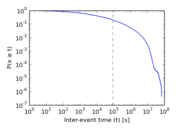
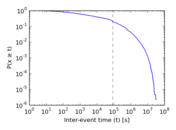
Plots


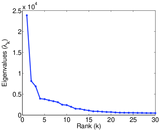
Matrix decompositions plots
Downloads
References
|
[1]
|
Jérôme Kunegis.
KONECT – The Koblenz Network Collection.
In Proc. Int. Conf. on World Wide Web Companion, pages
1343–1350, 2013.
[ http ]
|
|
[2]
|
Munmun De Choudhury, Yu-Ru Lin, Hari Sundaram, K. Selçuk Candan, Lexing Xie,
and Aisling Kelliher.
How does the data sampling strategy impact the discovery of
information diffusion in social media?
In ICWSM, pages 34–41, 2010.
|
 KONECT ‣ Networks ‣
Buy Me a Coffee
KONECT ‣ Networks ‣
Buy Me a Coffee