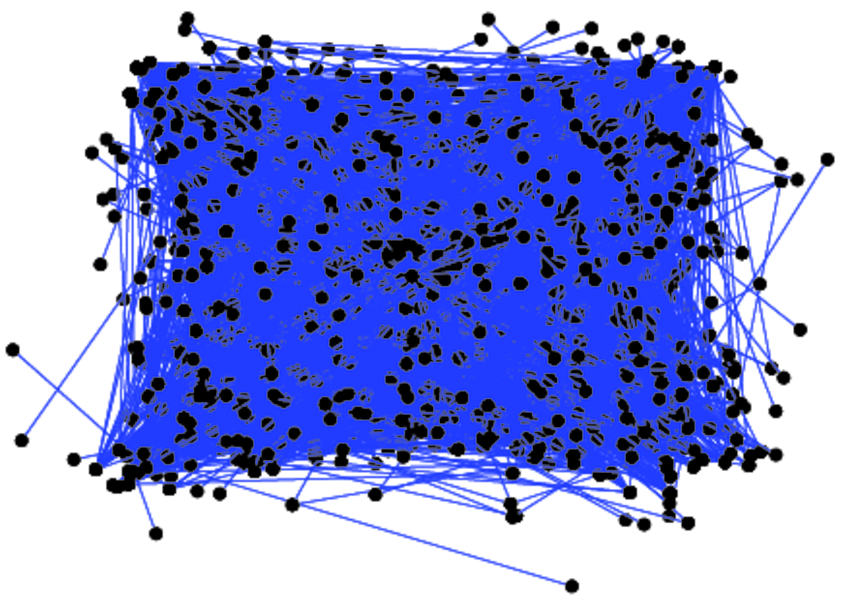
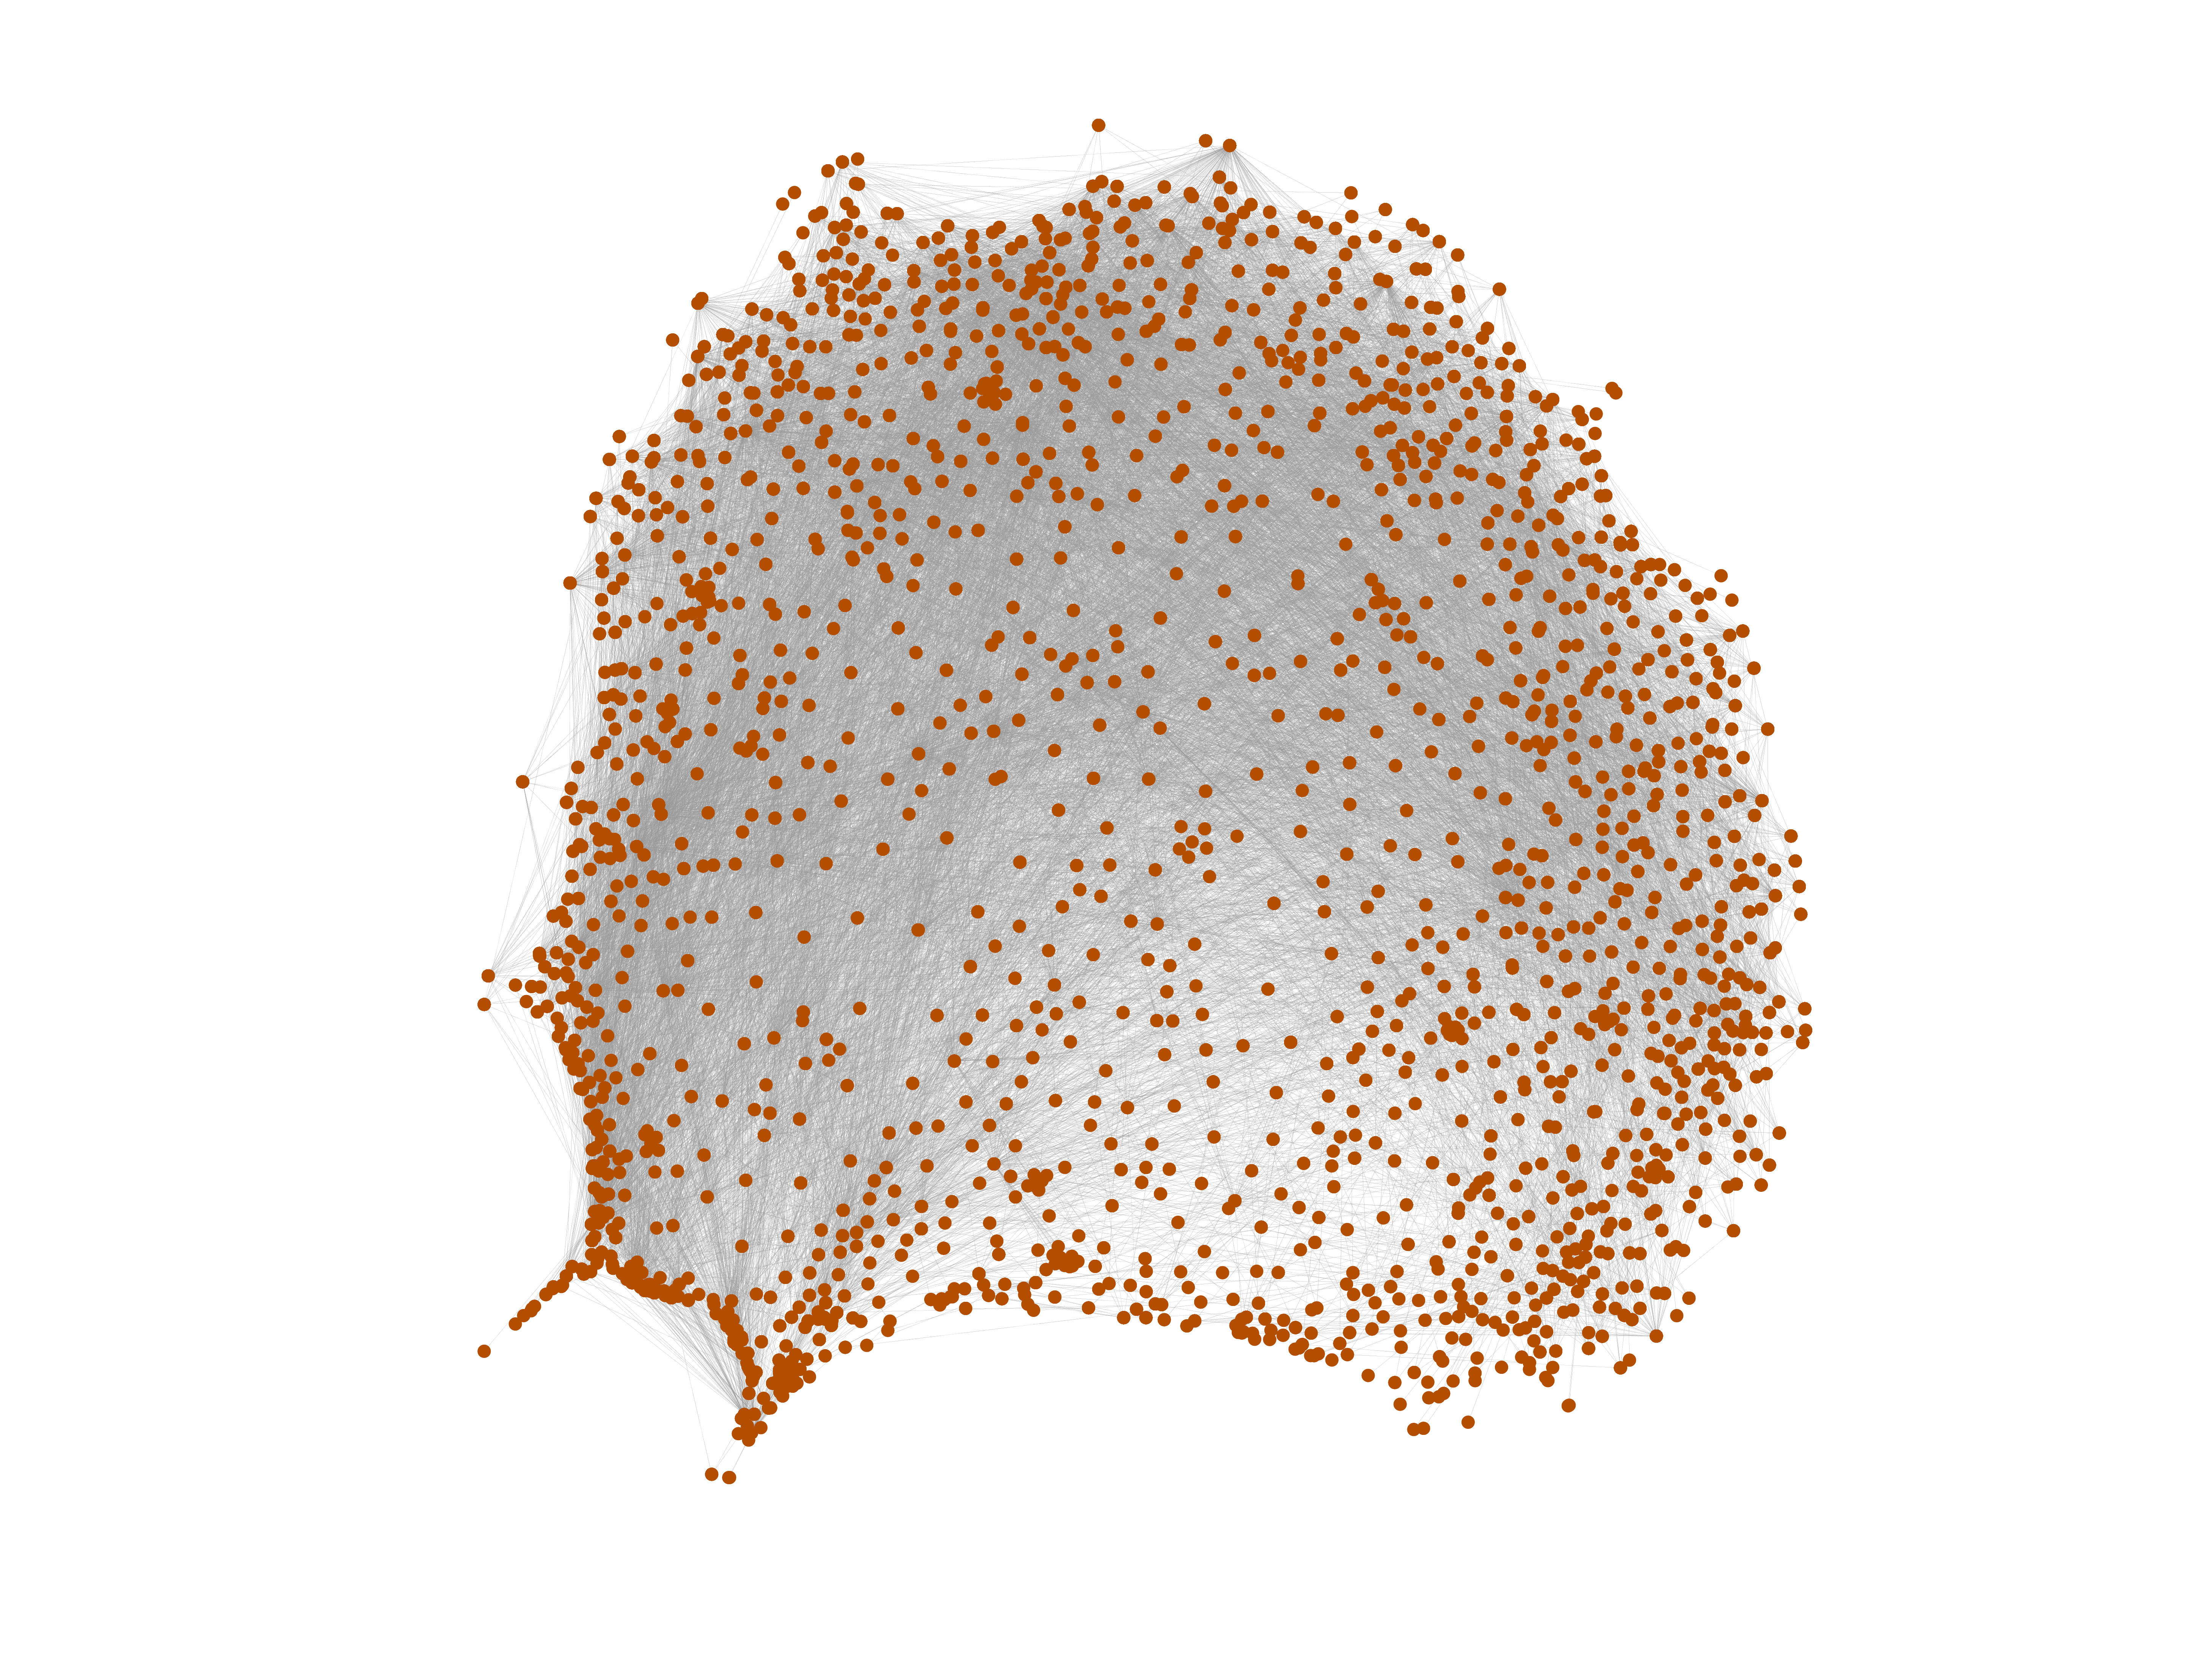
UC Irvine messages
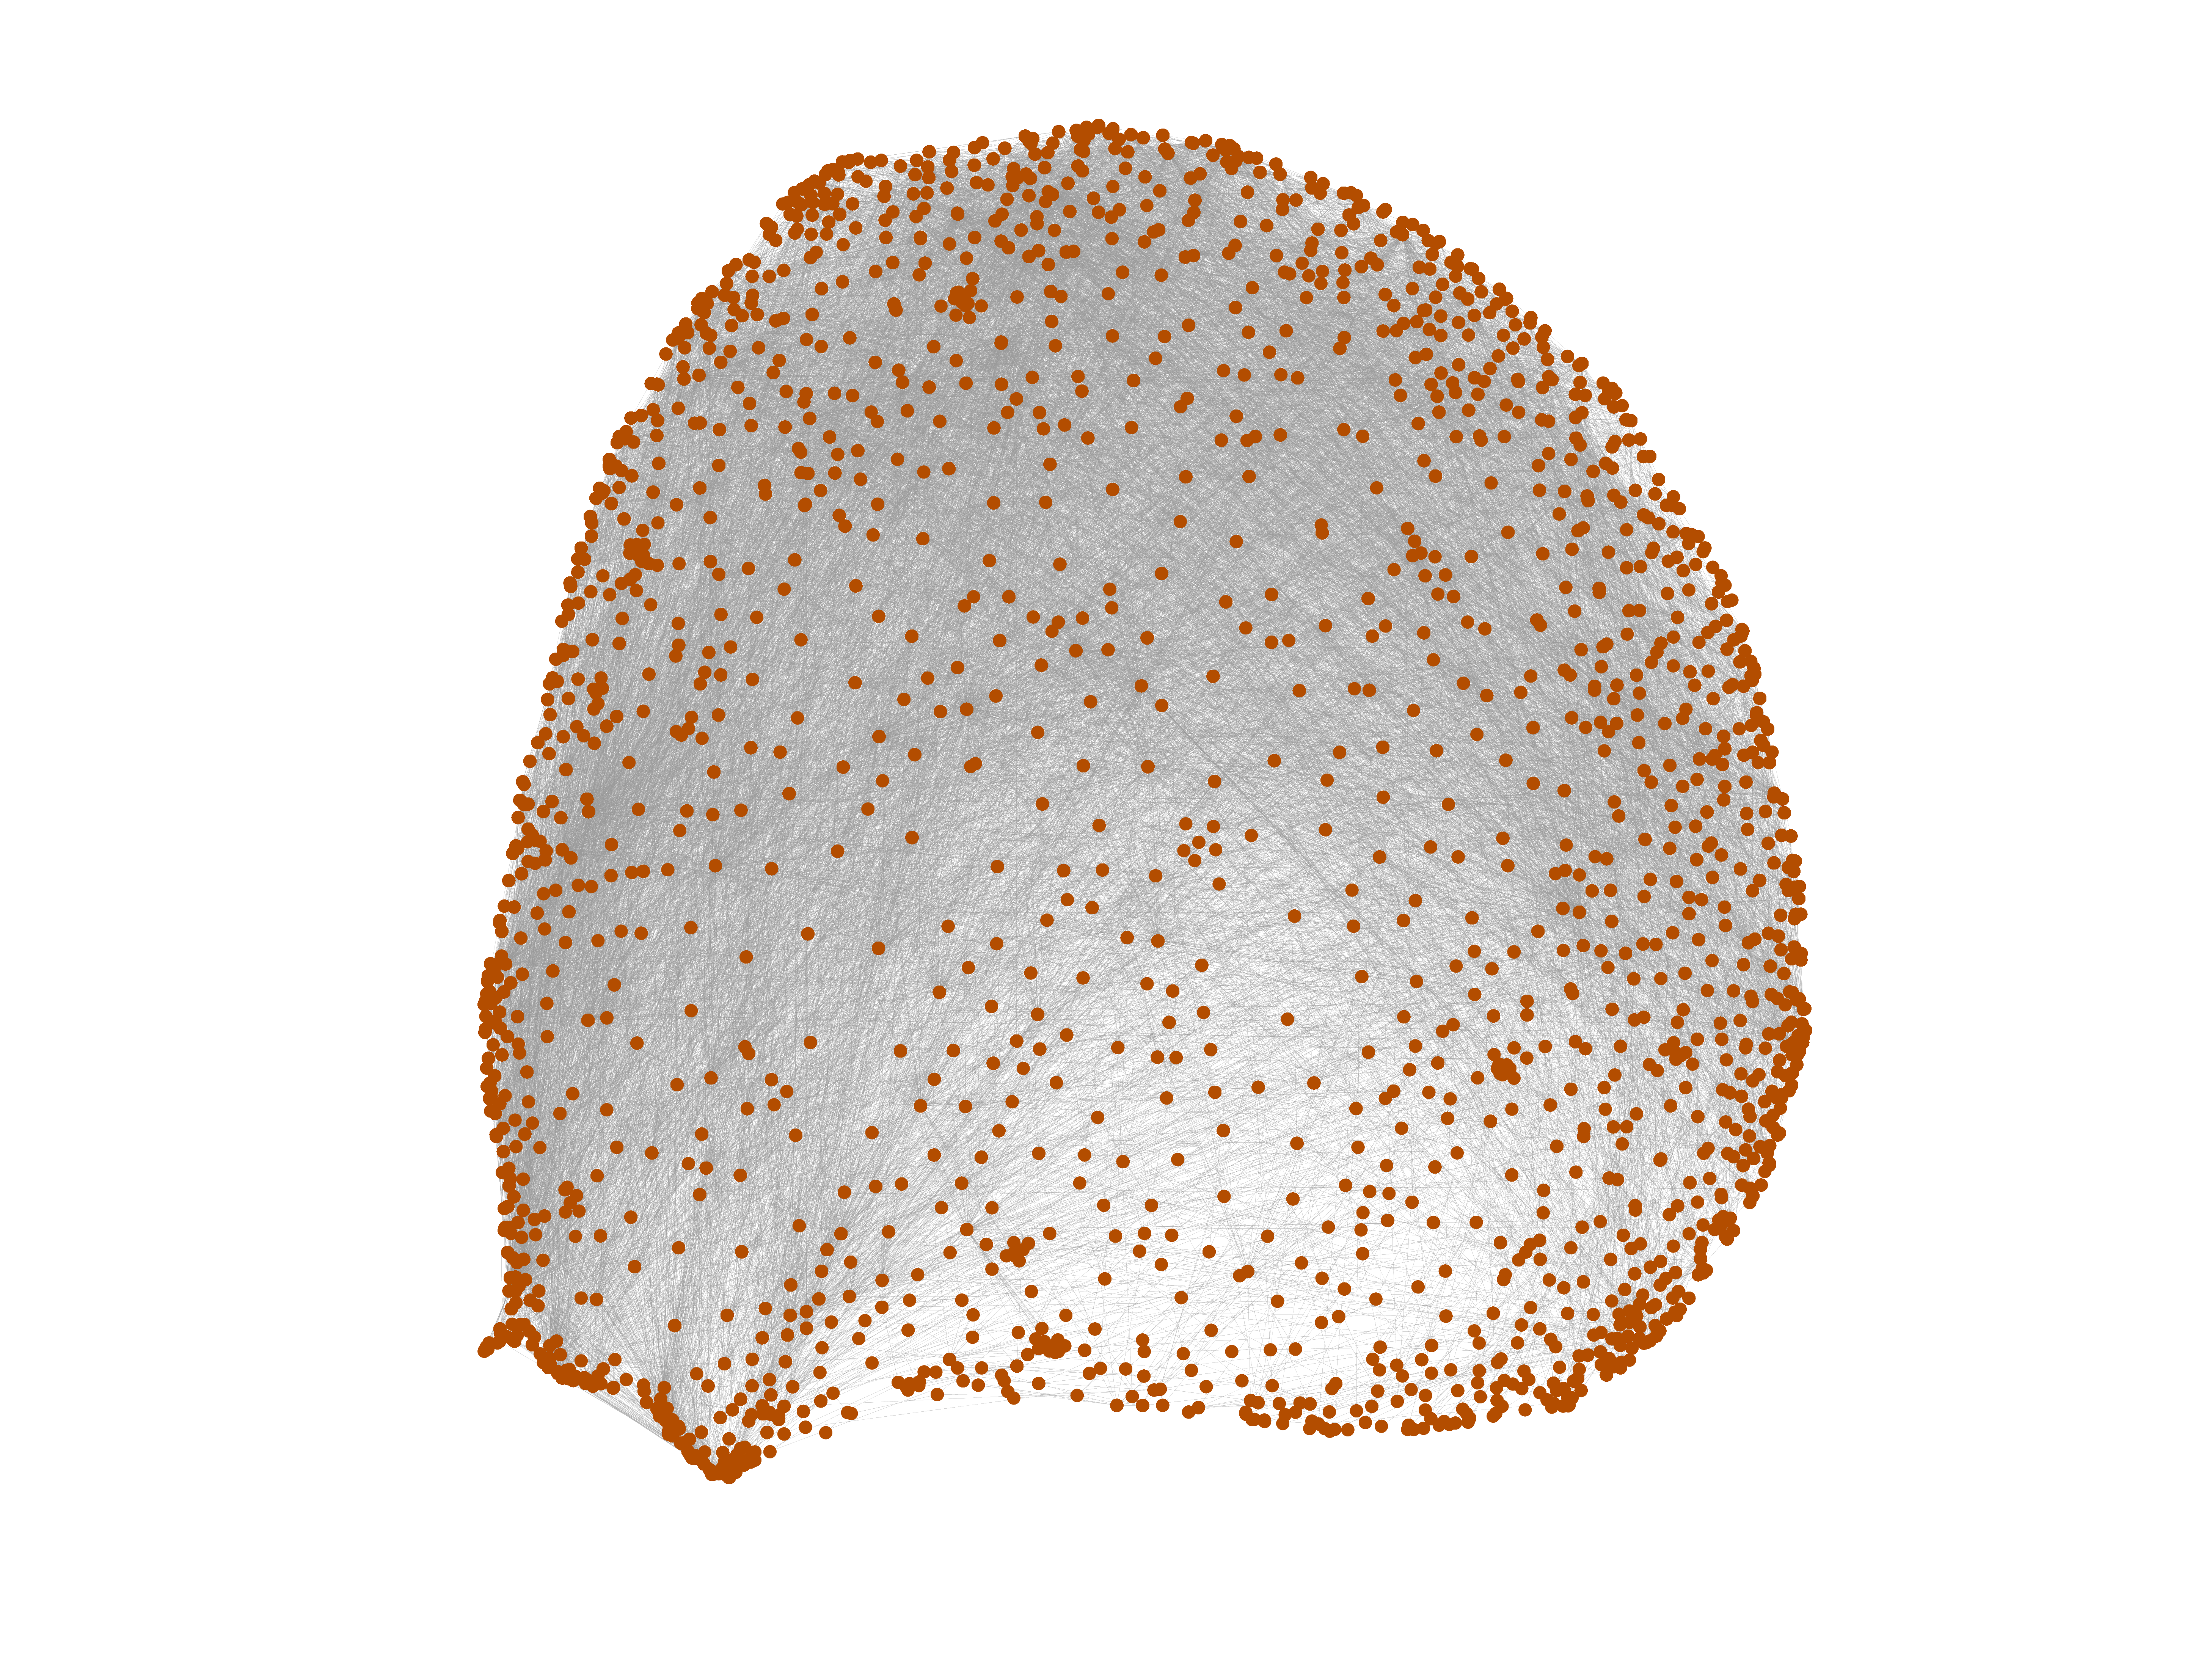
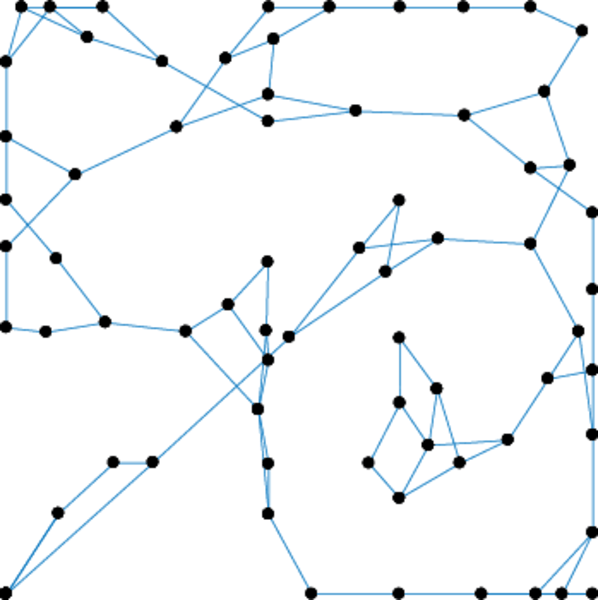
This directed network contains sent messages between the users of an online
community of students from the University of California, Irvine. A node
represents a user. A directed edge represents a sent message. Multiple edges
denote multiple messages.
Metadata
Statistics
| Size | n = | 1,899
|
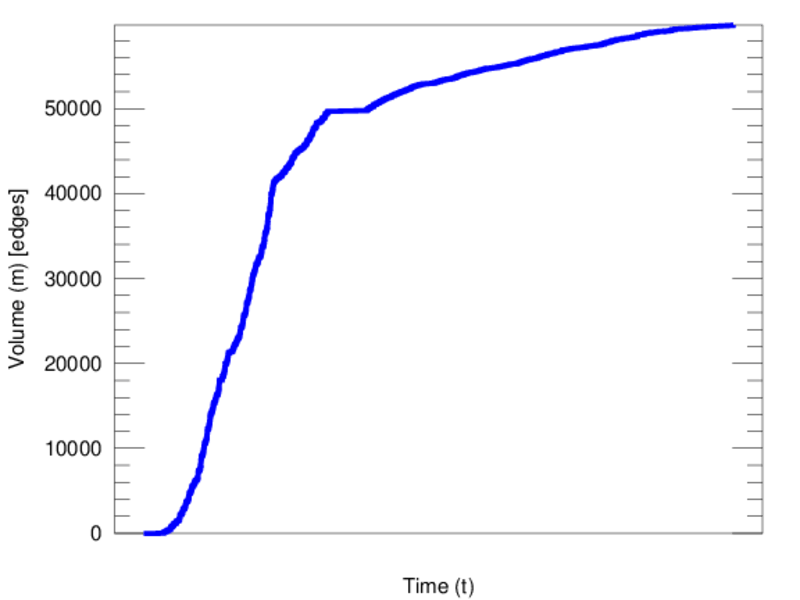
| Volume | m = | 59,835
|
| Unique edge count | m̿ = | 20,296
|
| Loop count | l = | 0
|
| Wedge count | s = | 755,882
|
| Claw count | z = | 82,140,043
|
| Cross count | x = | 4,357,774,499
|
| Triangle count | t = | 14,319
|
| Square count | q = | 729,064
|
| 4-Tour count | T4 = | 8,883,716
|
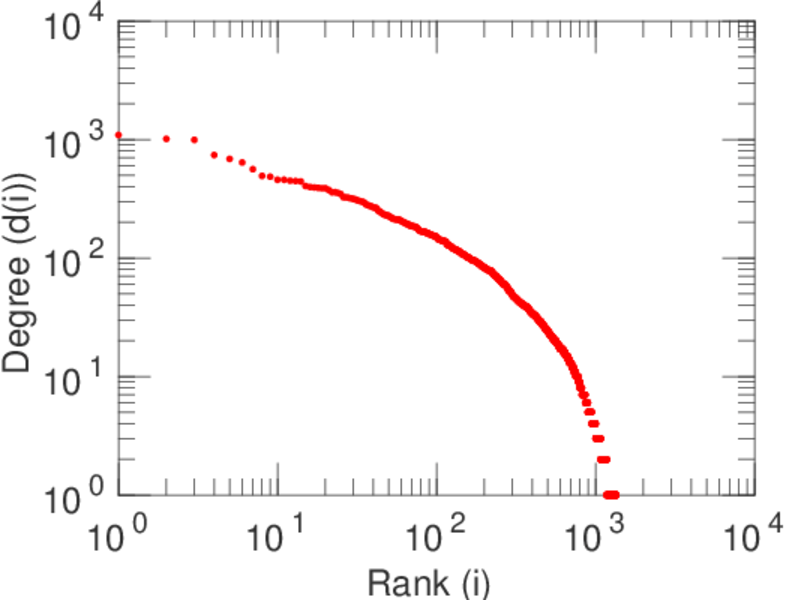
| Maximum degree | dmax = | 1,546
|
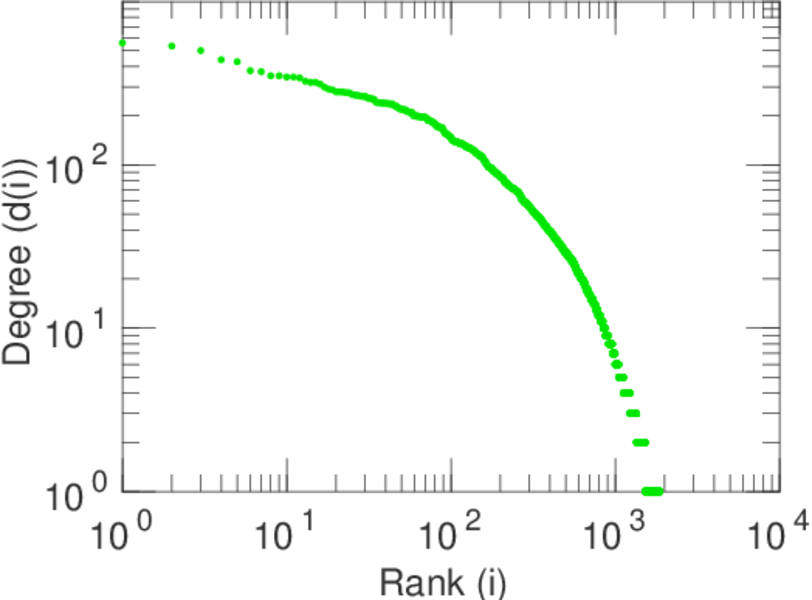
| Maximum outdegree | d+max = | 1,091
|
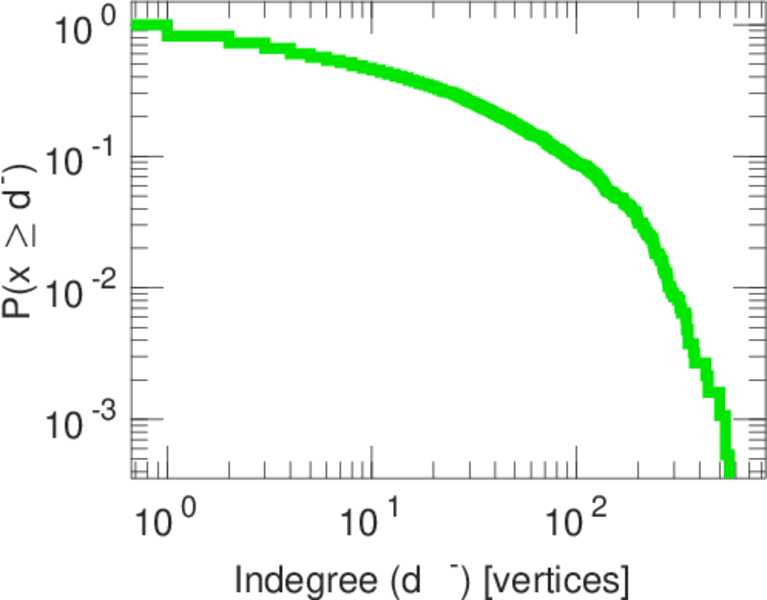
| Maximum indegree | d−max = | 558
|
| Average degree | d = | 63.017 4
|
| Fill | p = | 0.005 631 05
|
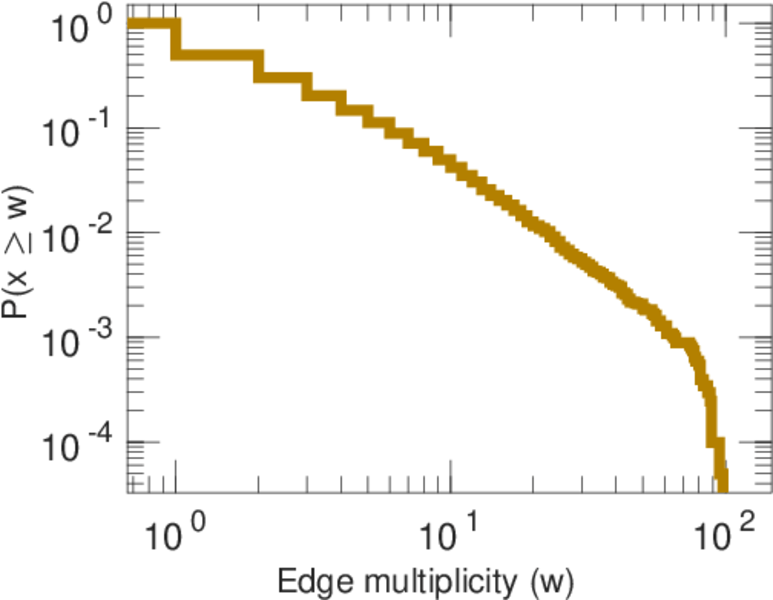
| Average edge multiplicity | m̃ = | 2.948 12
|
| Size of LCC | N = | 1,893
|
| Size of LSCC | Ns = | 1,294
|
| Relative size of LSCC | Nrs = | 0.681 411
|
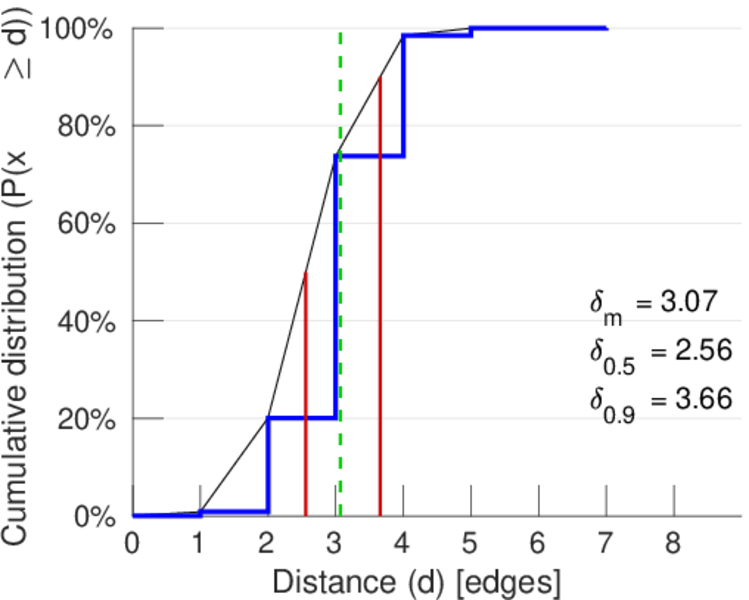
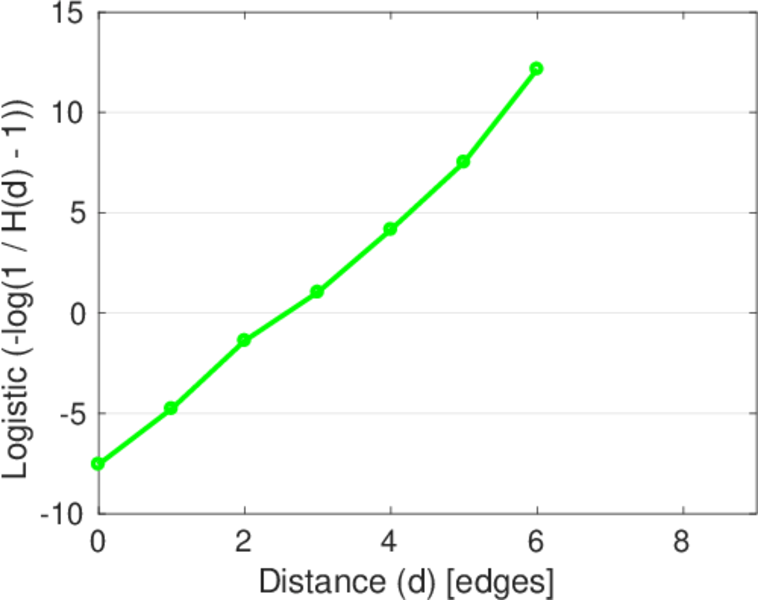
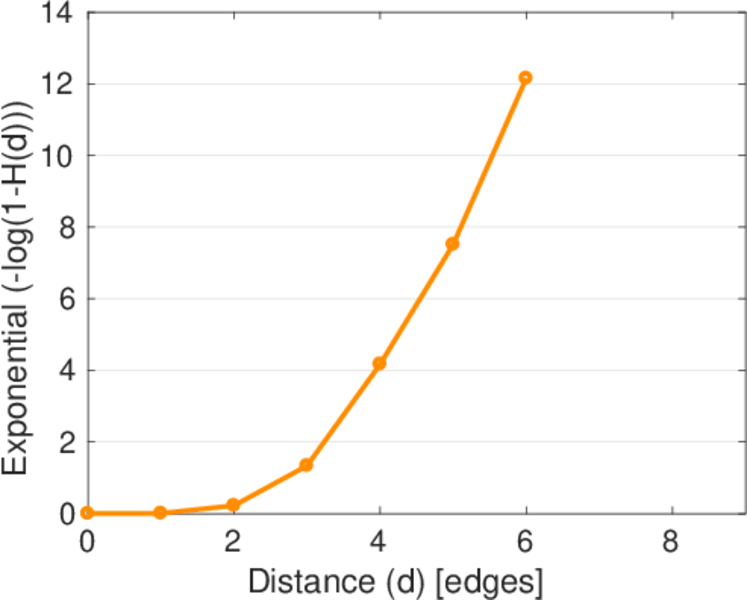
| Diameter | δ = | 8
|
| 50-Percentile effective diameter | δ0.5 = | 2.557 66
|
| 90-Percentile effective diameter | δ0.9 = | 3.657 93
|
| Median distance | δM = | 3
|
| Mean distance | δm = | 3.068 97
|
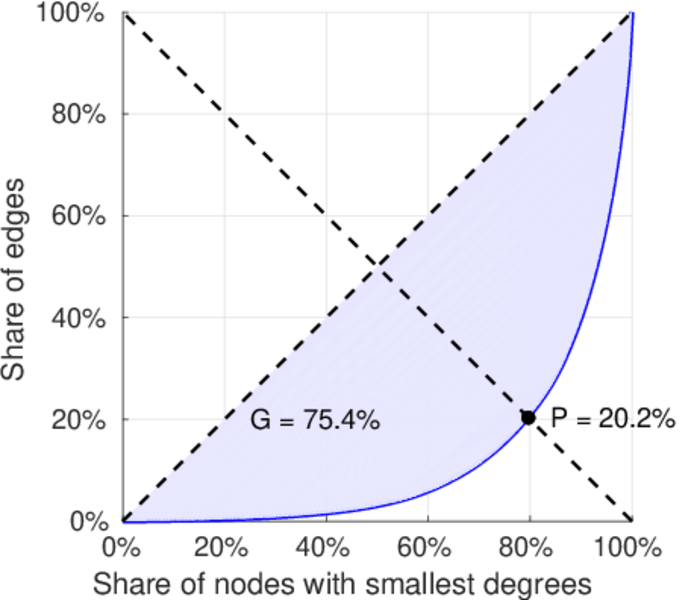
| Gini coefficient | G = | 0.753 661
|
| Balanced inequality ratio | P = | 0.201 905
|
| Outdegree balanced inequality ratio | P+ = | 0.219 420
|
| Indegree balanced inequality ratio | P− = | 0.212 150
|
| Relative edge distribution entropy | Her = | 0.889 659
|
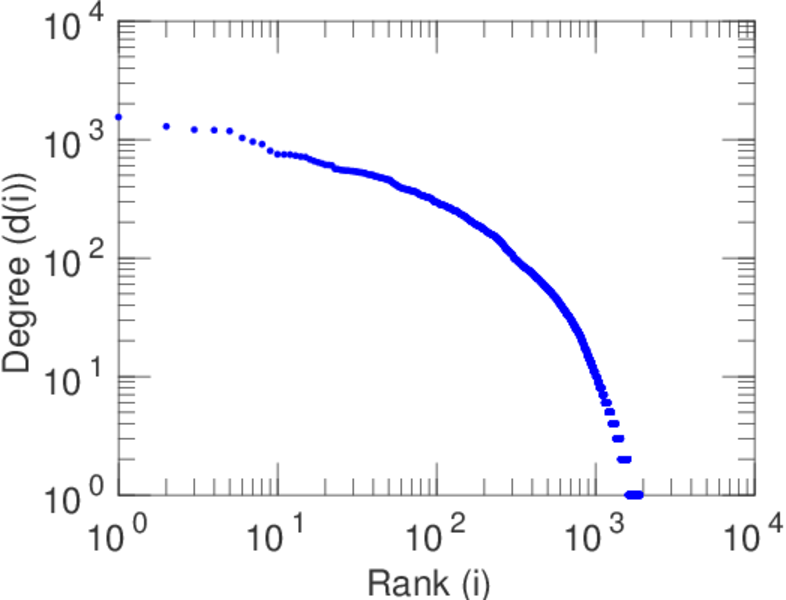
| Power law exponent | γ = | 1.562 87
|
| Tail power law exponent | γt = | 2.831 00
|
| Tail power law exponent with p | γ3 = | 2.831 00
|
| p-value | p = | 0.018 000 0
|
| Outdegree tail power law exponent with p | γ3,o = | 2.671 00
|
| Outdegree p-value | po = | 0.091 000 0
|
| Indegree tail power law exponent with p | γ3,i = | 3.821 00
|
| Indegree p-value | pi = | 0.396 000
|
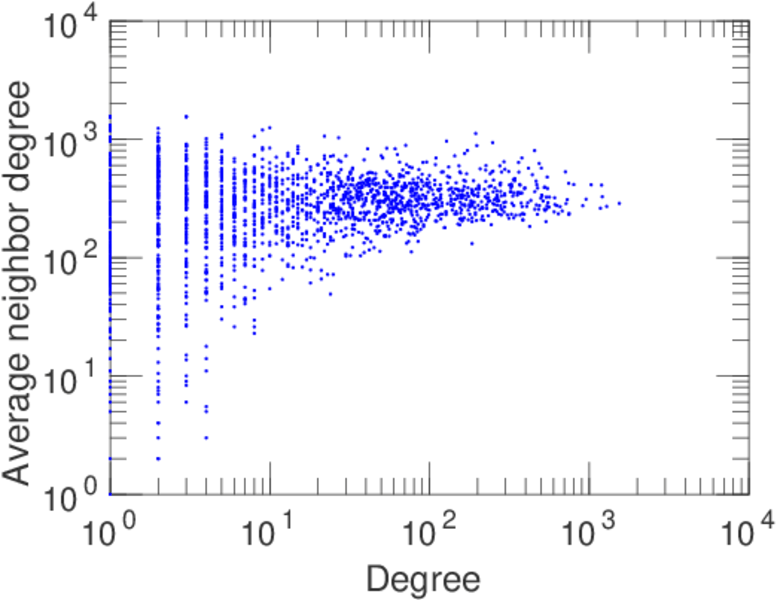
| Degree assortativity | ρ = | −0.187 776
|
| Degree assortativity p-value | pρ = | 4.937 81 × 10−218
|
| In/outdegree correlation | ρ± = | +0.900 204
|
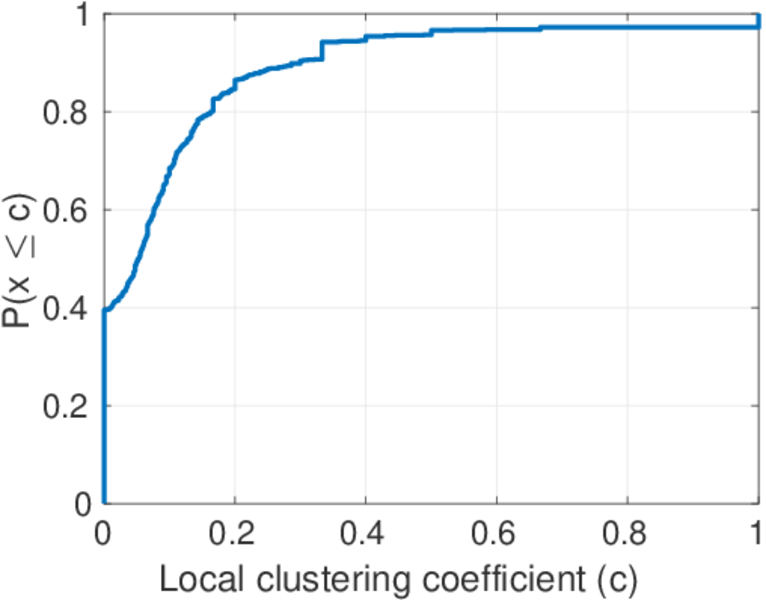
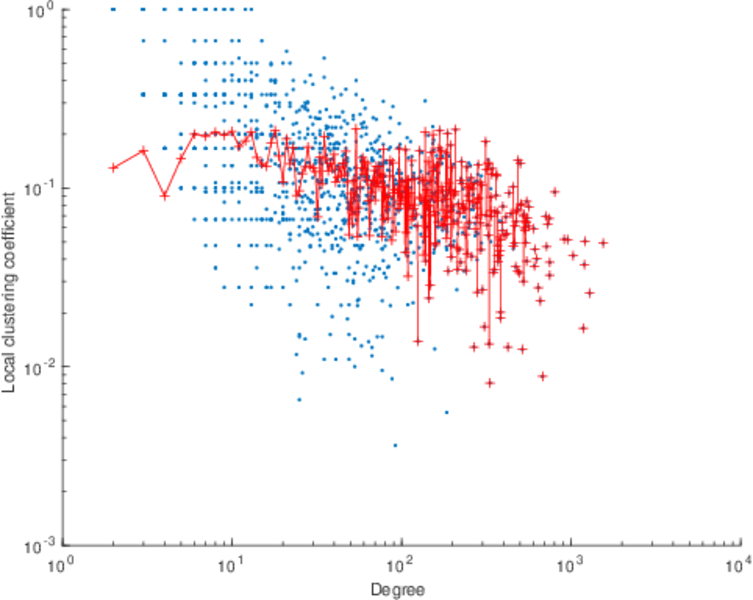
| Clustering coefficient | c = | 0.056 830 3
|
| Directed clustering coefficient | c± = | 0.054 659 1
|
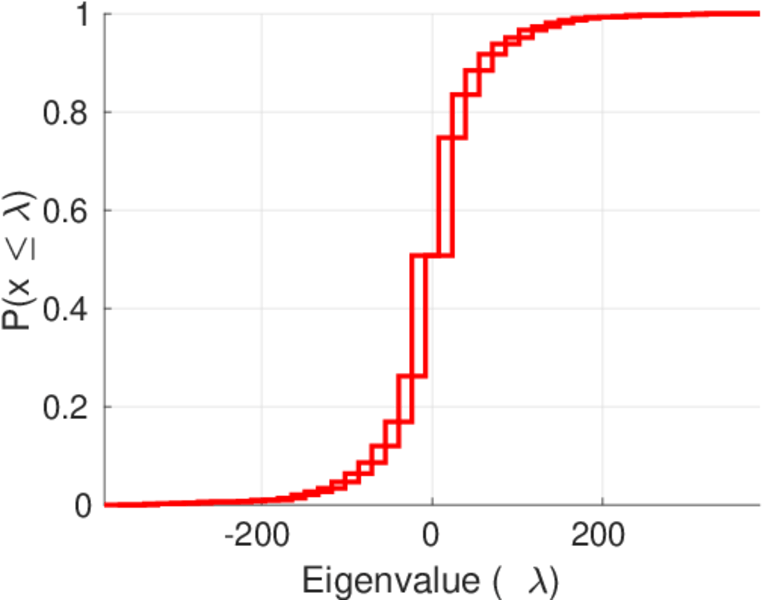
| Spectral norm | α = | 384.619
|
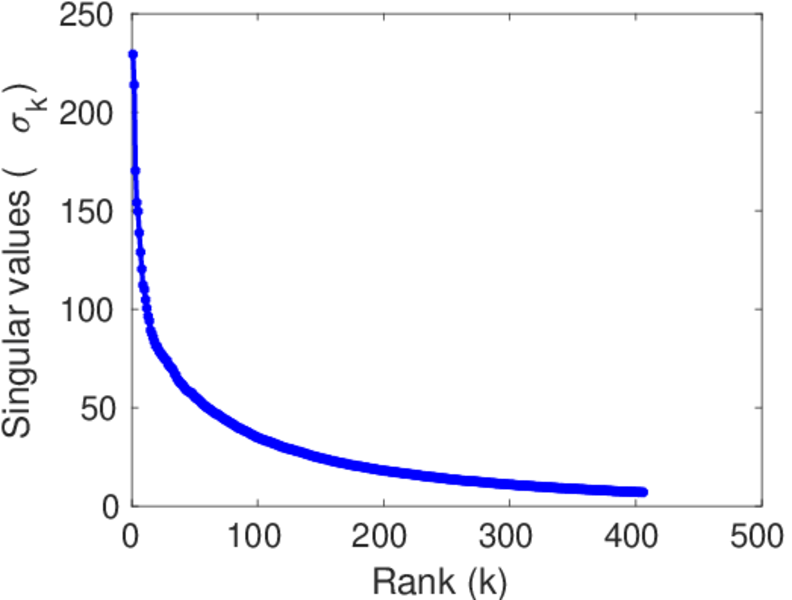
| Operator 2-norm | ν = | 229.350
|
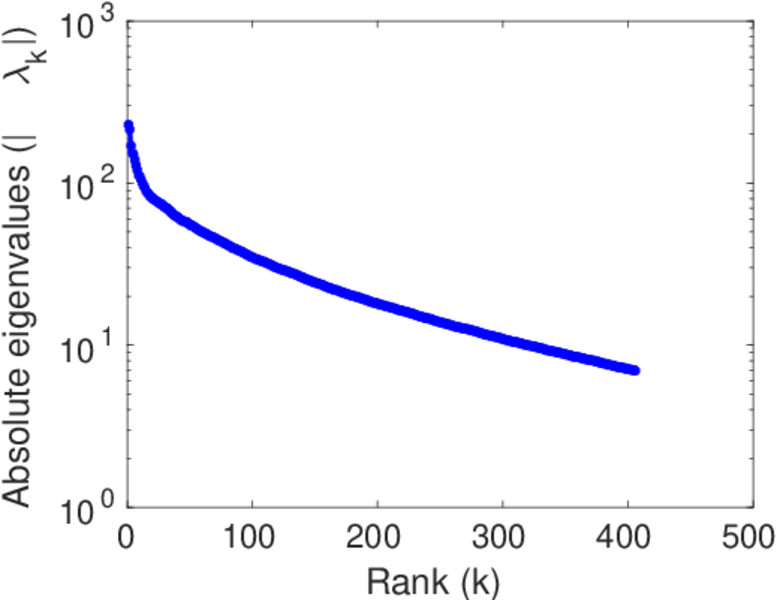
| Cyclic eigenvalue | π = | 181.856
|
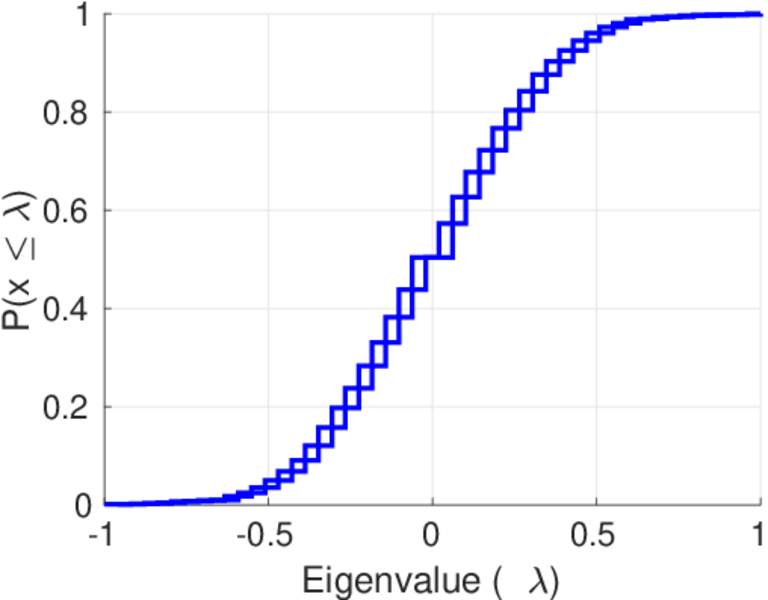
| Algebraic connectivity | a = | 0.349 550
|
| Spectral separation | |λ1[A] / λ2[A]| = | 1.149 58
|
| Reciprocity | y = | 0.636 382
|
| Non-bipartivity | bA = | 0.130 119
|
| Normalized non-bipartivity | bN = | 0.132 355
|
| Algebraic non-bipartivity | χ = | 0.196 308
|
| Spectral bipartite frustration | bK = | 0.003 357 53
|
| Controllability | C = | 634
|
| Relative controllability | Cr = | 0.333 860
|
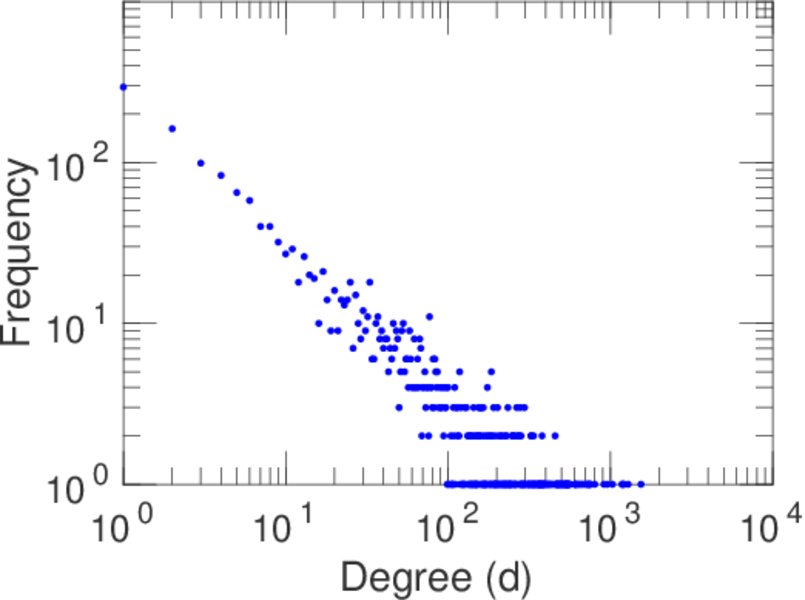
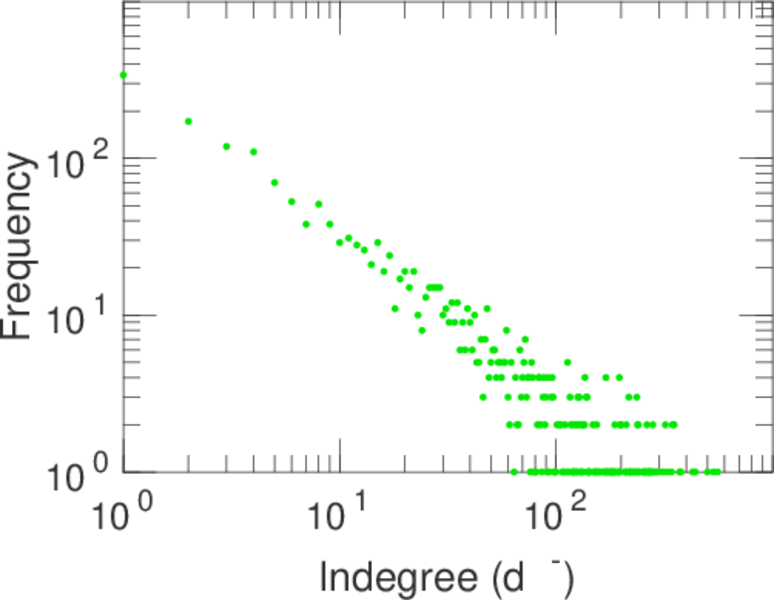
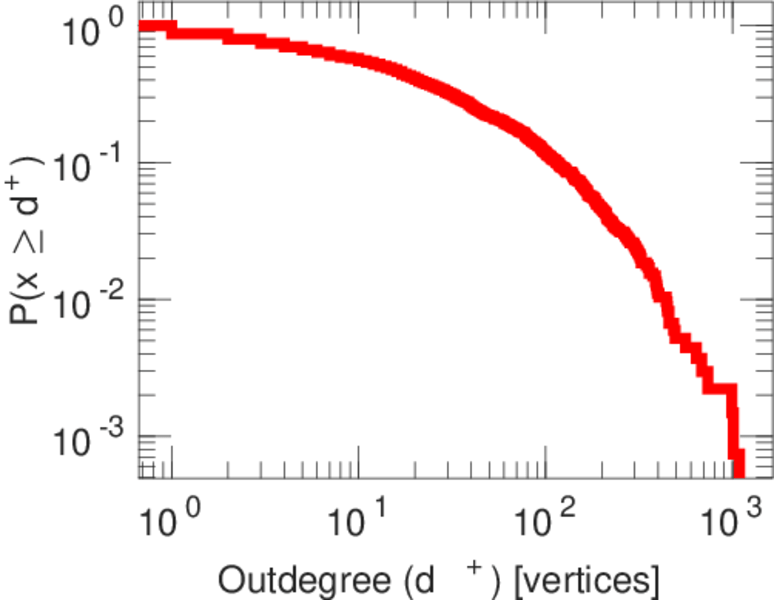
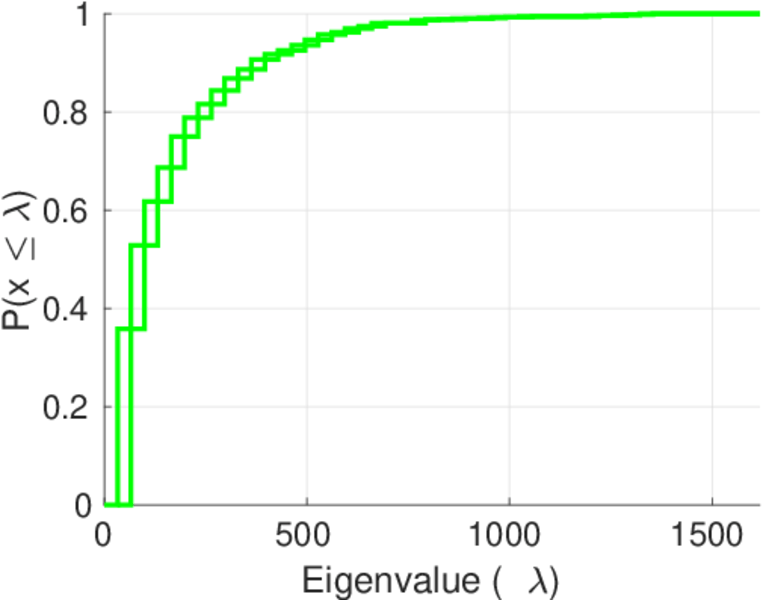
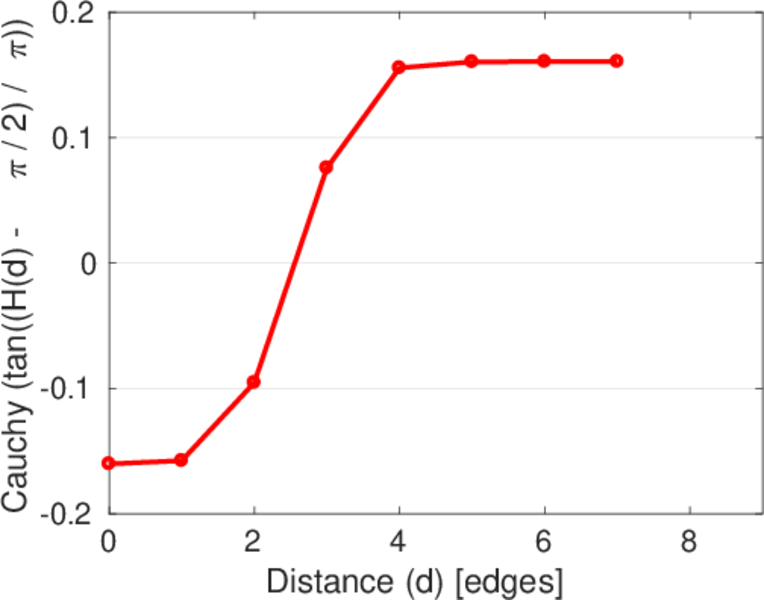
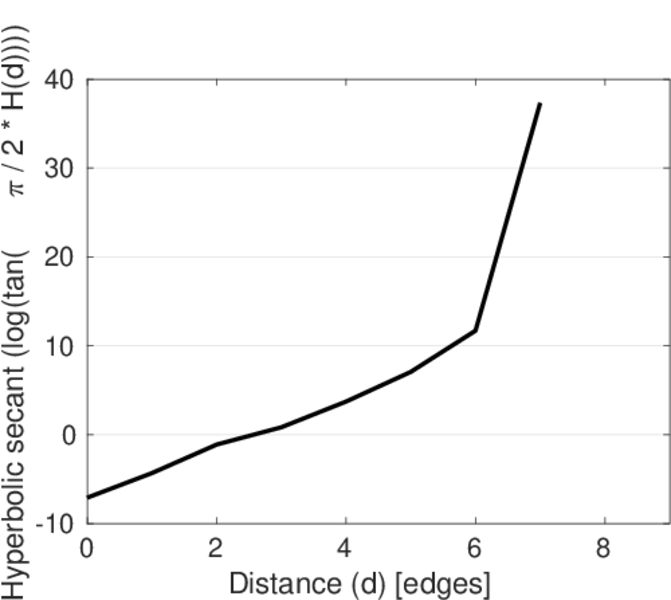
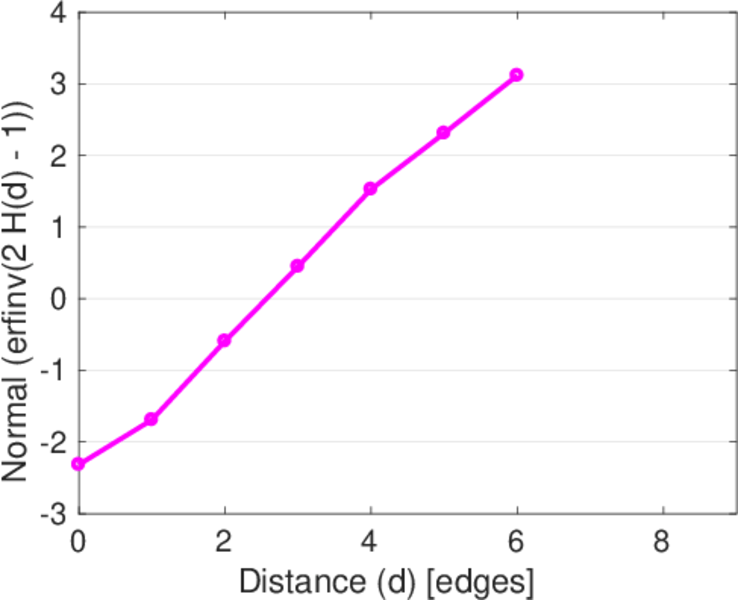
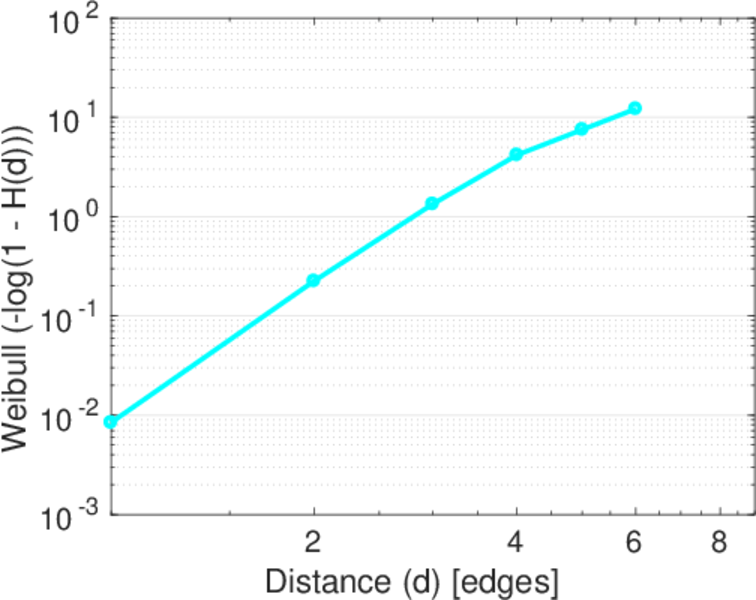
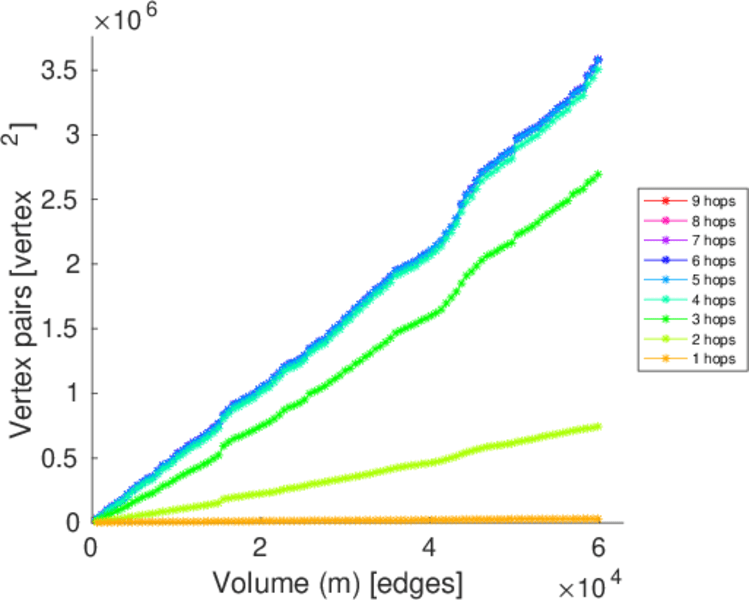
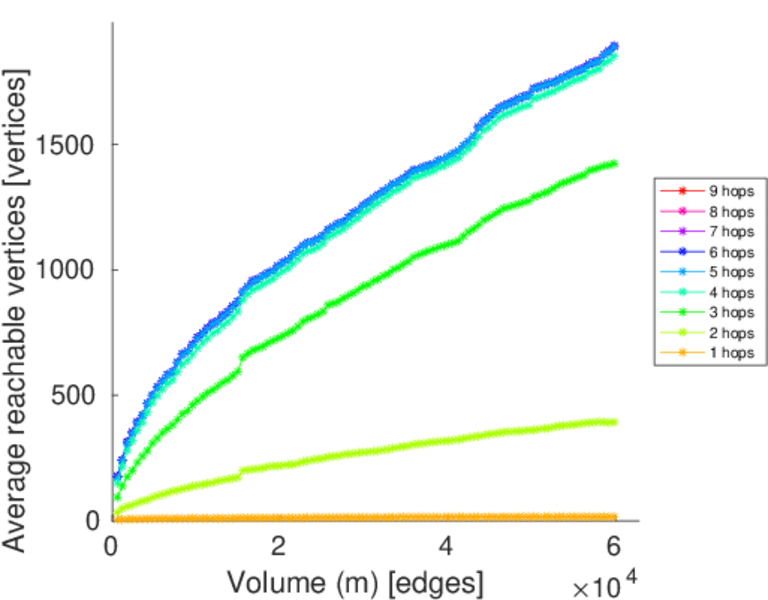
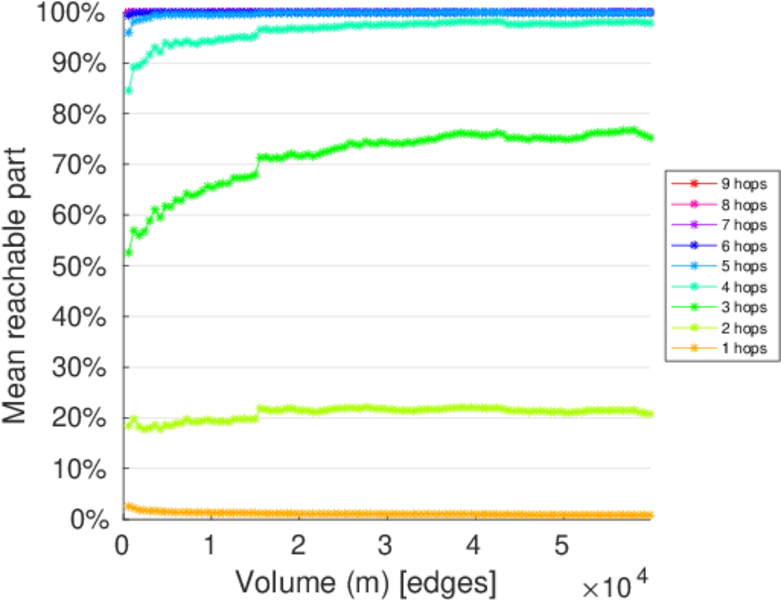
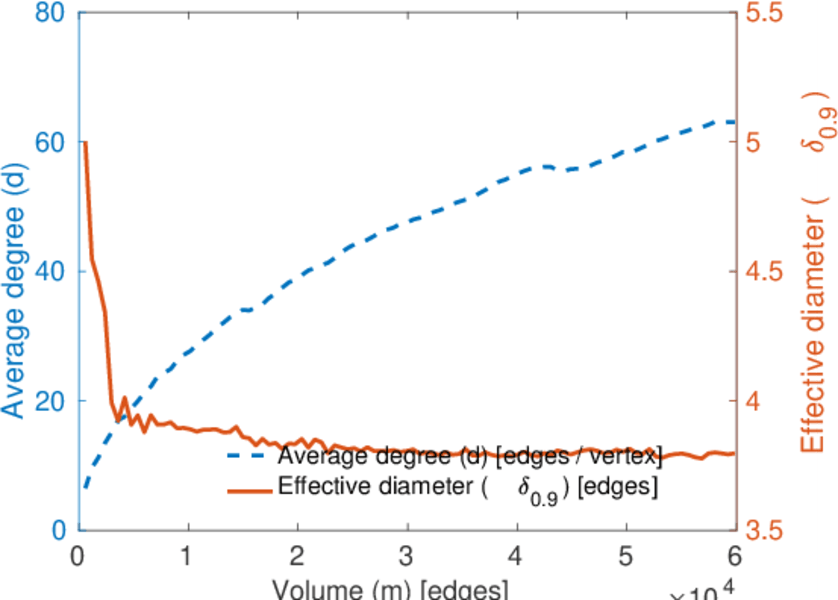
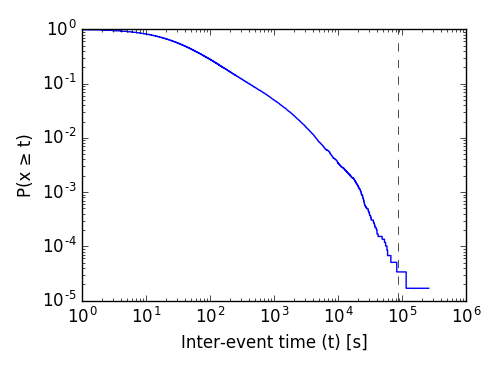
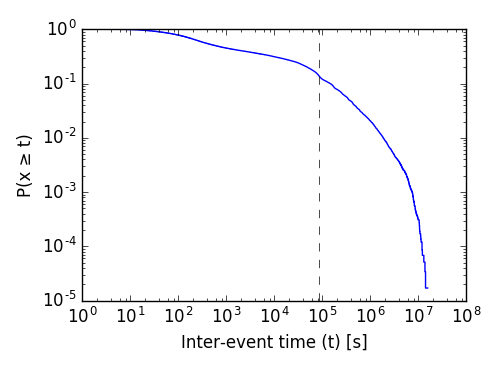
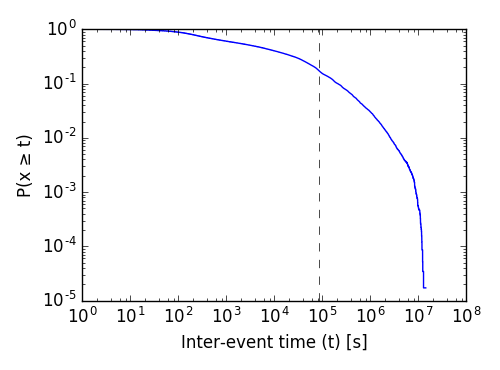
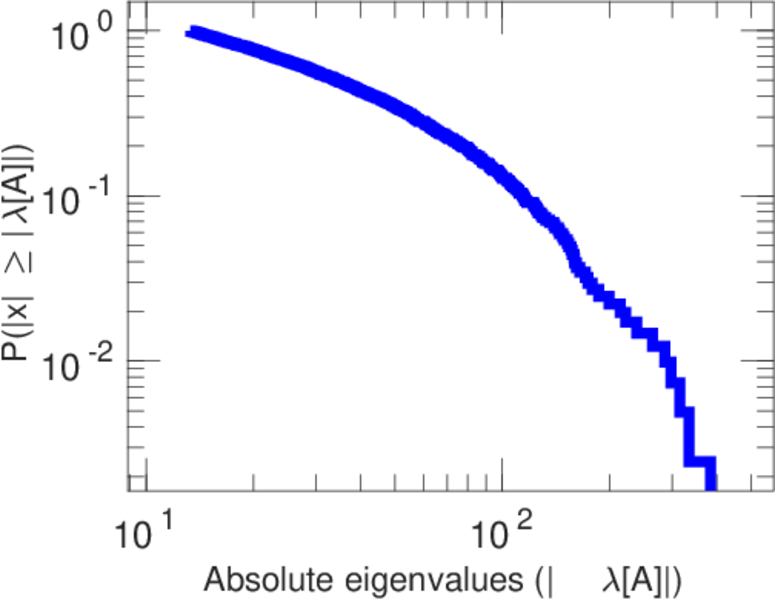
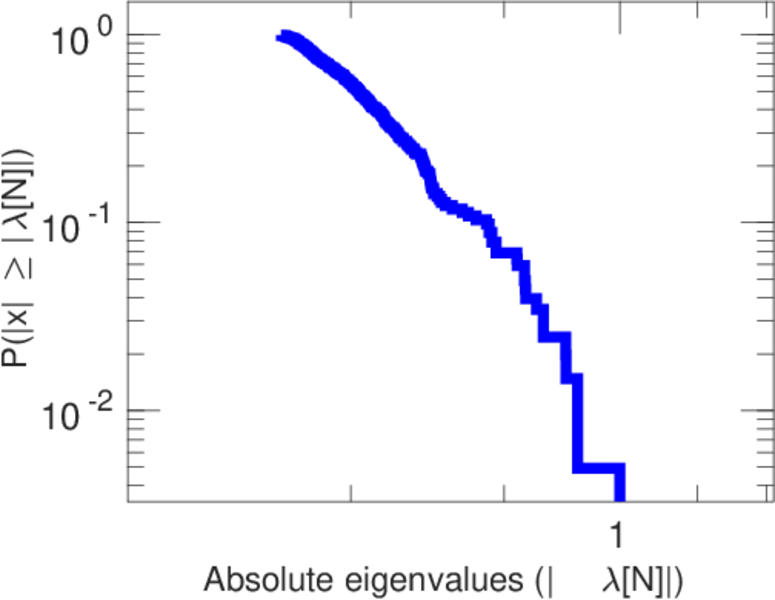
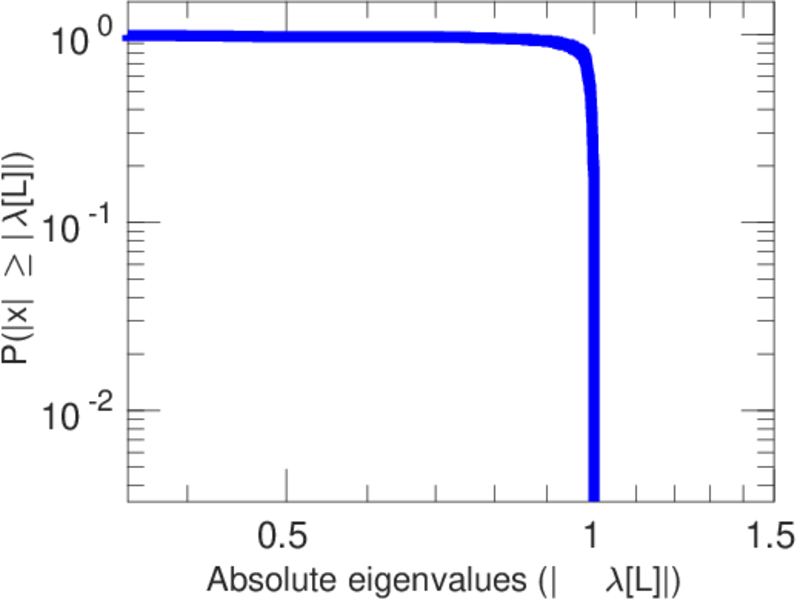
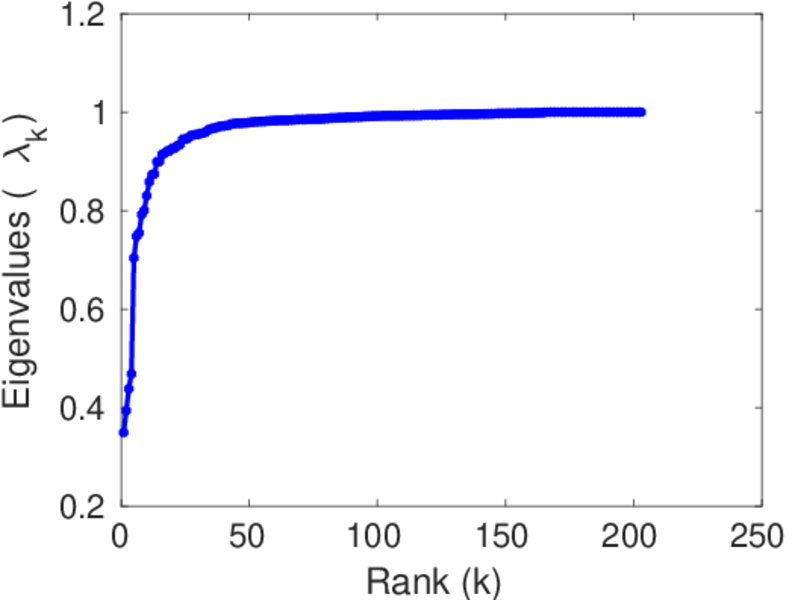
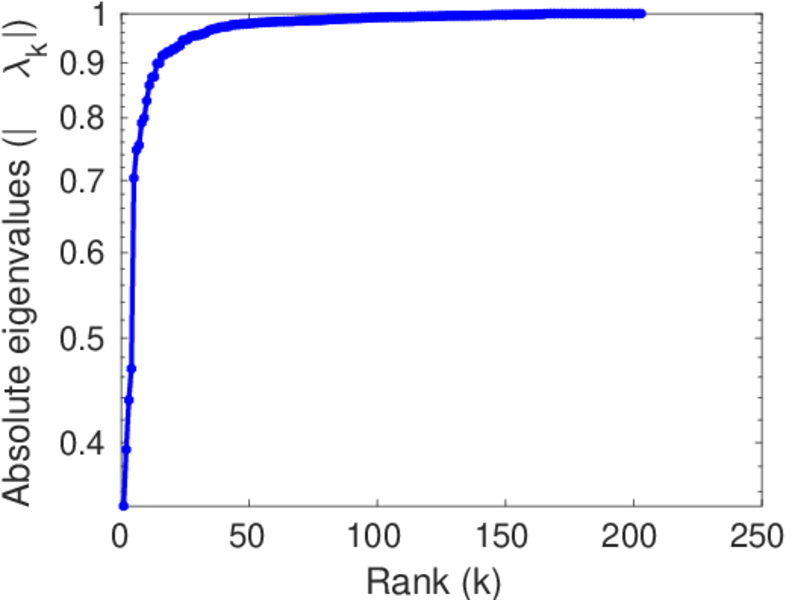
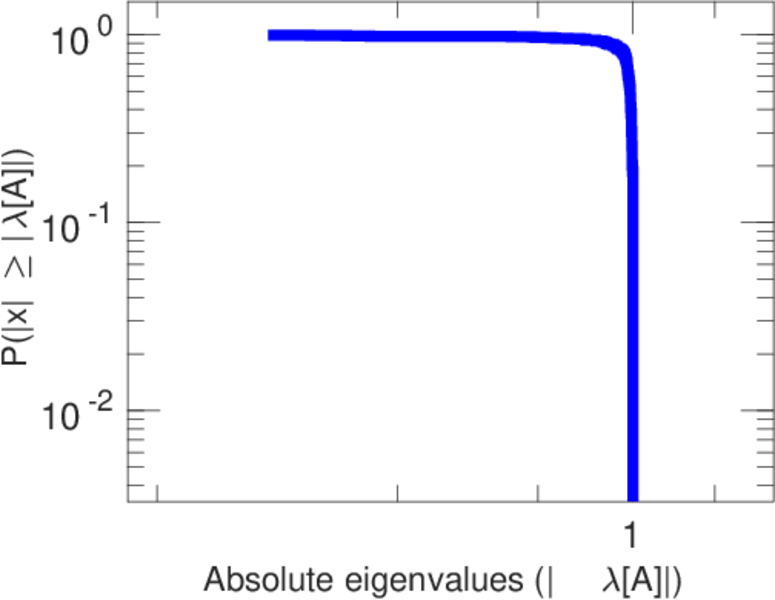
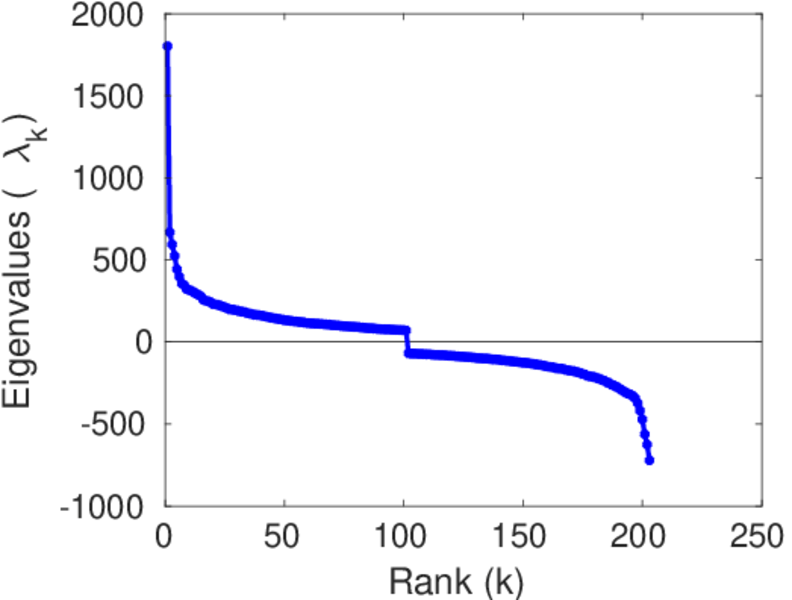
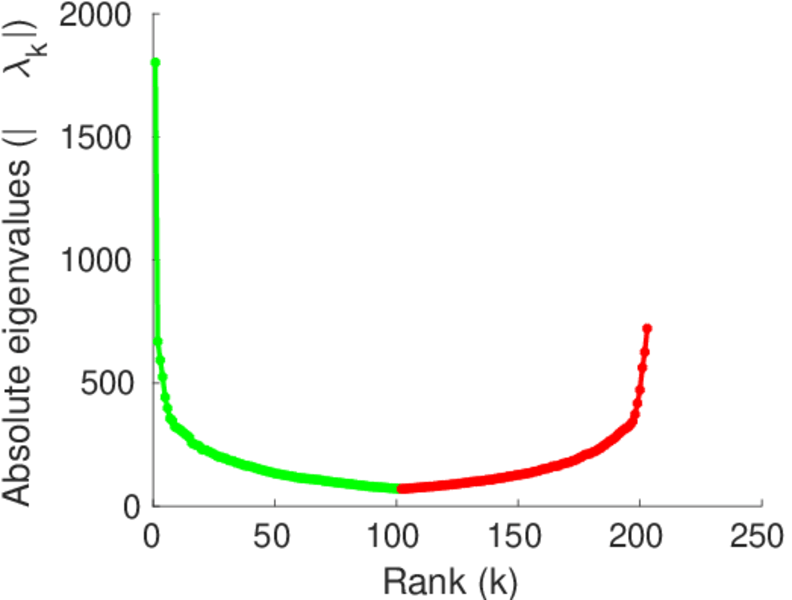
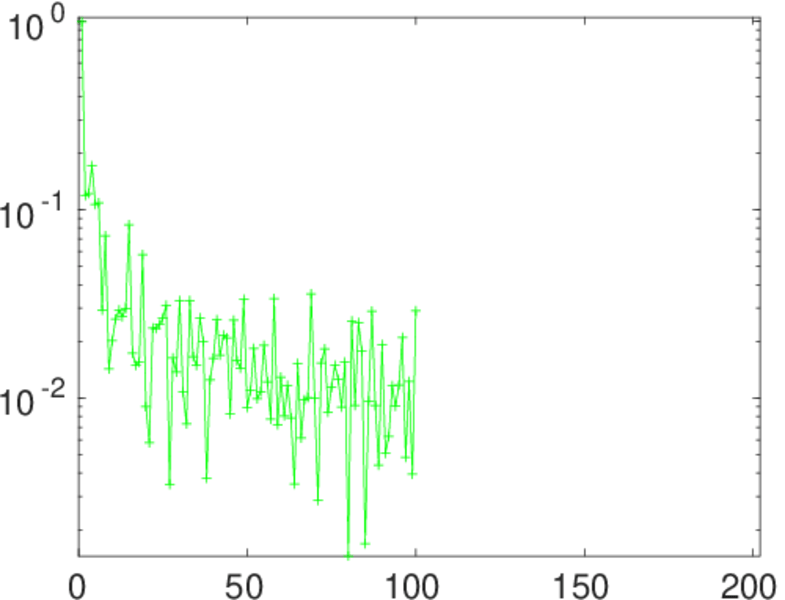
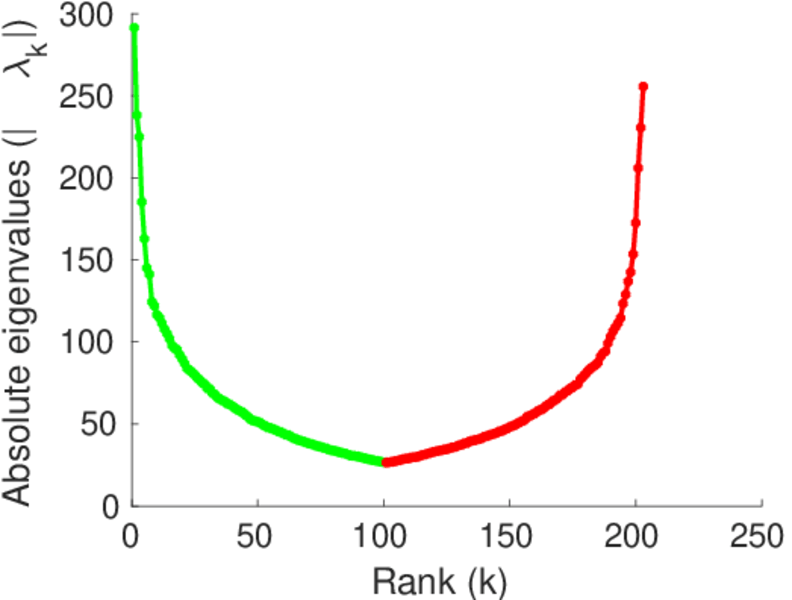
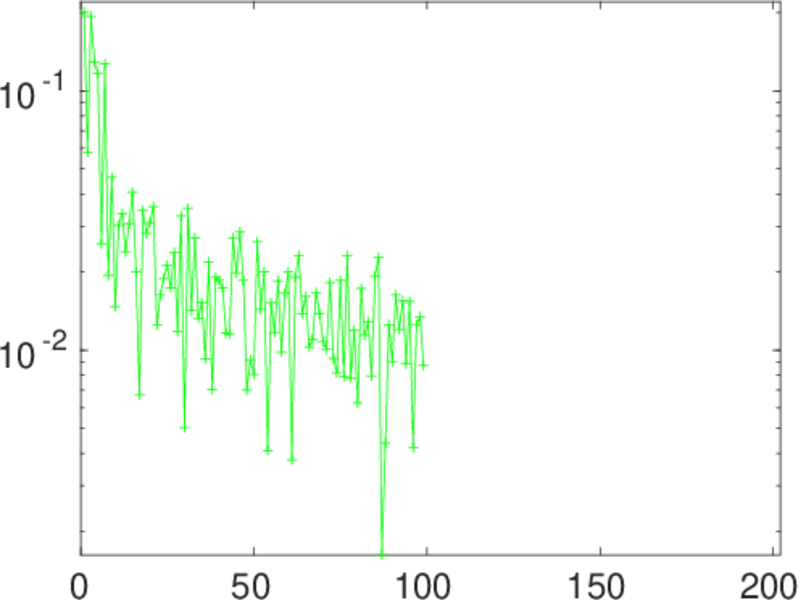
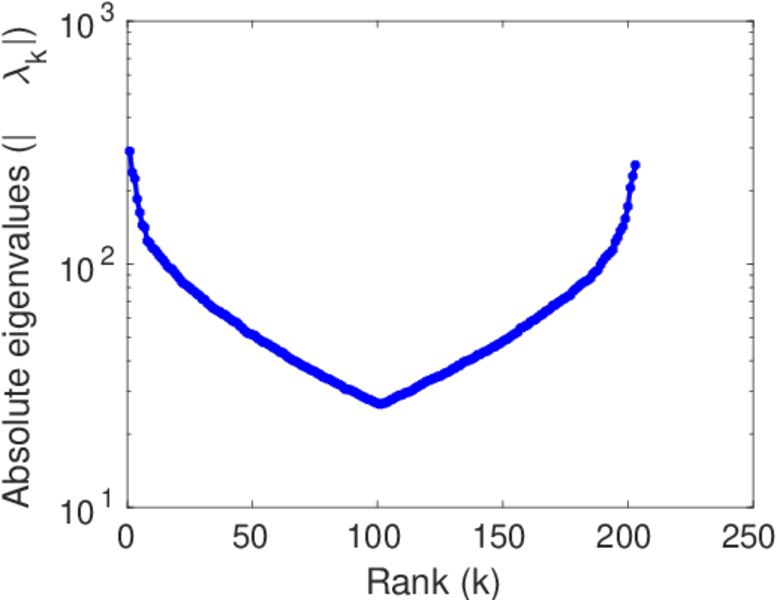
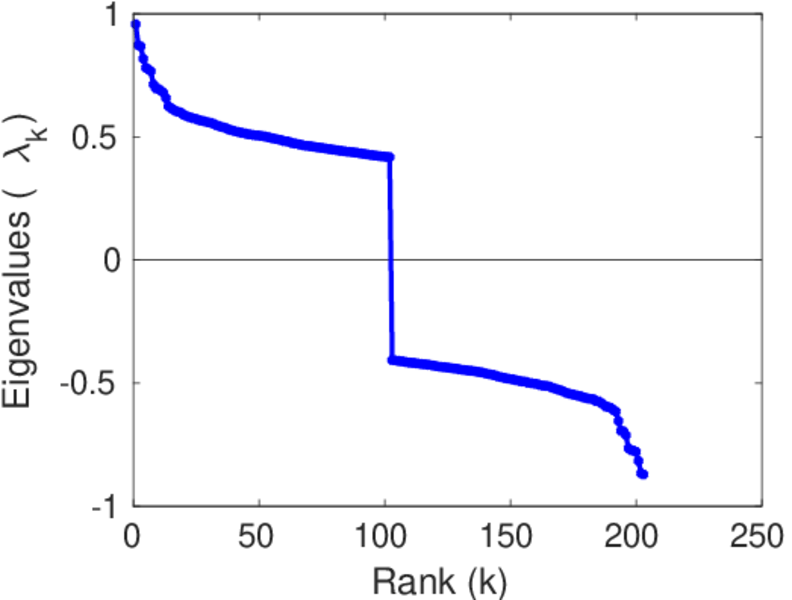
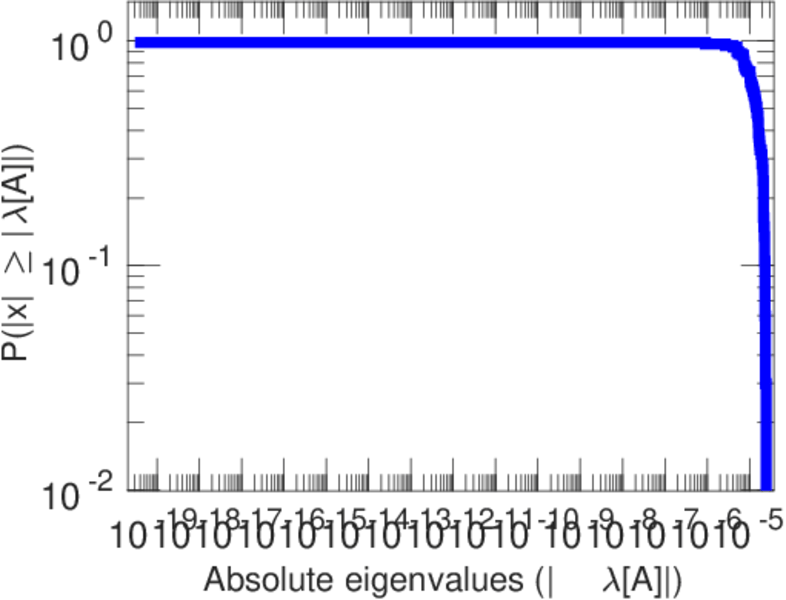
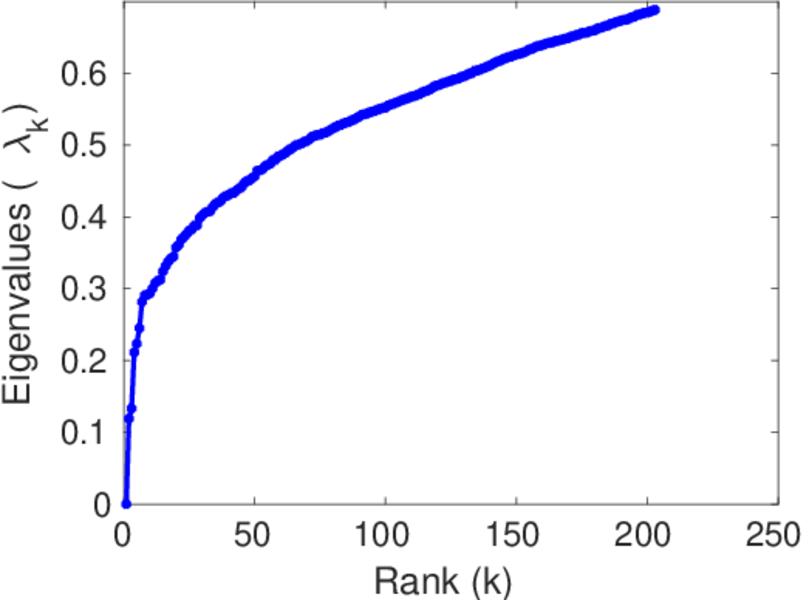
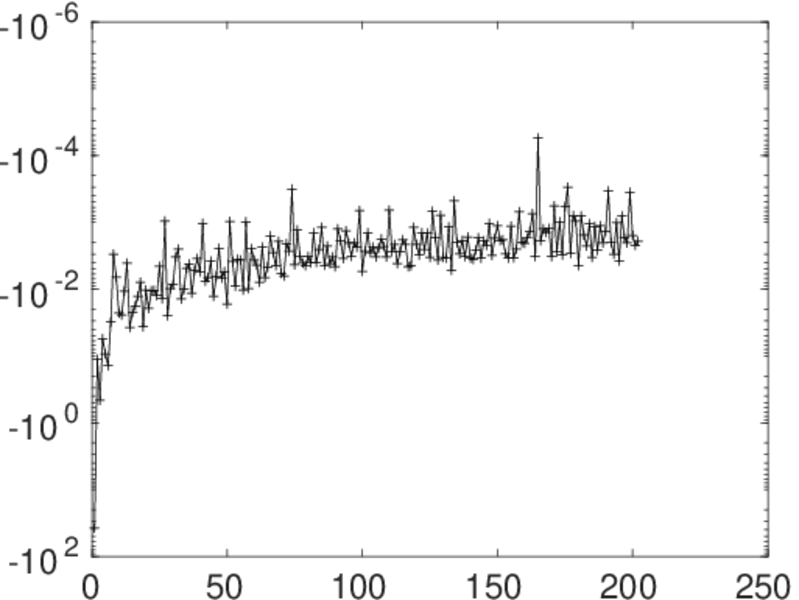
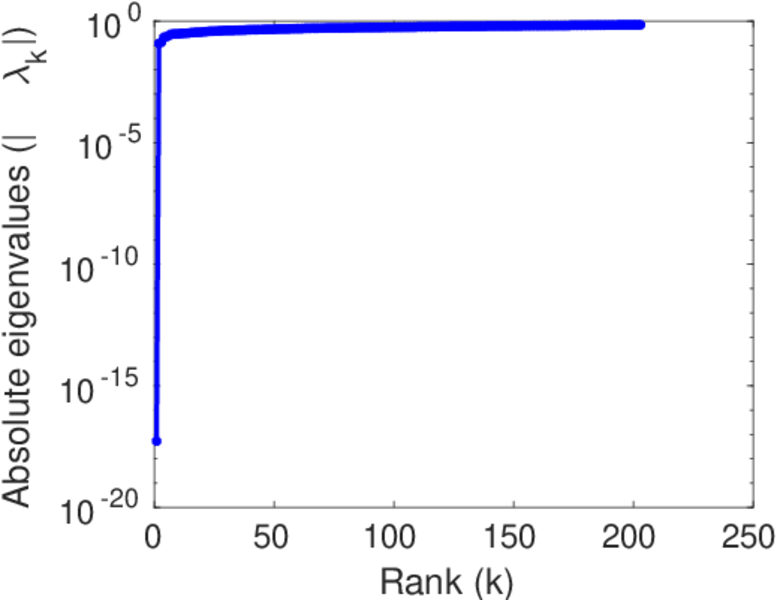
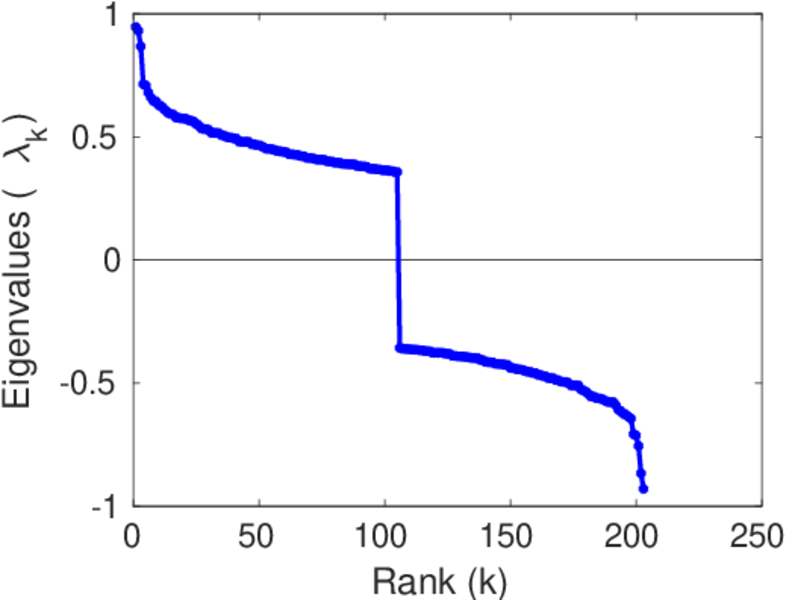
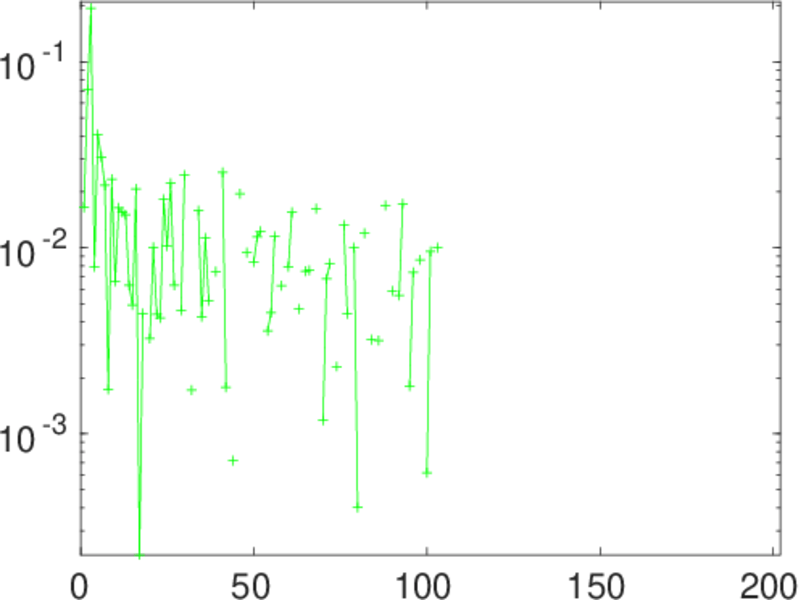
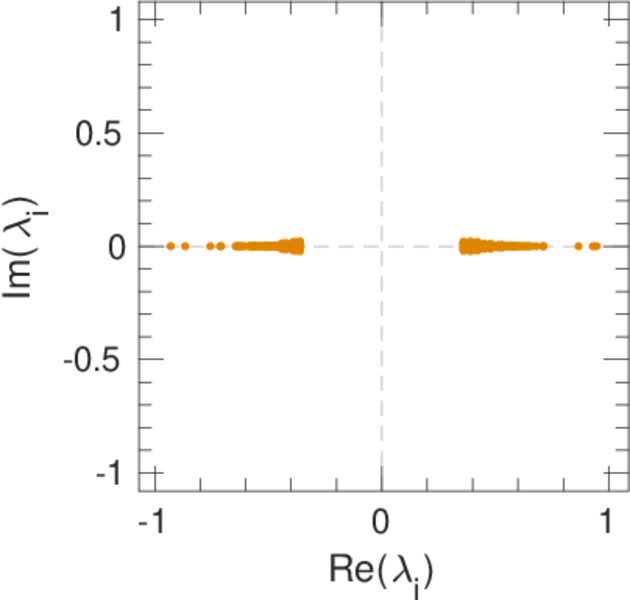
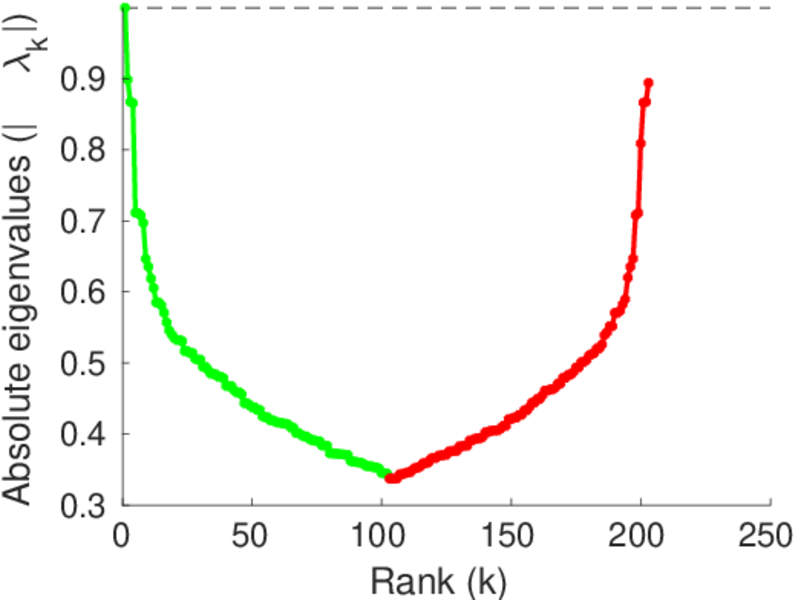
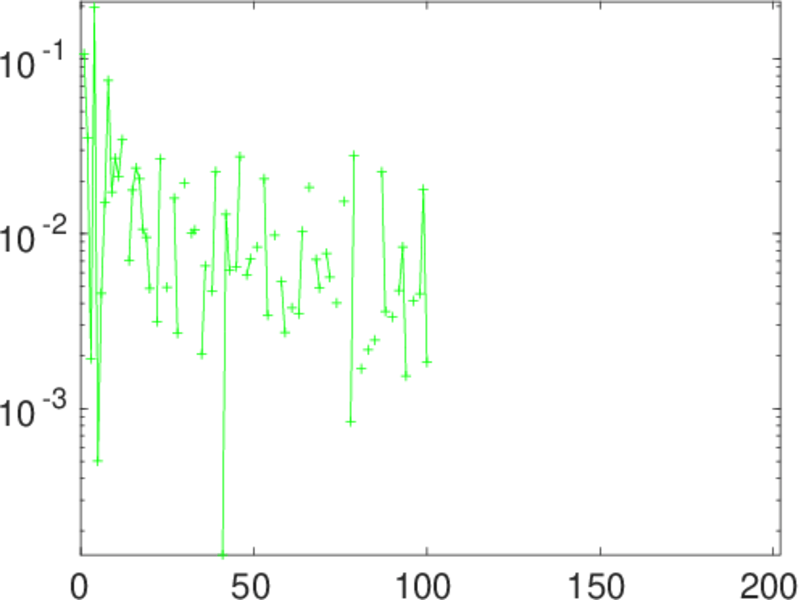
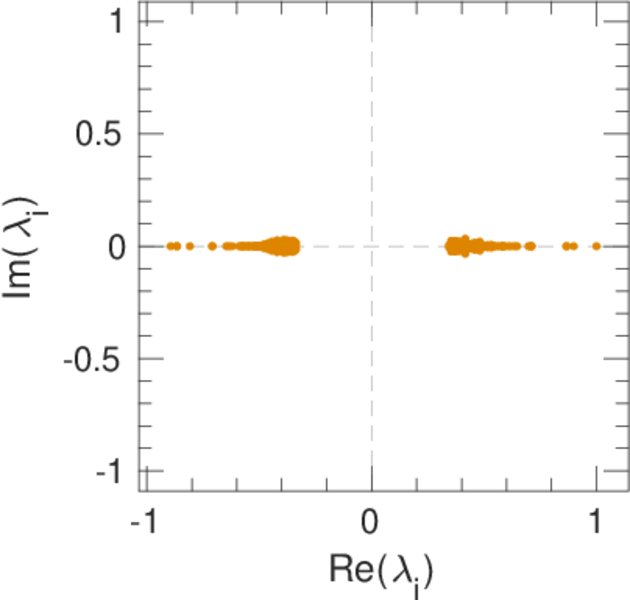
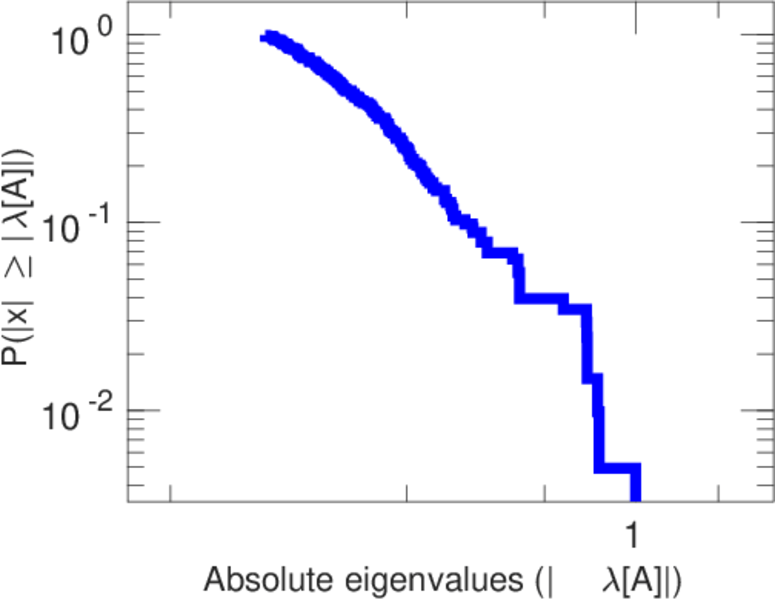
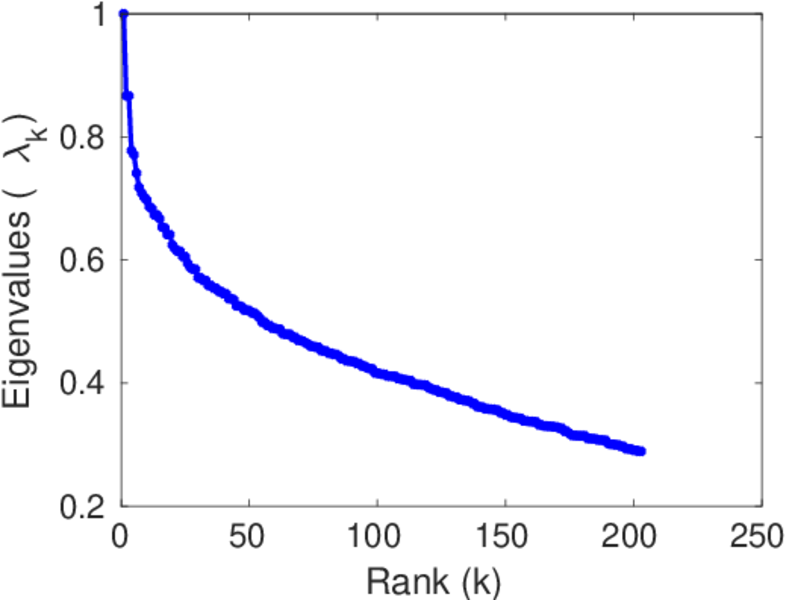
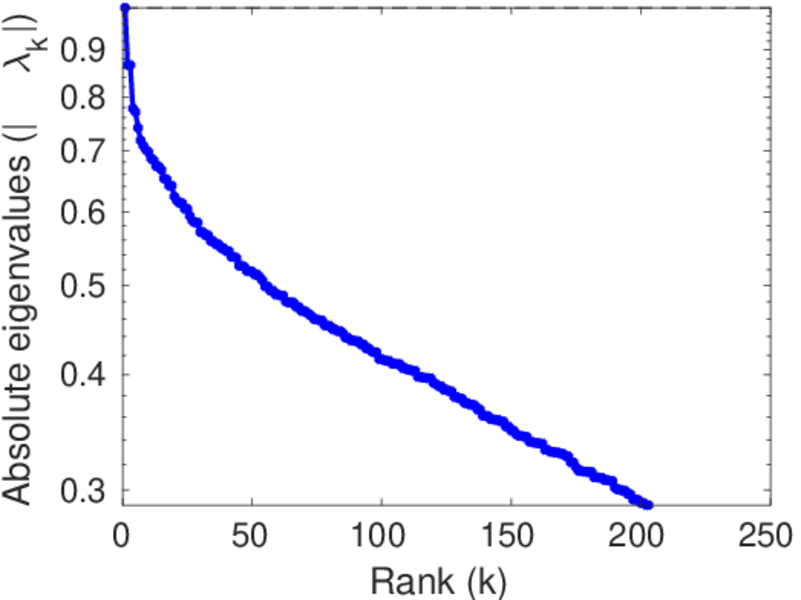
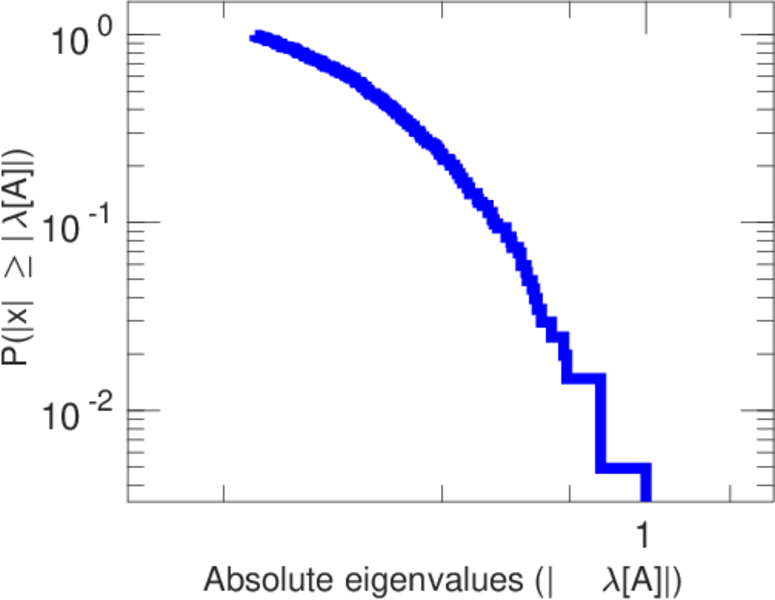
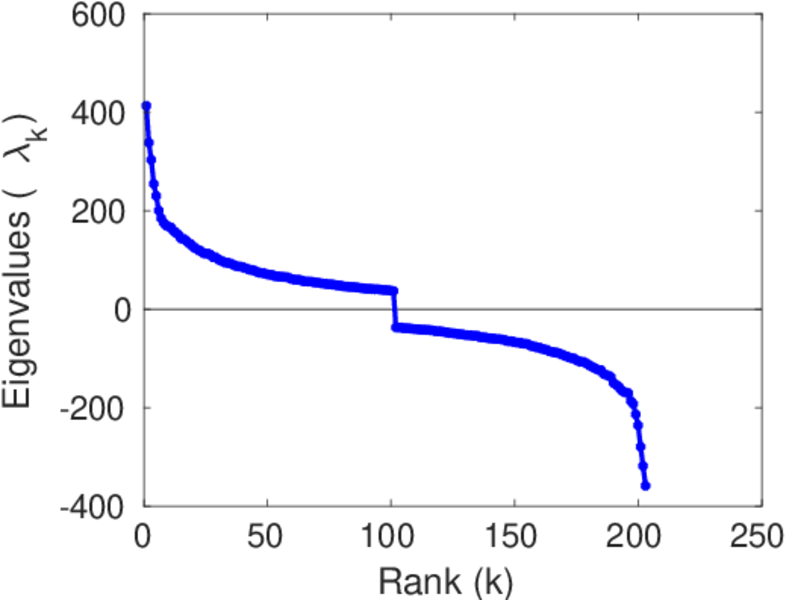
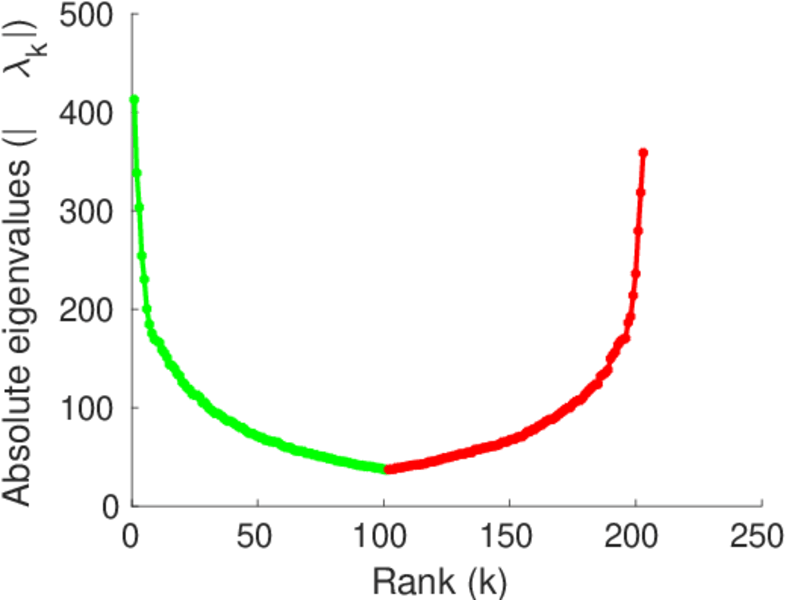
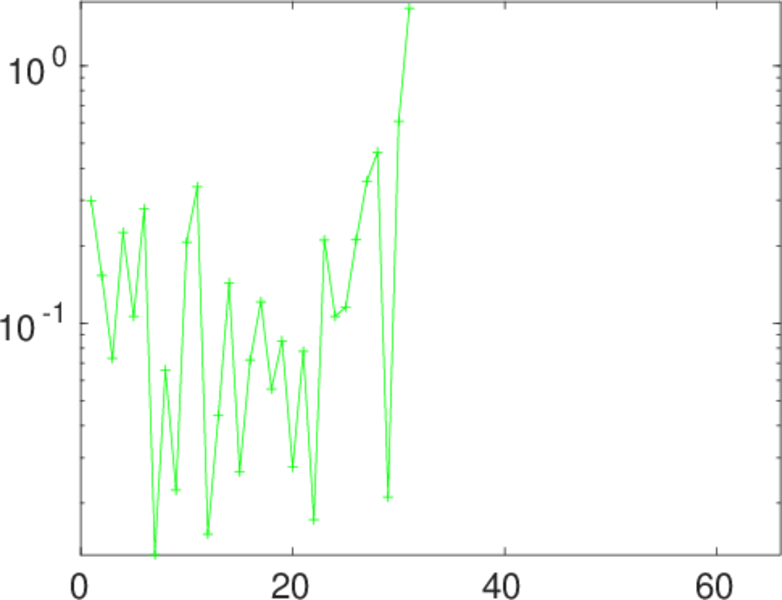
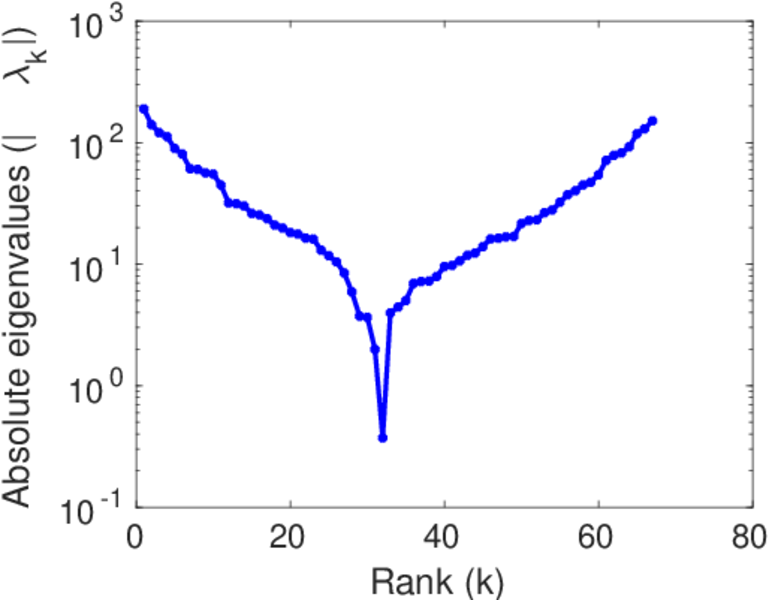
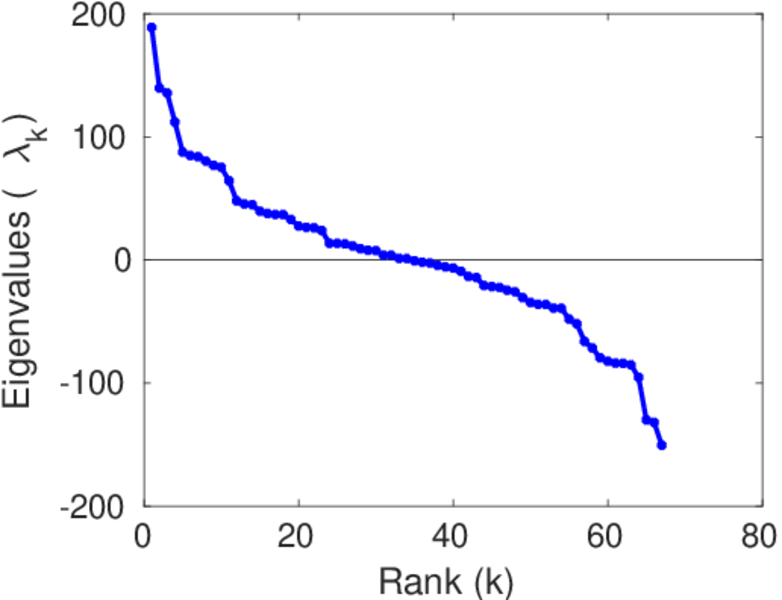
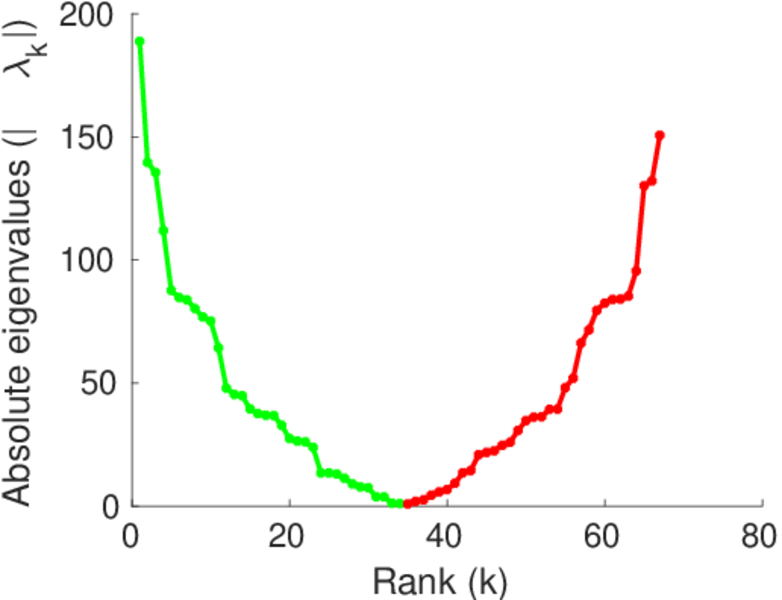
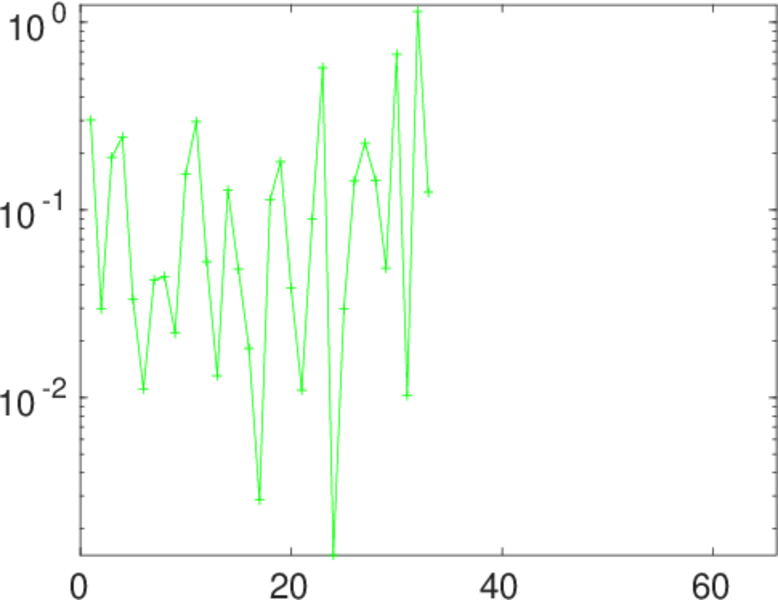
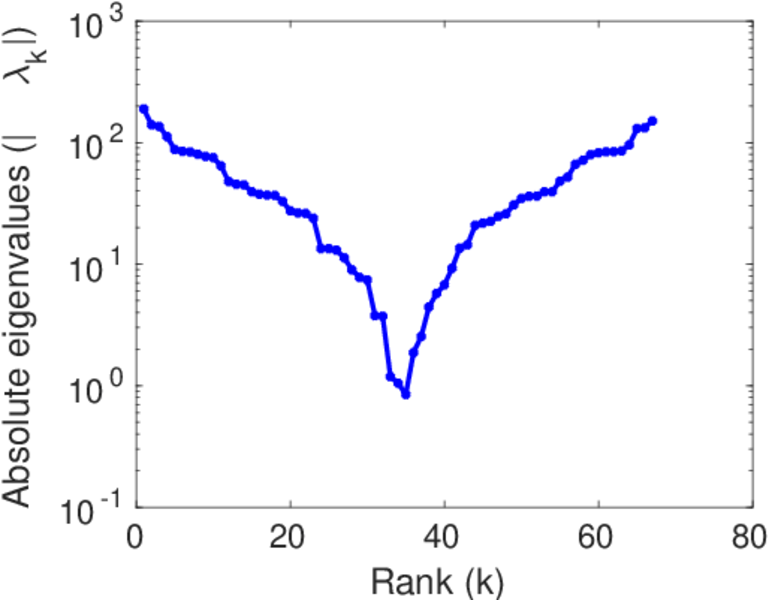
Plots


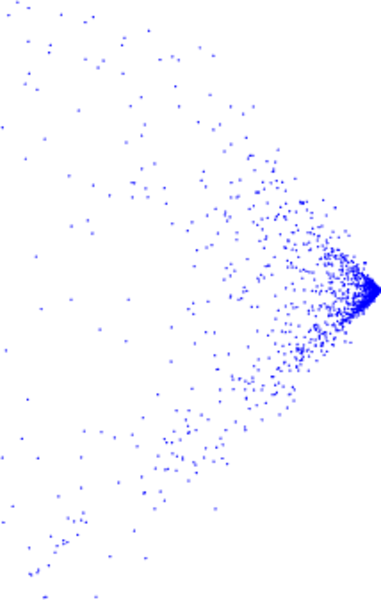
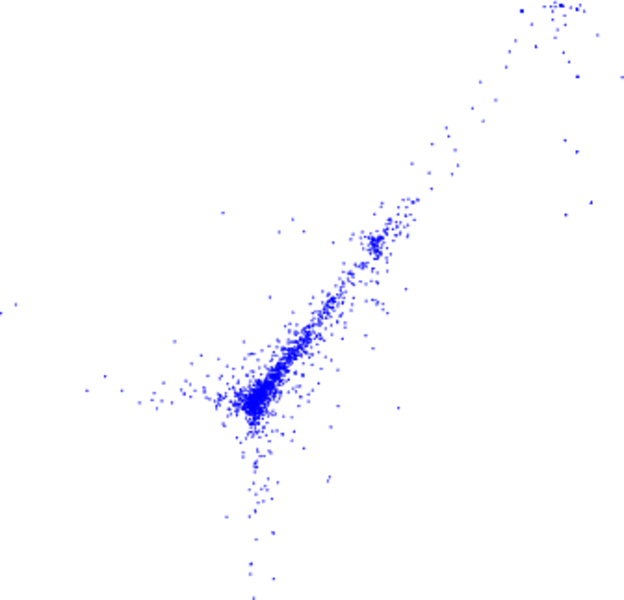
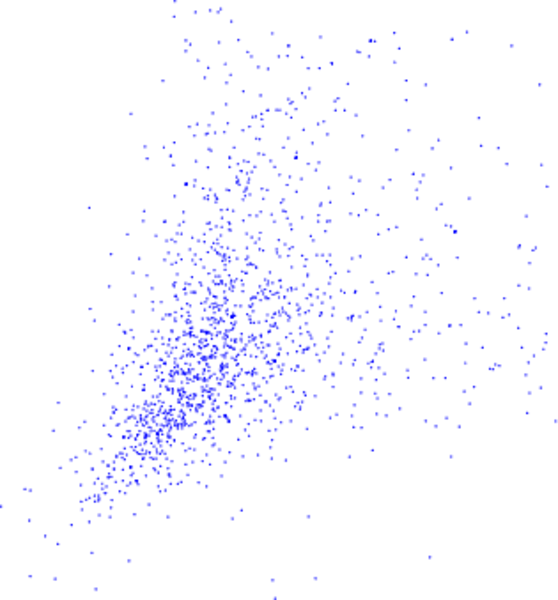
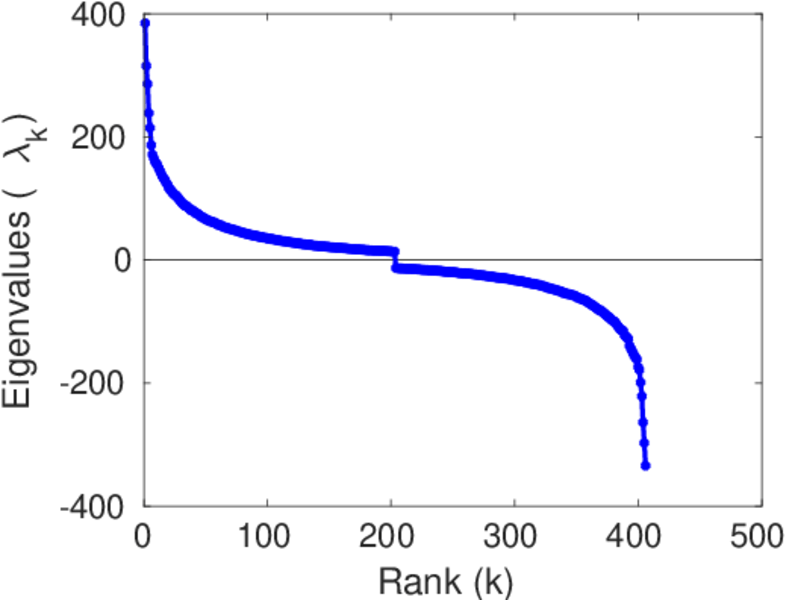
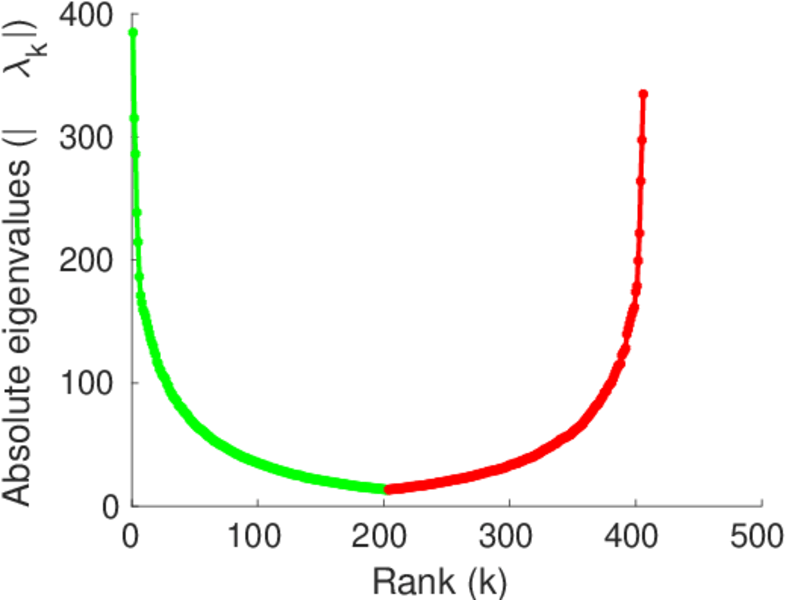
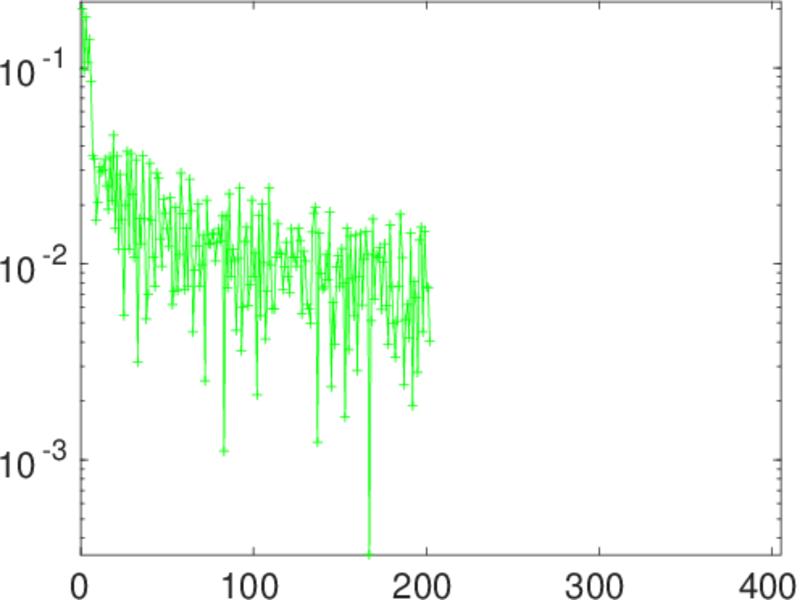
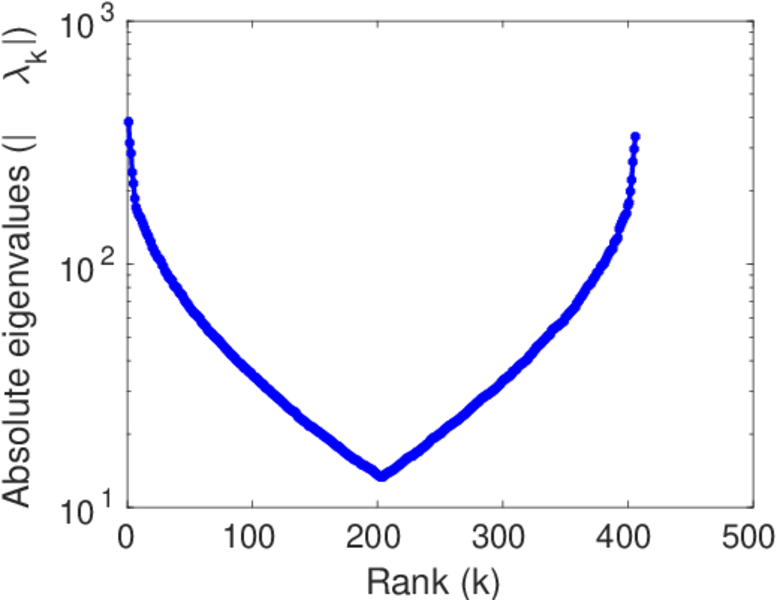
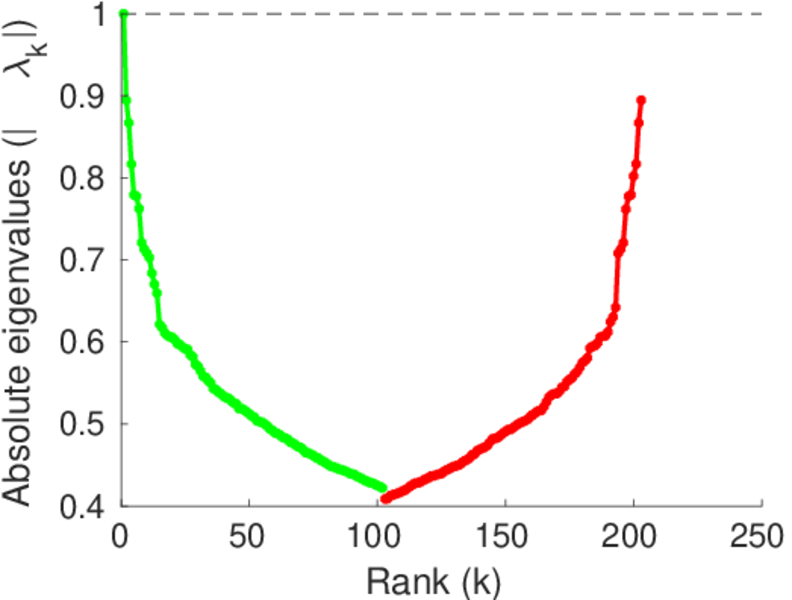
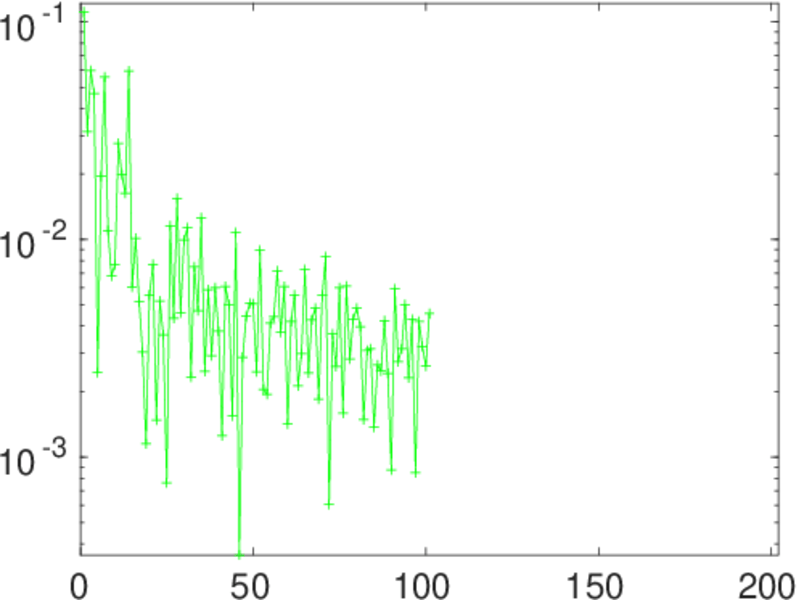
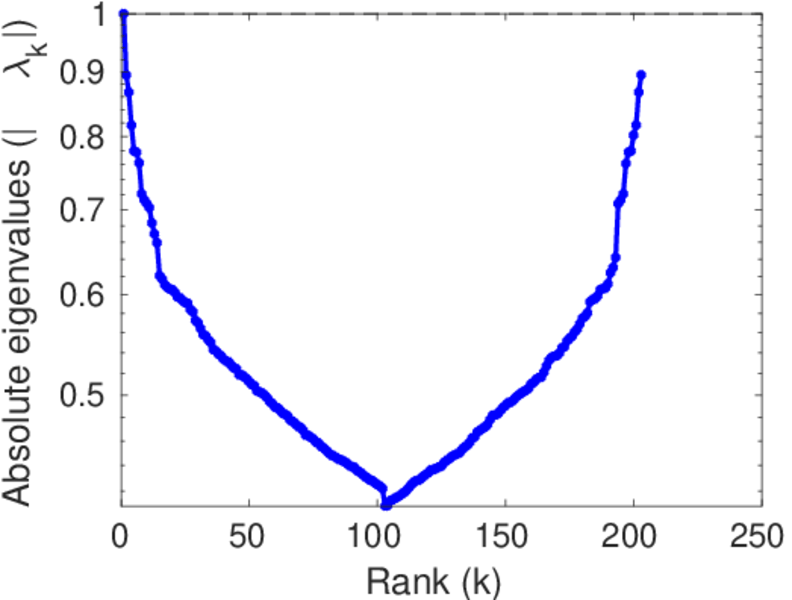
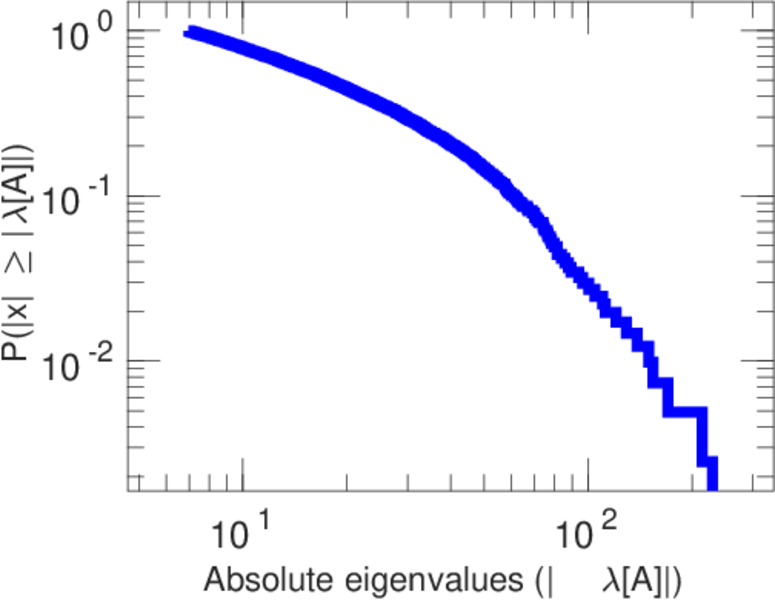
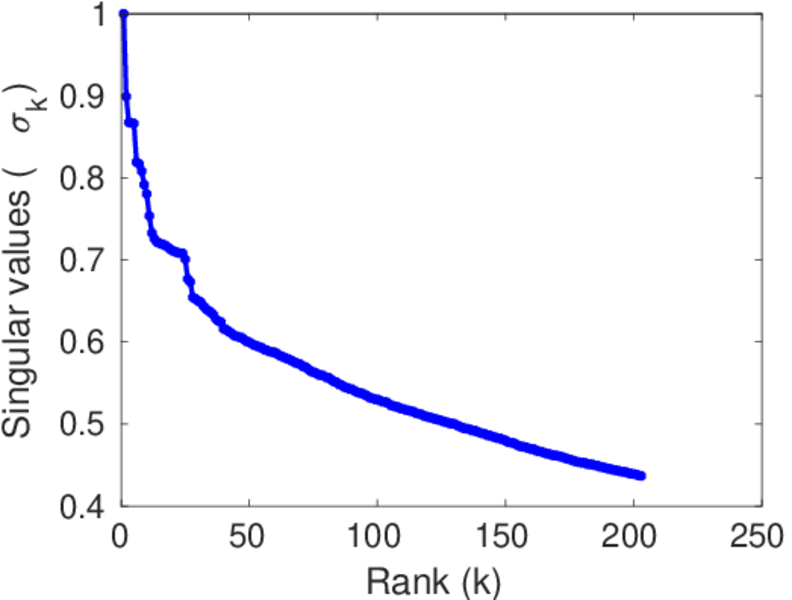
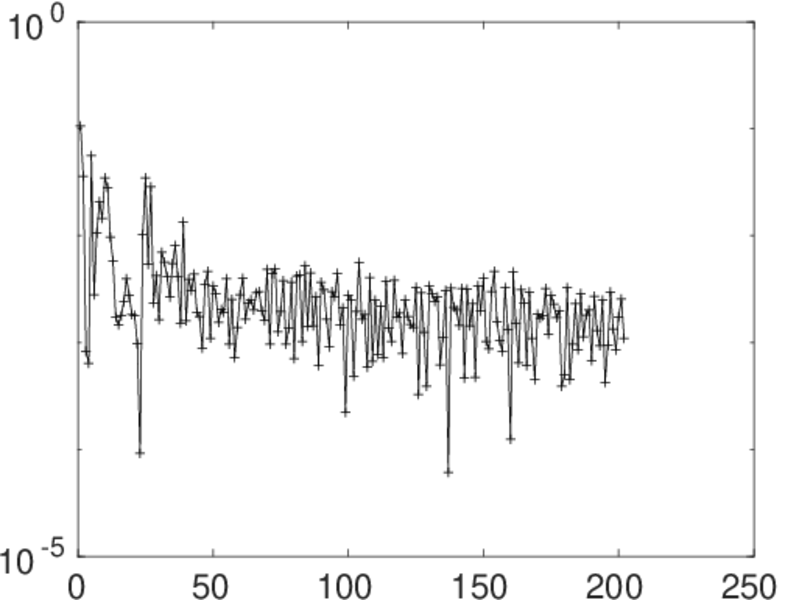
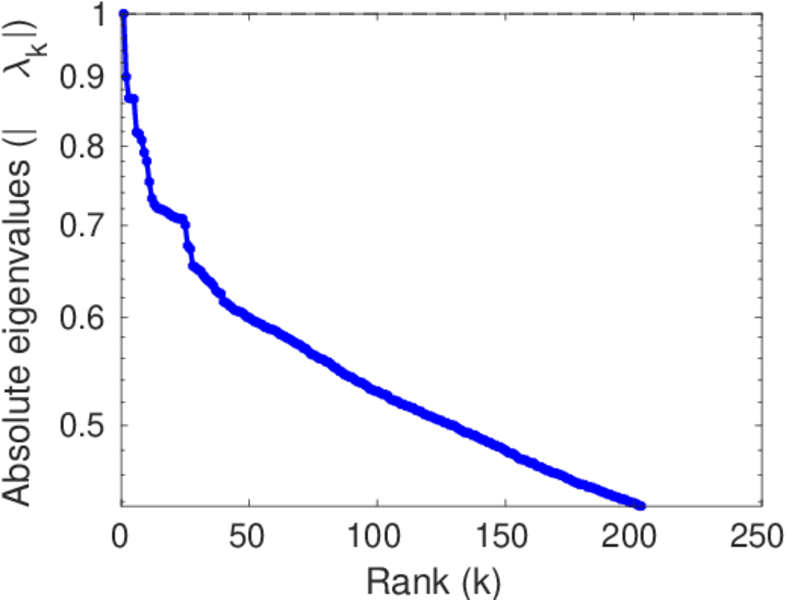
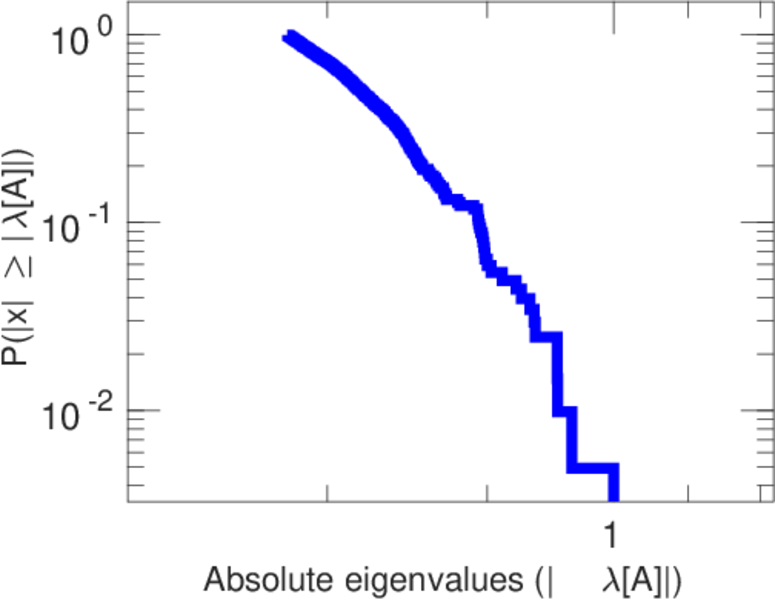
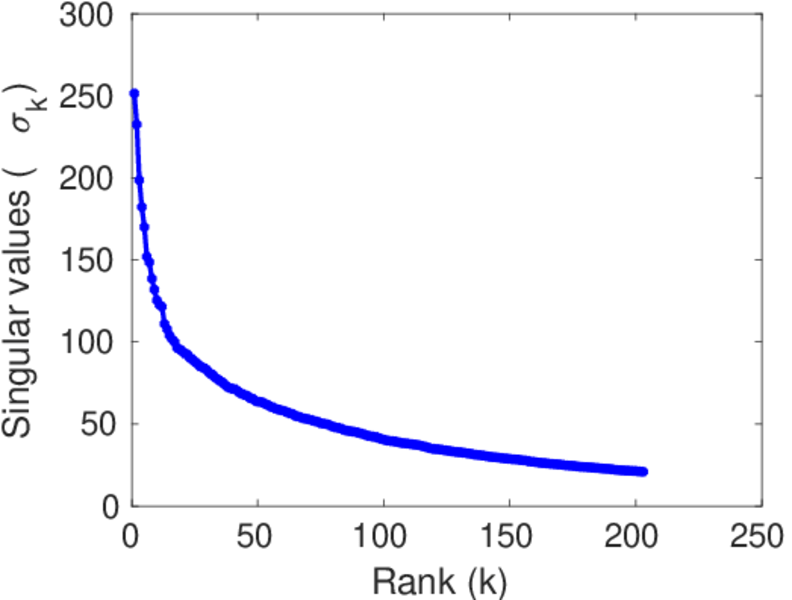
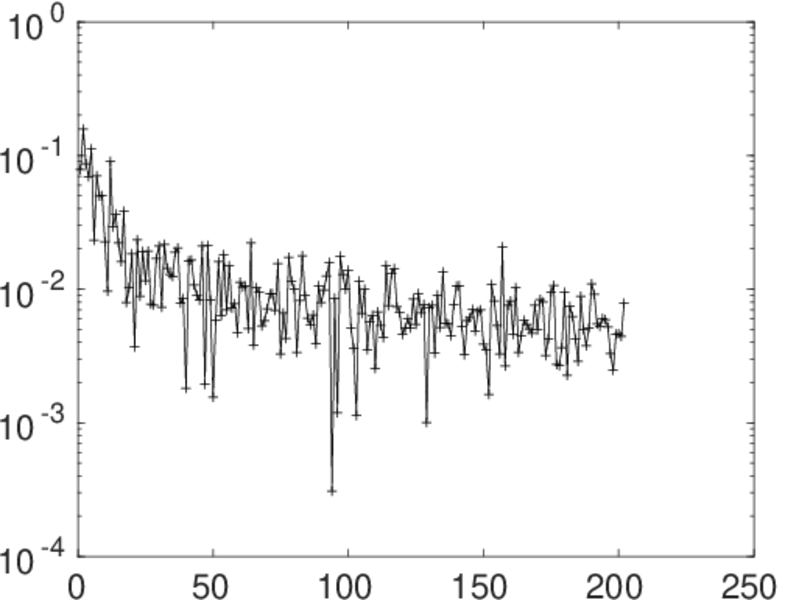
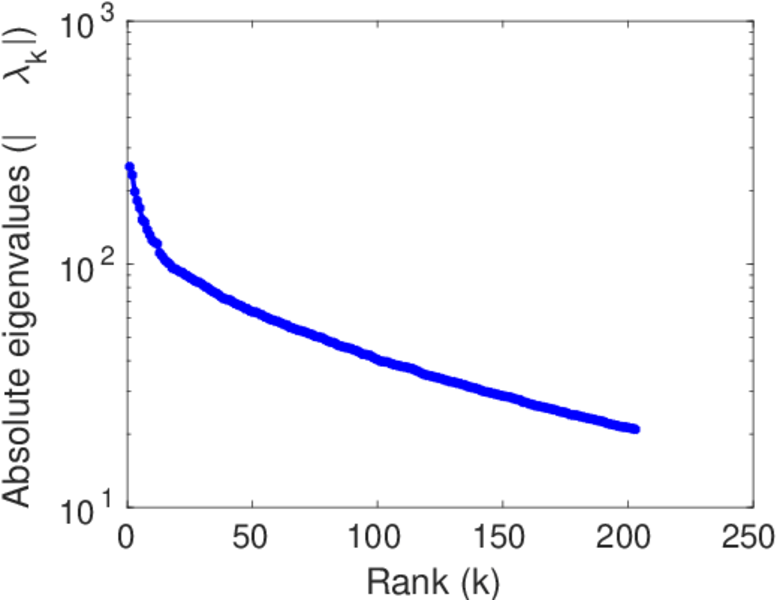
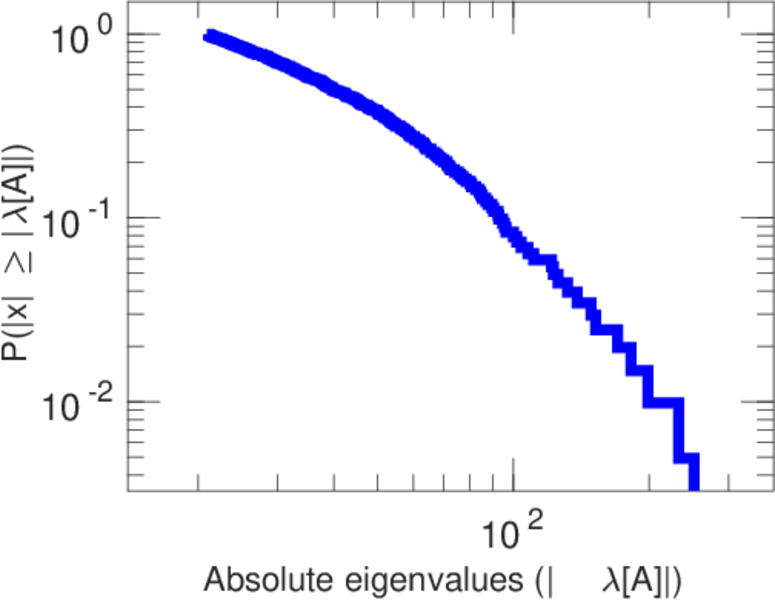
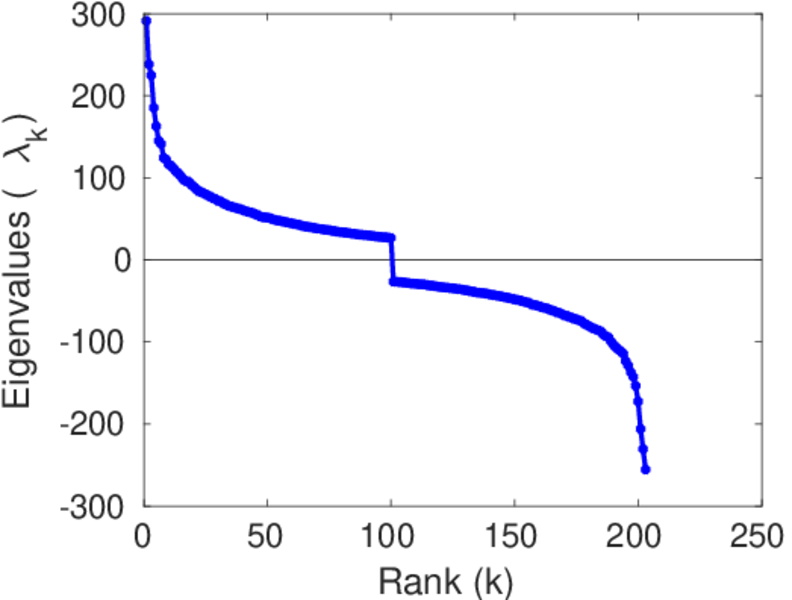
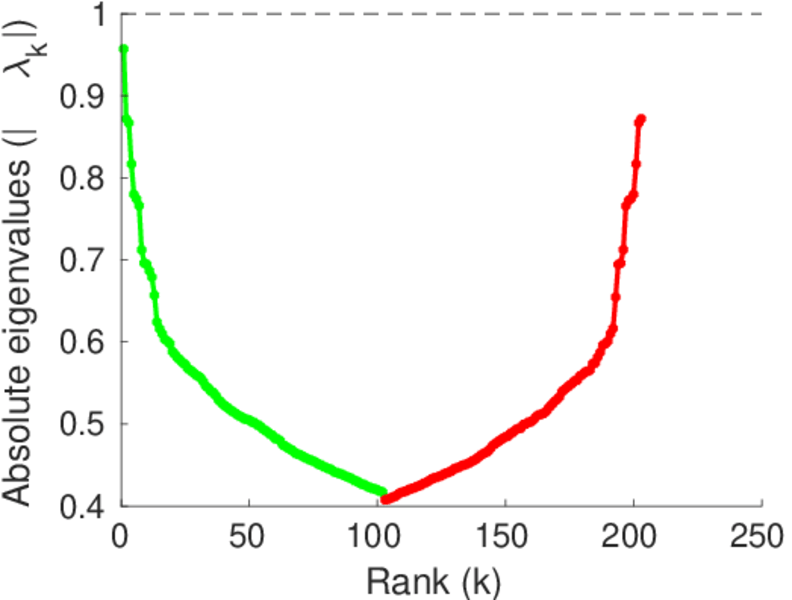
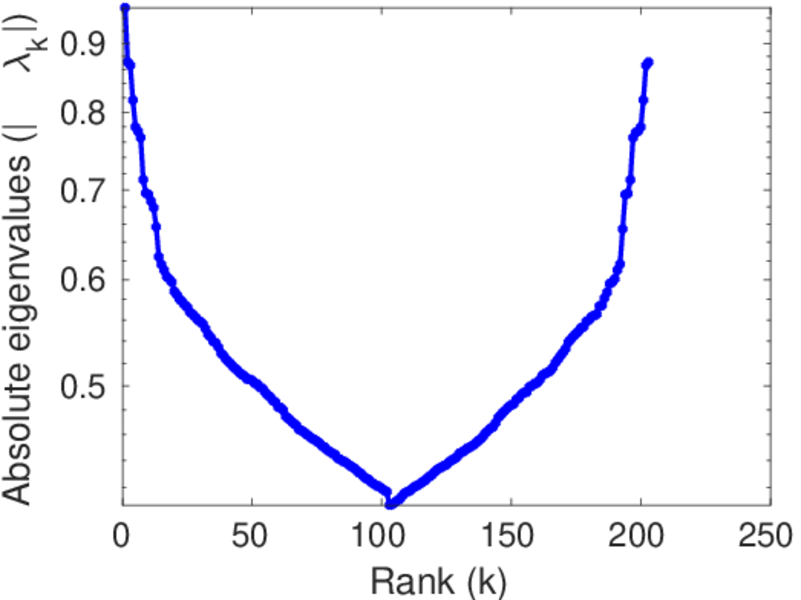
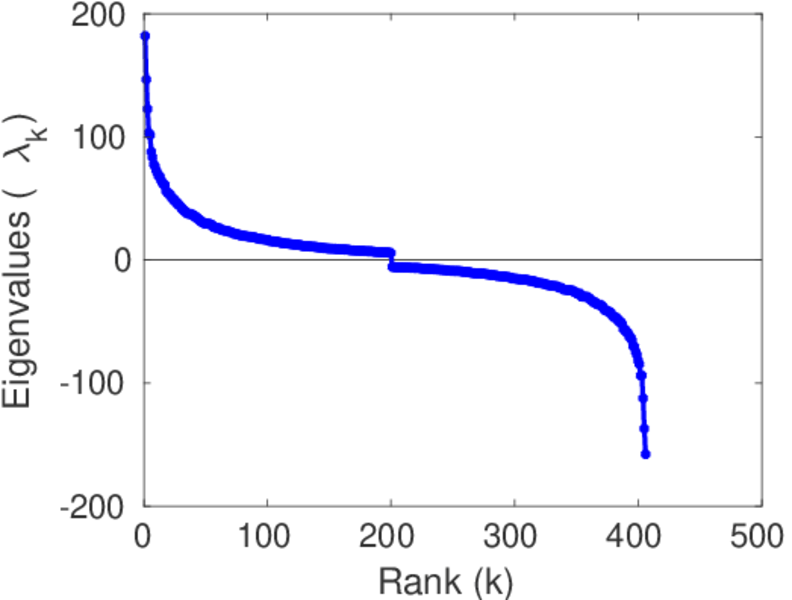
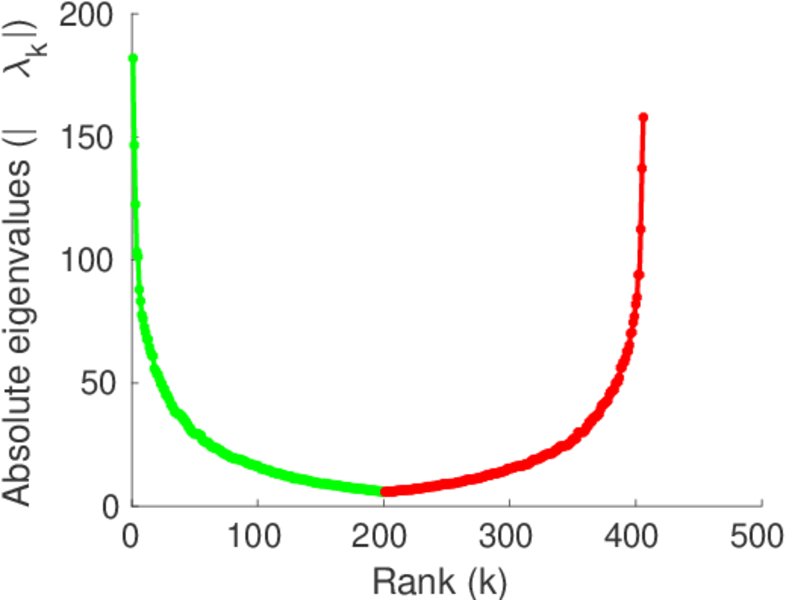
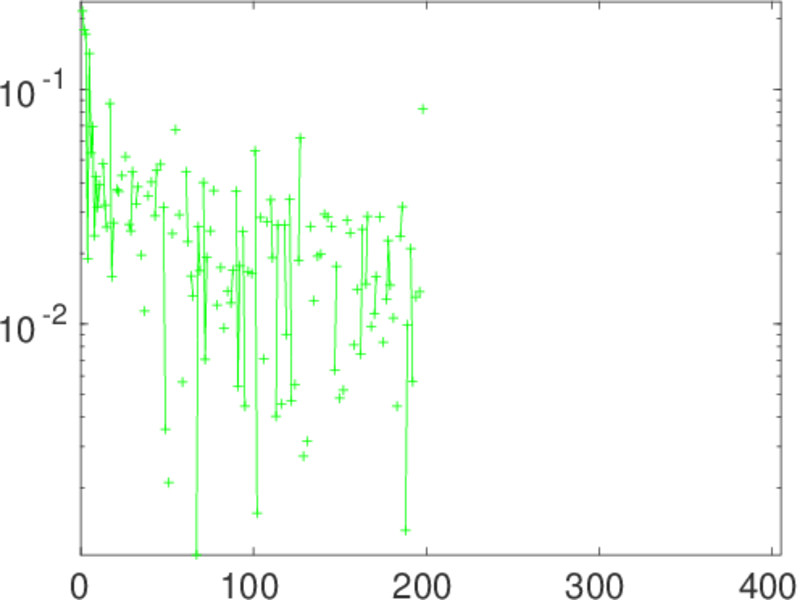
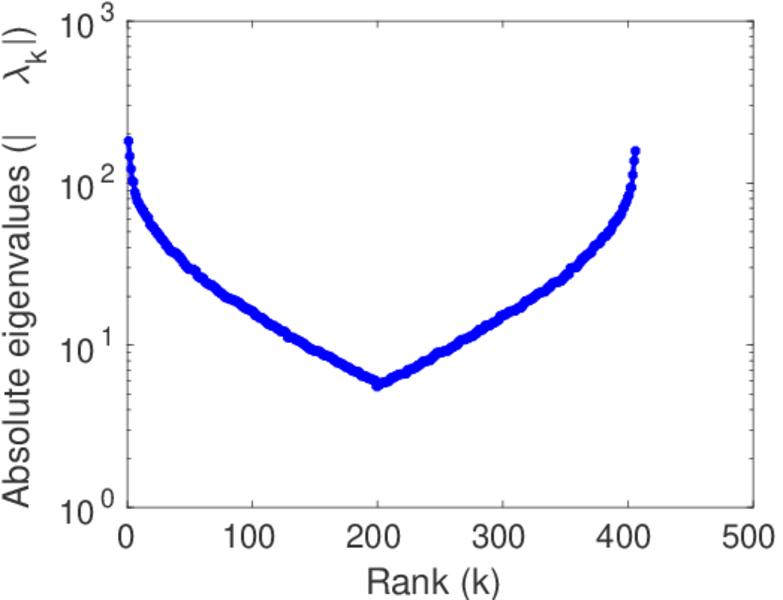
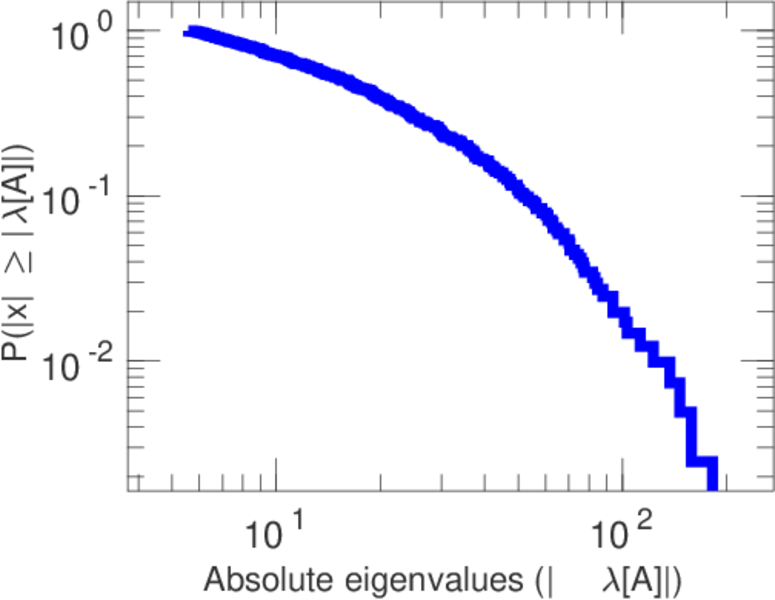
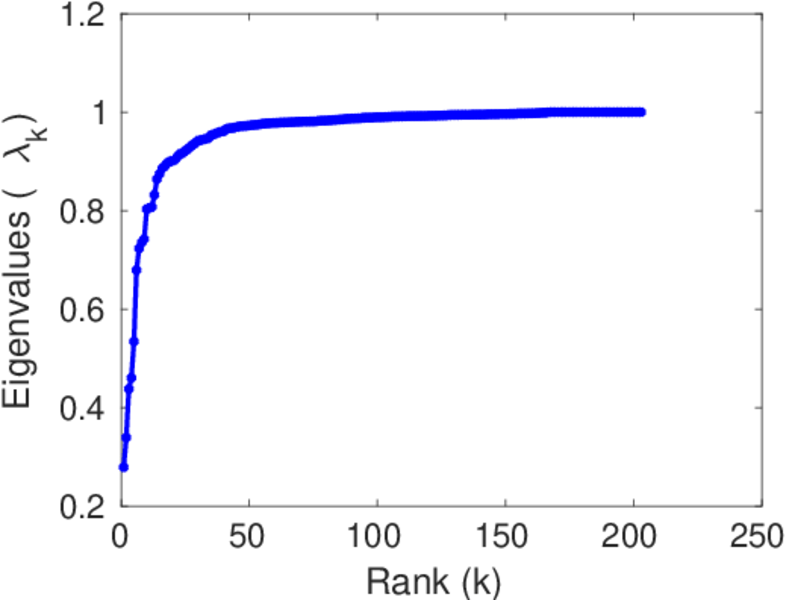
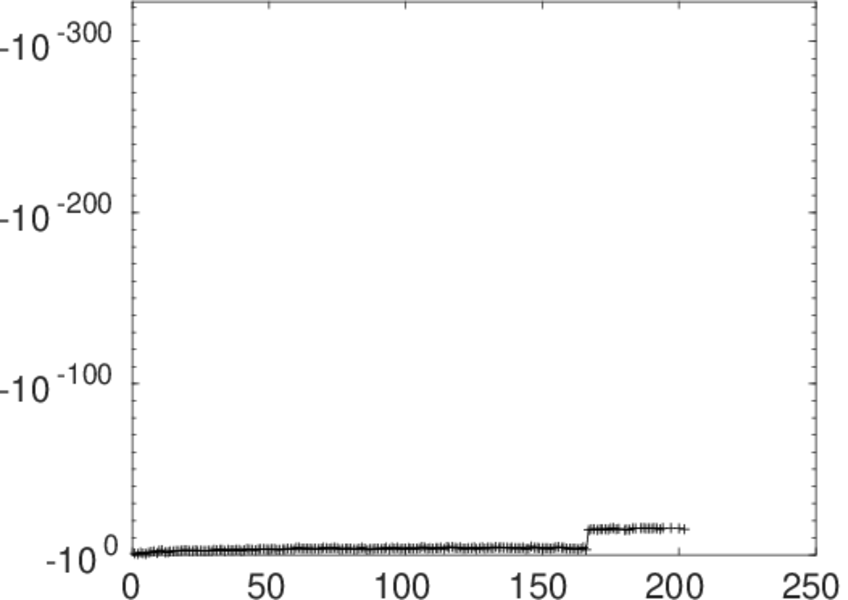
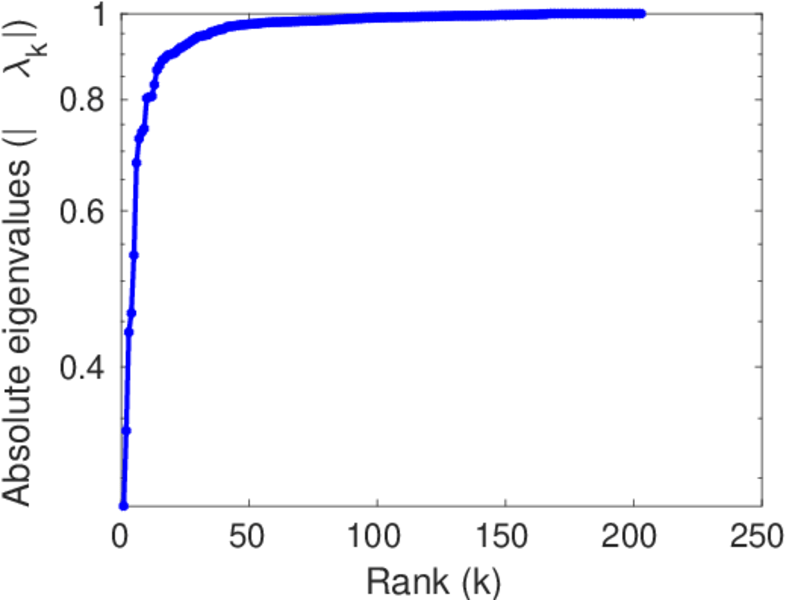
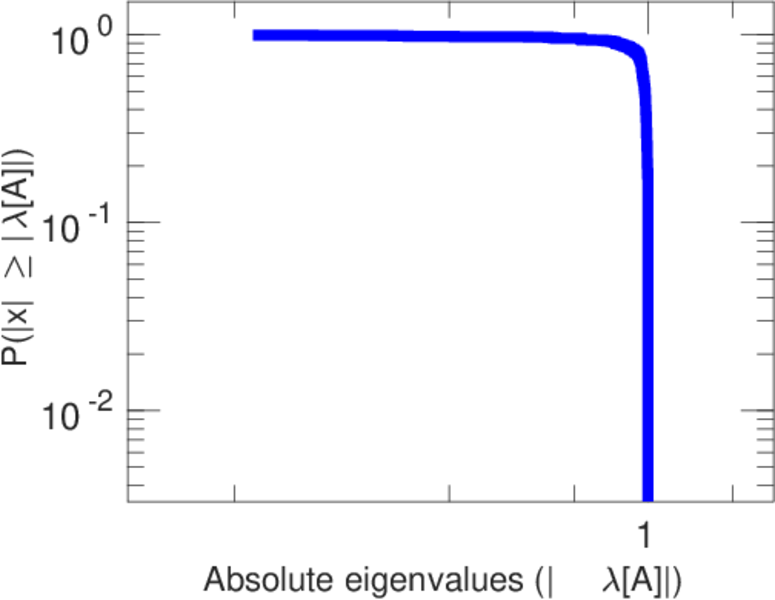
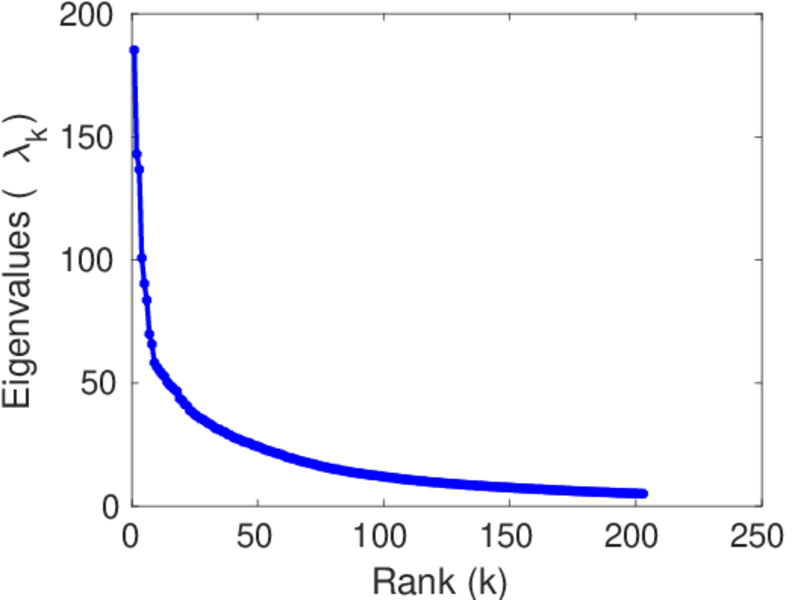
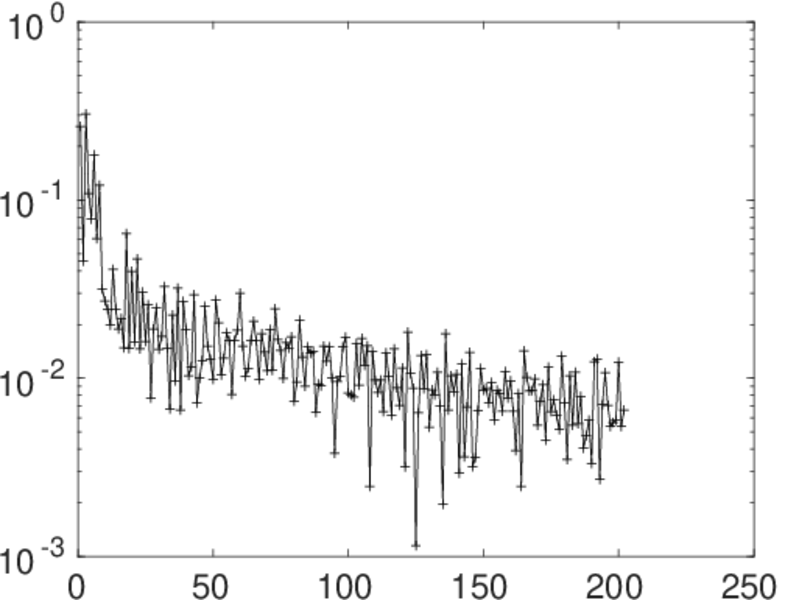
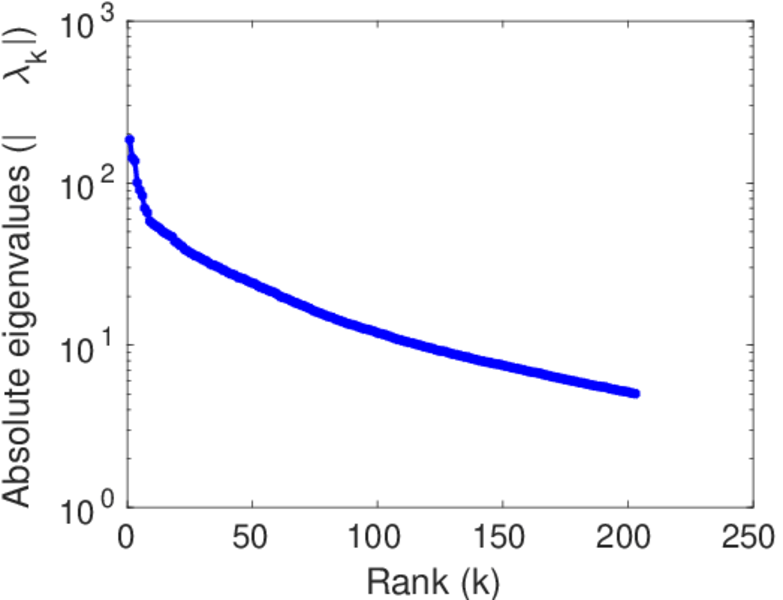
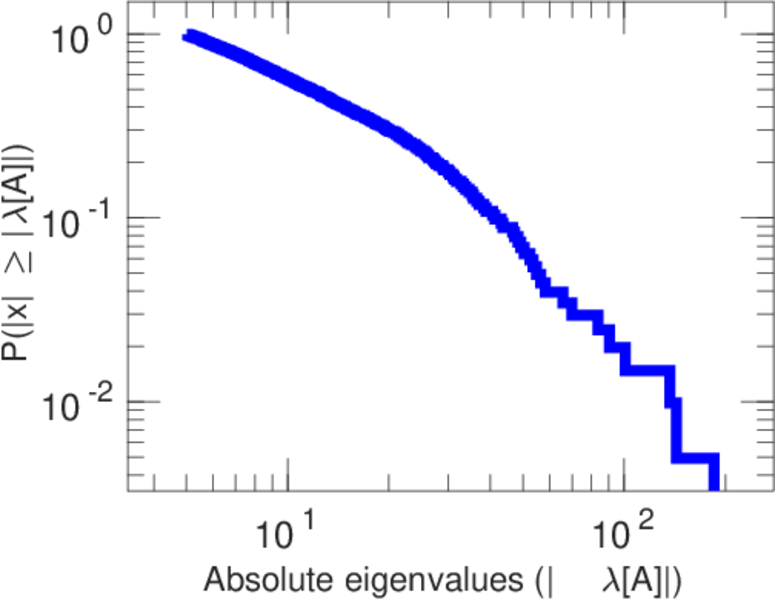
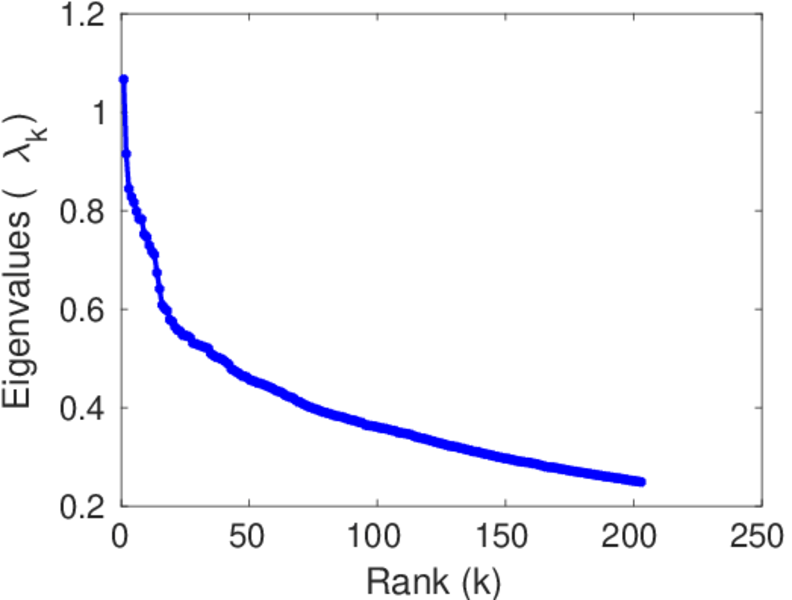
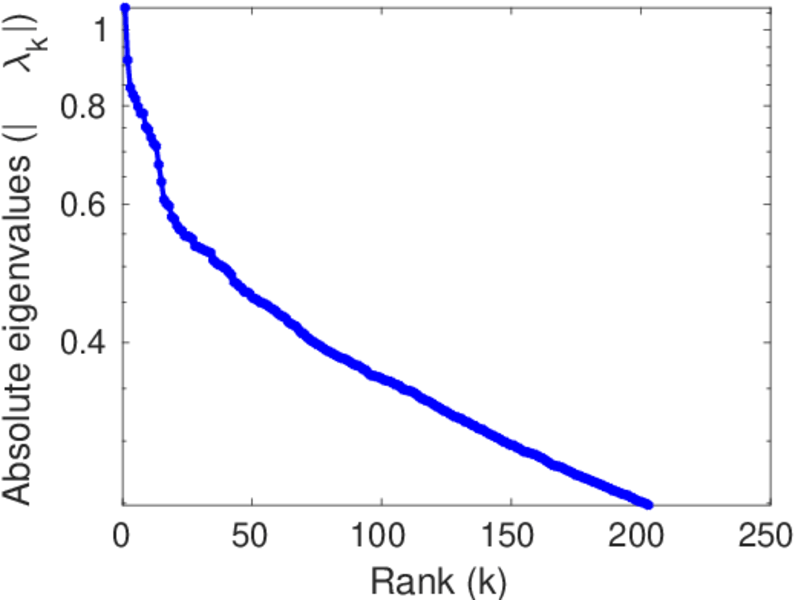
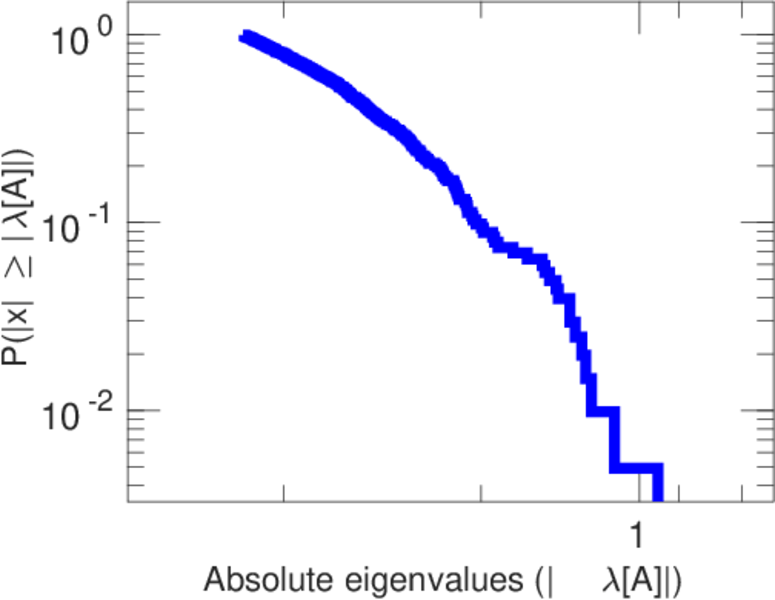
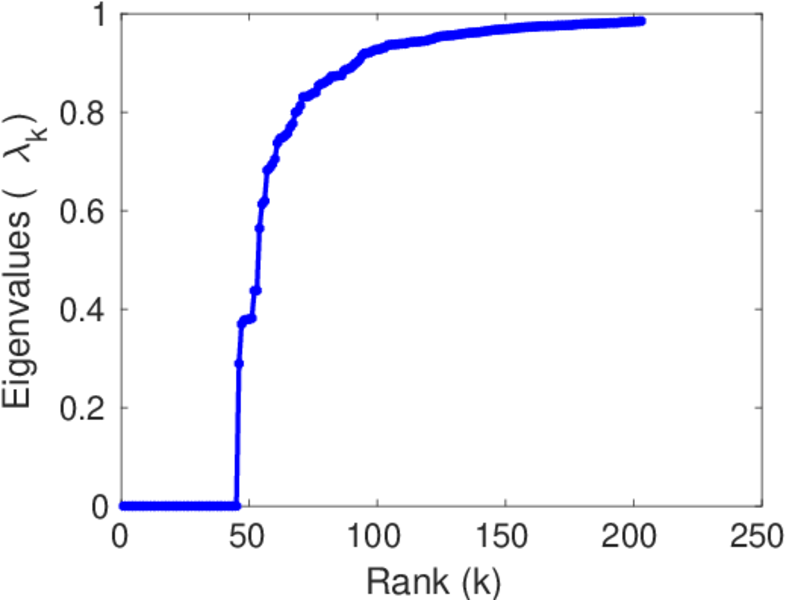
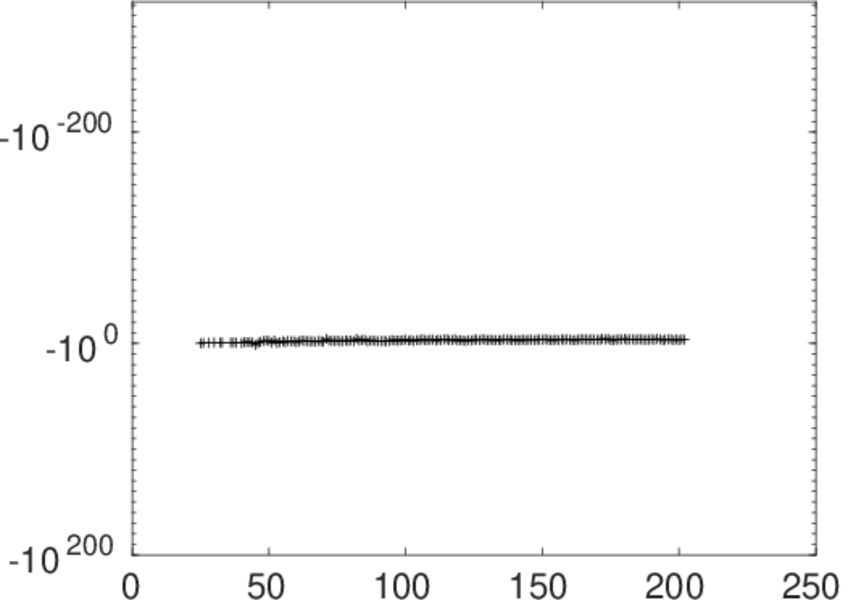
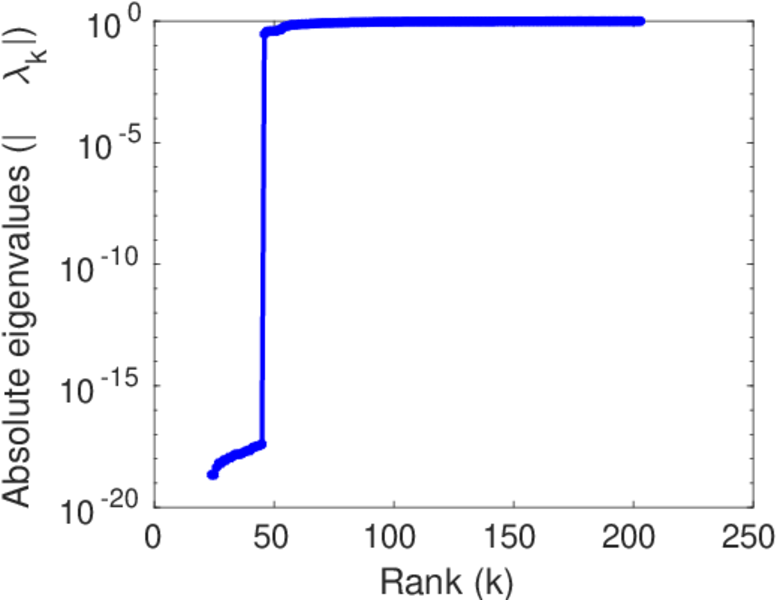
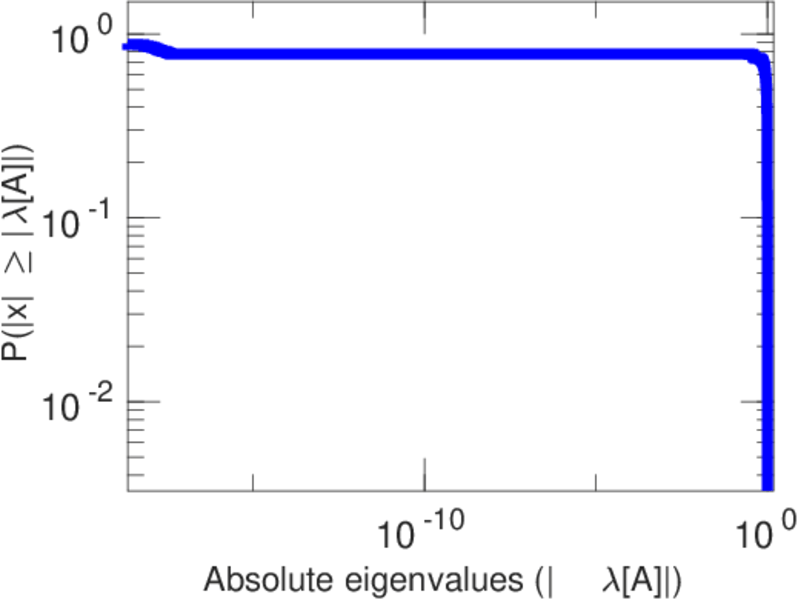
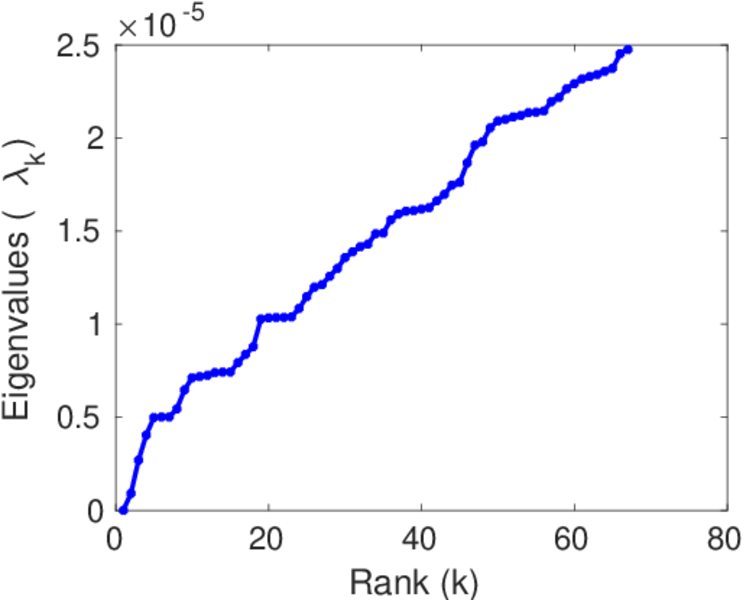
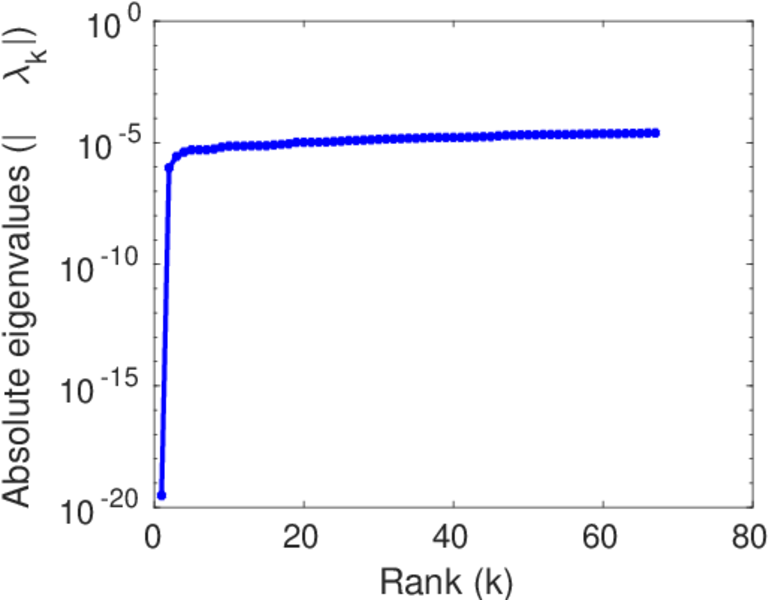
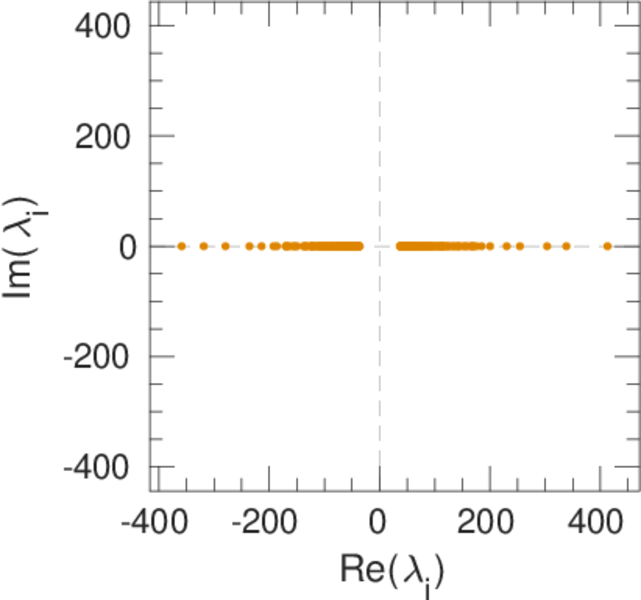
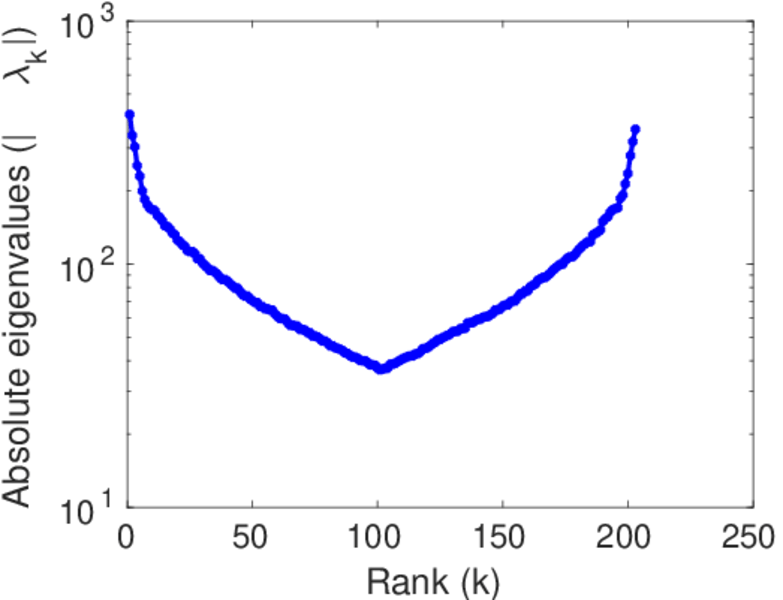
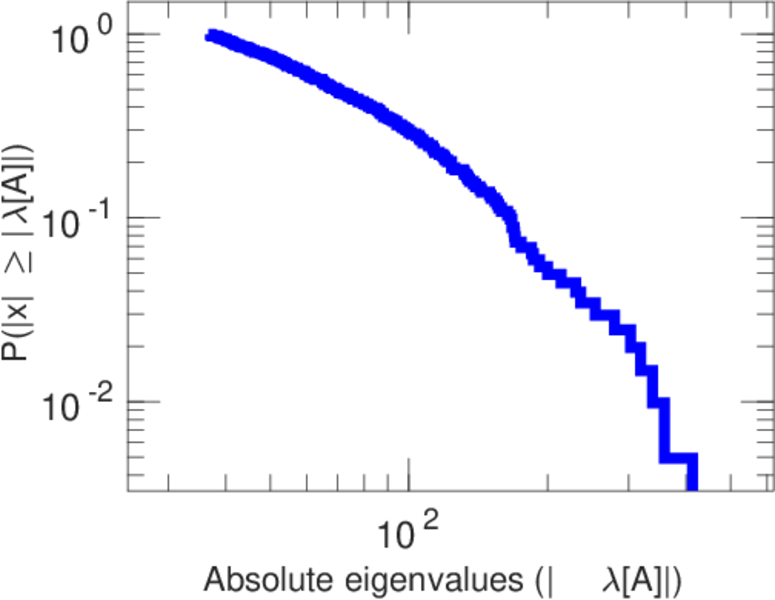
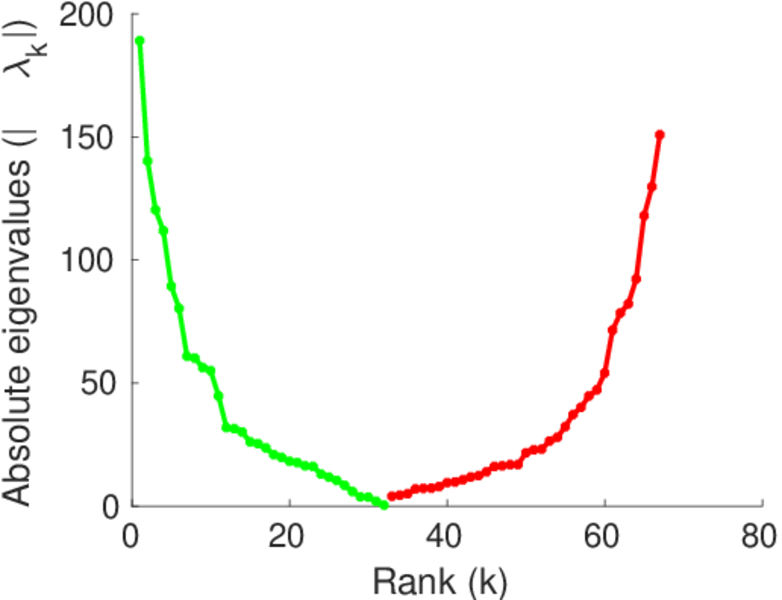
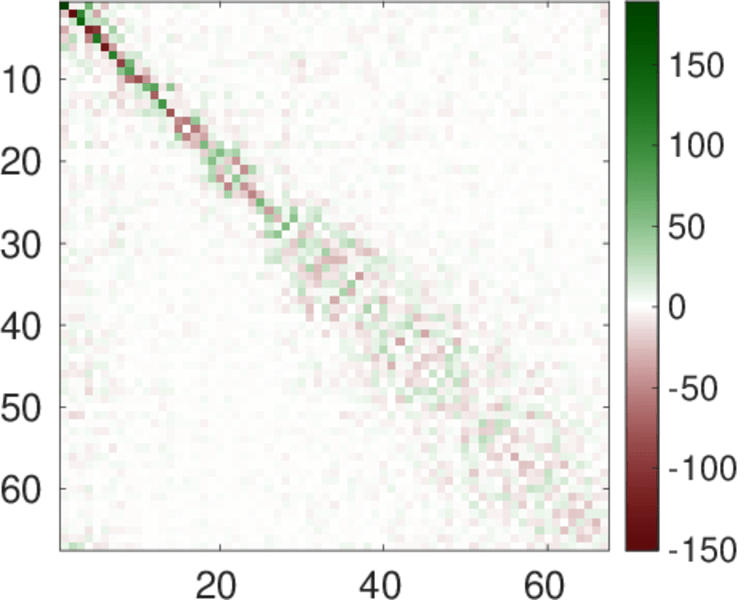
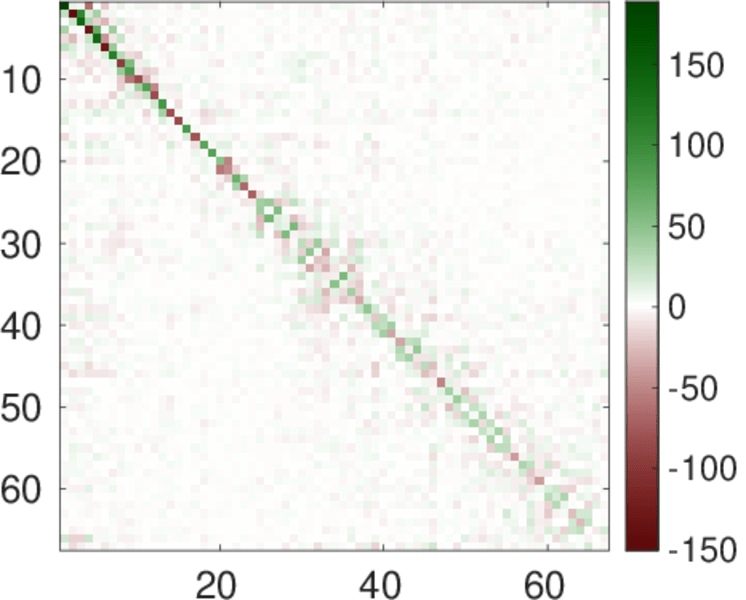
Matrix decompositions plots


Downloads
References
|
[1]
|
Jérôme Kunegis.
KONECT – The Koblenz Network Collection.
In Proc. Int. Conf. on World Wide Web Companion, pages
1343–1350, 2013.
[ http ]
|
|
[2]
|
Tore Opsahl and Pietro Panzarasa.
Clustering in weighted networks.
Soc. Netw., 31(2):155–163, 2009.
|
 KONECT ‣ Networks ‣
Buy Me a Coffee
KONECT ‣ Networks ‣
Buy Me a Coffee