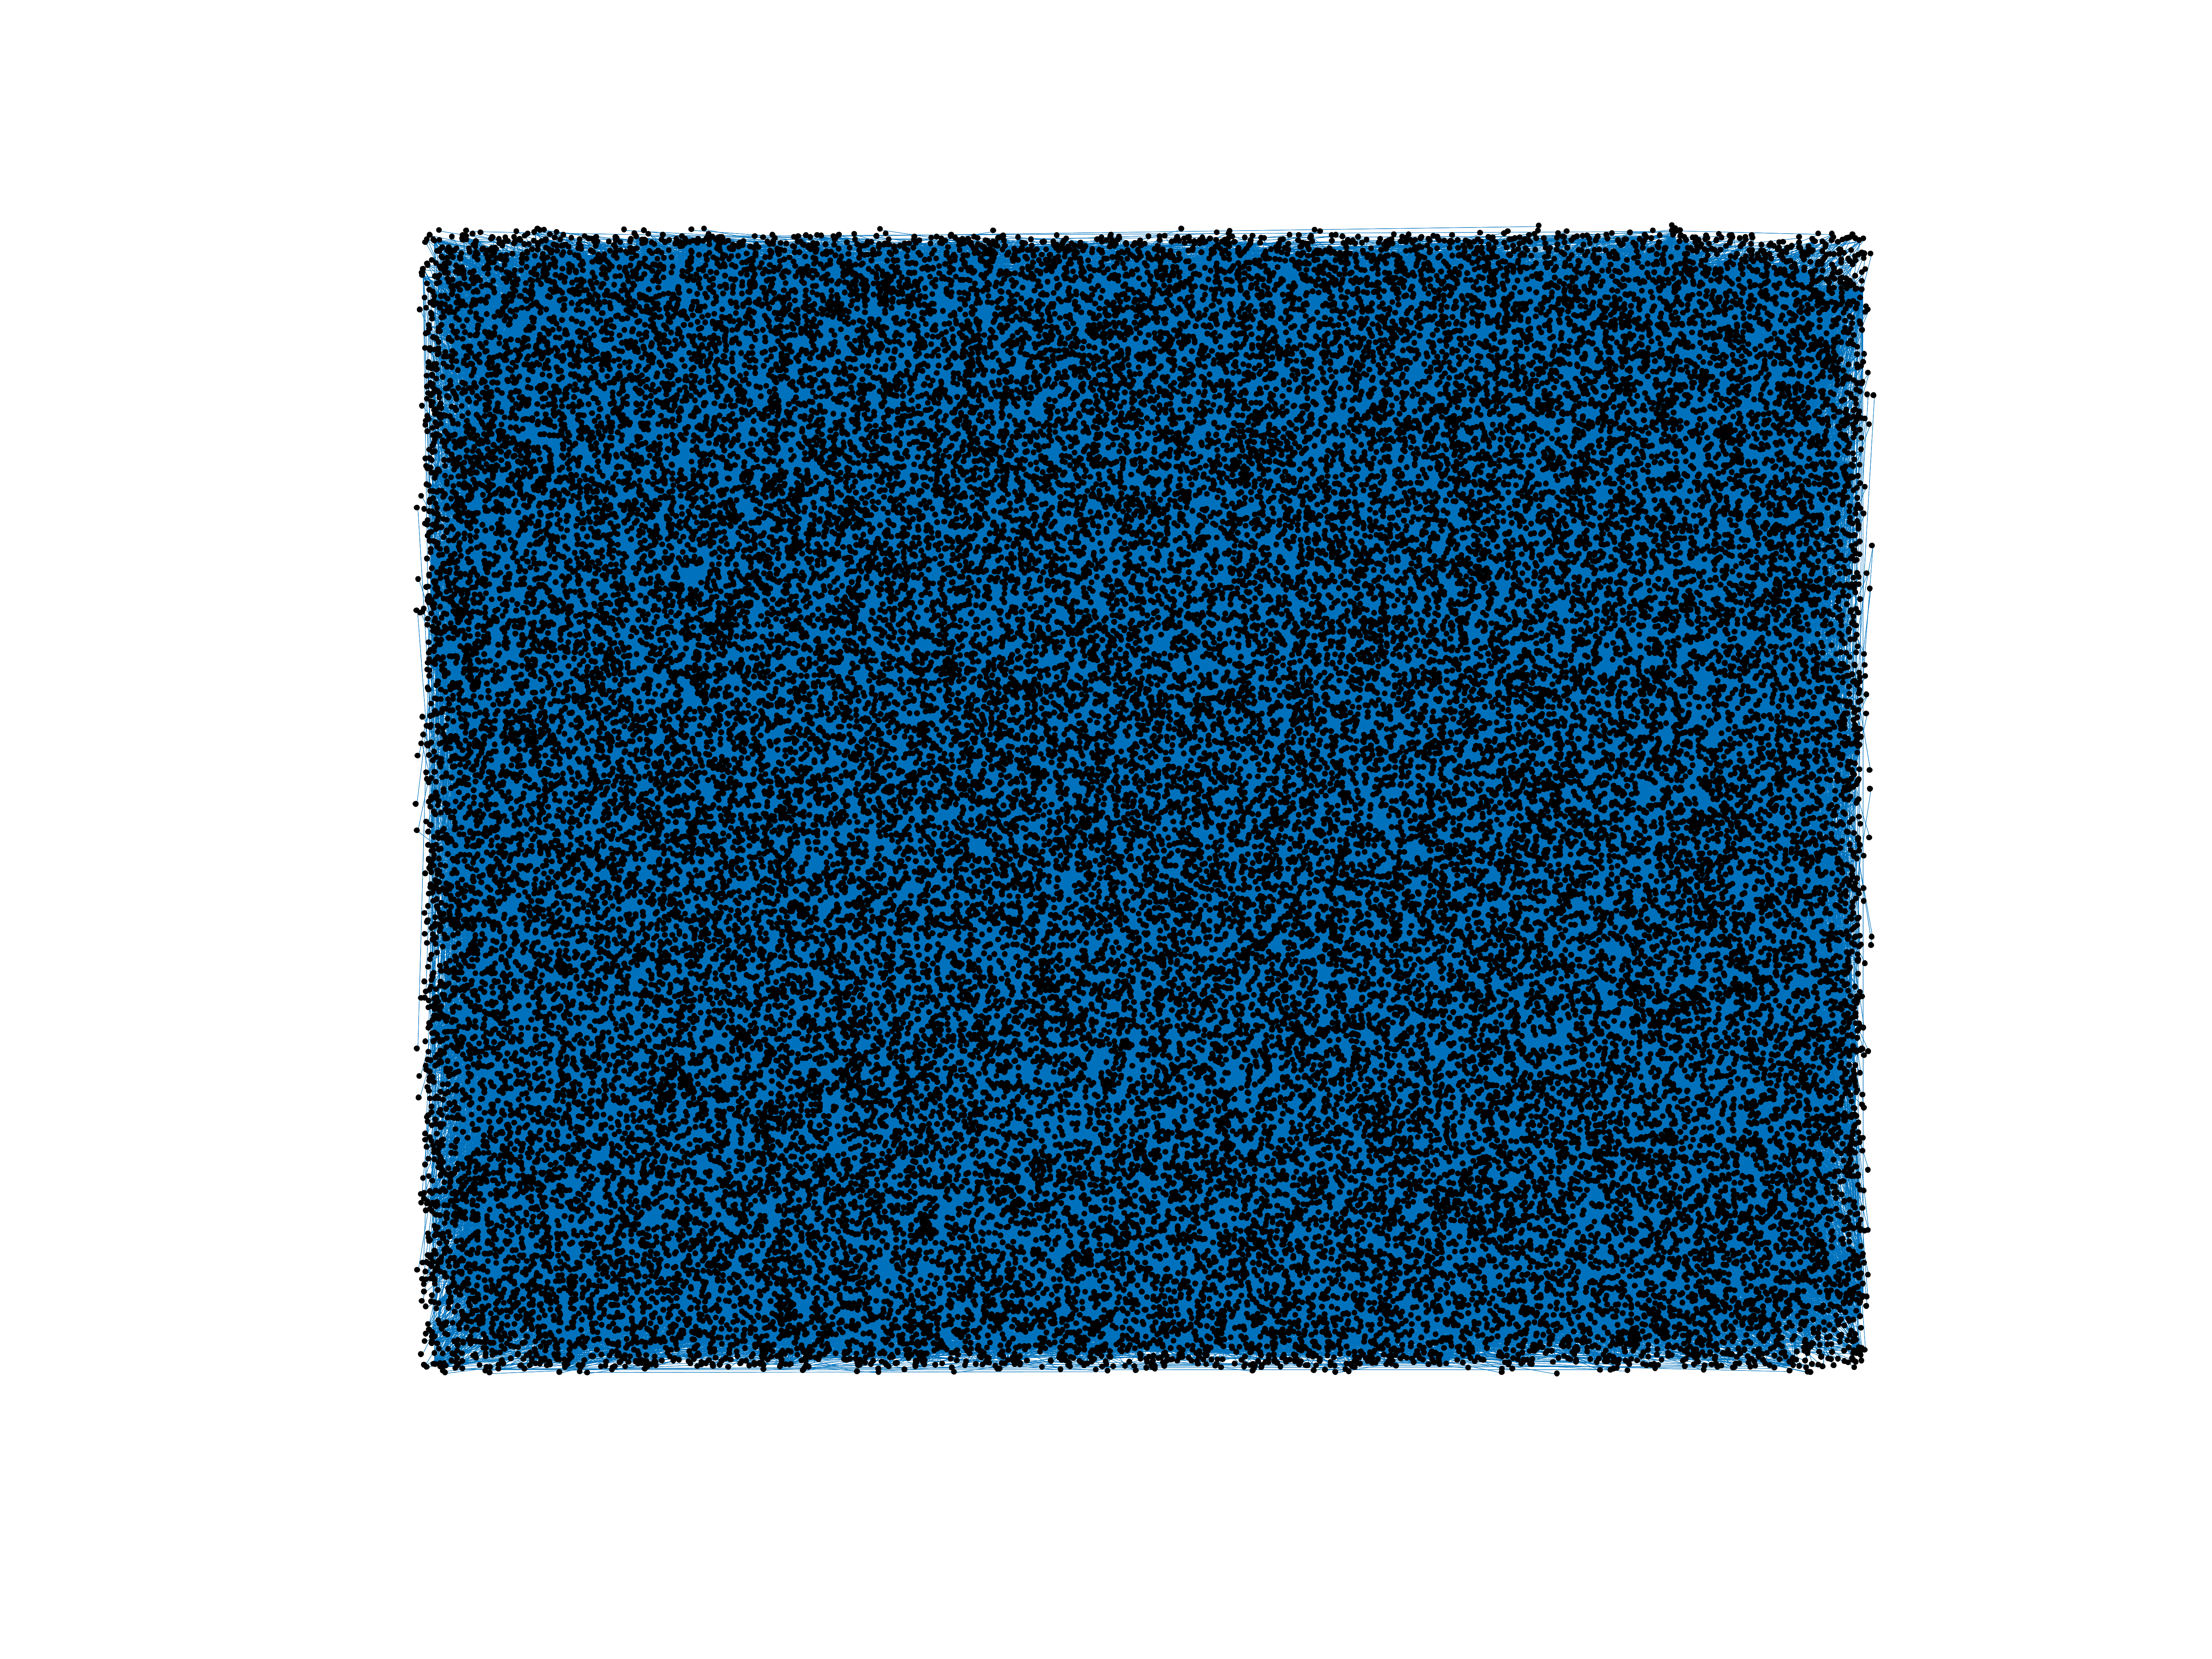
Slashdot
This is the reply network of technology website Slashdot. Nodes are users and
edges are replies. The edges are directed and start from the responding user.
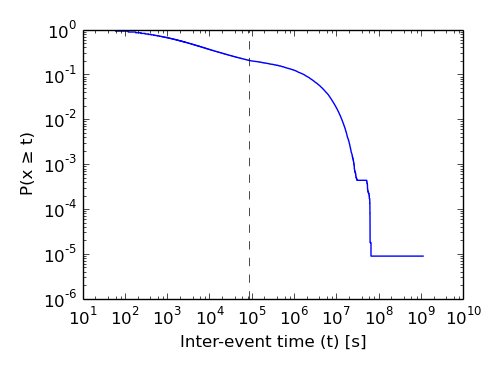
Edges are annotated with the timestamp of the reply.
Metadata
Statistics
| Size | n = | 51,083
|
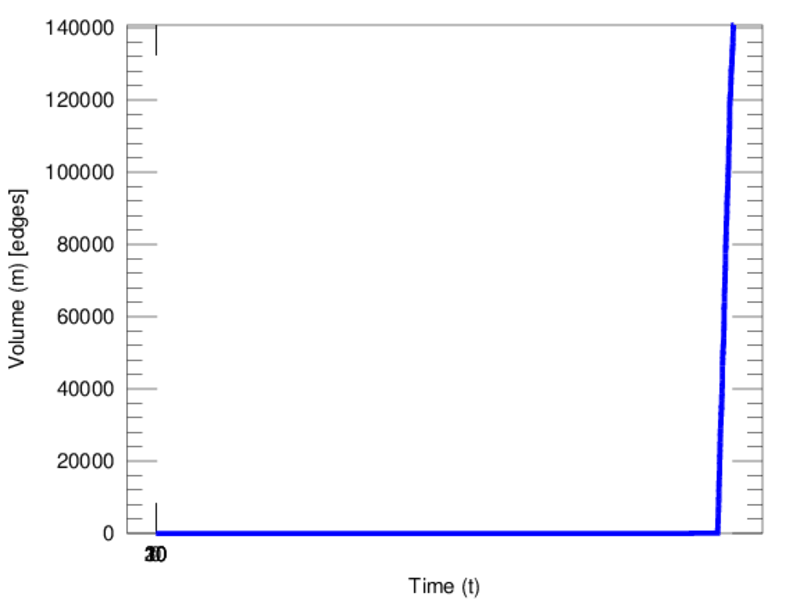
| Volume | m = | 140,778
|
| Unique edge count | m̿ = | 131,175
|
| Loop count | l = | 989
|
| Wedge count | s = | 9,392,516
|
| Claw count | z = | 4,547,184,694
|
| Cross count | x = | 3,037,926,984,306
|
| Triangle count | t = | 18,937
|
| Square count | q = | 549,661
|
| 4-Tour count | T4 = | 42,200,498
|
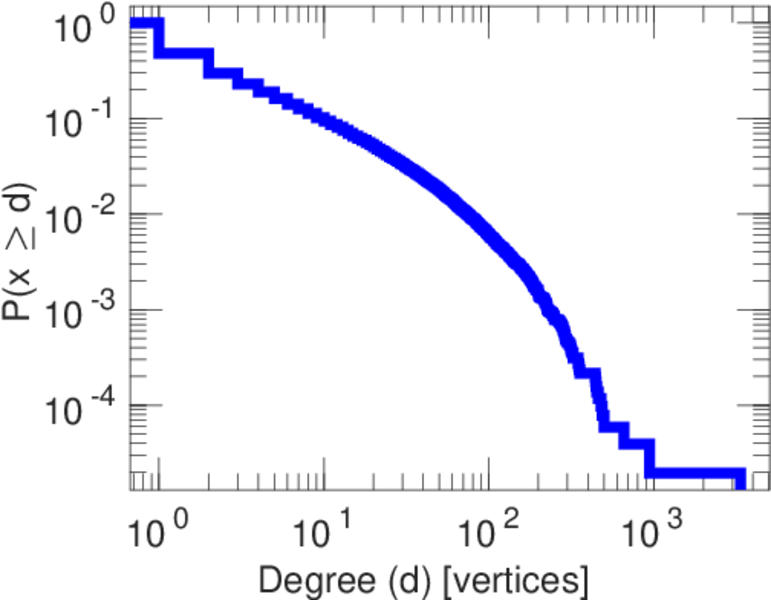
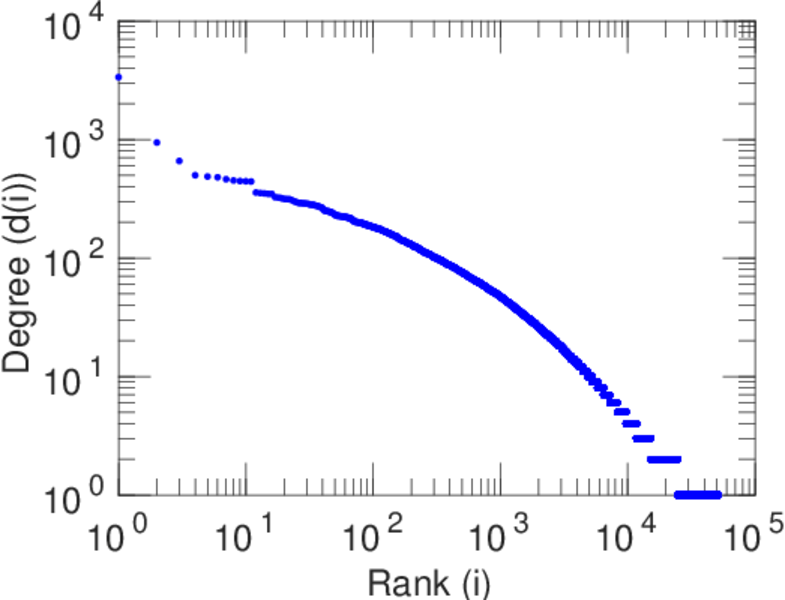
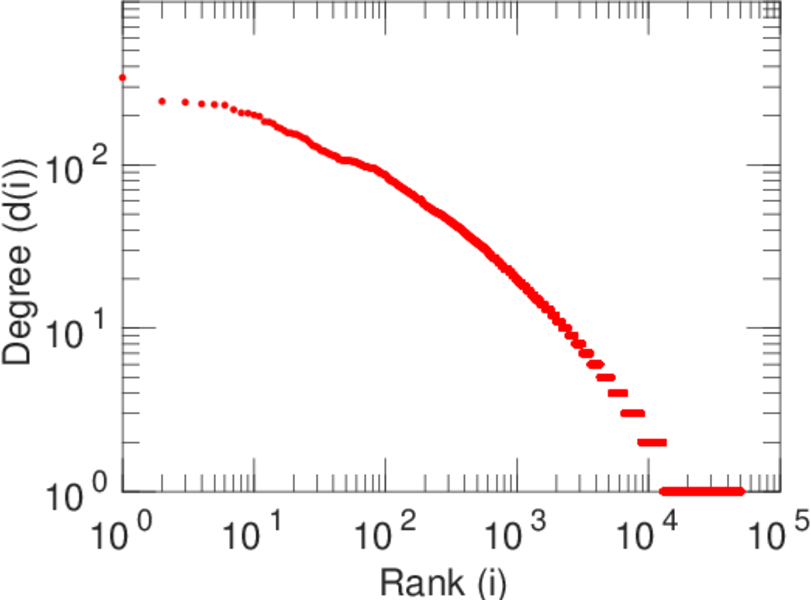
| Maximum degree | dmax = | 3,357
|
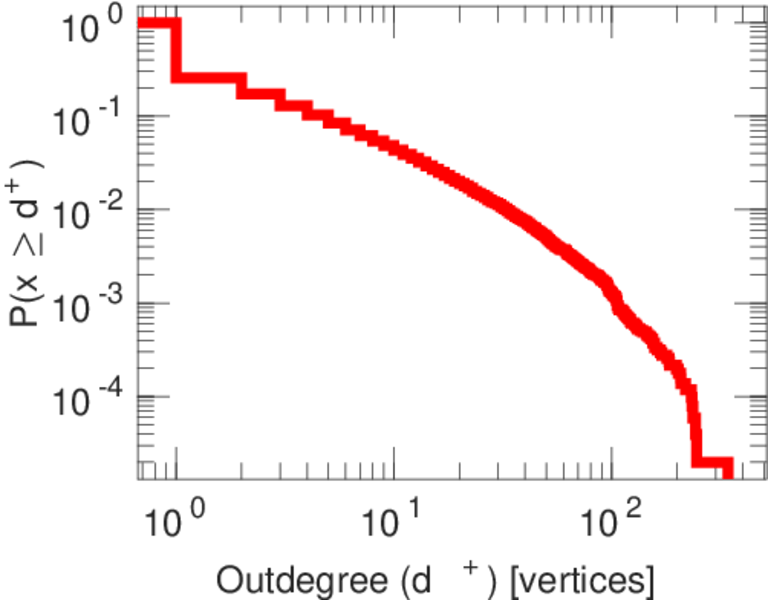
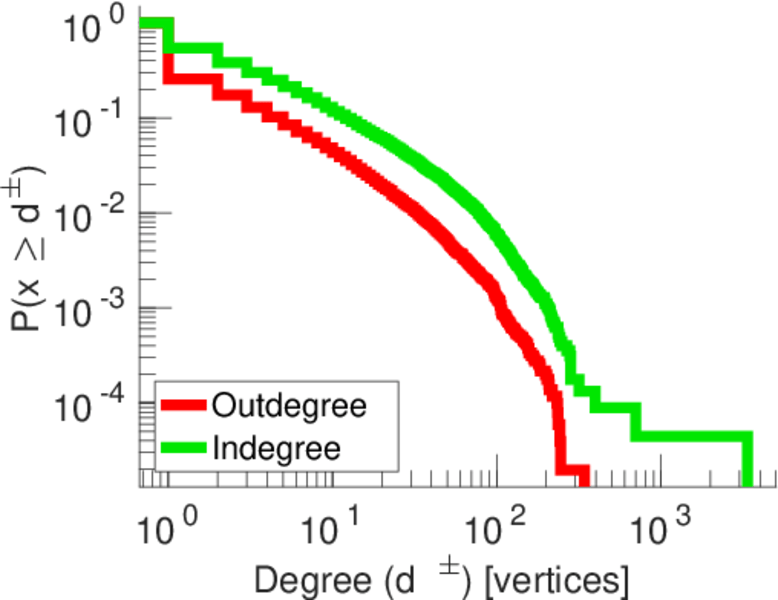
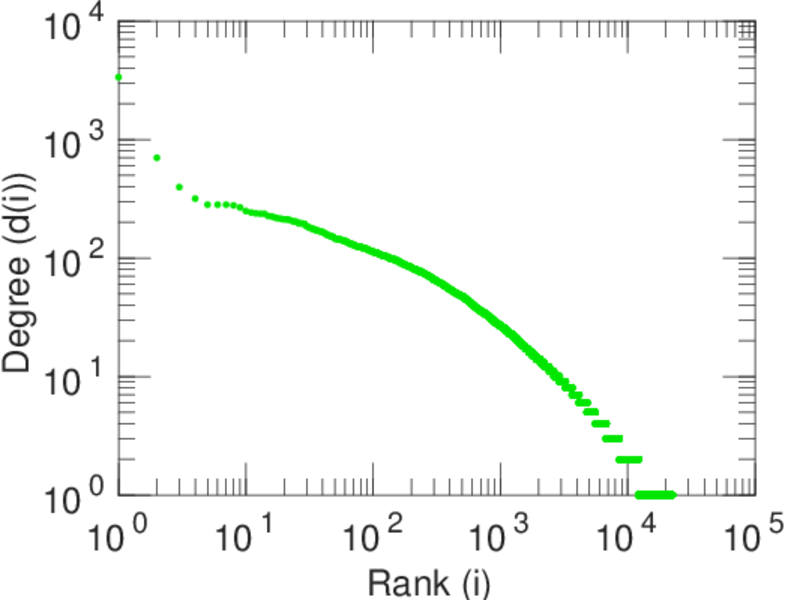
| Maximum outdegree | d+max = | 342
|
| Maximum indegree | d−max = | 3,357
|
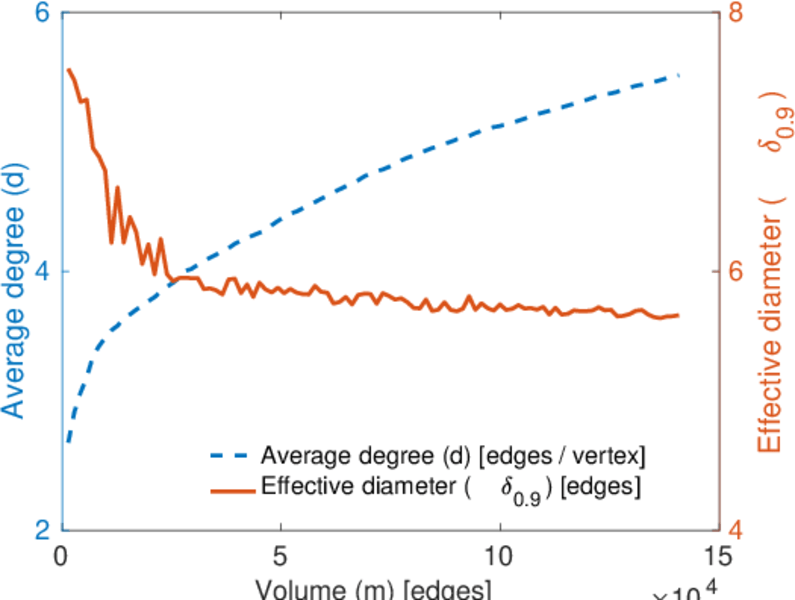
| Average degree | d = | 5.511 74
|
| Fill | p = | 5.026 88 × 10−5
|
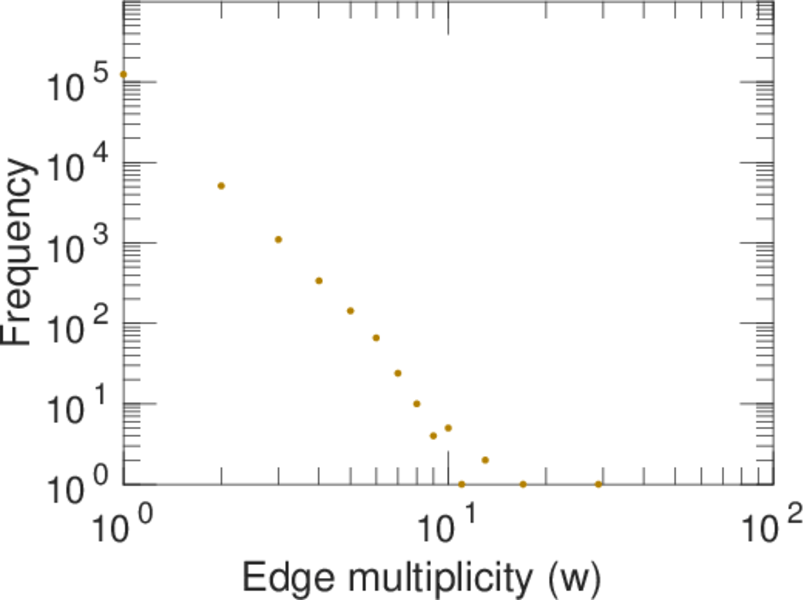
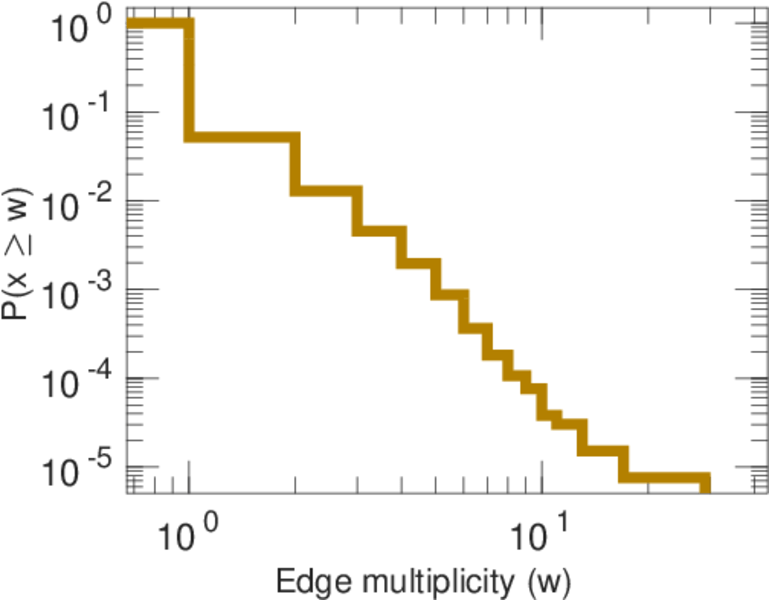
| Average edge multiplicity | m̃ = | 1.073 21
|
| Size of LCC | N = | 51,083
|
| Size of LSCC | Ns = | 16,377
|
| Relative size of LSCC | Nrs = | 0.320 596
|
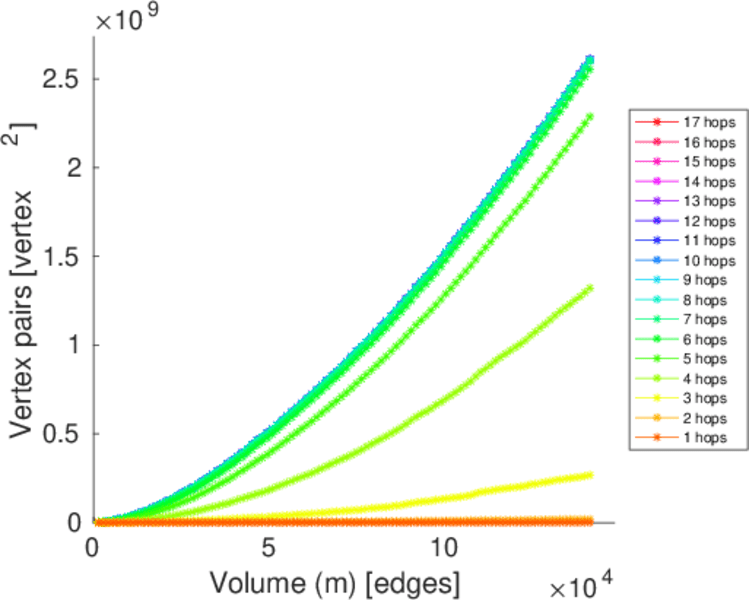
| Diameter | δ = | 17
|
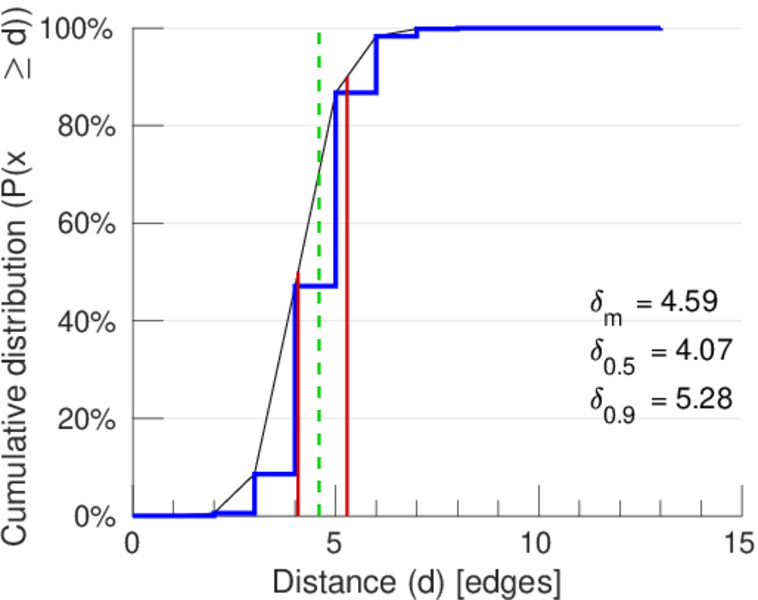
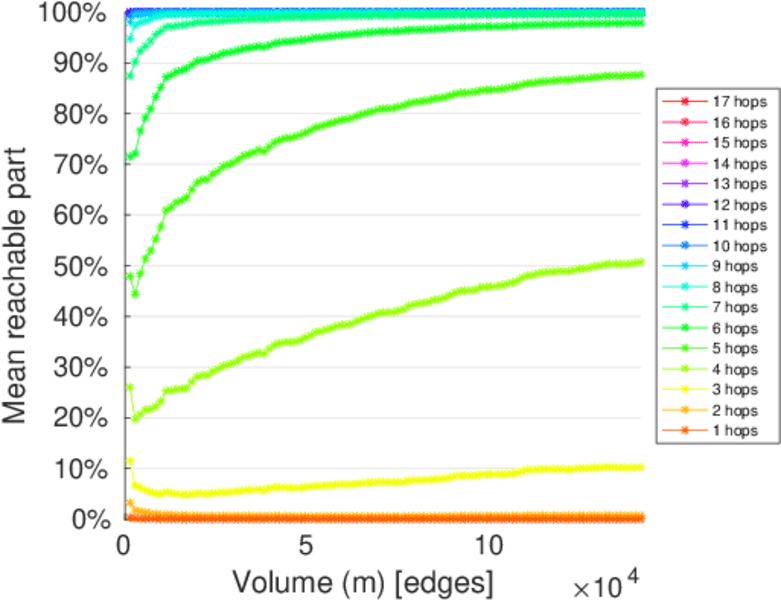
| 50-Percentile effective diameter | δ0.5 = | 4.073 23
|
| 90-Percentile effective diameter | δ0.9 = | 5.280 07
|
| Median distance | δM = | 5
|
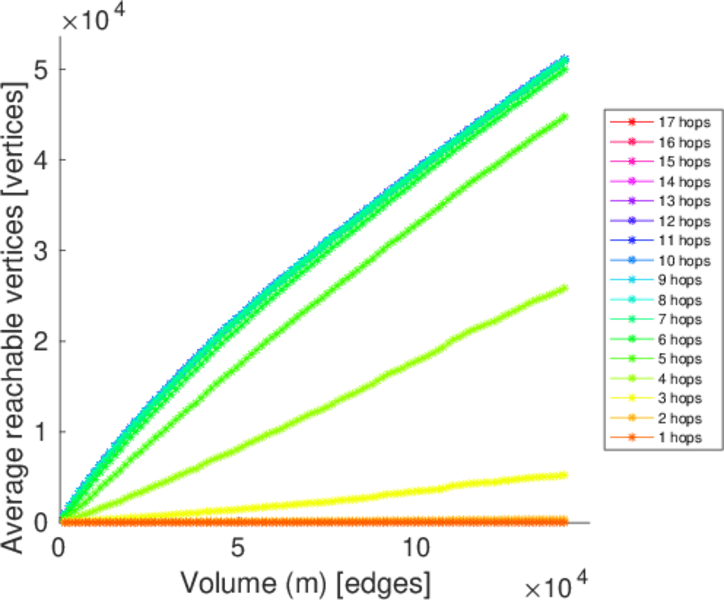
| Mean distance | δm = | 4.589 05
|
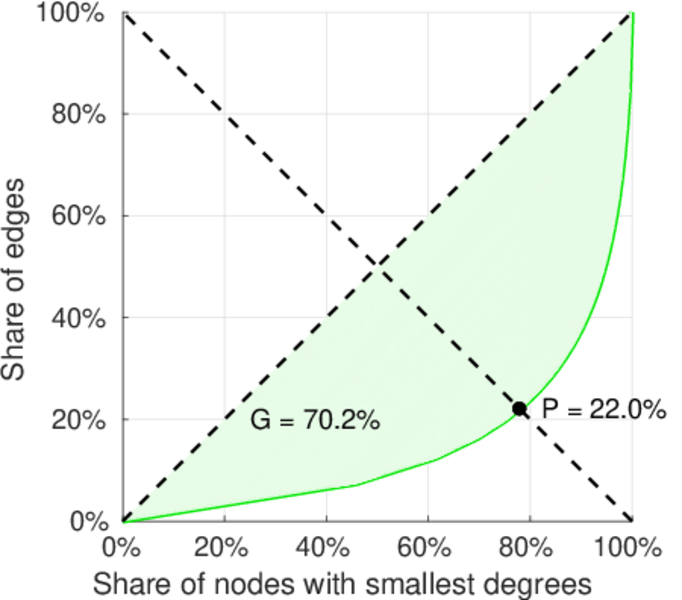
| Gini coefficient | G = | 0.712 486
|
| Balanced inequality ratio | P = | 0.208 655
|
| Outdegree balanced inequality ratio | P+ = | 0.263 599
|
| Indegree balanced inequality ratio | P− = | 0.219 786
|
| Relative edge distribution entropy | Her = | 0.881 606
|
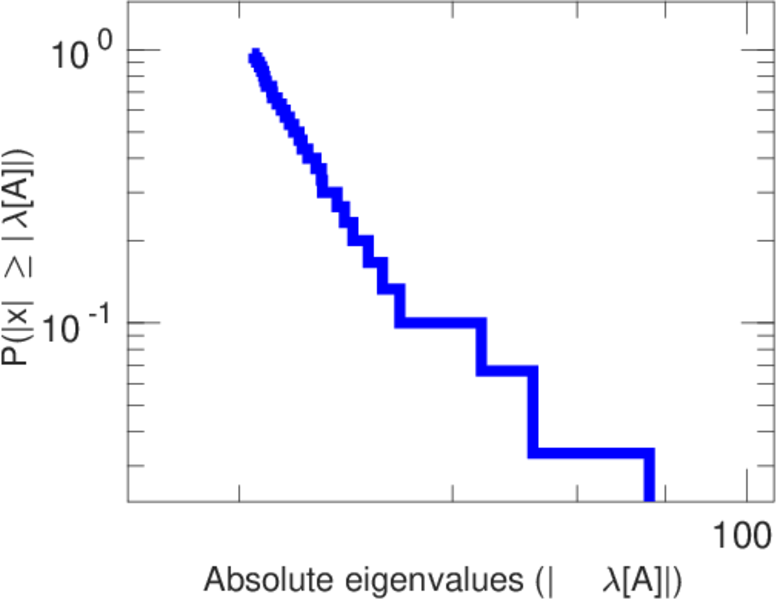
| Power law exponent | γ = | 2.518 86
|
| Tail power law exponent | γt = | 1.911 00
|
| Tail power law exponent with p | γ3 = | 1.911 00
|
| p-value | p = | 0.000 00
|
| Outdegree tail power law exponent with p | γ3,o = | 2.371 00
|
| Outdegree p-value | po = | 0.000 00
|
| Indegree tail power law exponent with p | γ3,i = | 2.061 00
|
| Indegree p-value | pi = | 0.000 00
|
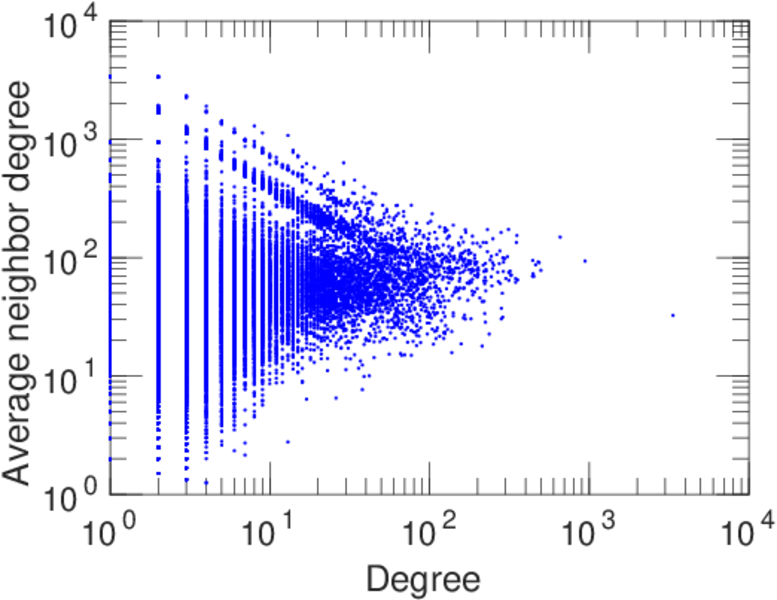
| Degree assortativity | ρ = | −0.034 675 3
|
| Degree assortativity p-value | pρ = | 5.857 49 × 10−63
|
| In/outdegree correlation | ρ± = | +0.716 637
|
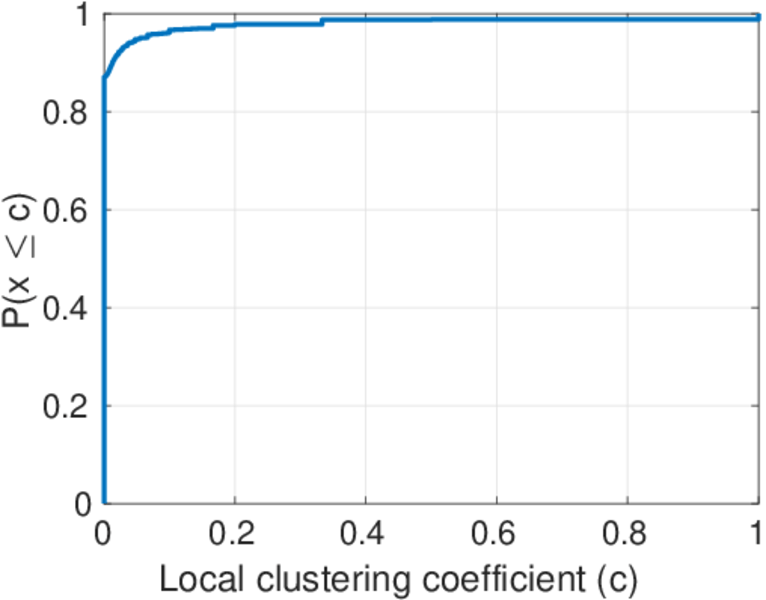
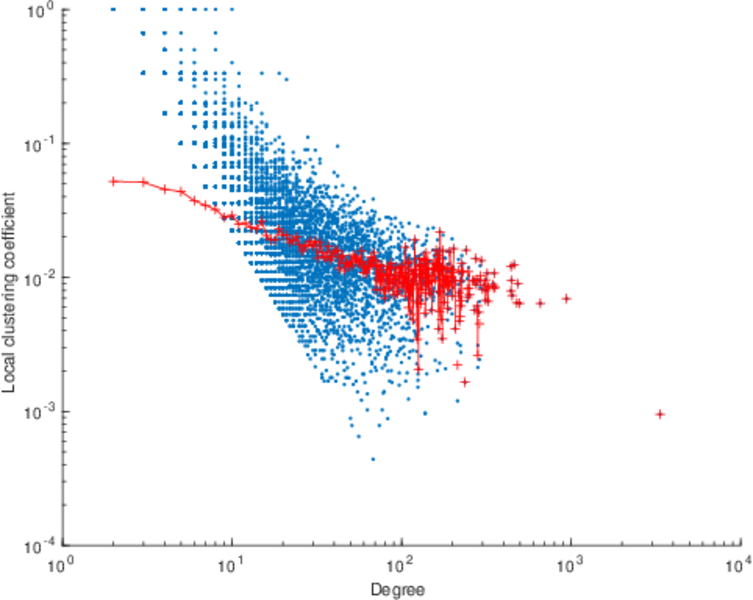
| Clustering coefficient | c = | 0.006 048 54
|
| Directed clustering coefficient | c± = | 0.009 869 28
|
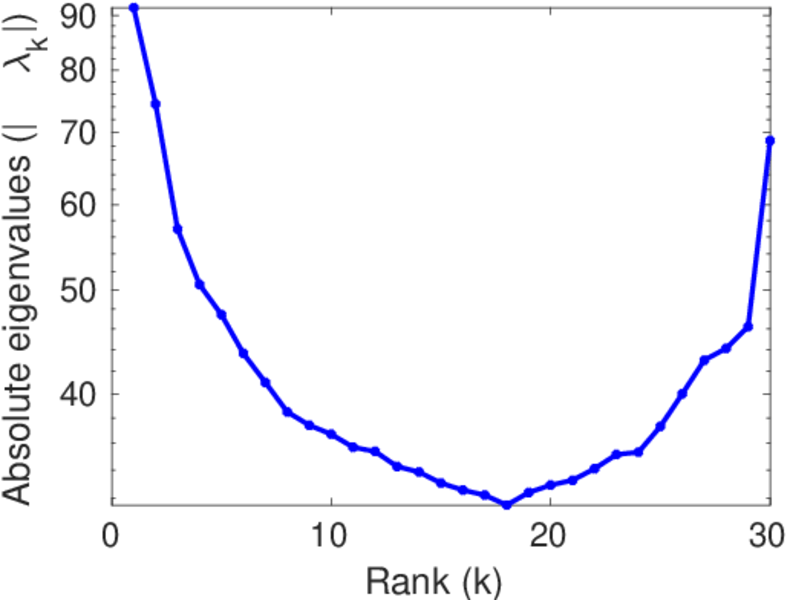
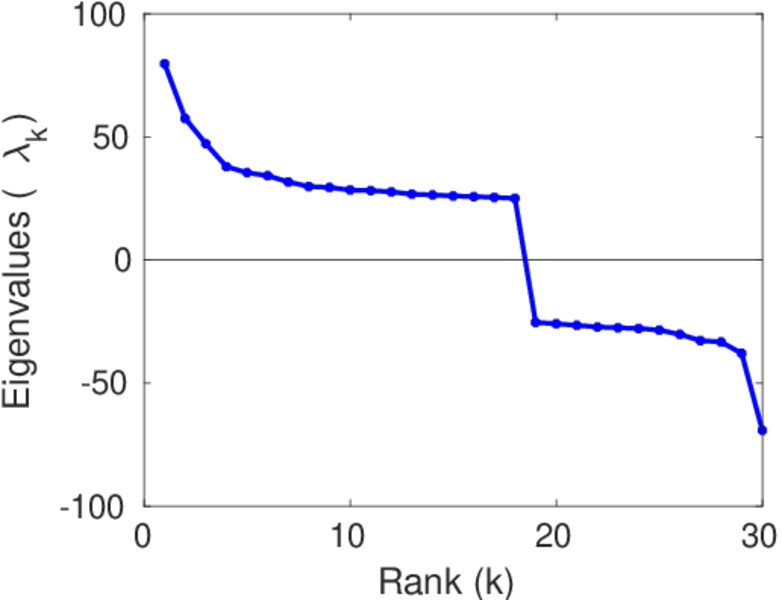
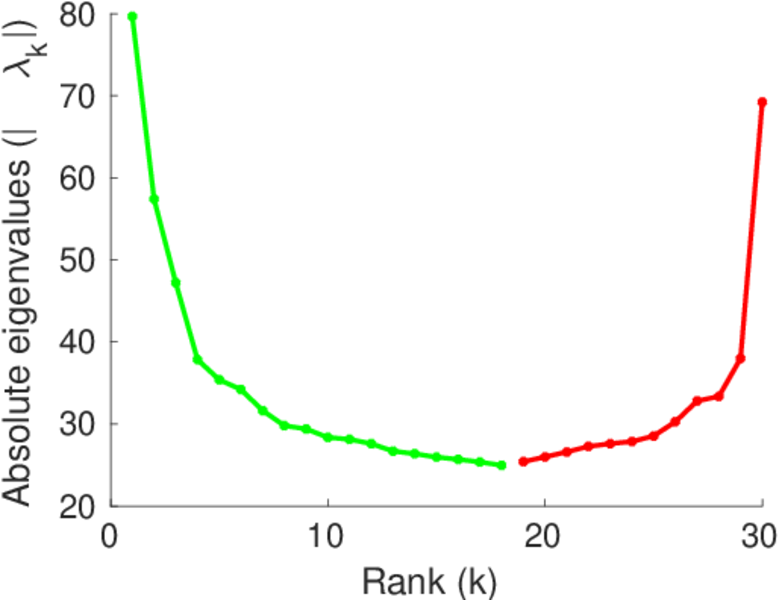
| Spectral norm | α = | 91.502 9
|
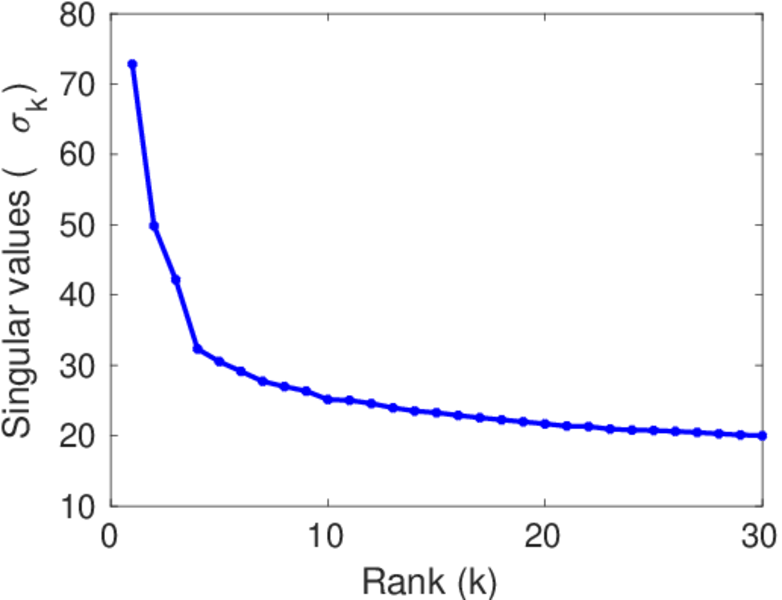
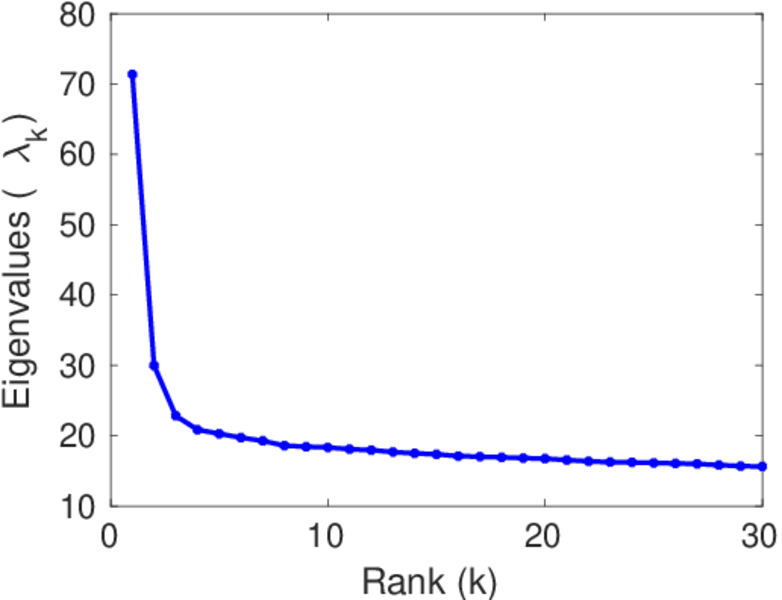
| Operator 2-norm | ν = | 71.918 7
|
| Cyclic eigenvalue | π = | 40.475 8
|
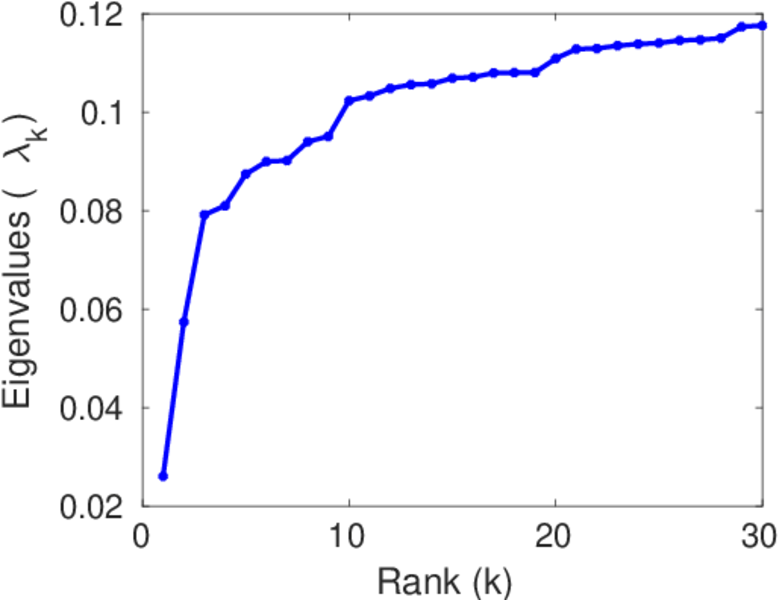
| Algebraic connectivity | a = | 0.026 044 0
|
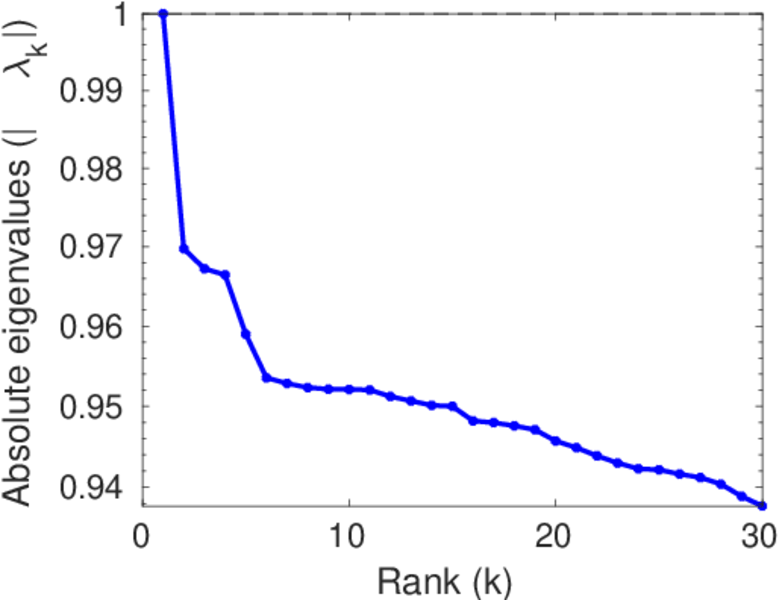
| Spectral separation | |λ1[A] / λ2[A]| = | 1.229 25
|
| Reciprocity | y = | 0.216 497
|
| Non-bipartivity | bA = | 0.247 550
|
| Normalized non-bipartivity | bN = | 0.014 353 1
|
| Algebraic non-bipartivity | χ = | 0.026 251 3
|
| Spectral bipartite frustration | bK = | 0.001 428 07
|
| Controllability | C = | 33,852
|
| Relative controllability | Cr = | 0.662 686
|
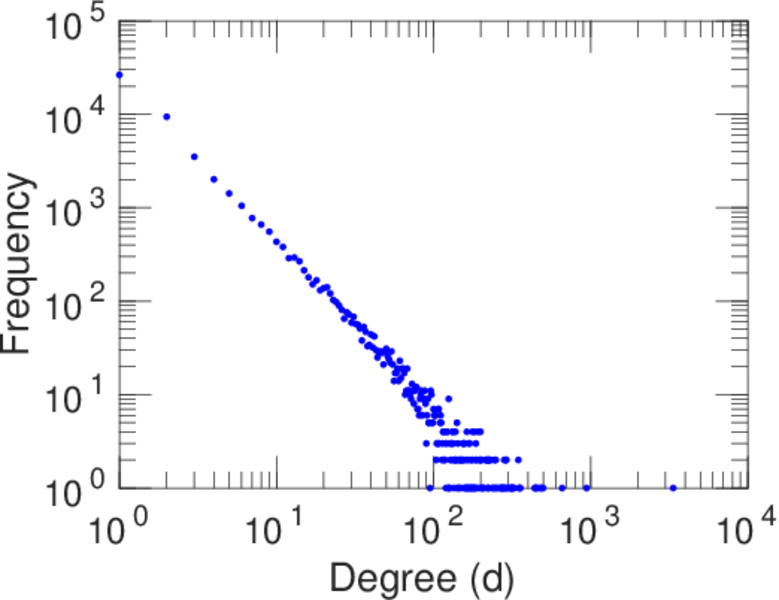
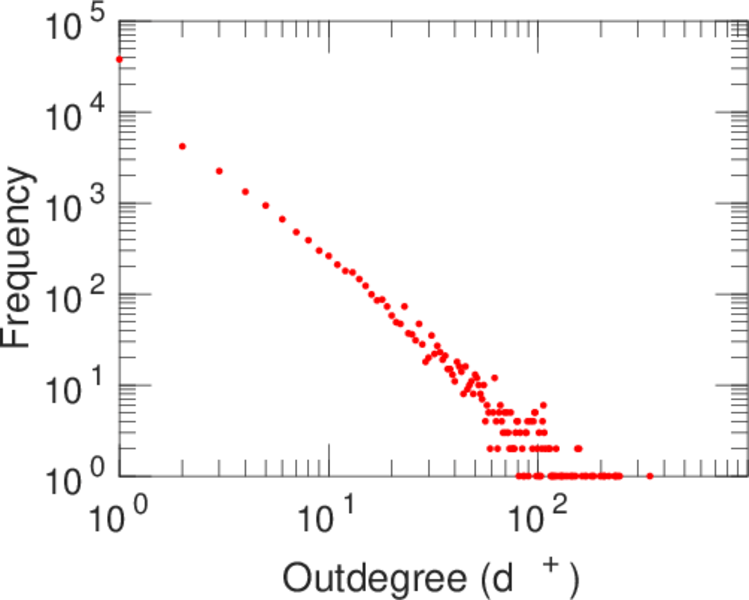
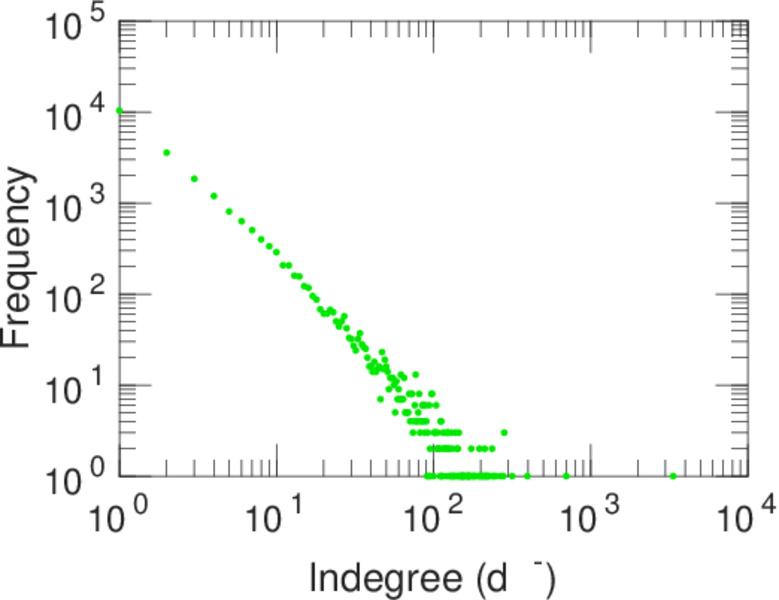
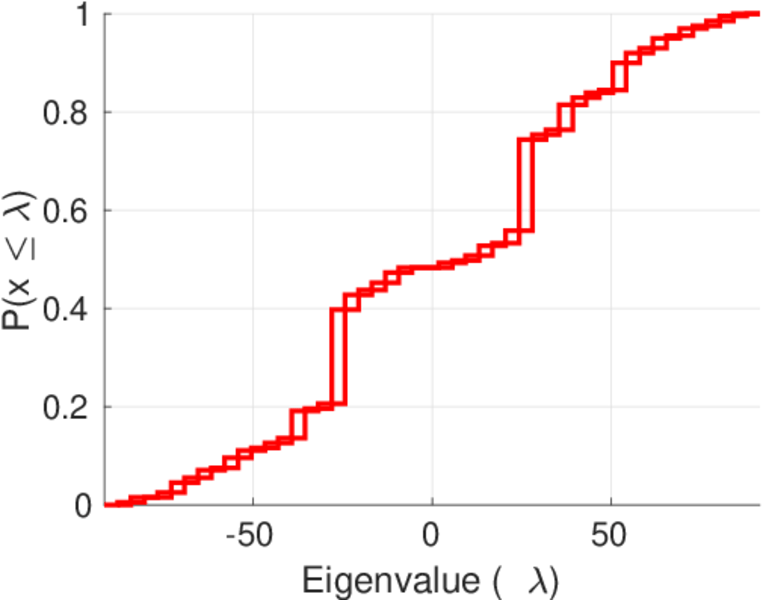
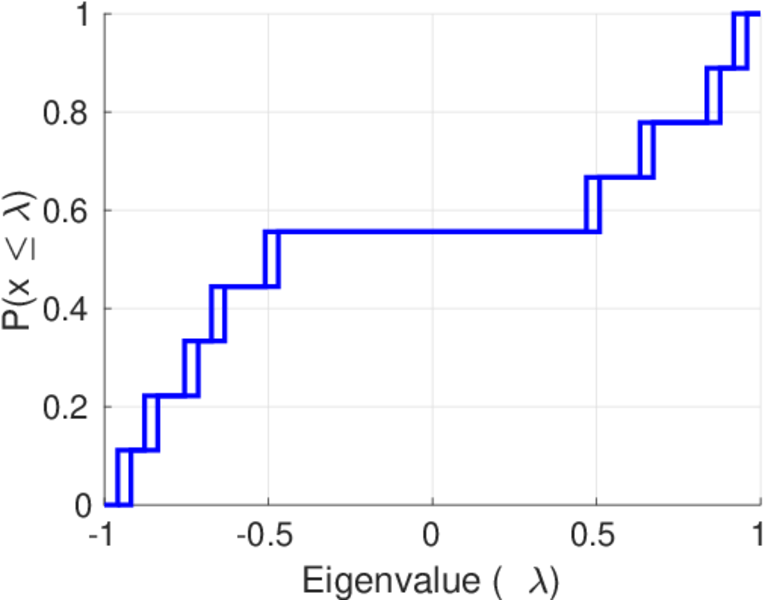
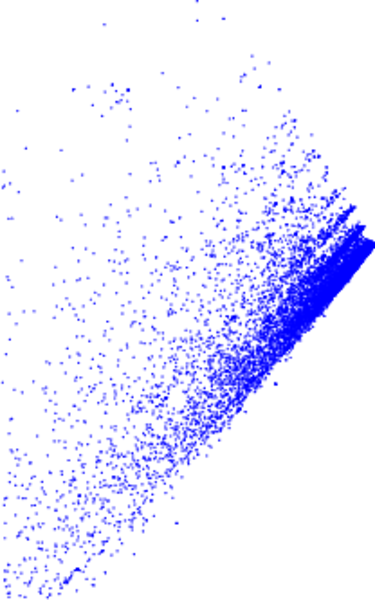
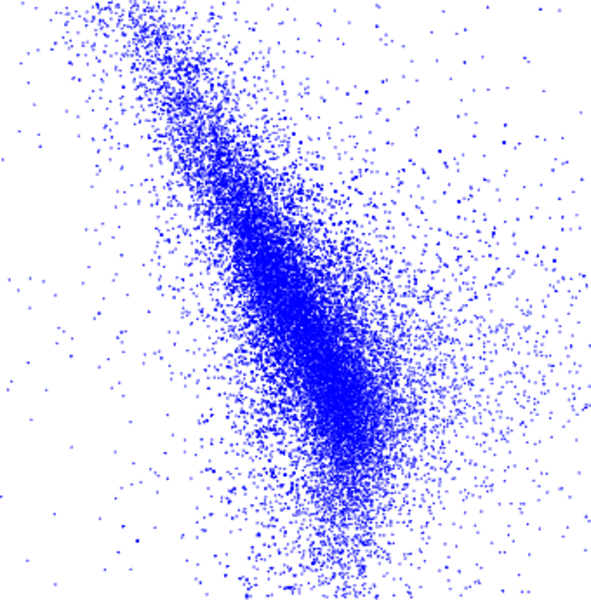
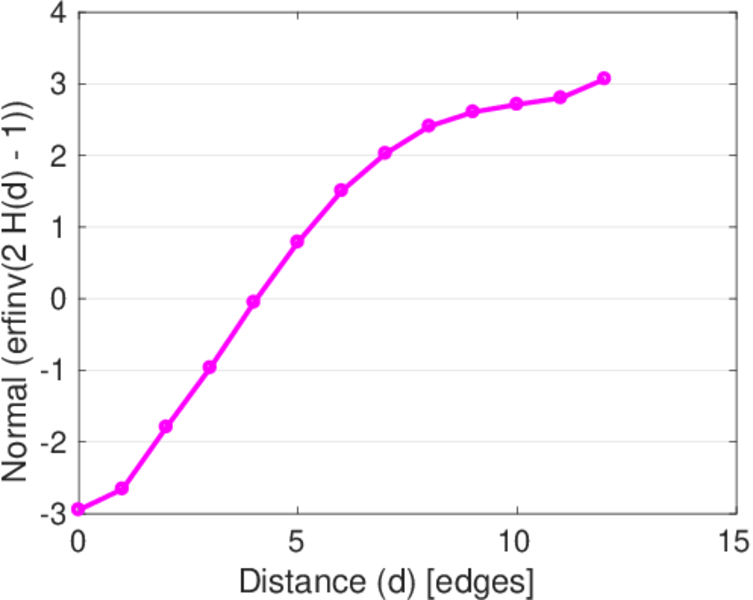
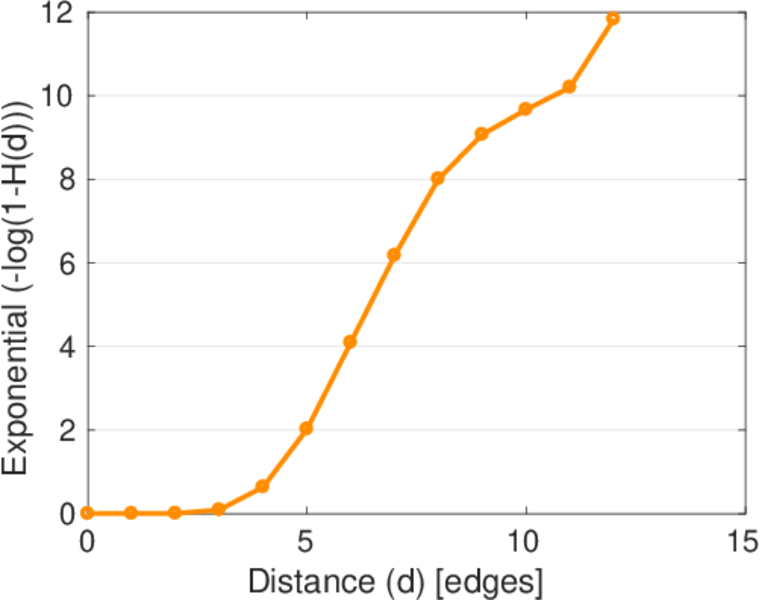
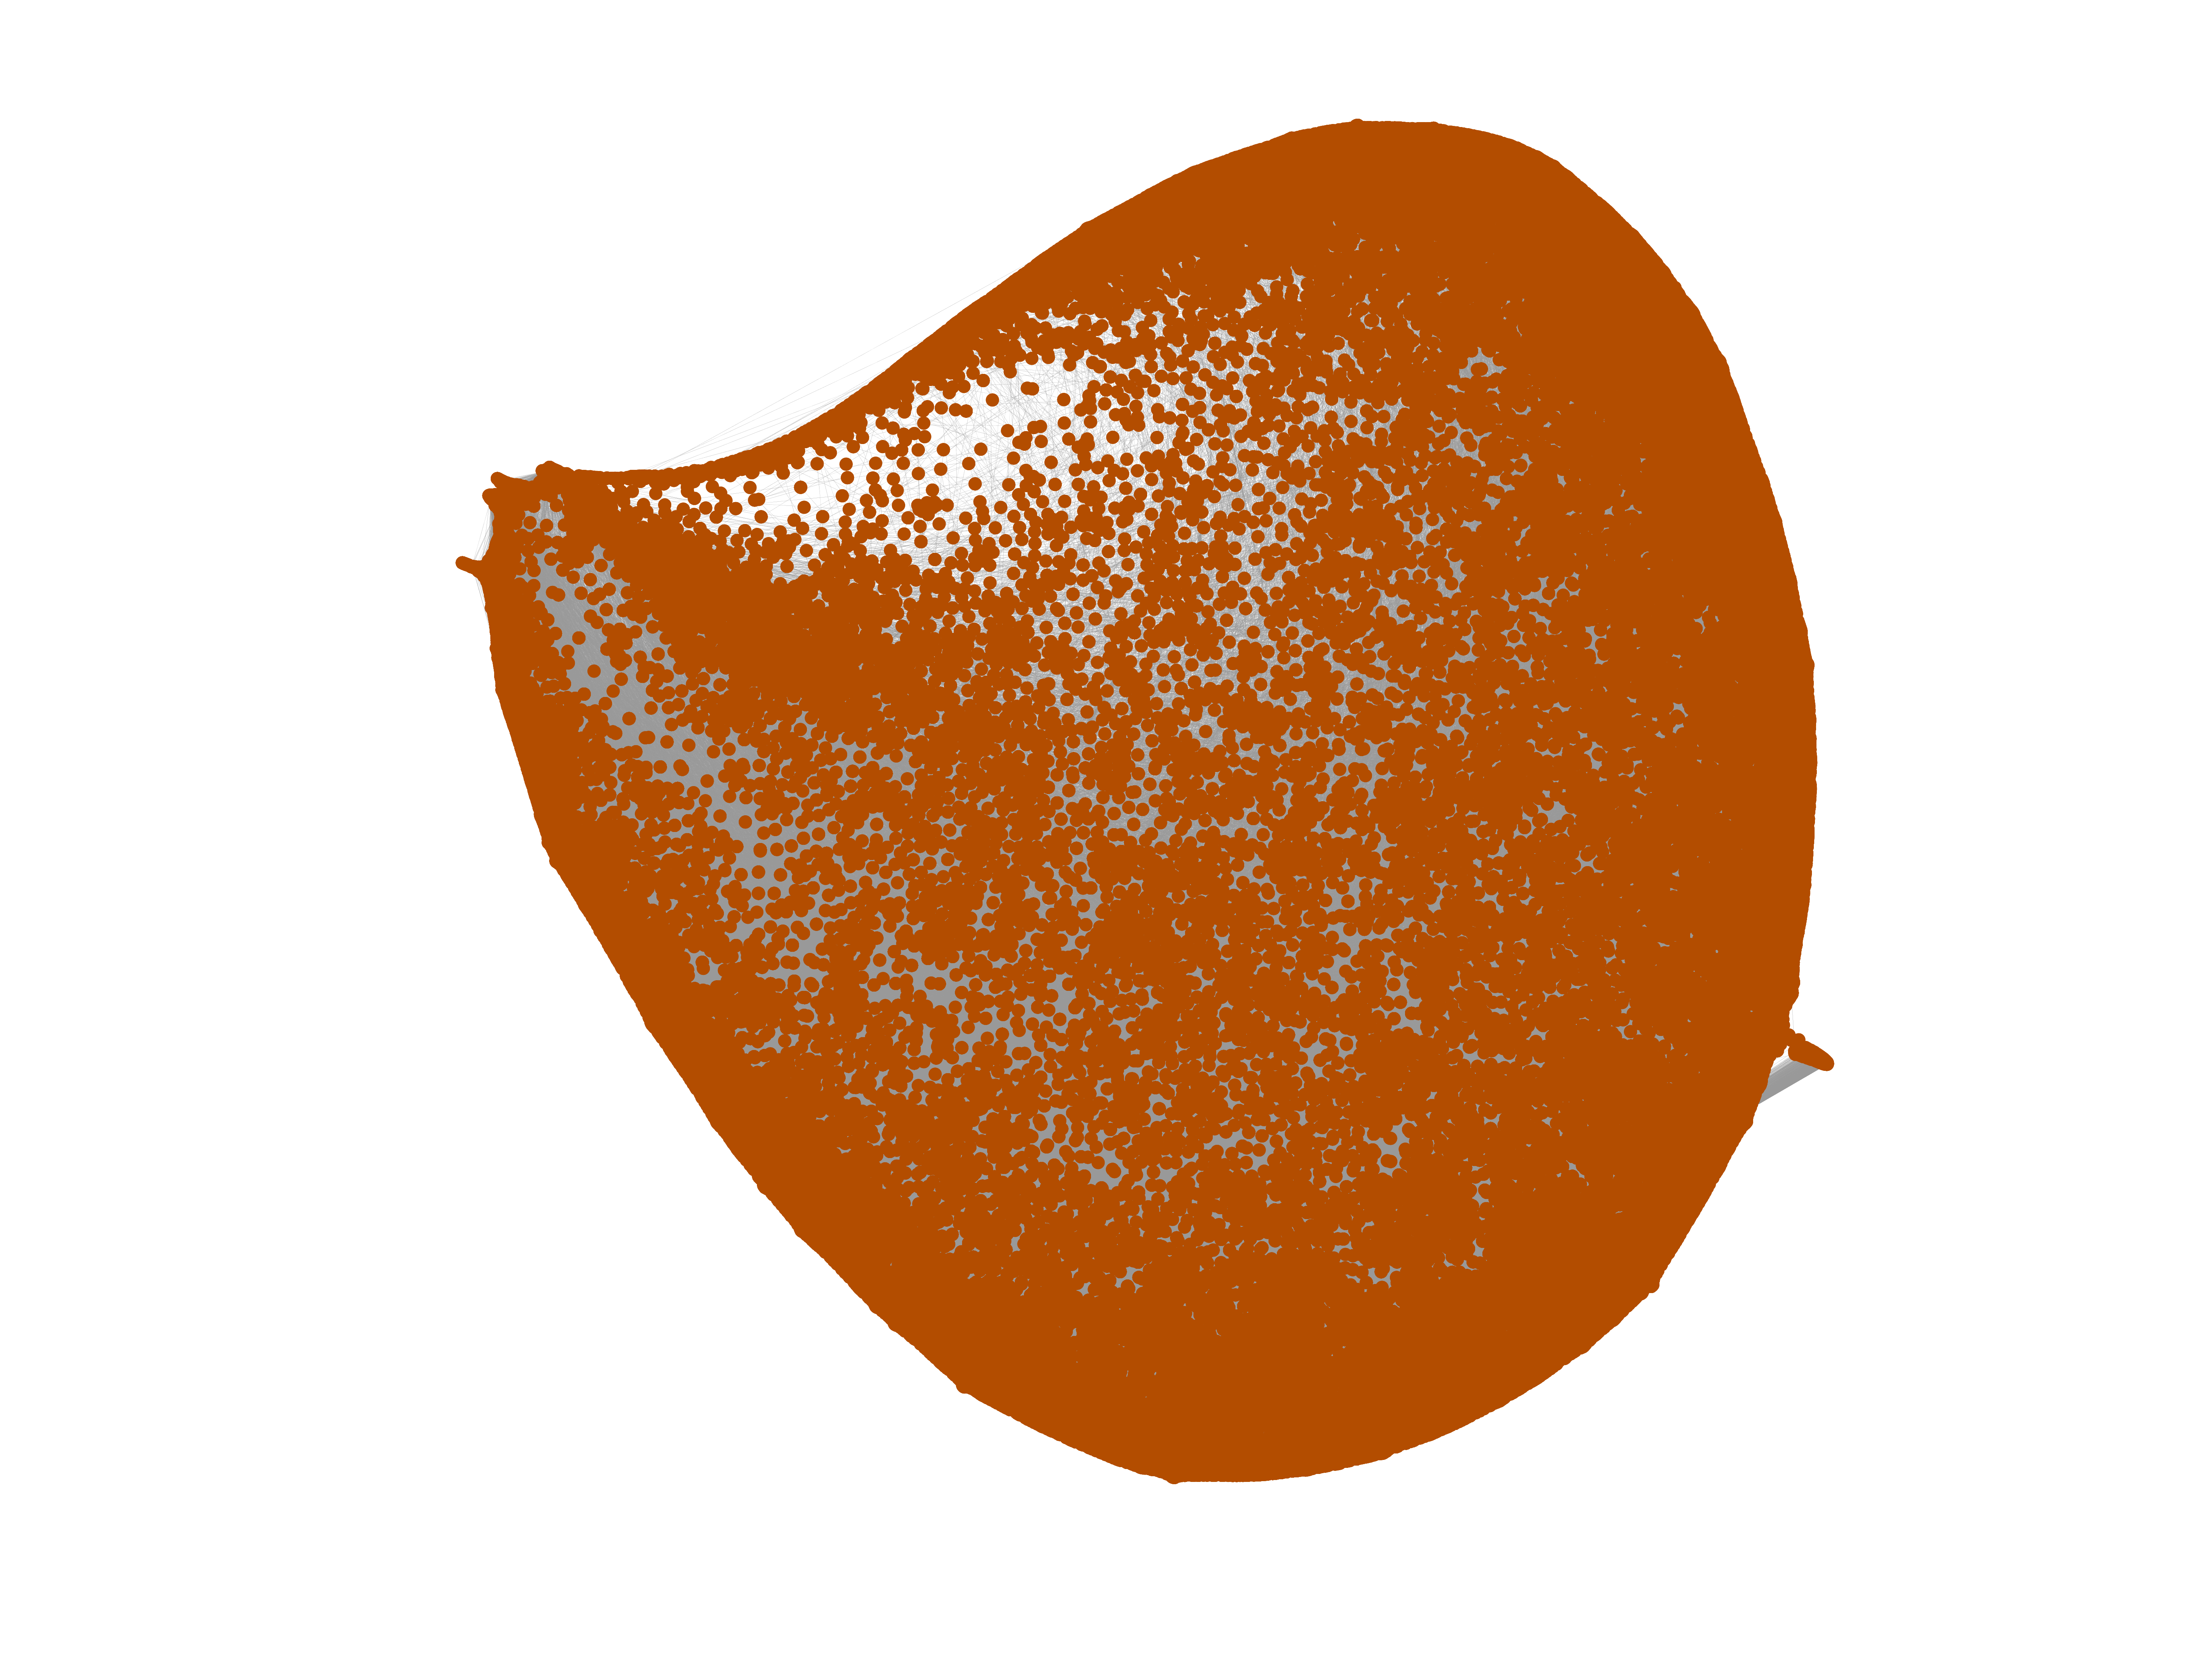
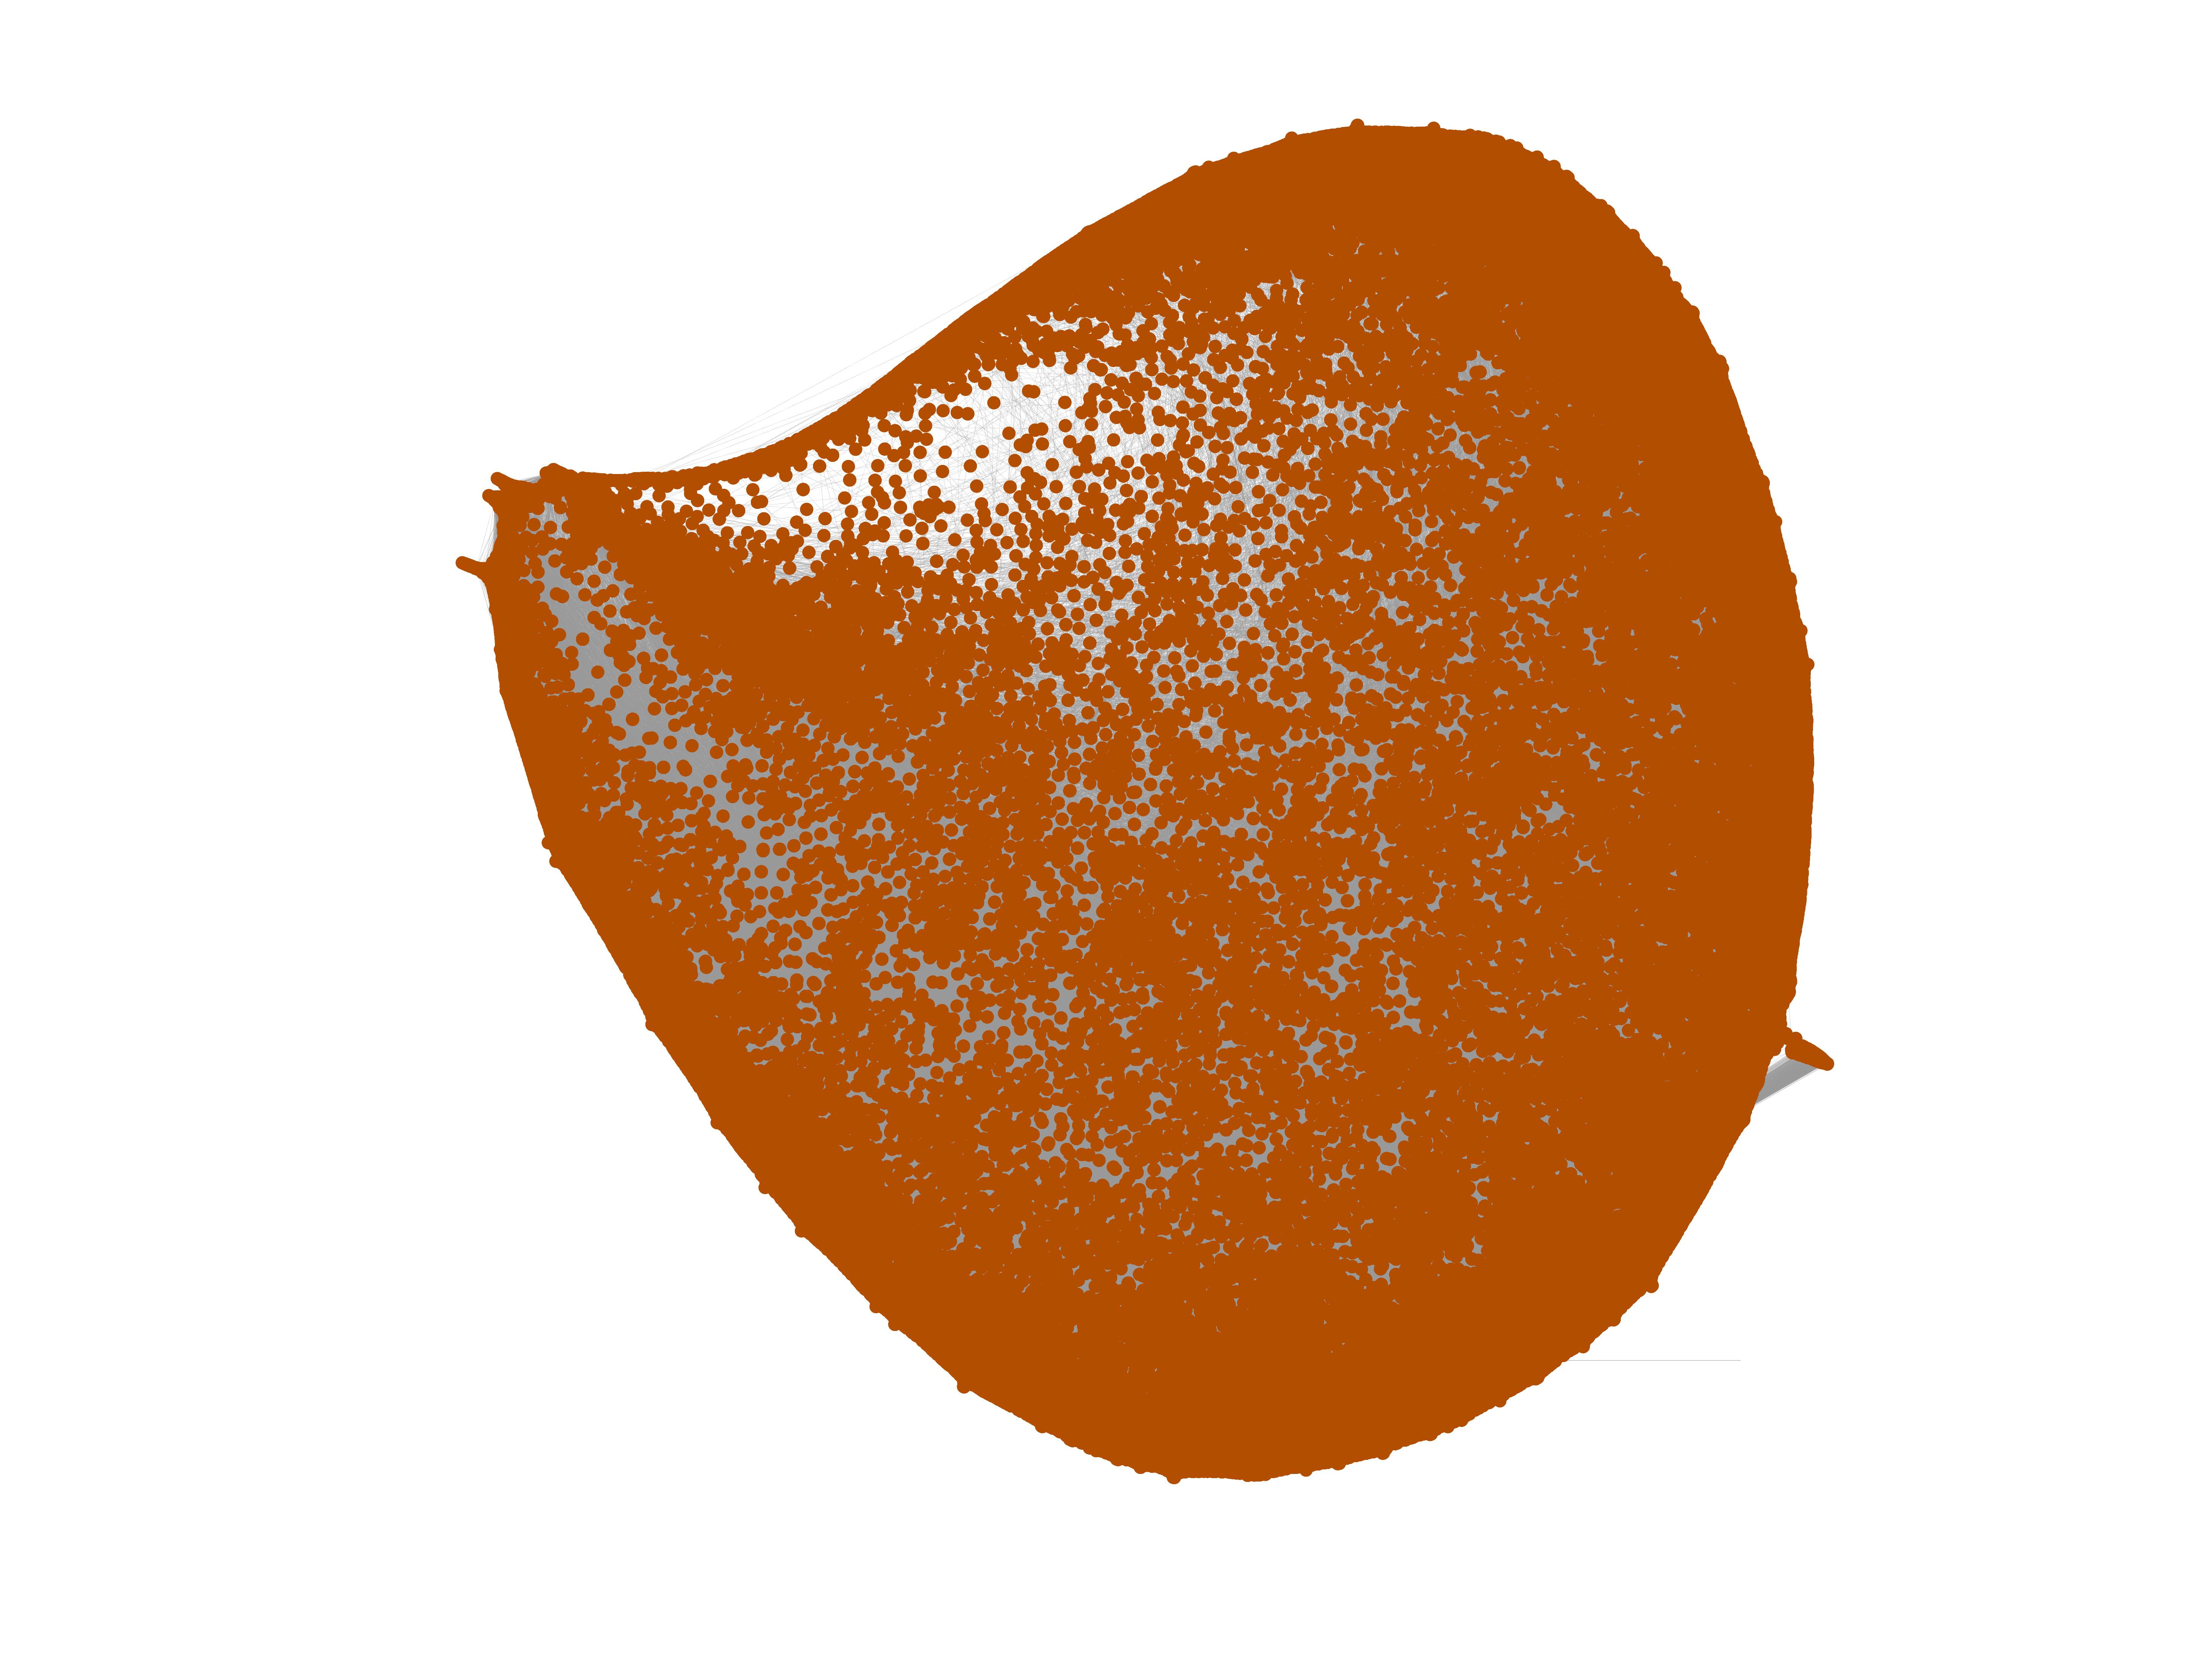
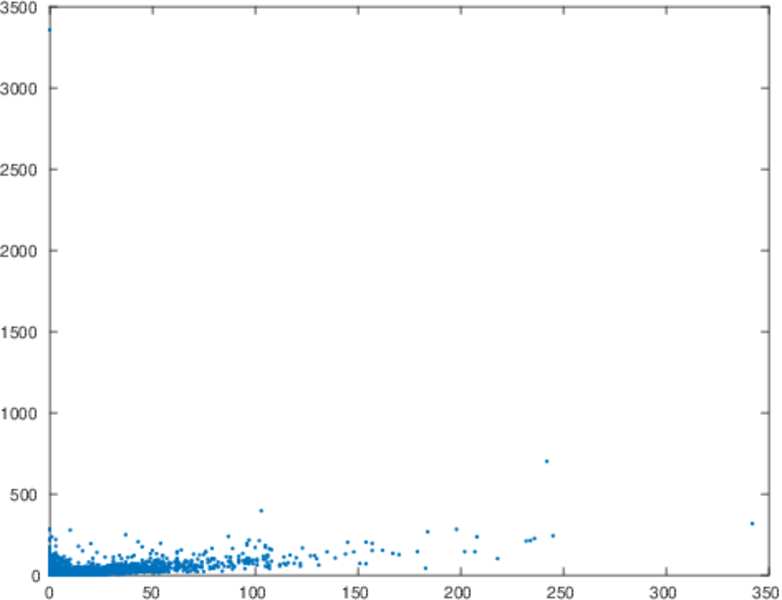
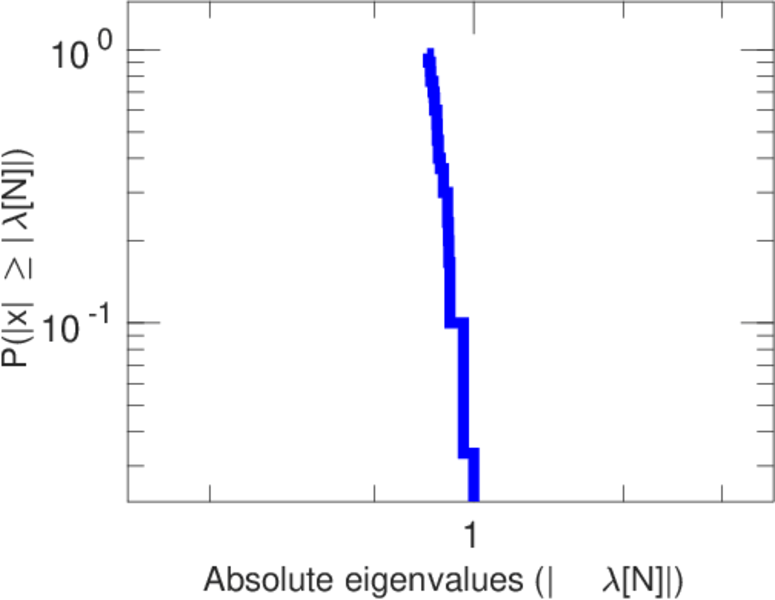
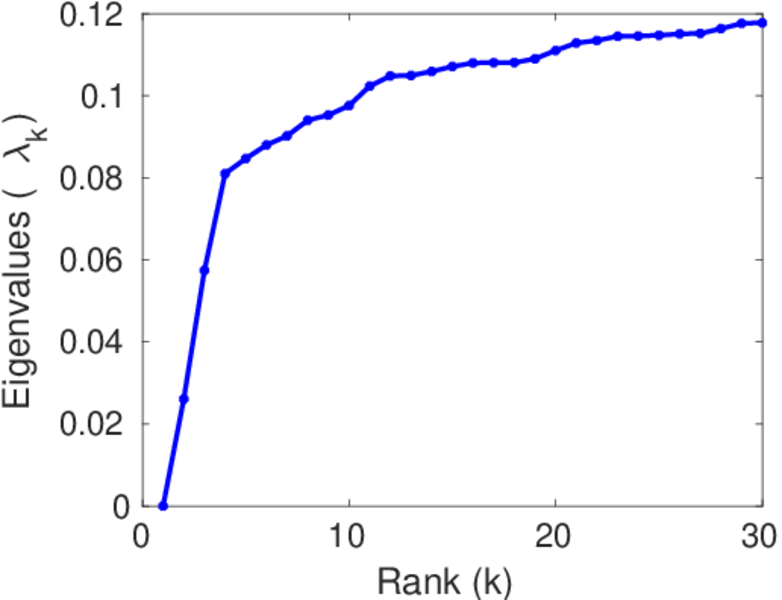
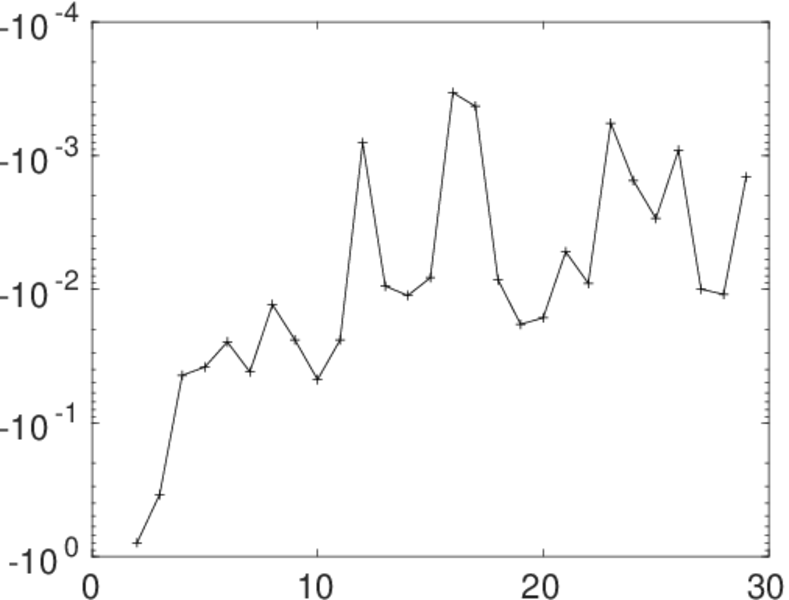
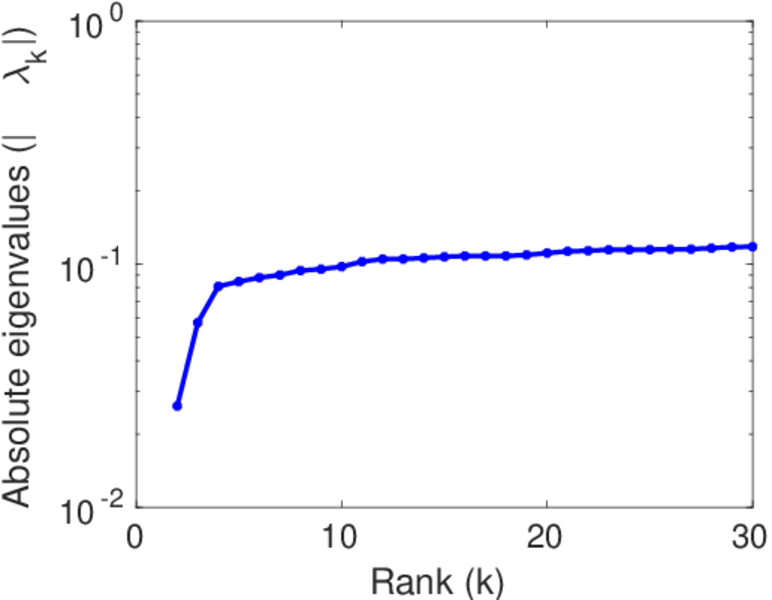
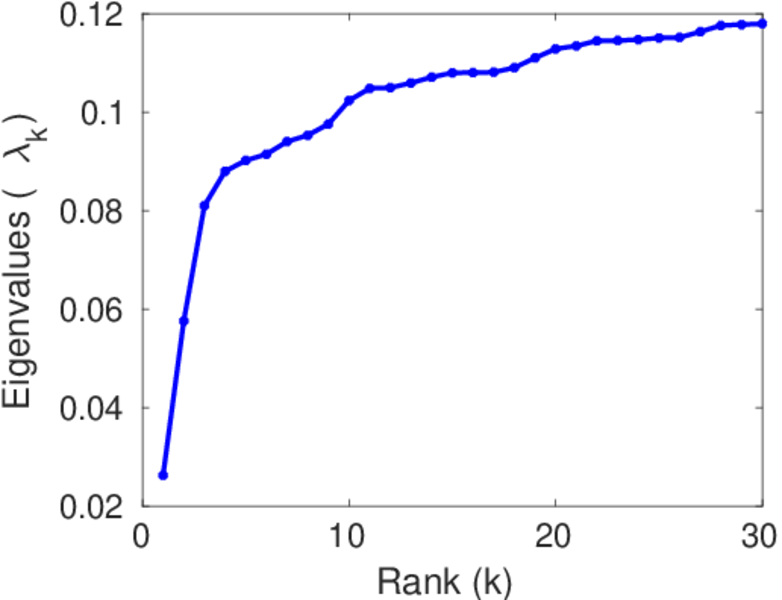
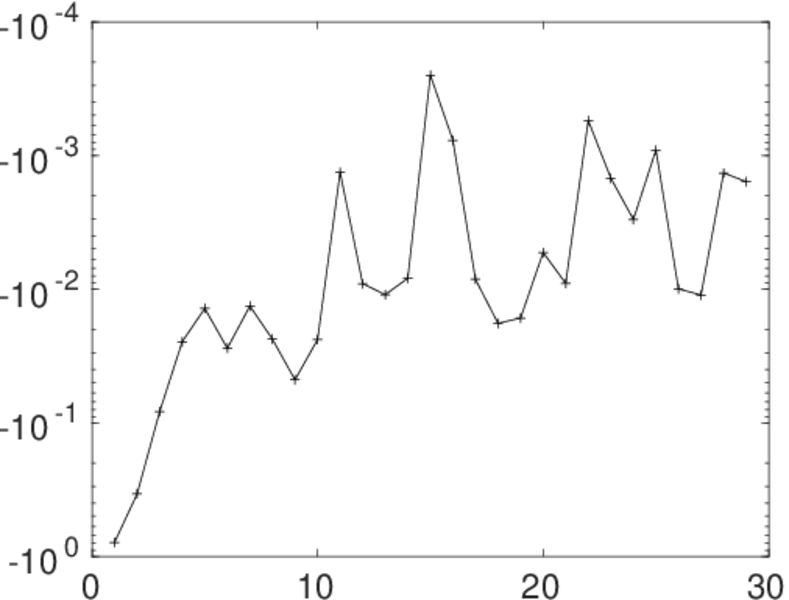
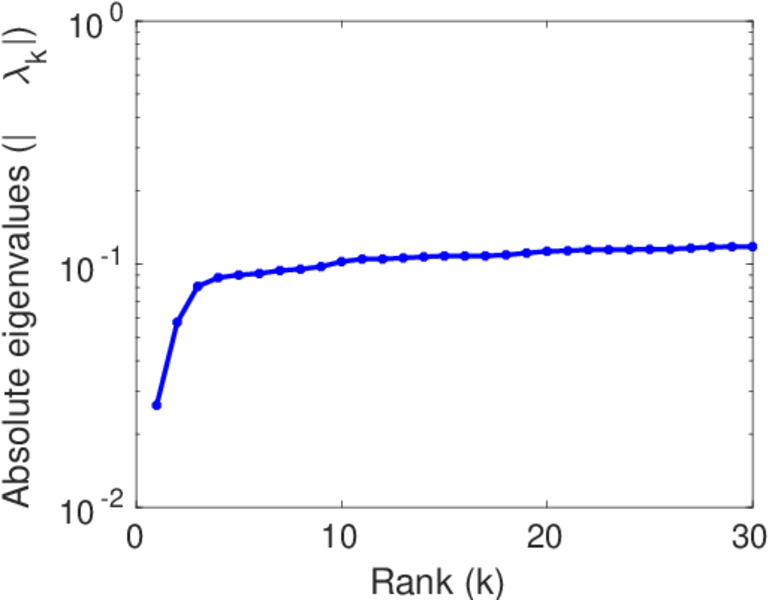
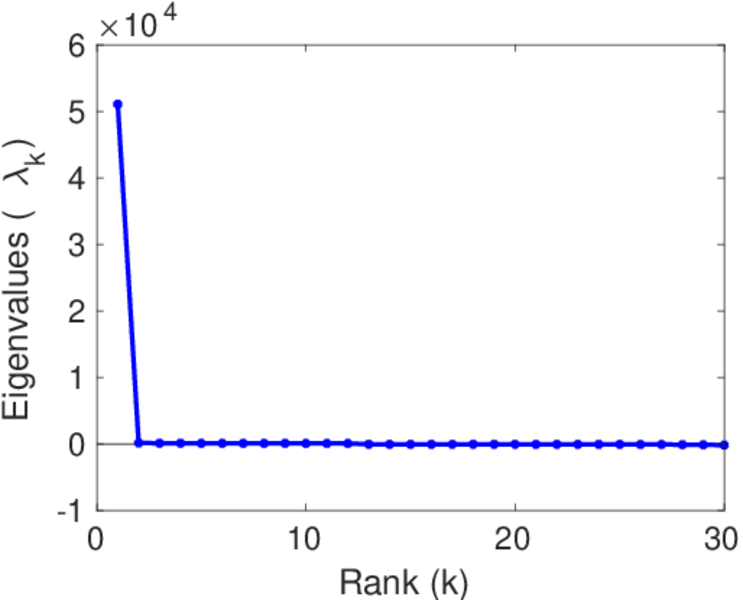
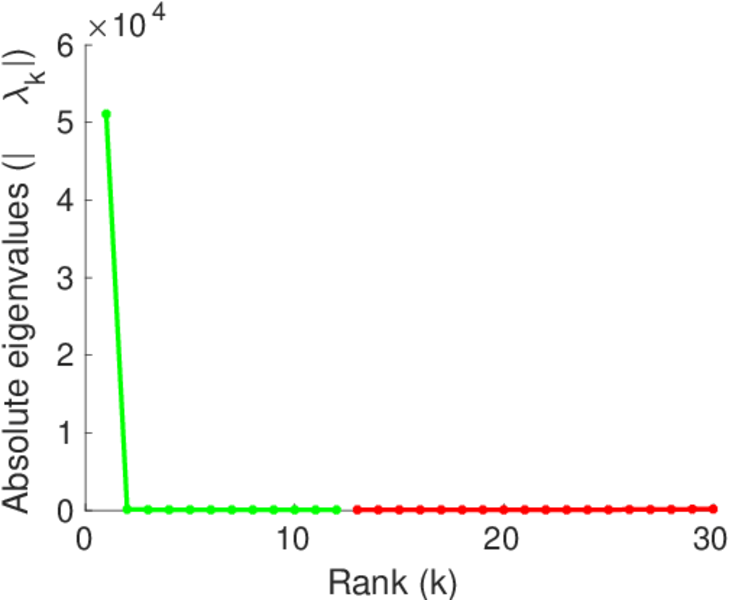
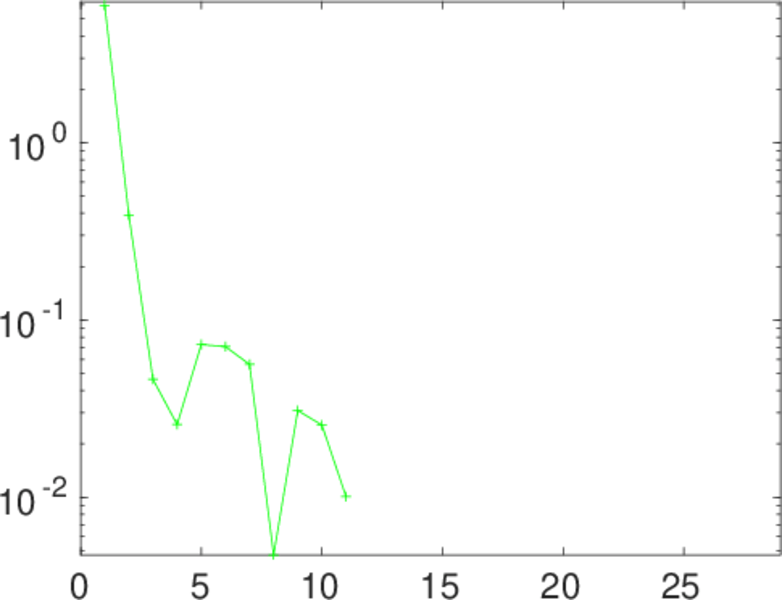
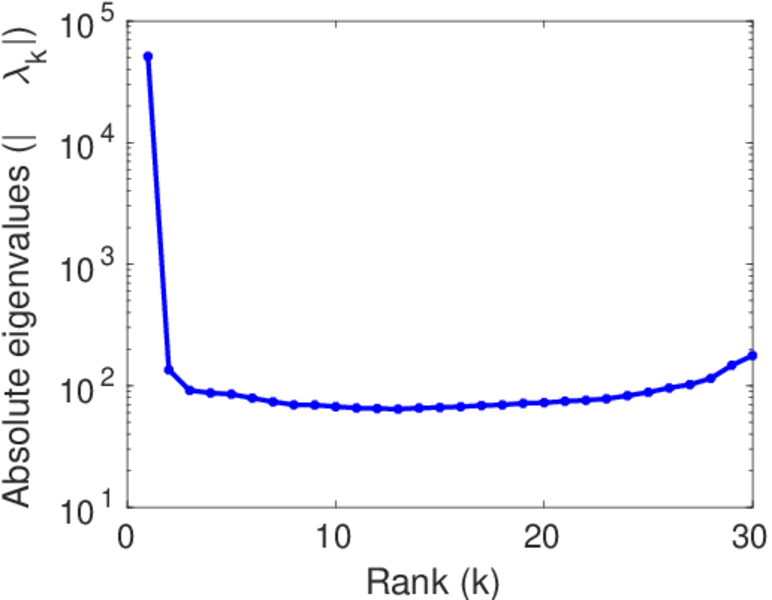
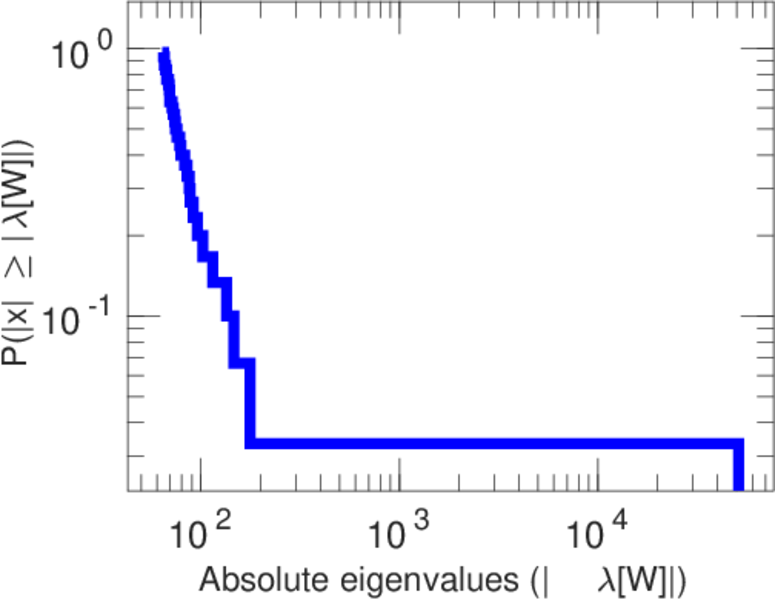
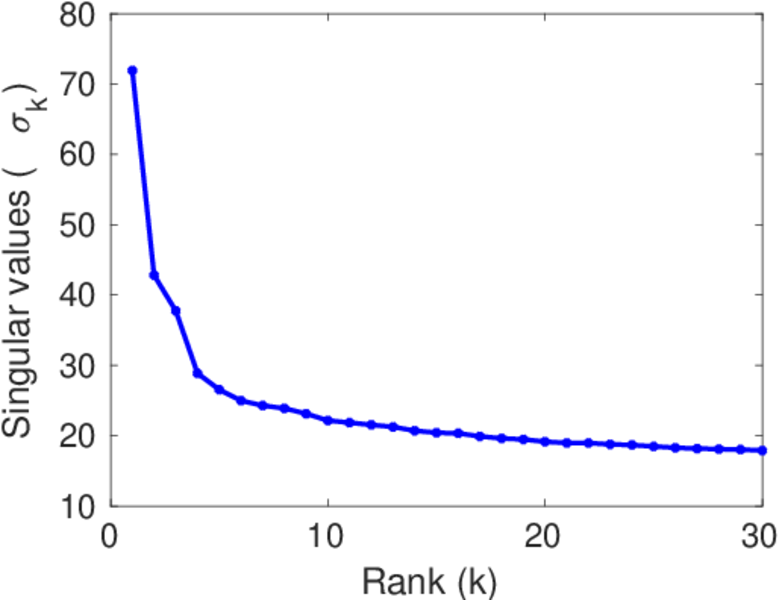
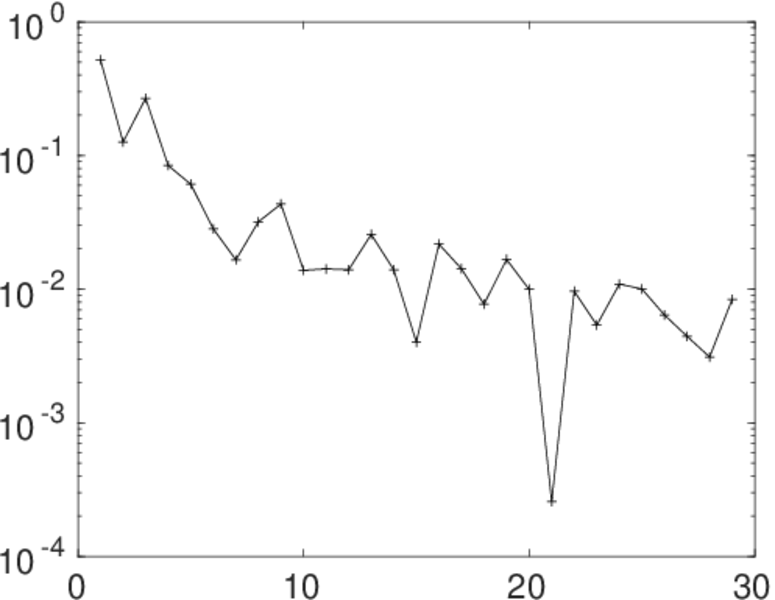
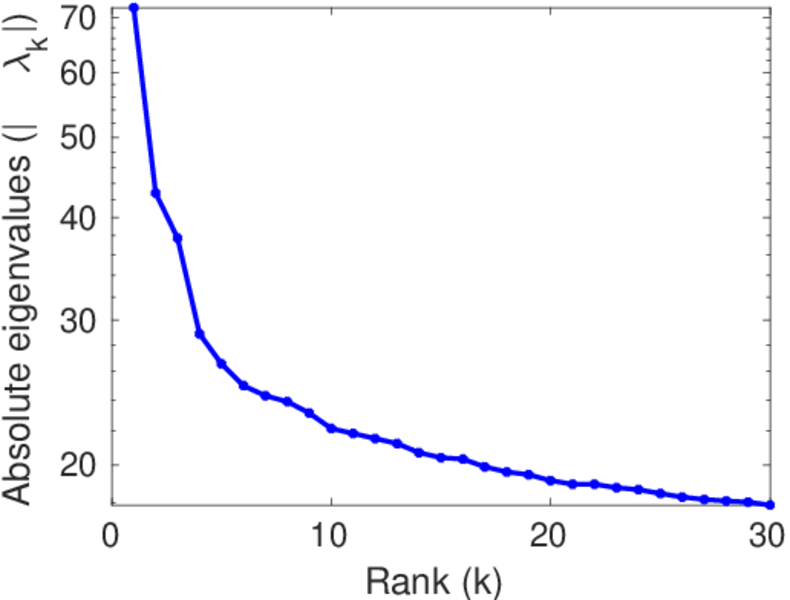
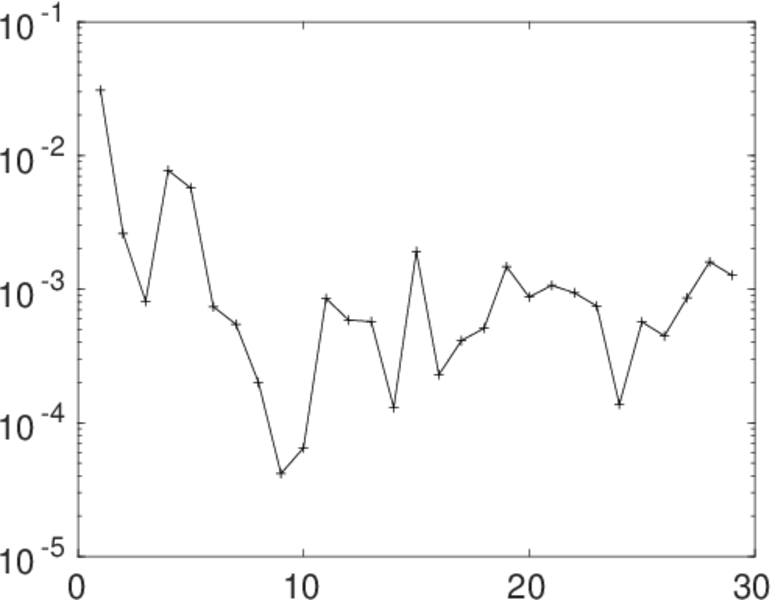
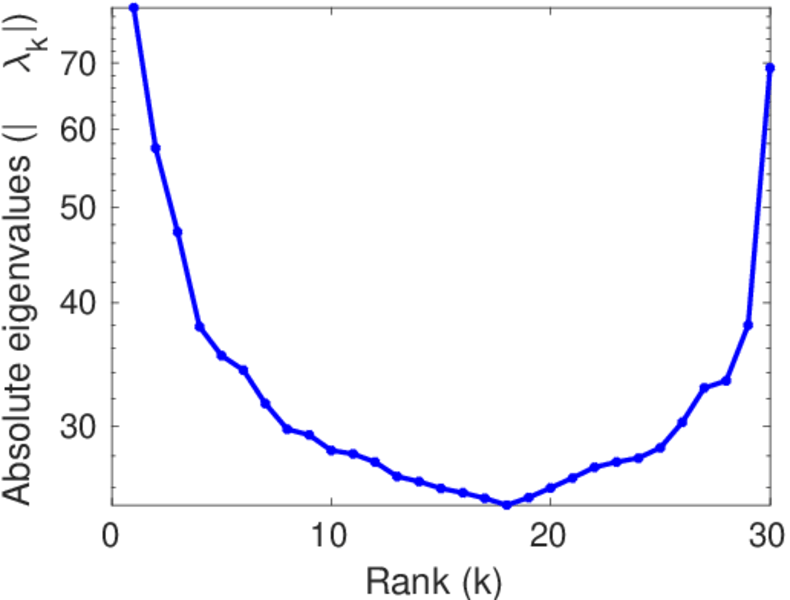
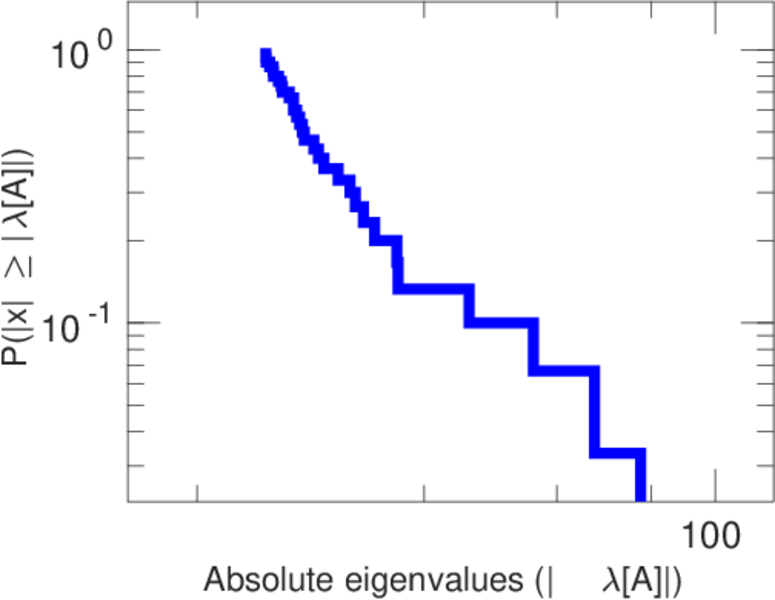
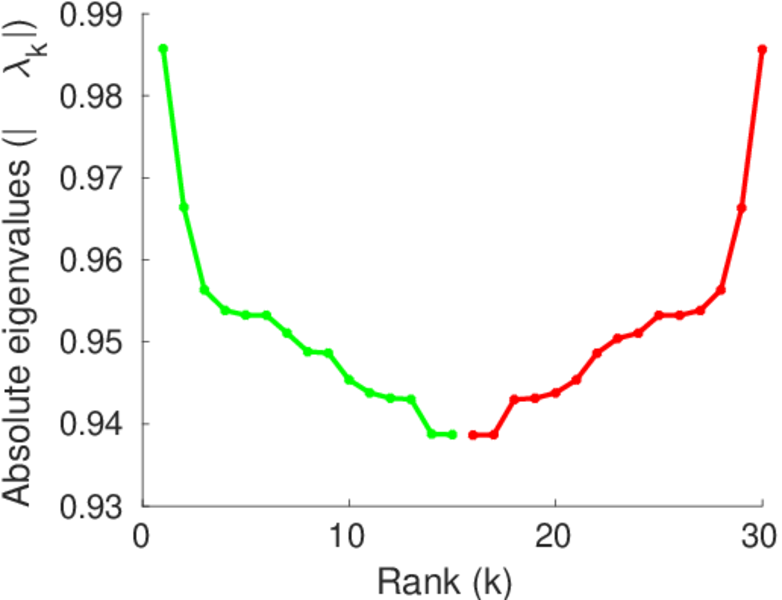
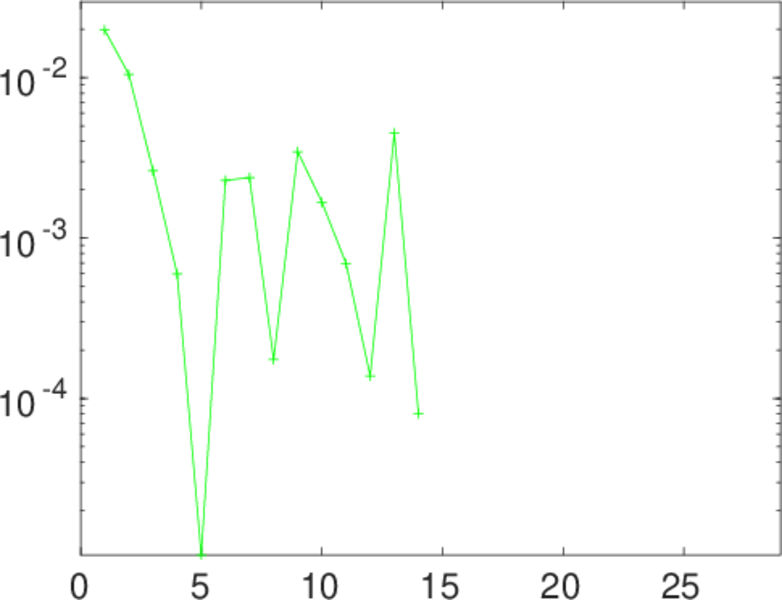
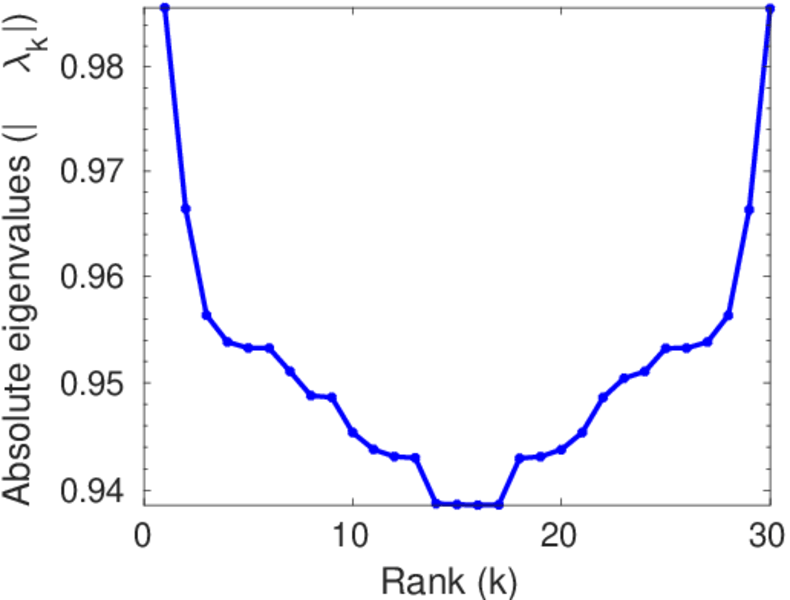
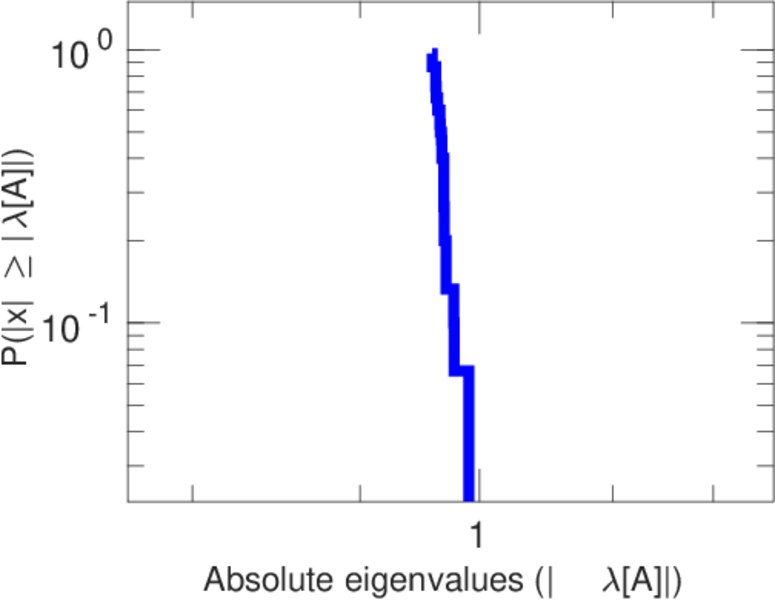
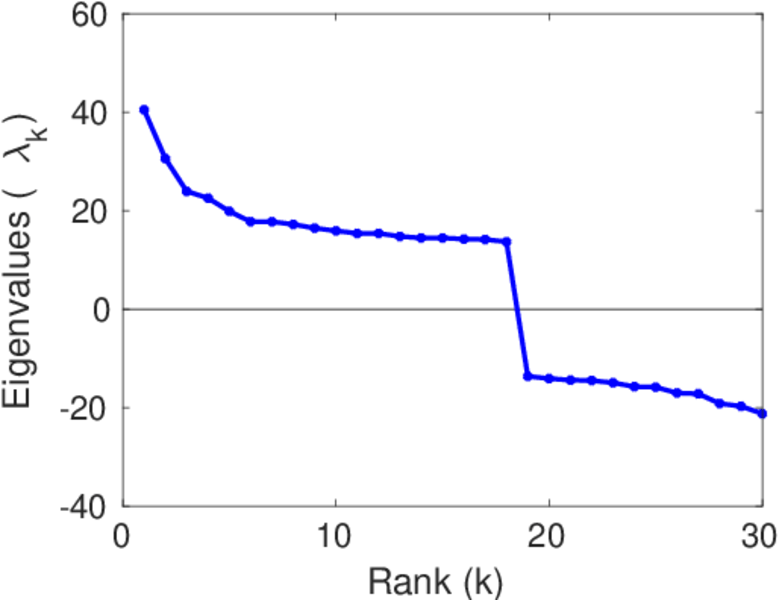
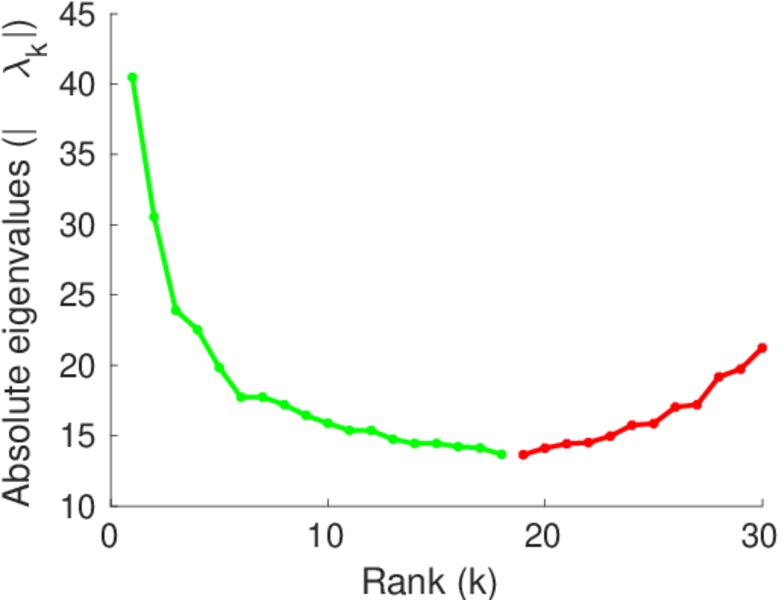
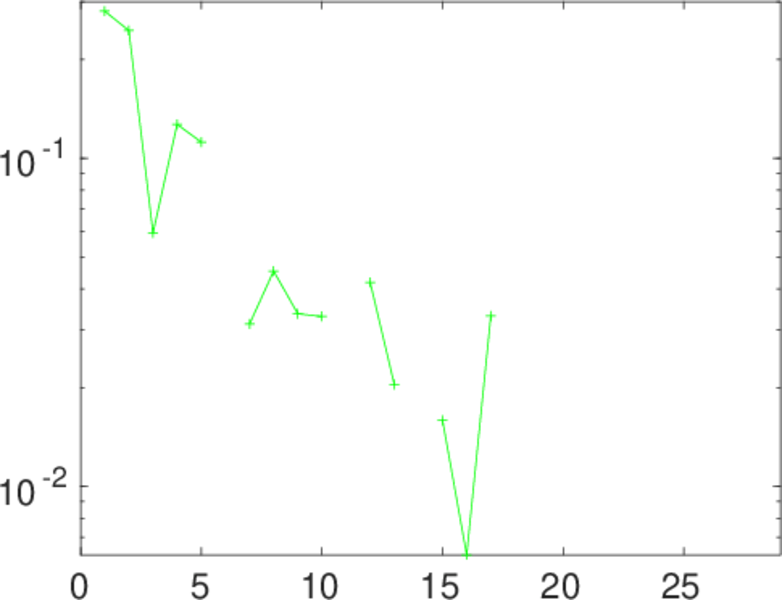
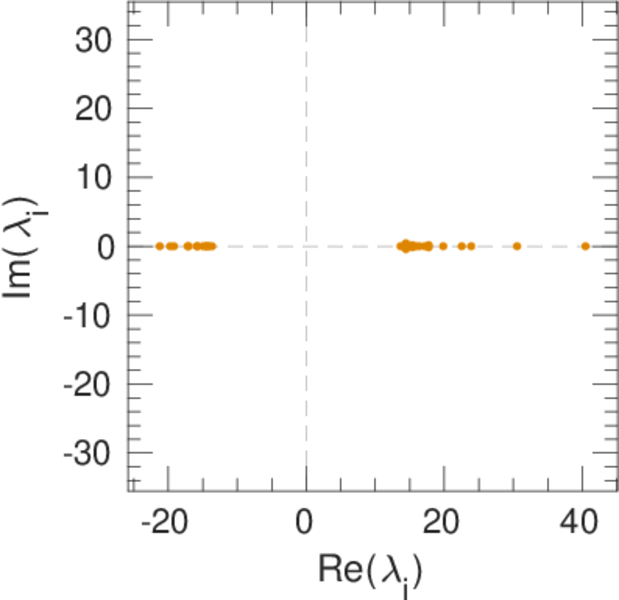
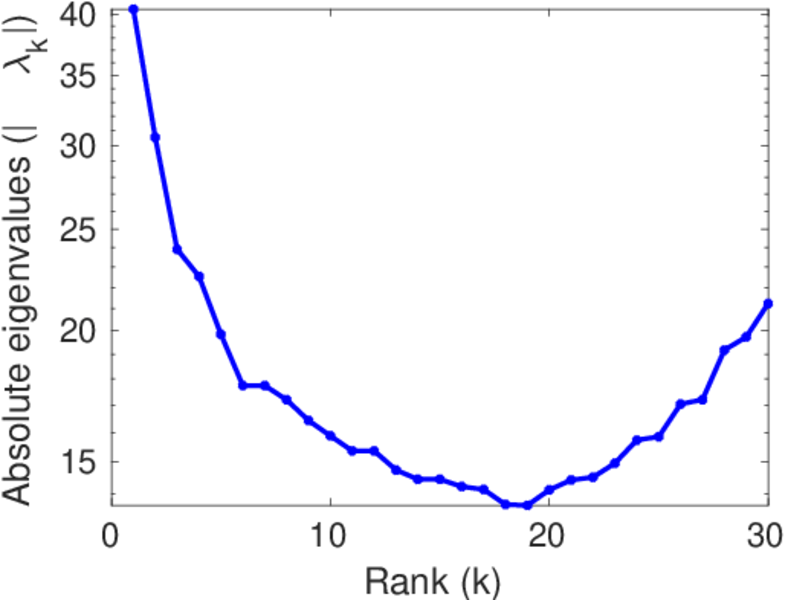
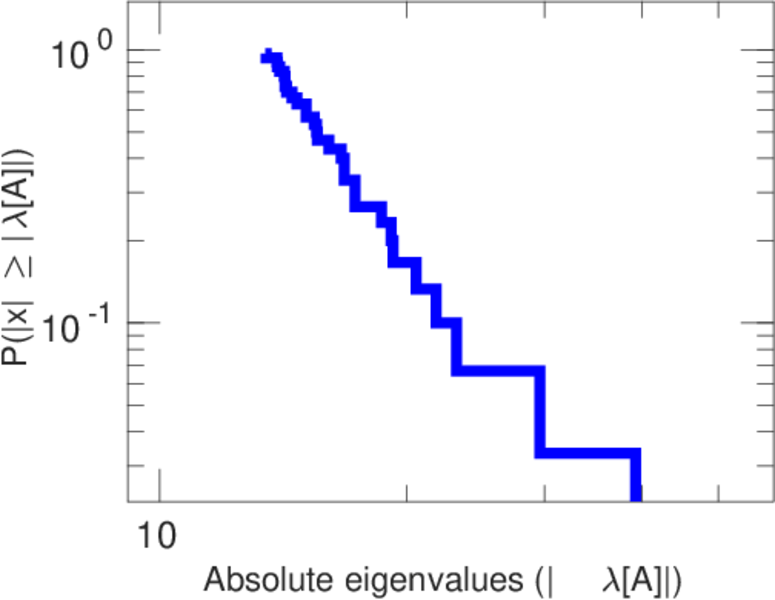
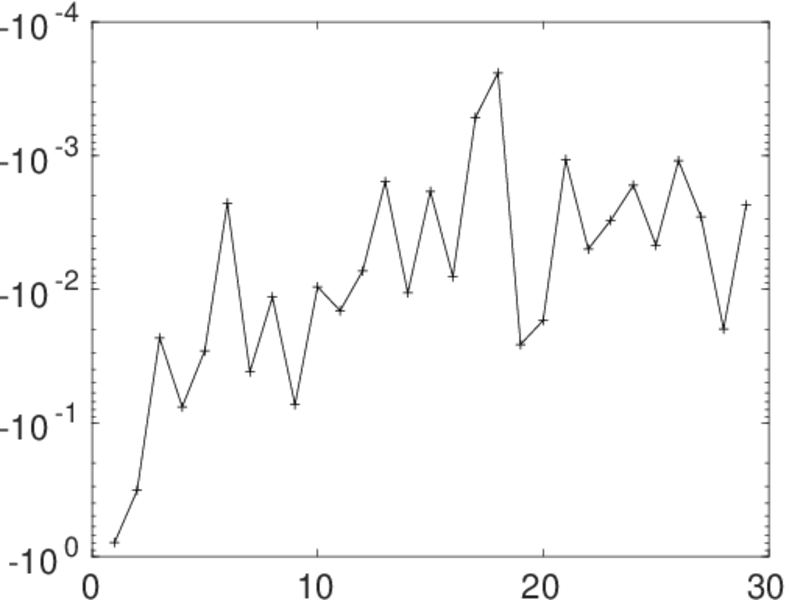
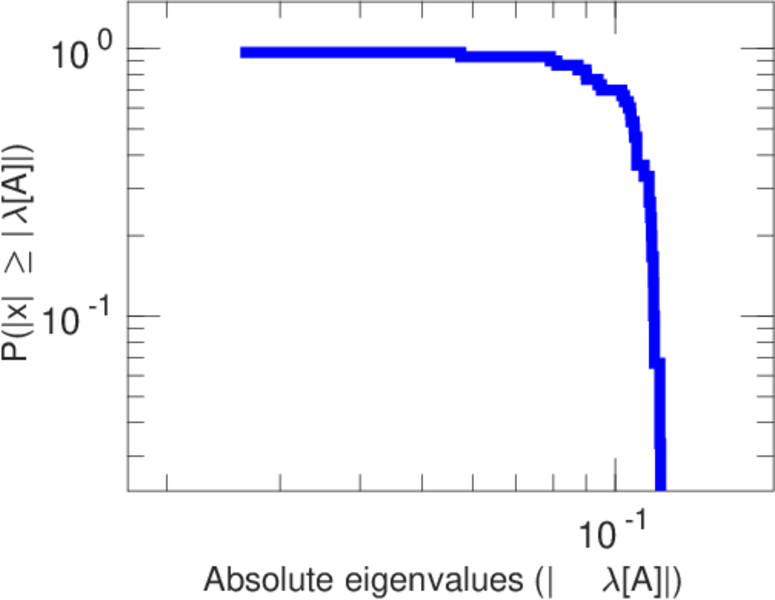
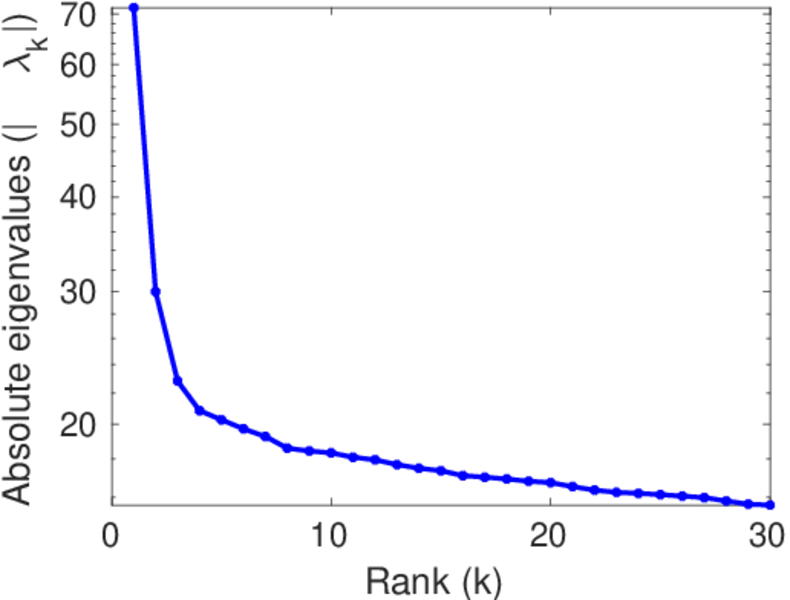
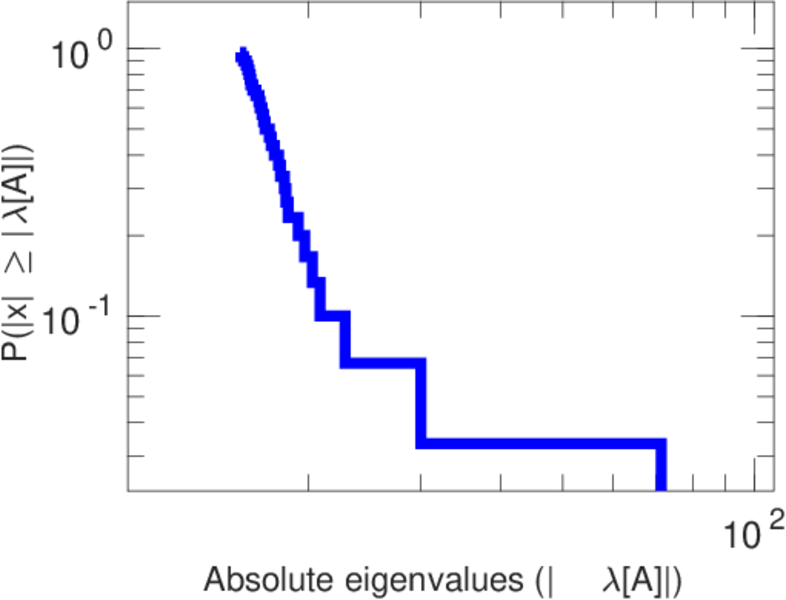
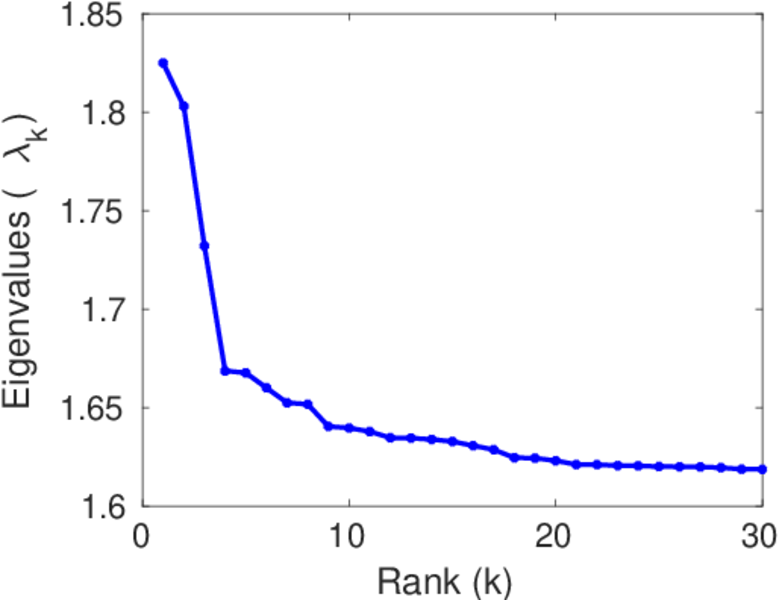
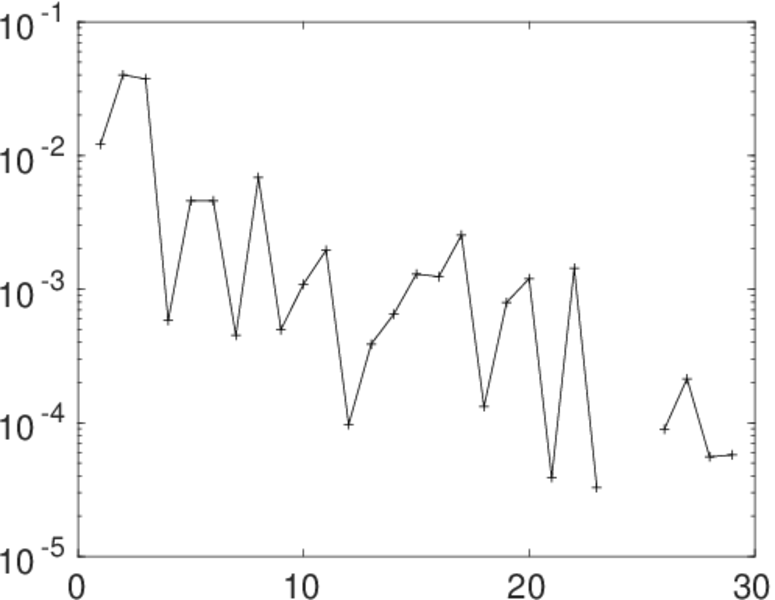
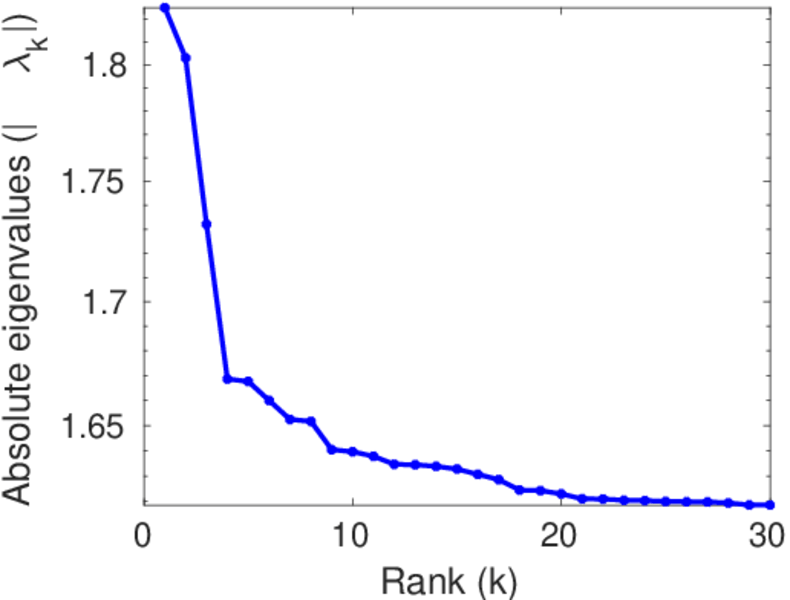
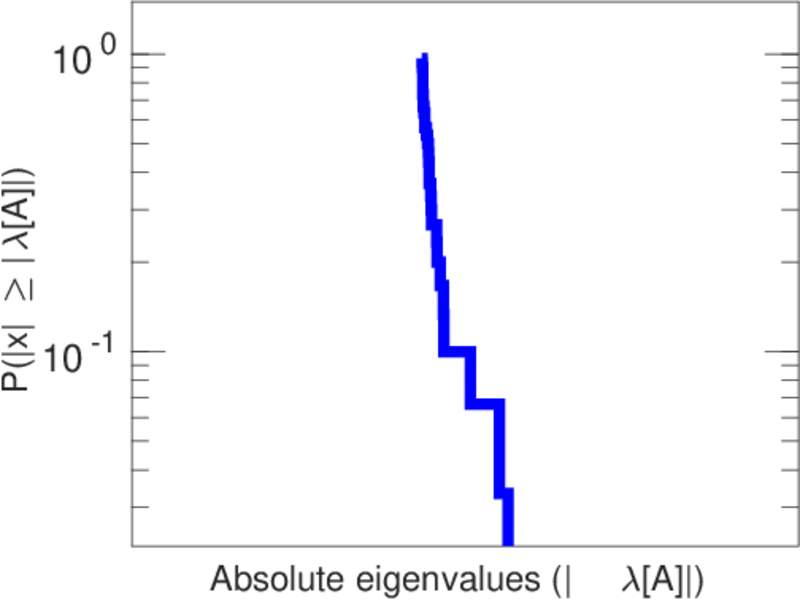
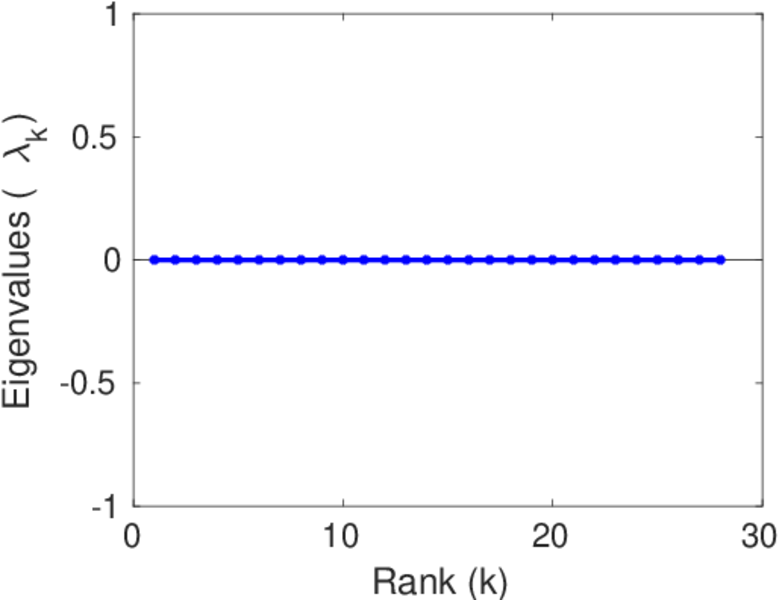
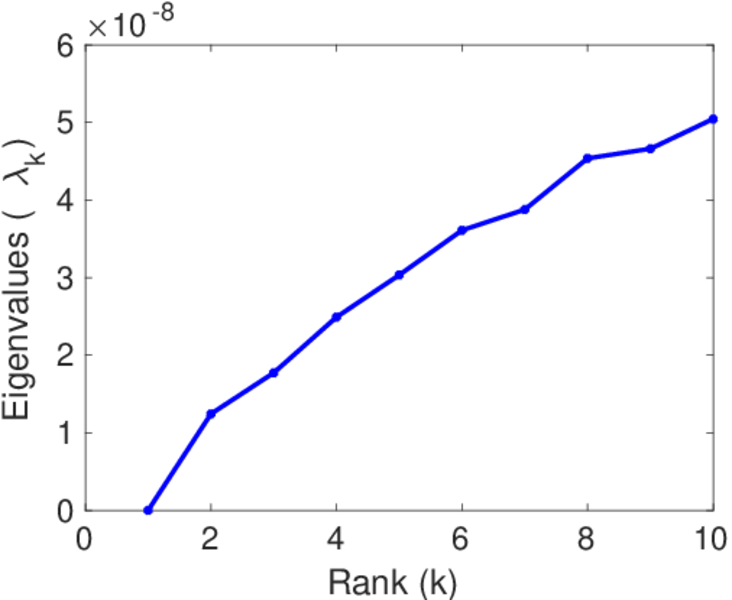
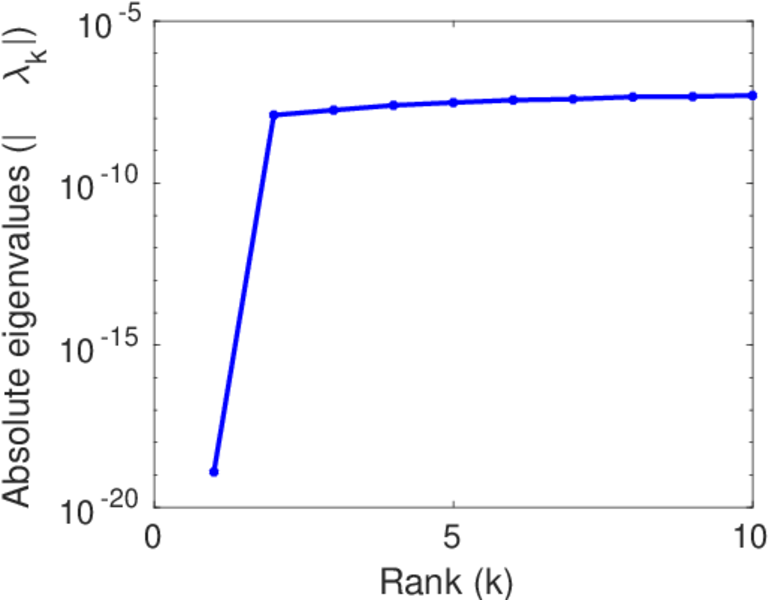
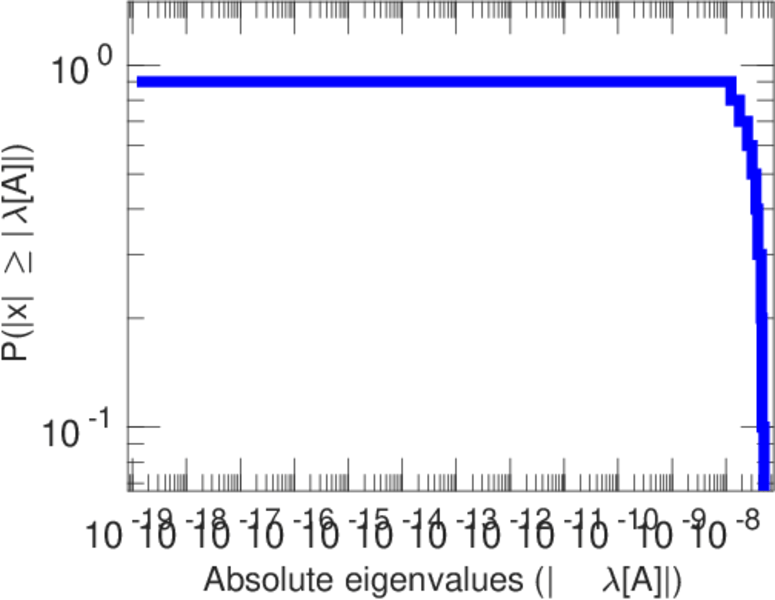
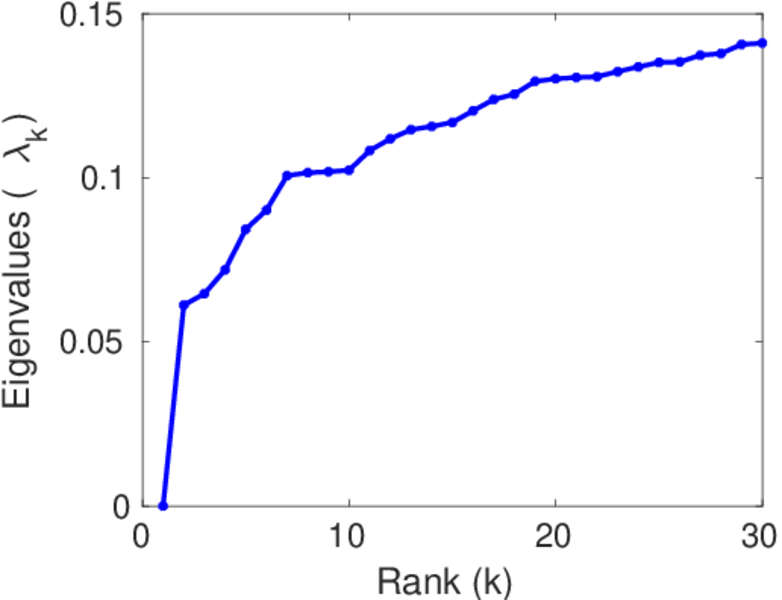
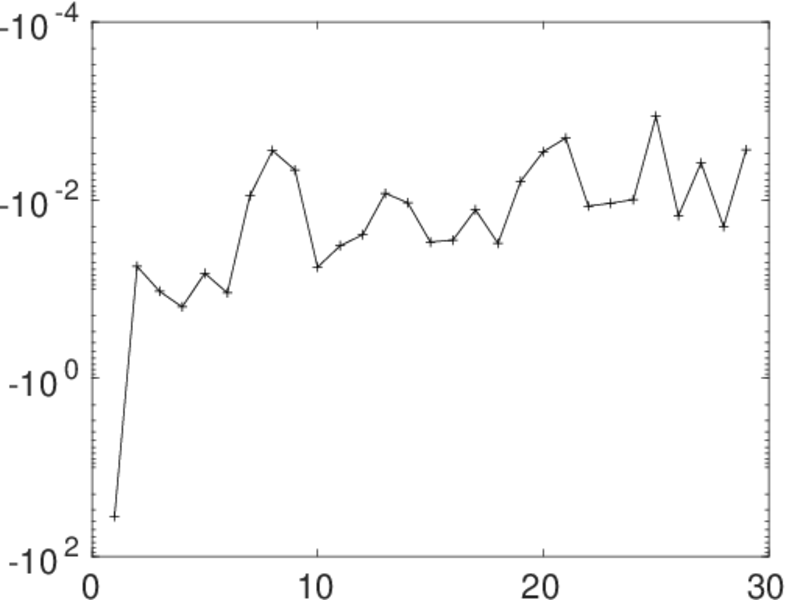
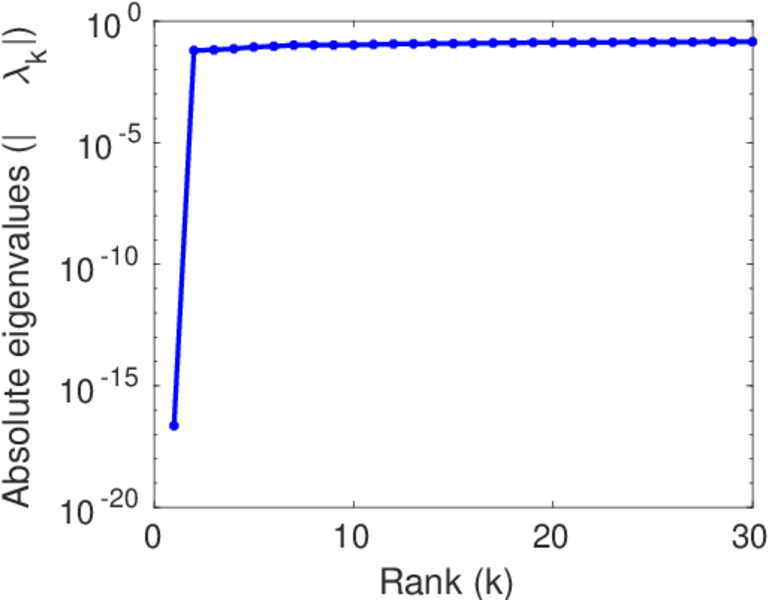
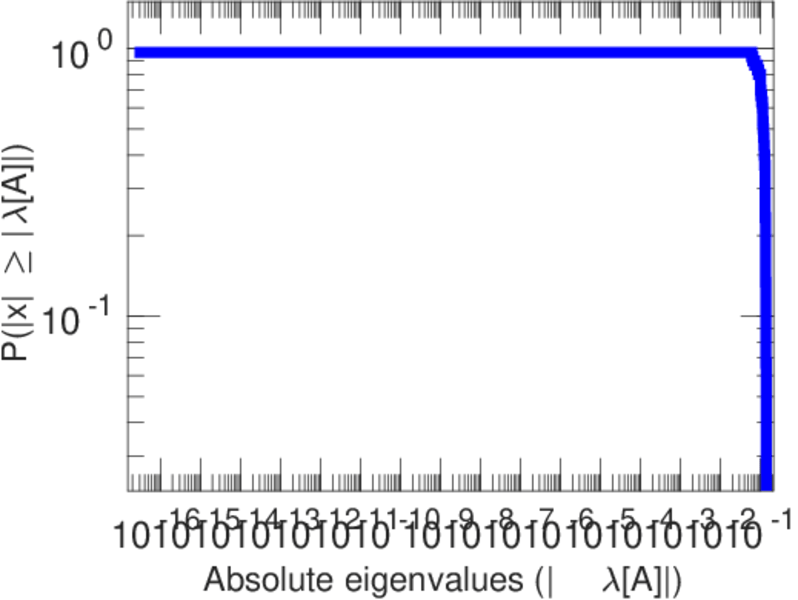
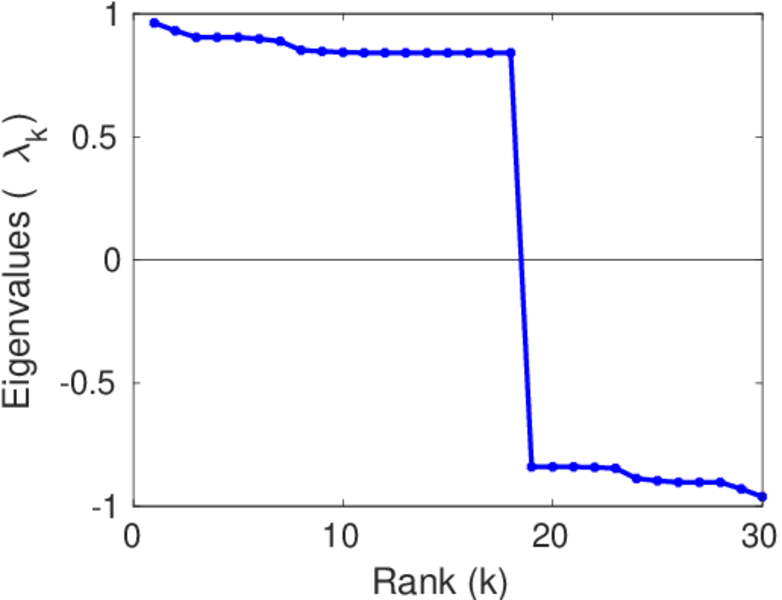
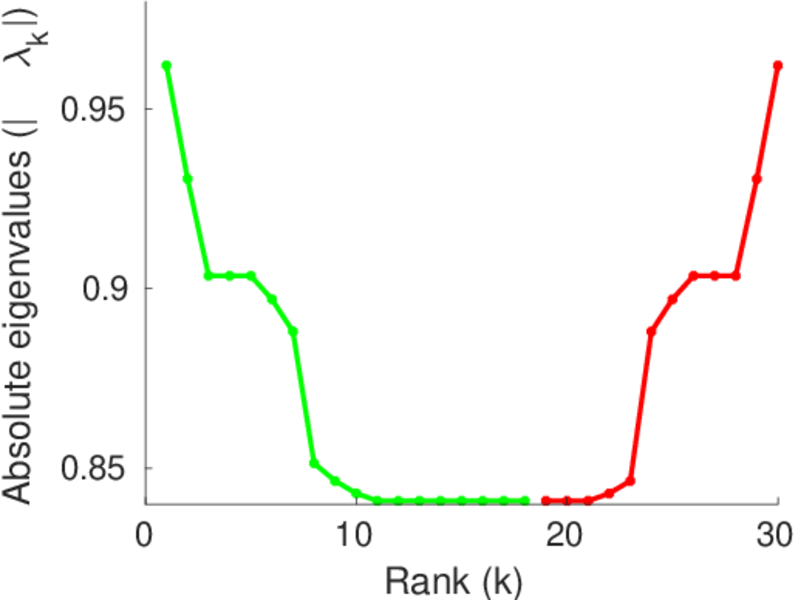
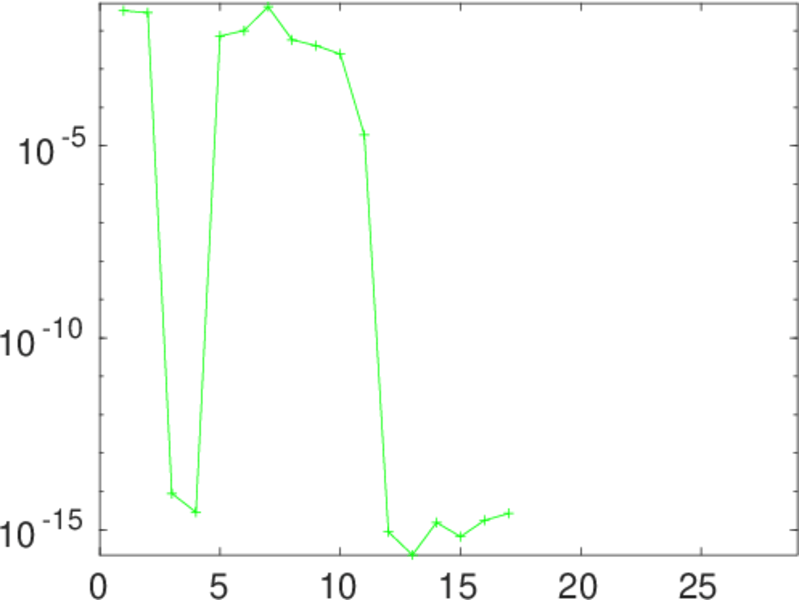
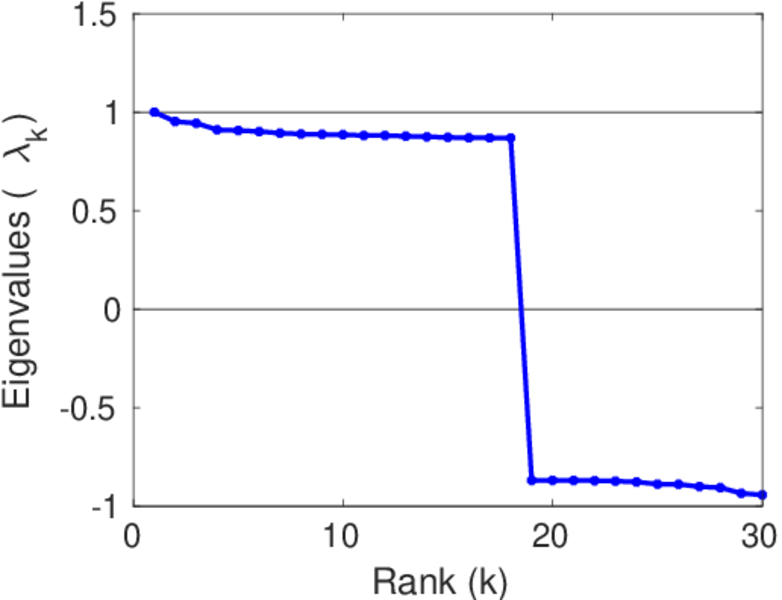
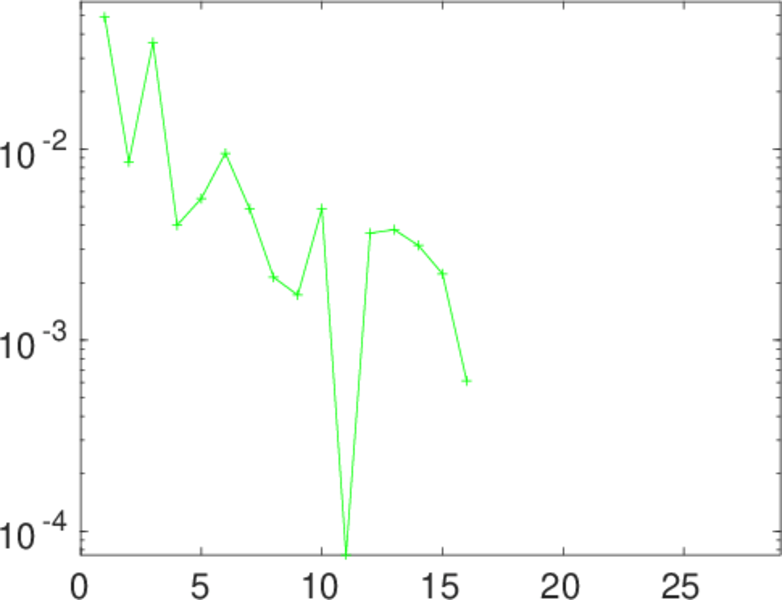
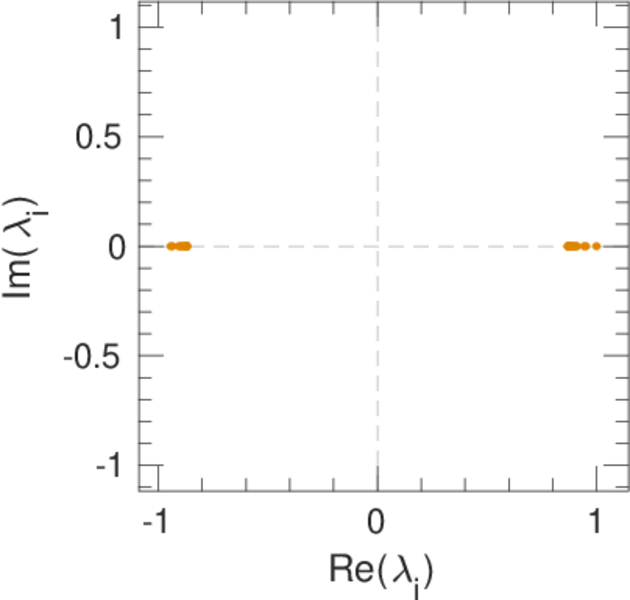
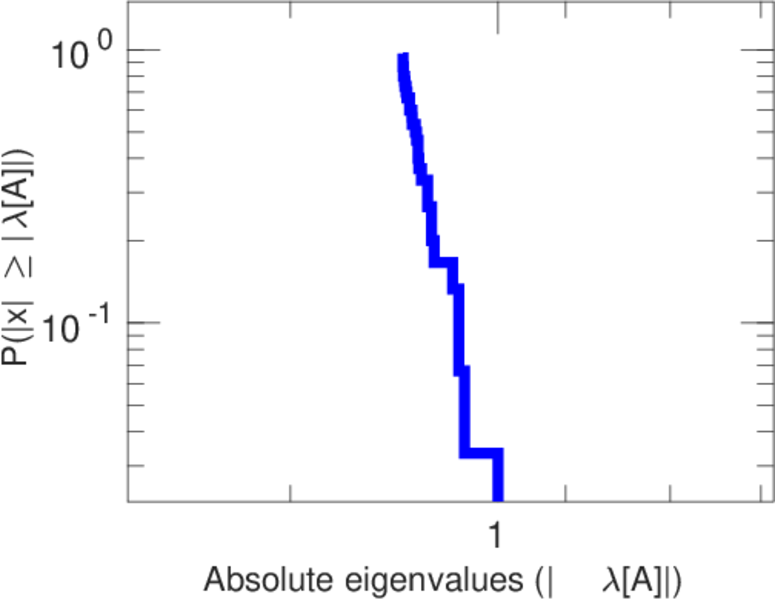
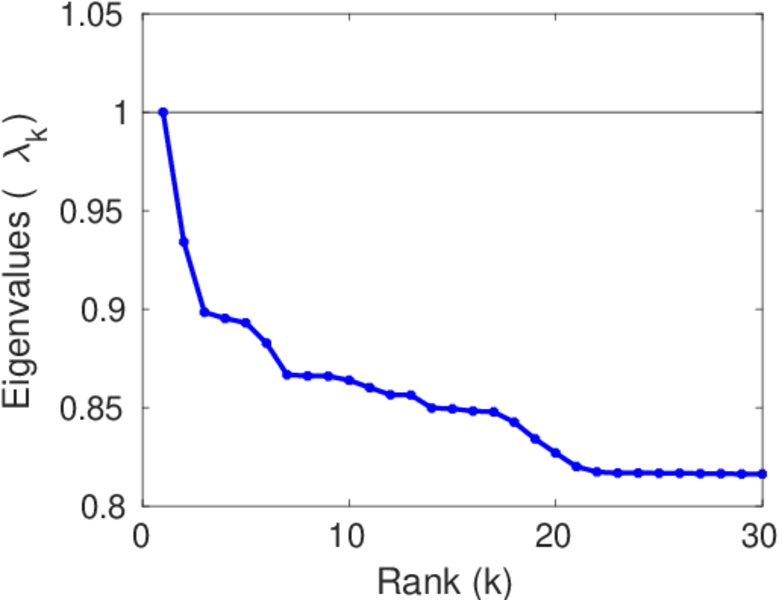
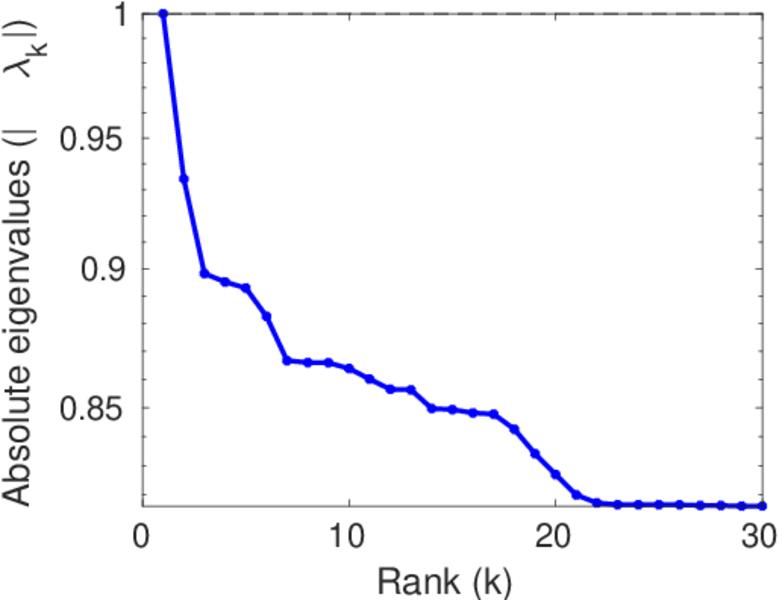
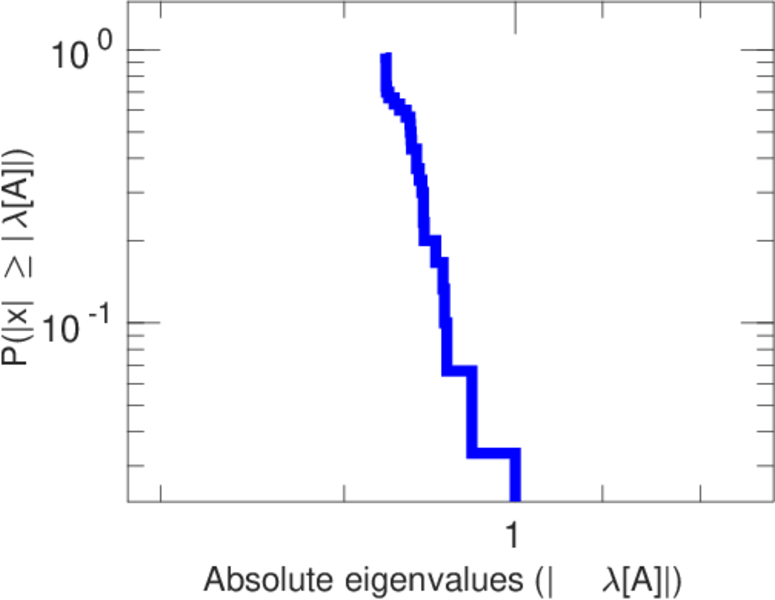
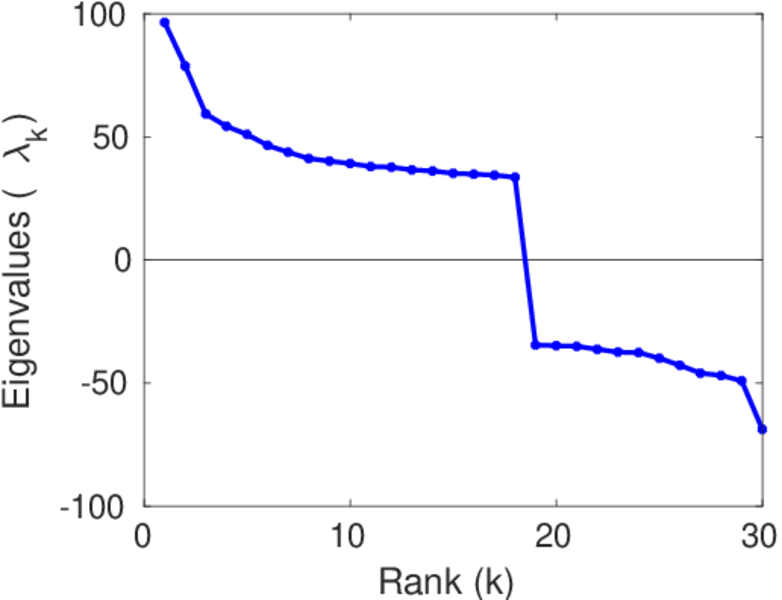
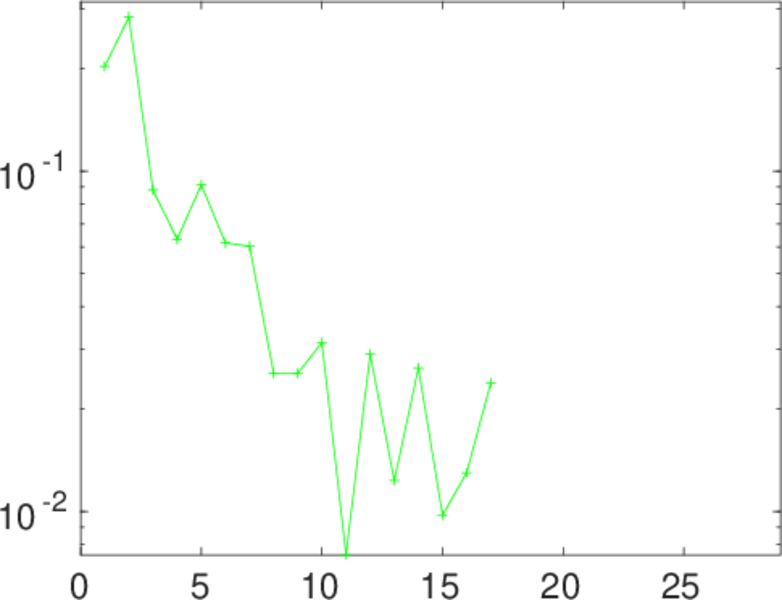
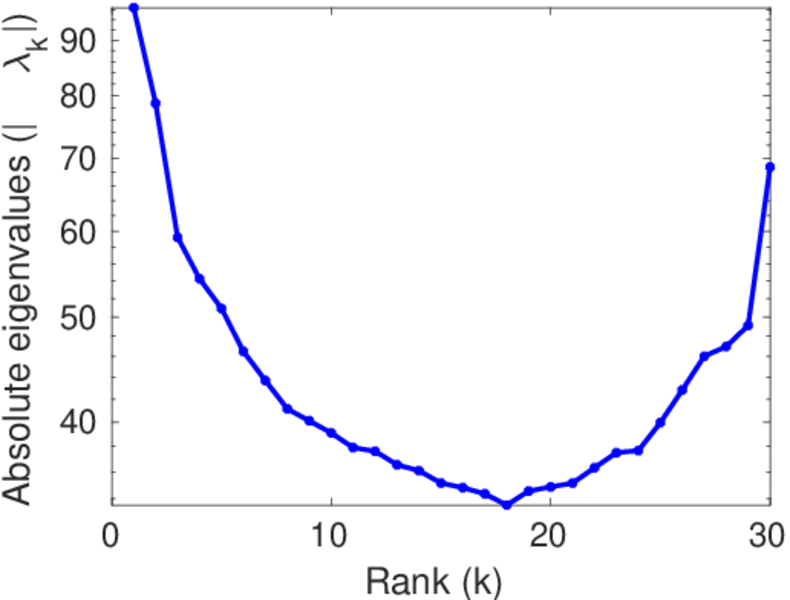
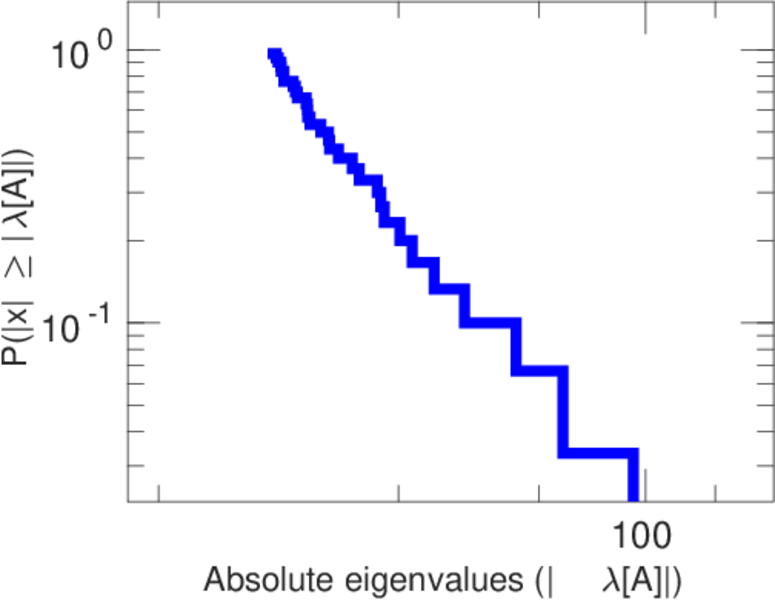
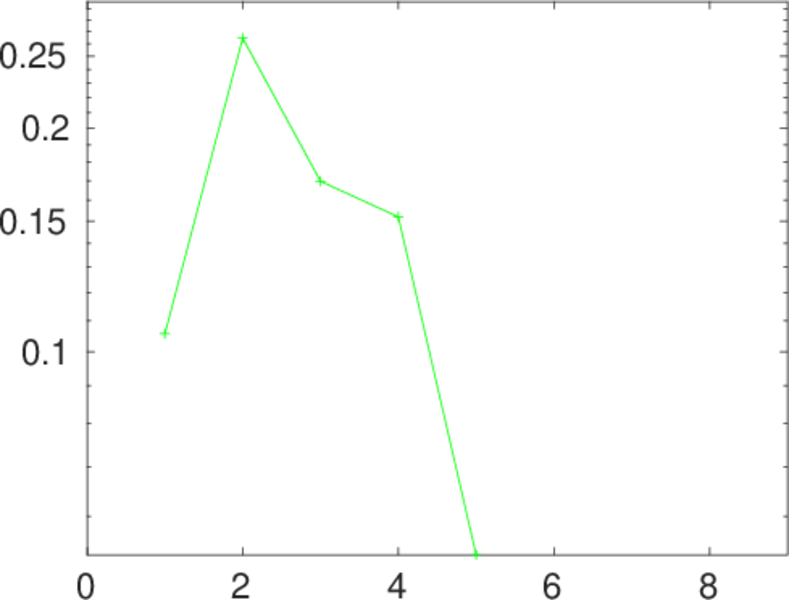
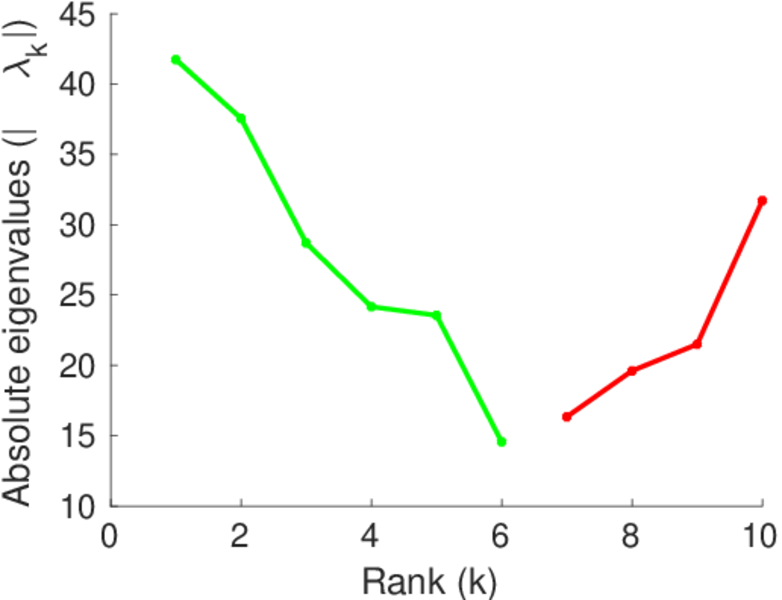
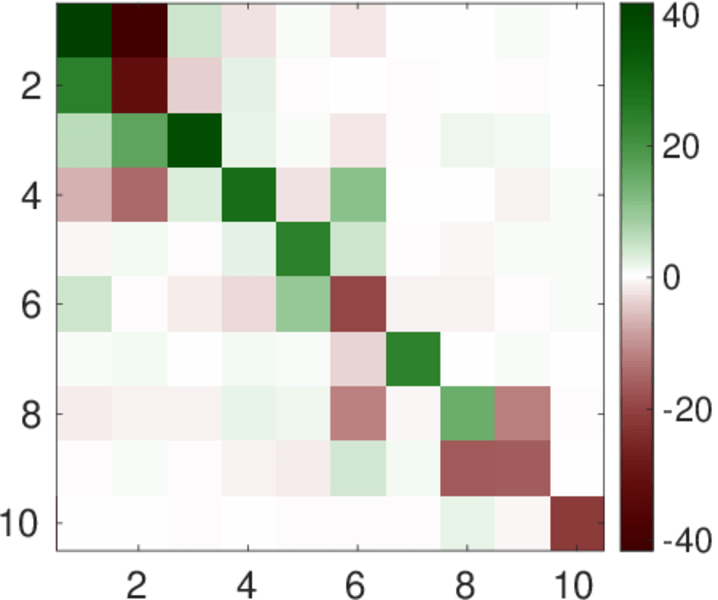
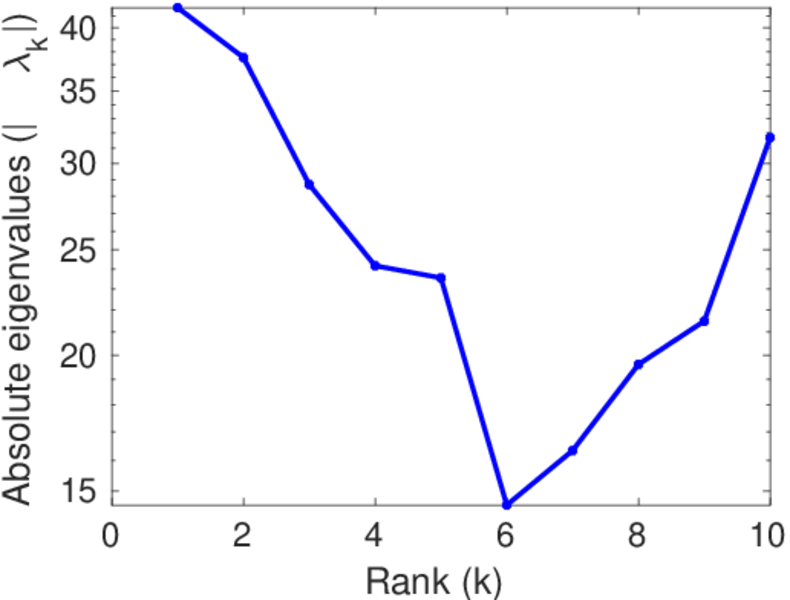
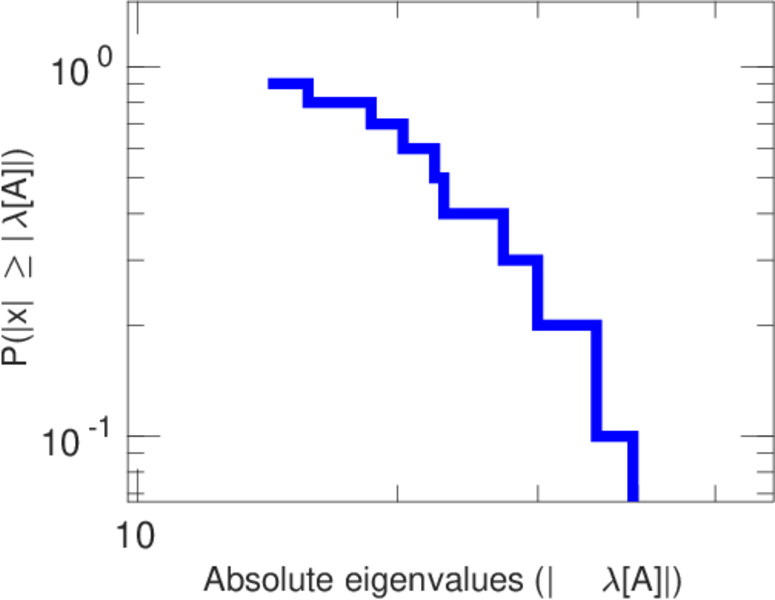
Plots


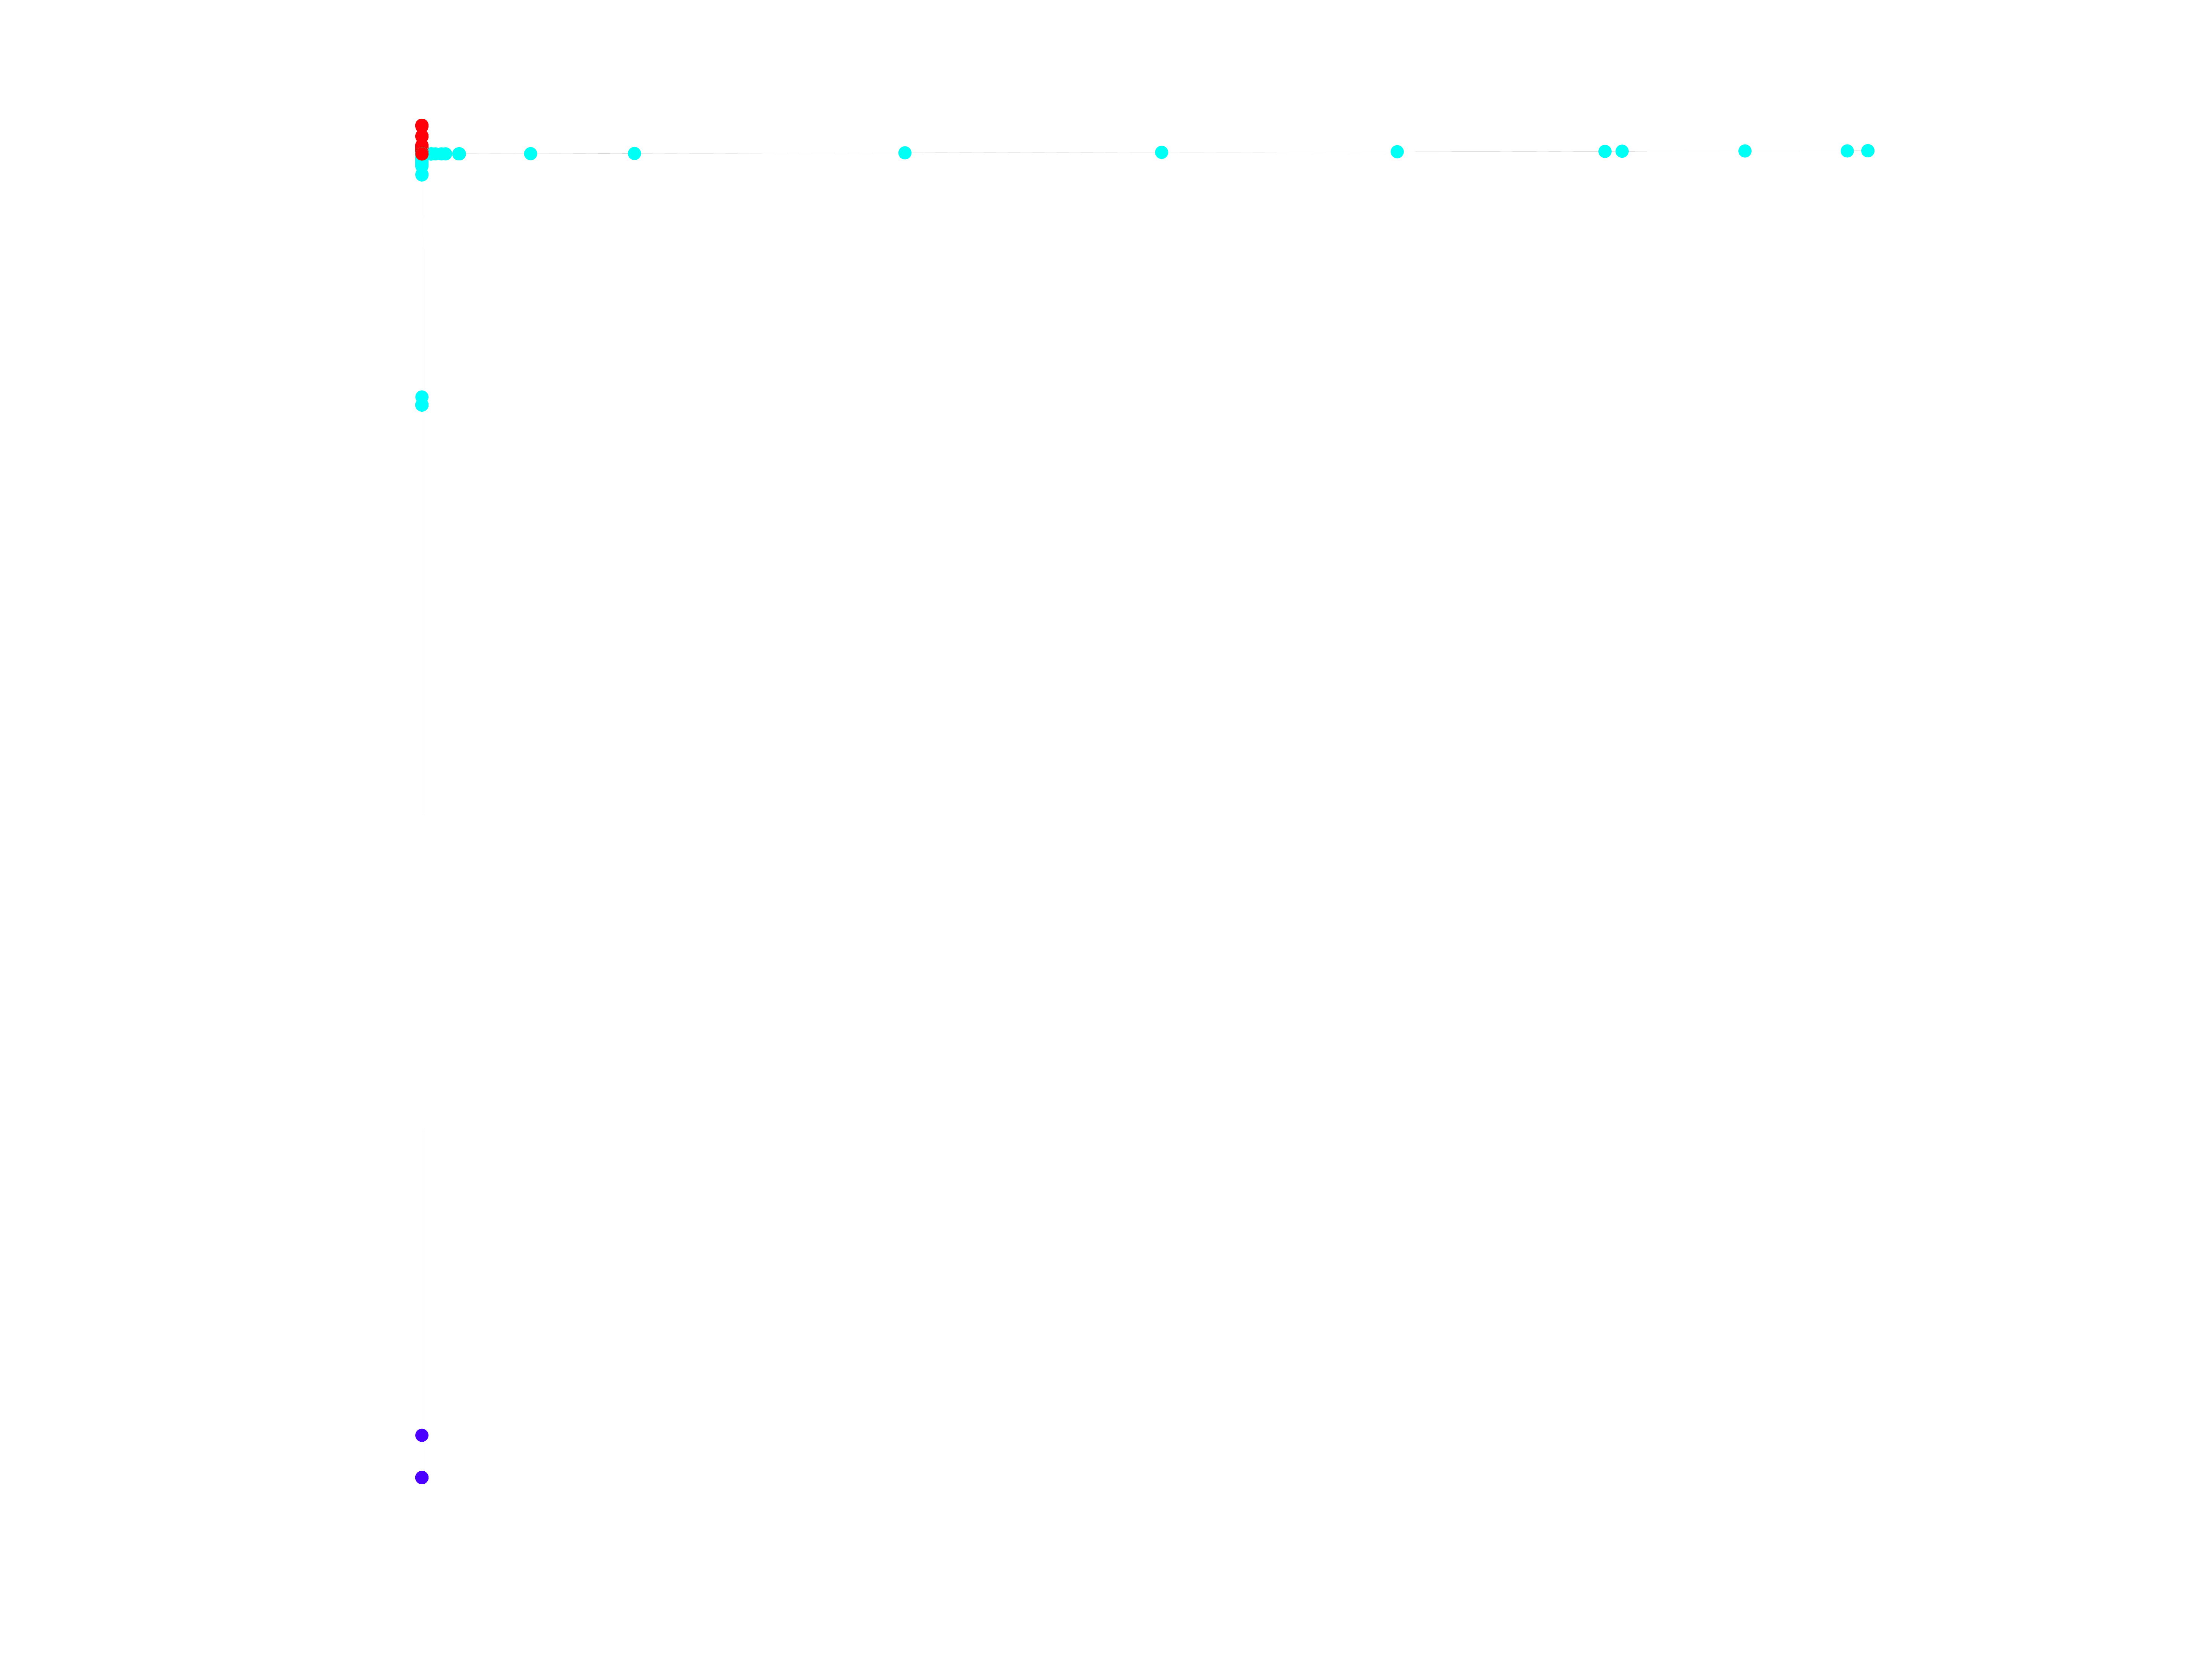
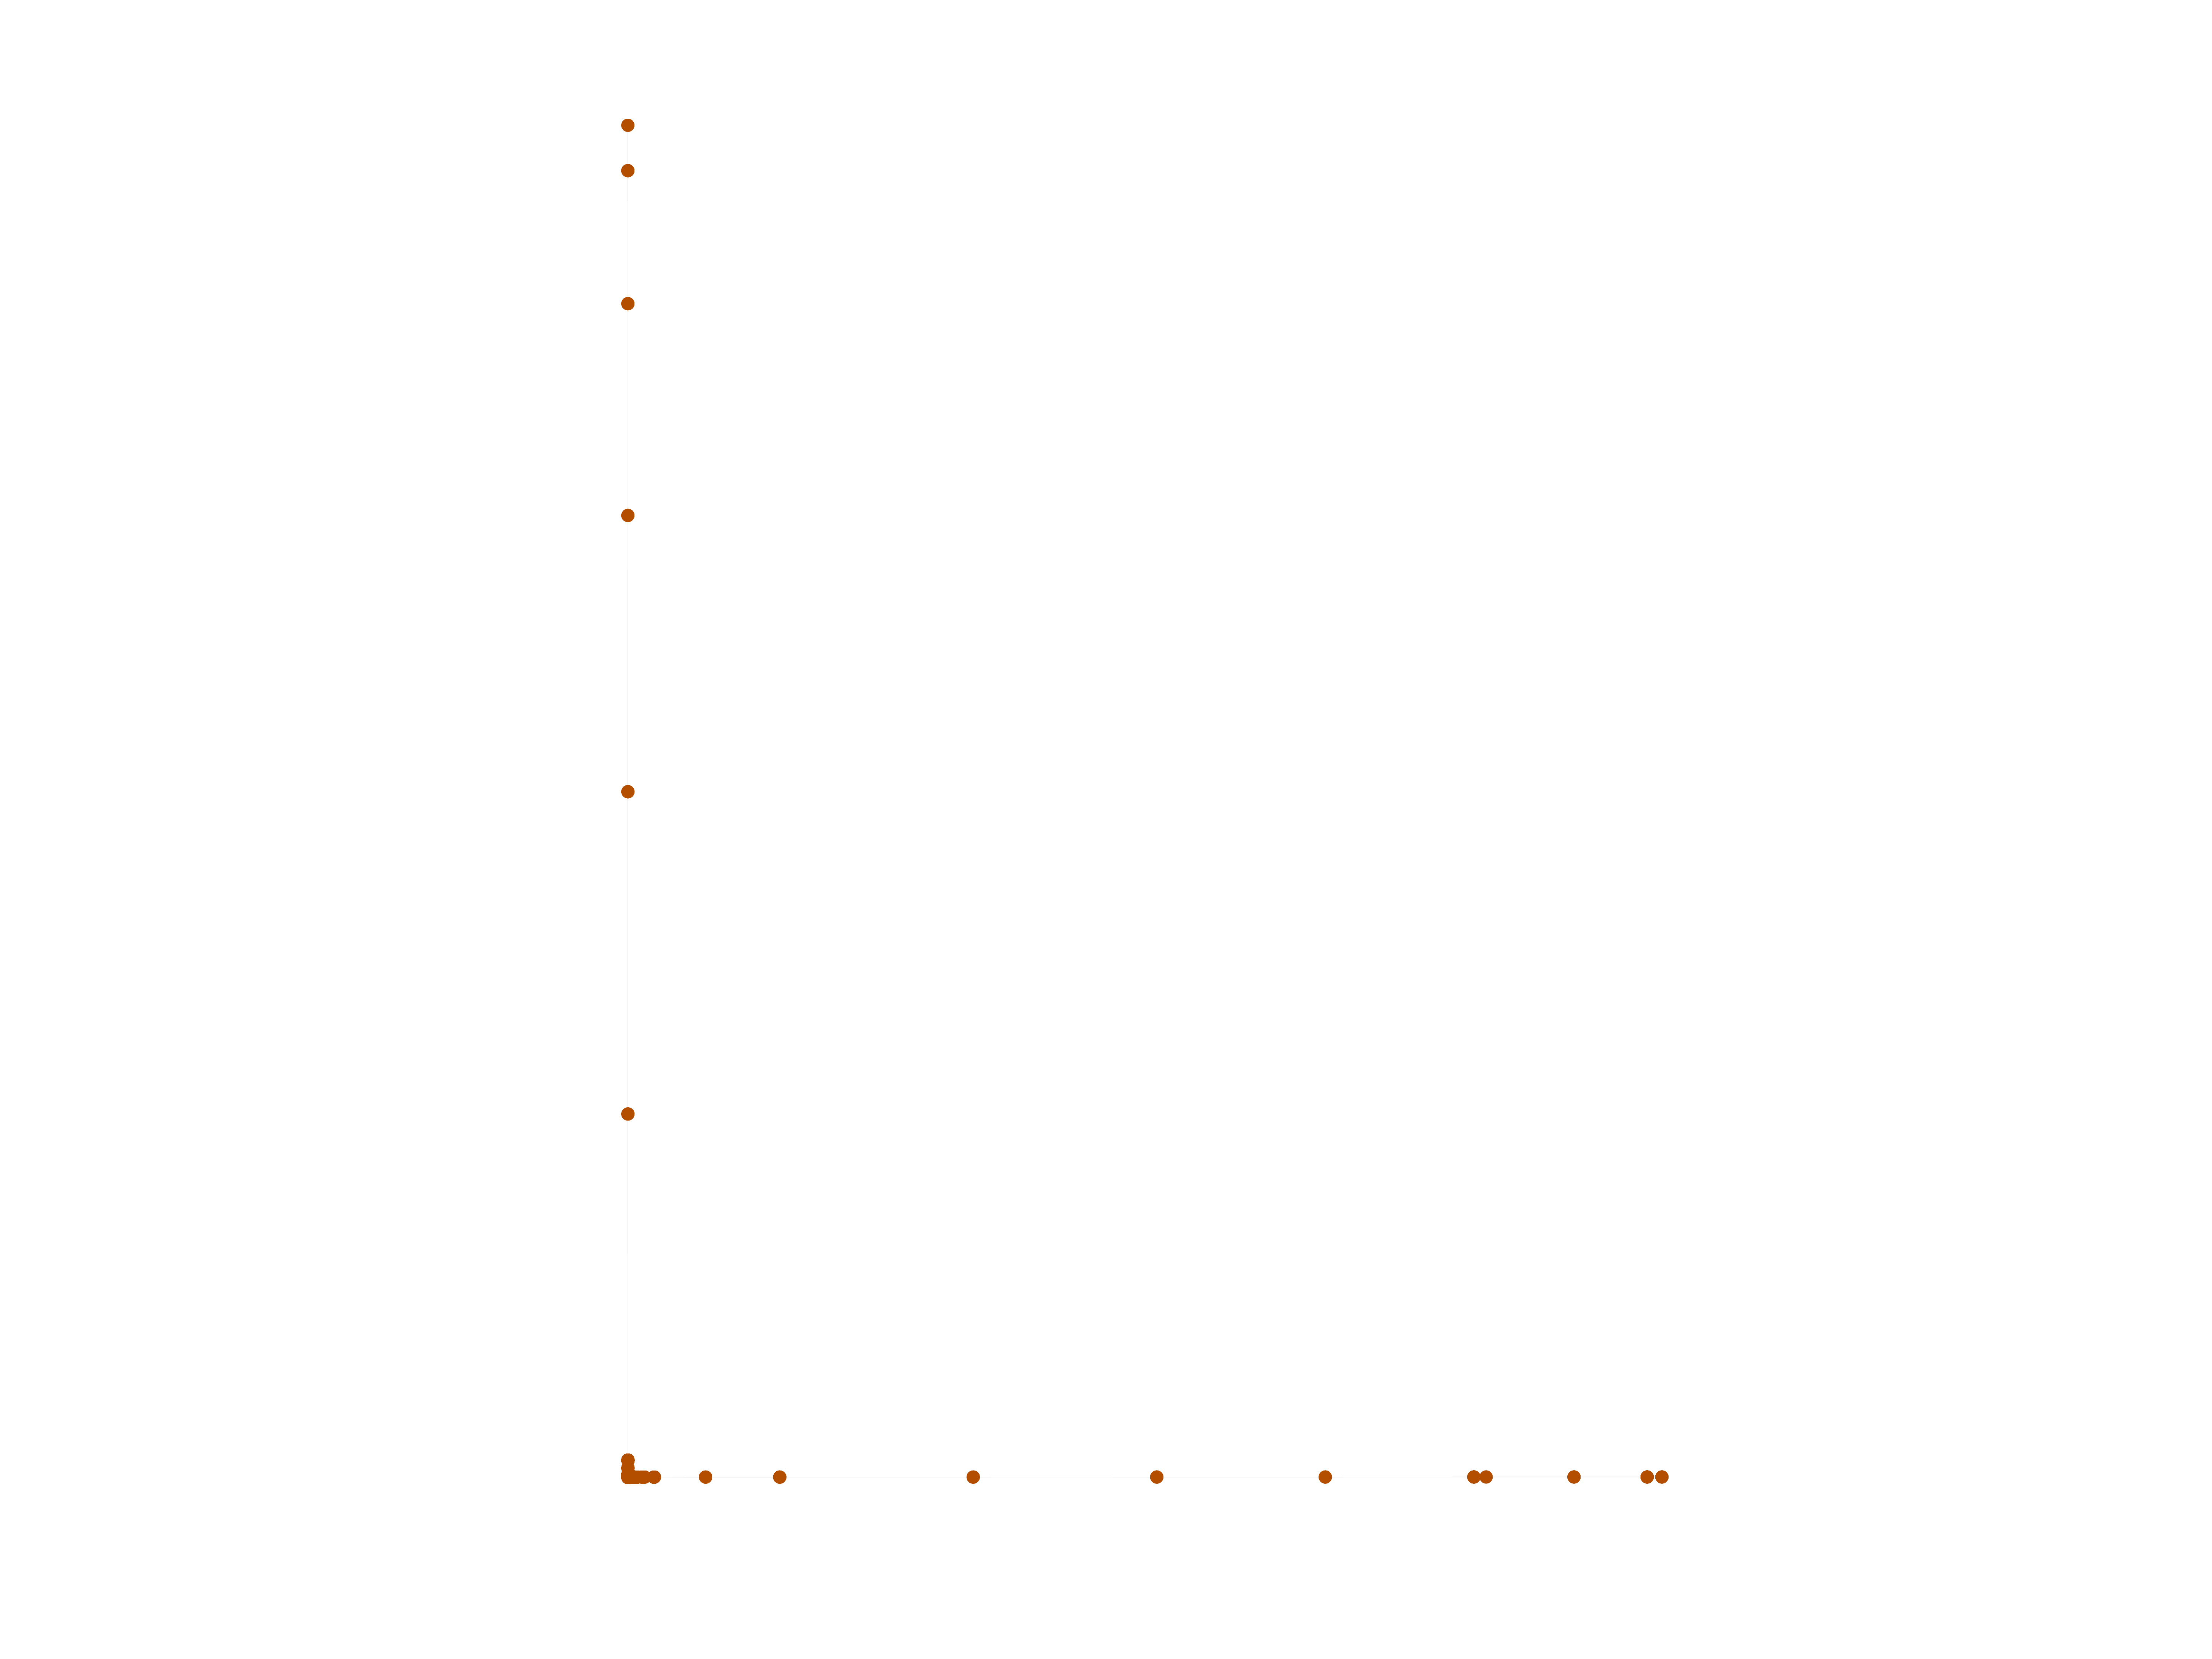
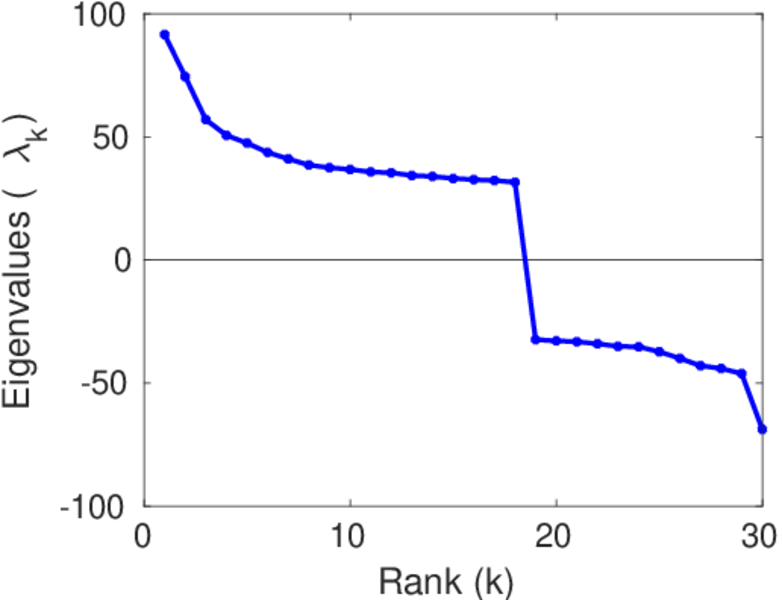
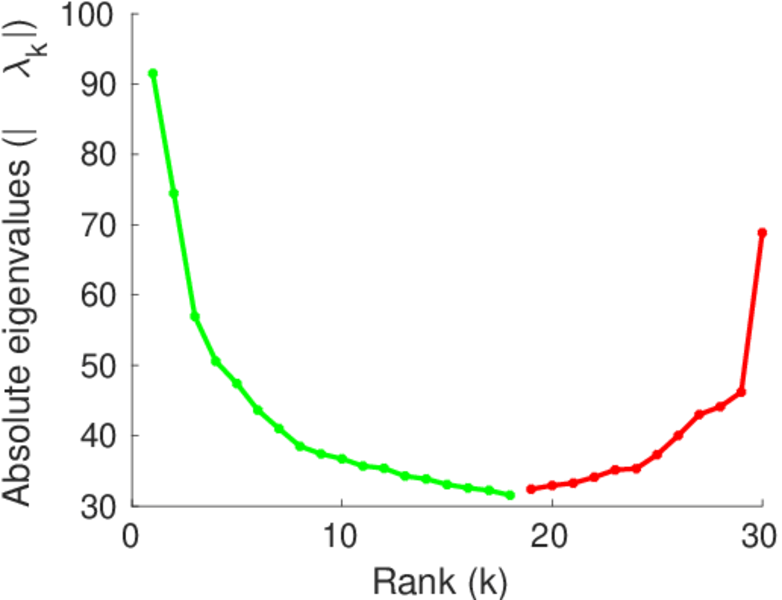
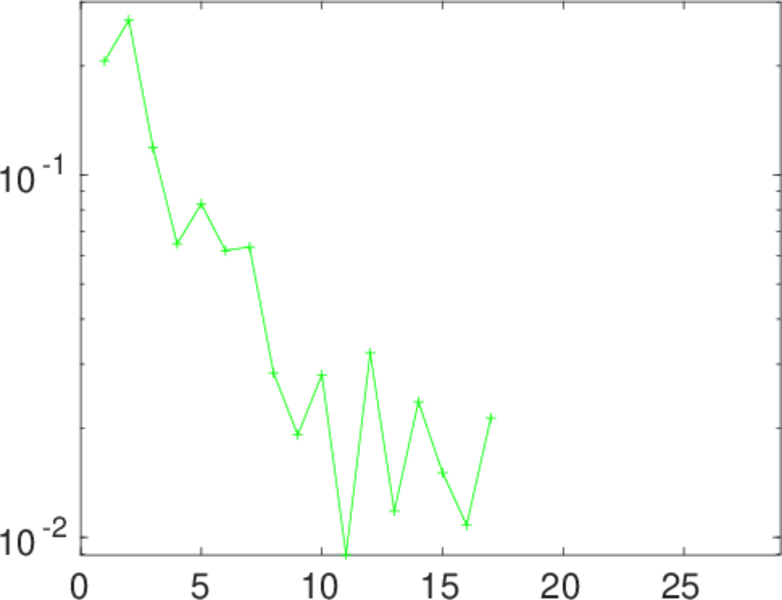
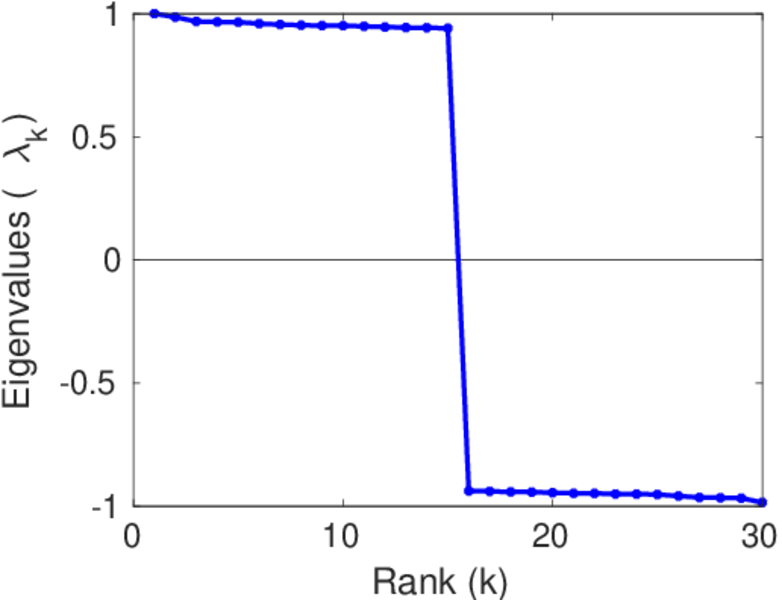
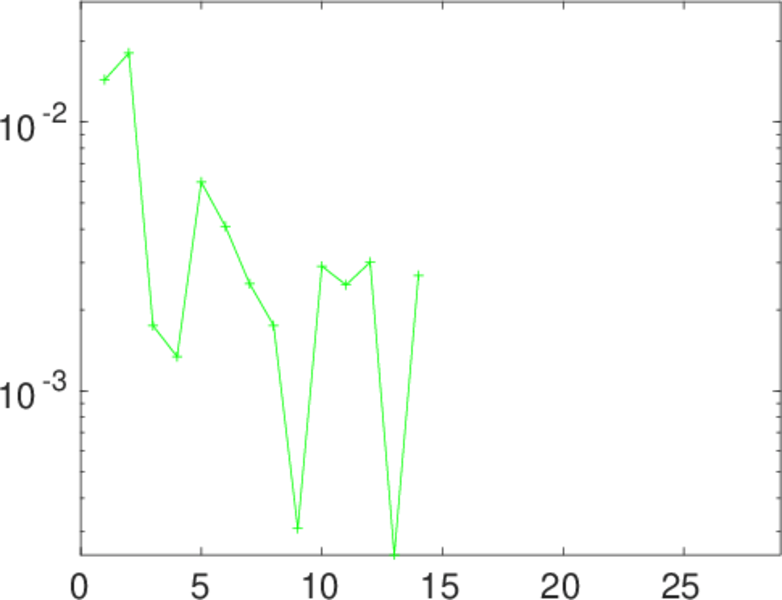
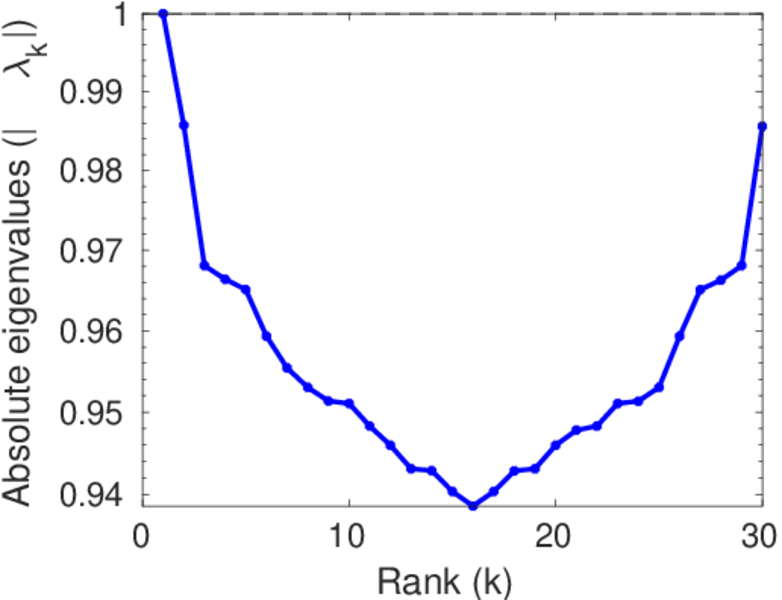
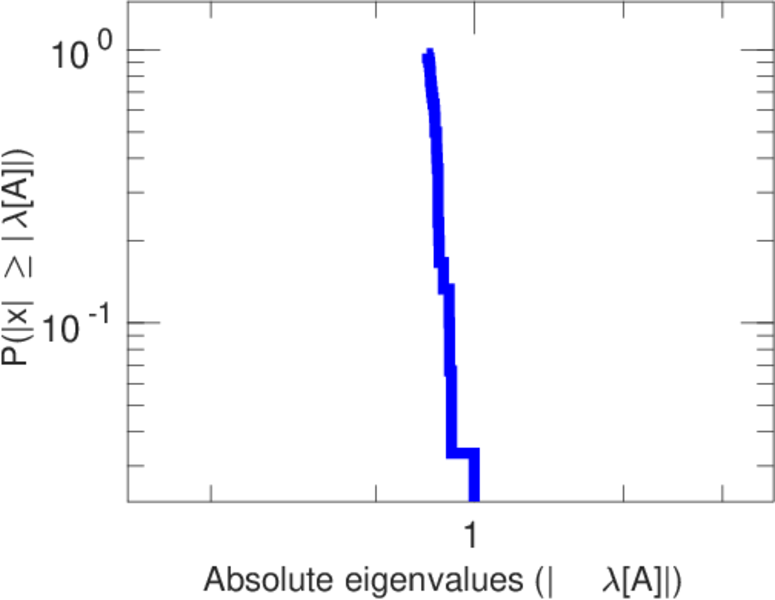
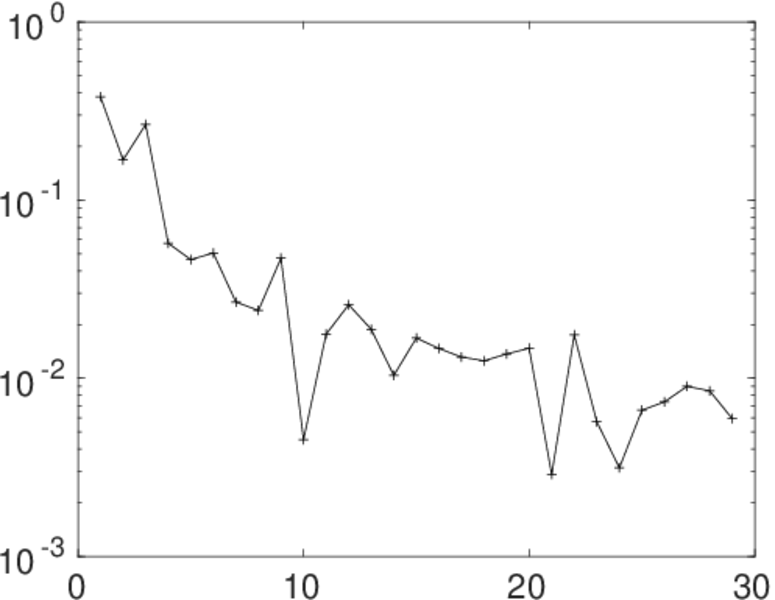
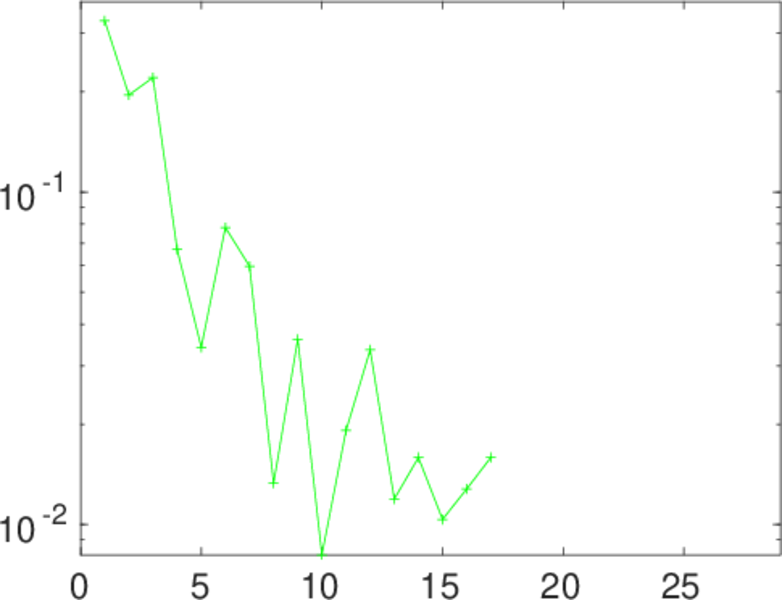
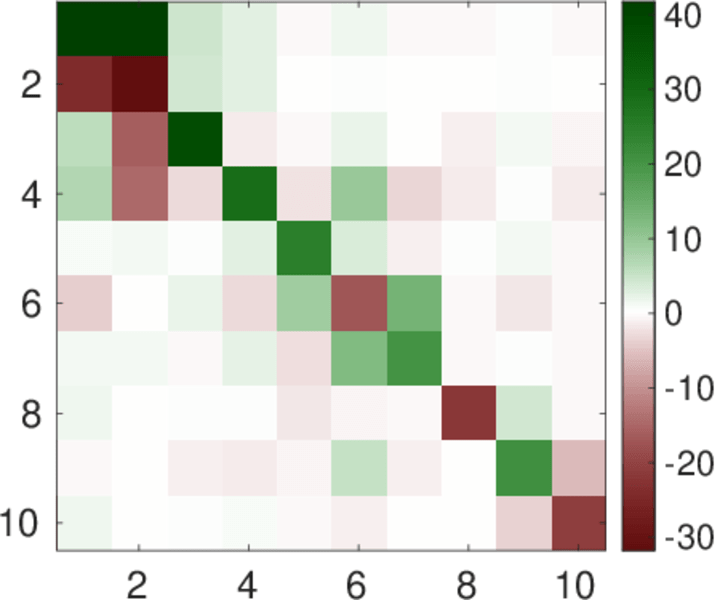
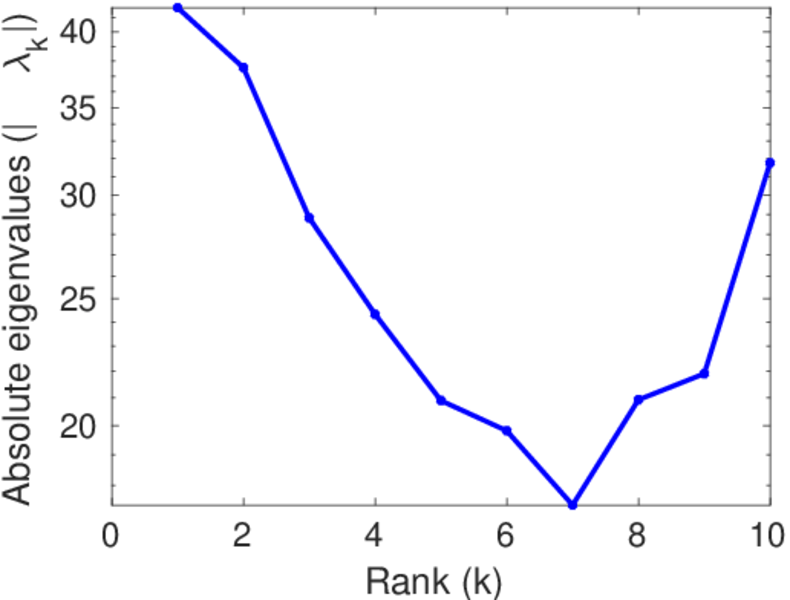
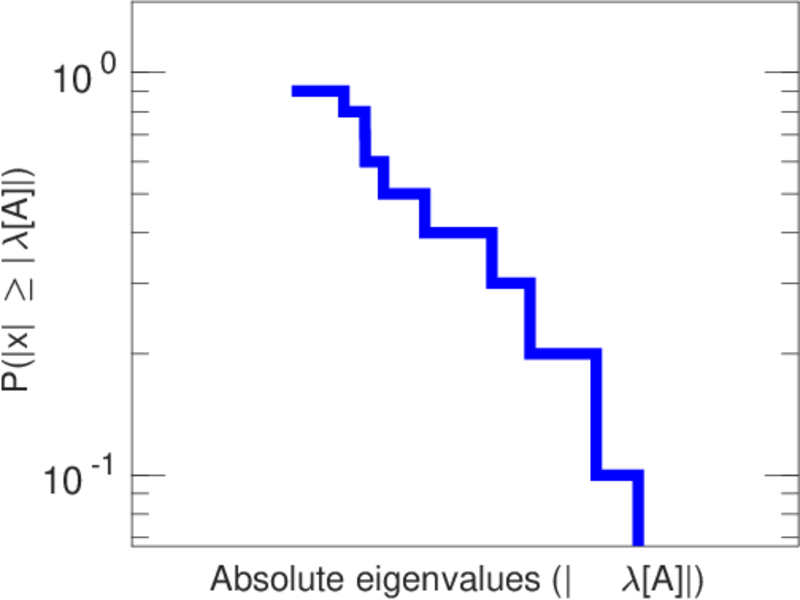
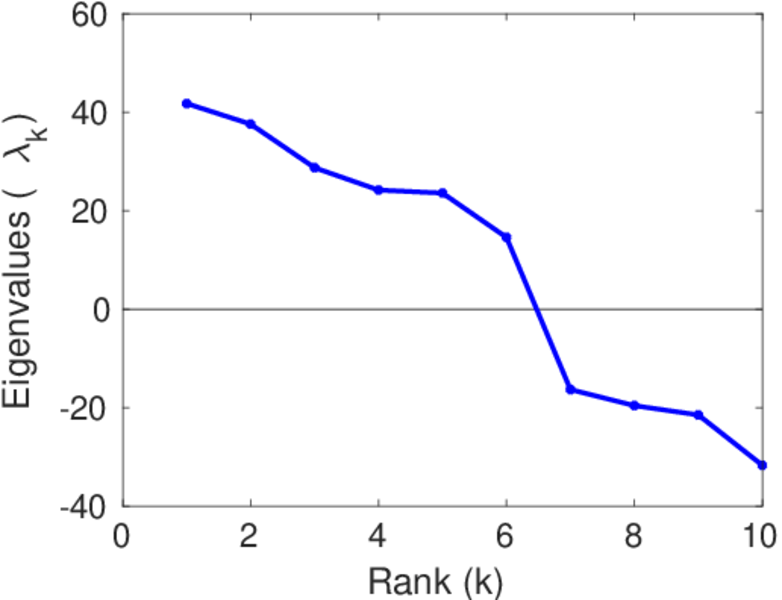
Matrix decompositions plots


Downloads
References
|
[1]
|
Jérôme Kunegis.
KONECT – The Koblenz Network Collection.
In Proc. Int. Conf. on World Wide Web Companion, pages
1343–1350, 2013.
[ http ]
|
|
[2]
|
Vicenç Gómez, Andreas Kaltenbrunner, and Vicente López.
Statistical analysis of the social network and discussion threads in
Slashdot.
In Proc. Int. World Wide Web Conf., pages 645–654, 2008.
|
 KONECT ‣ Networks ‣
Buy Me a Coffee
KONECT ‣ Networks ‣
Buy Me a Coffee