Infectious

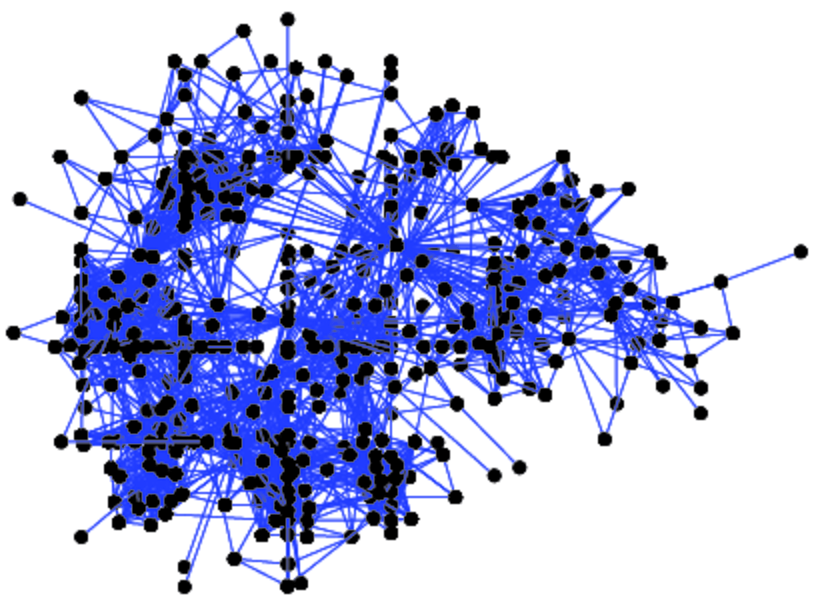
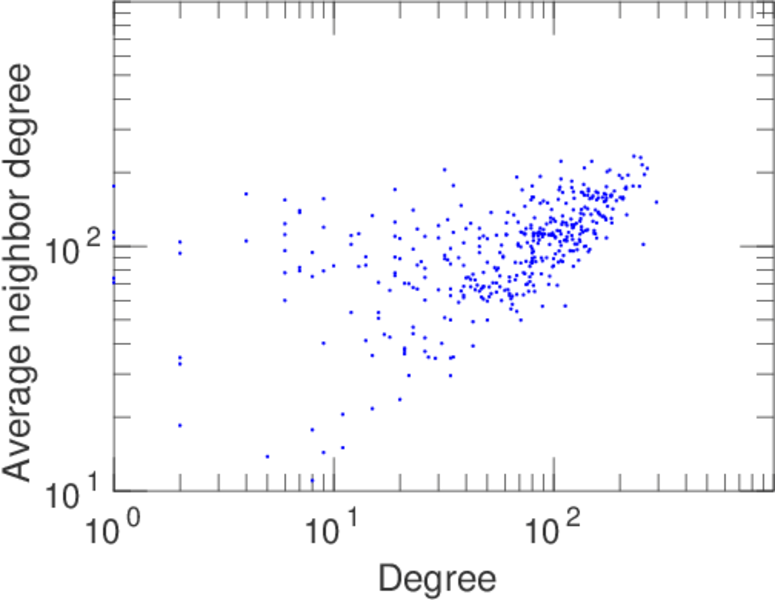
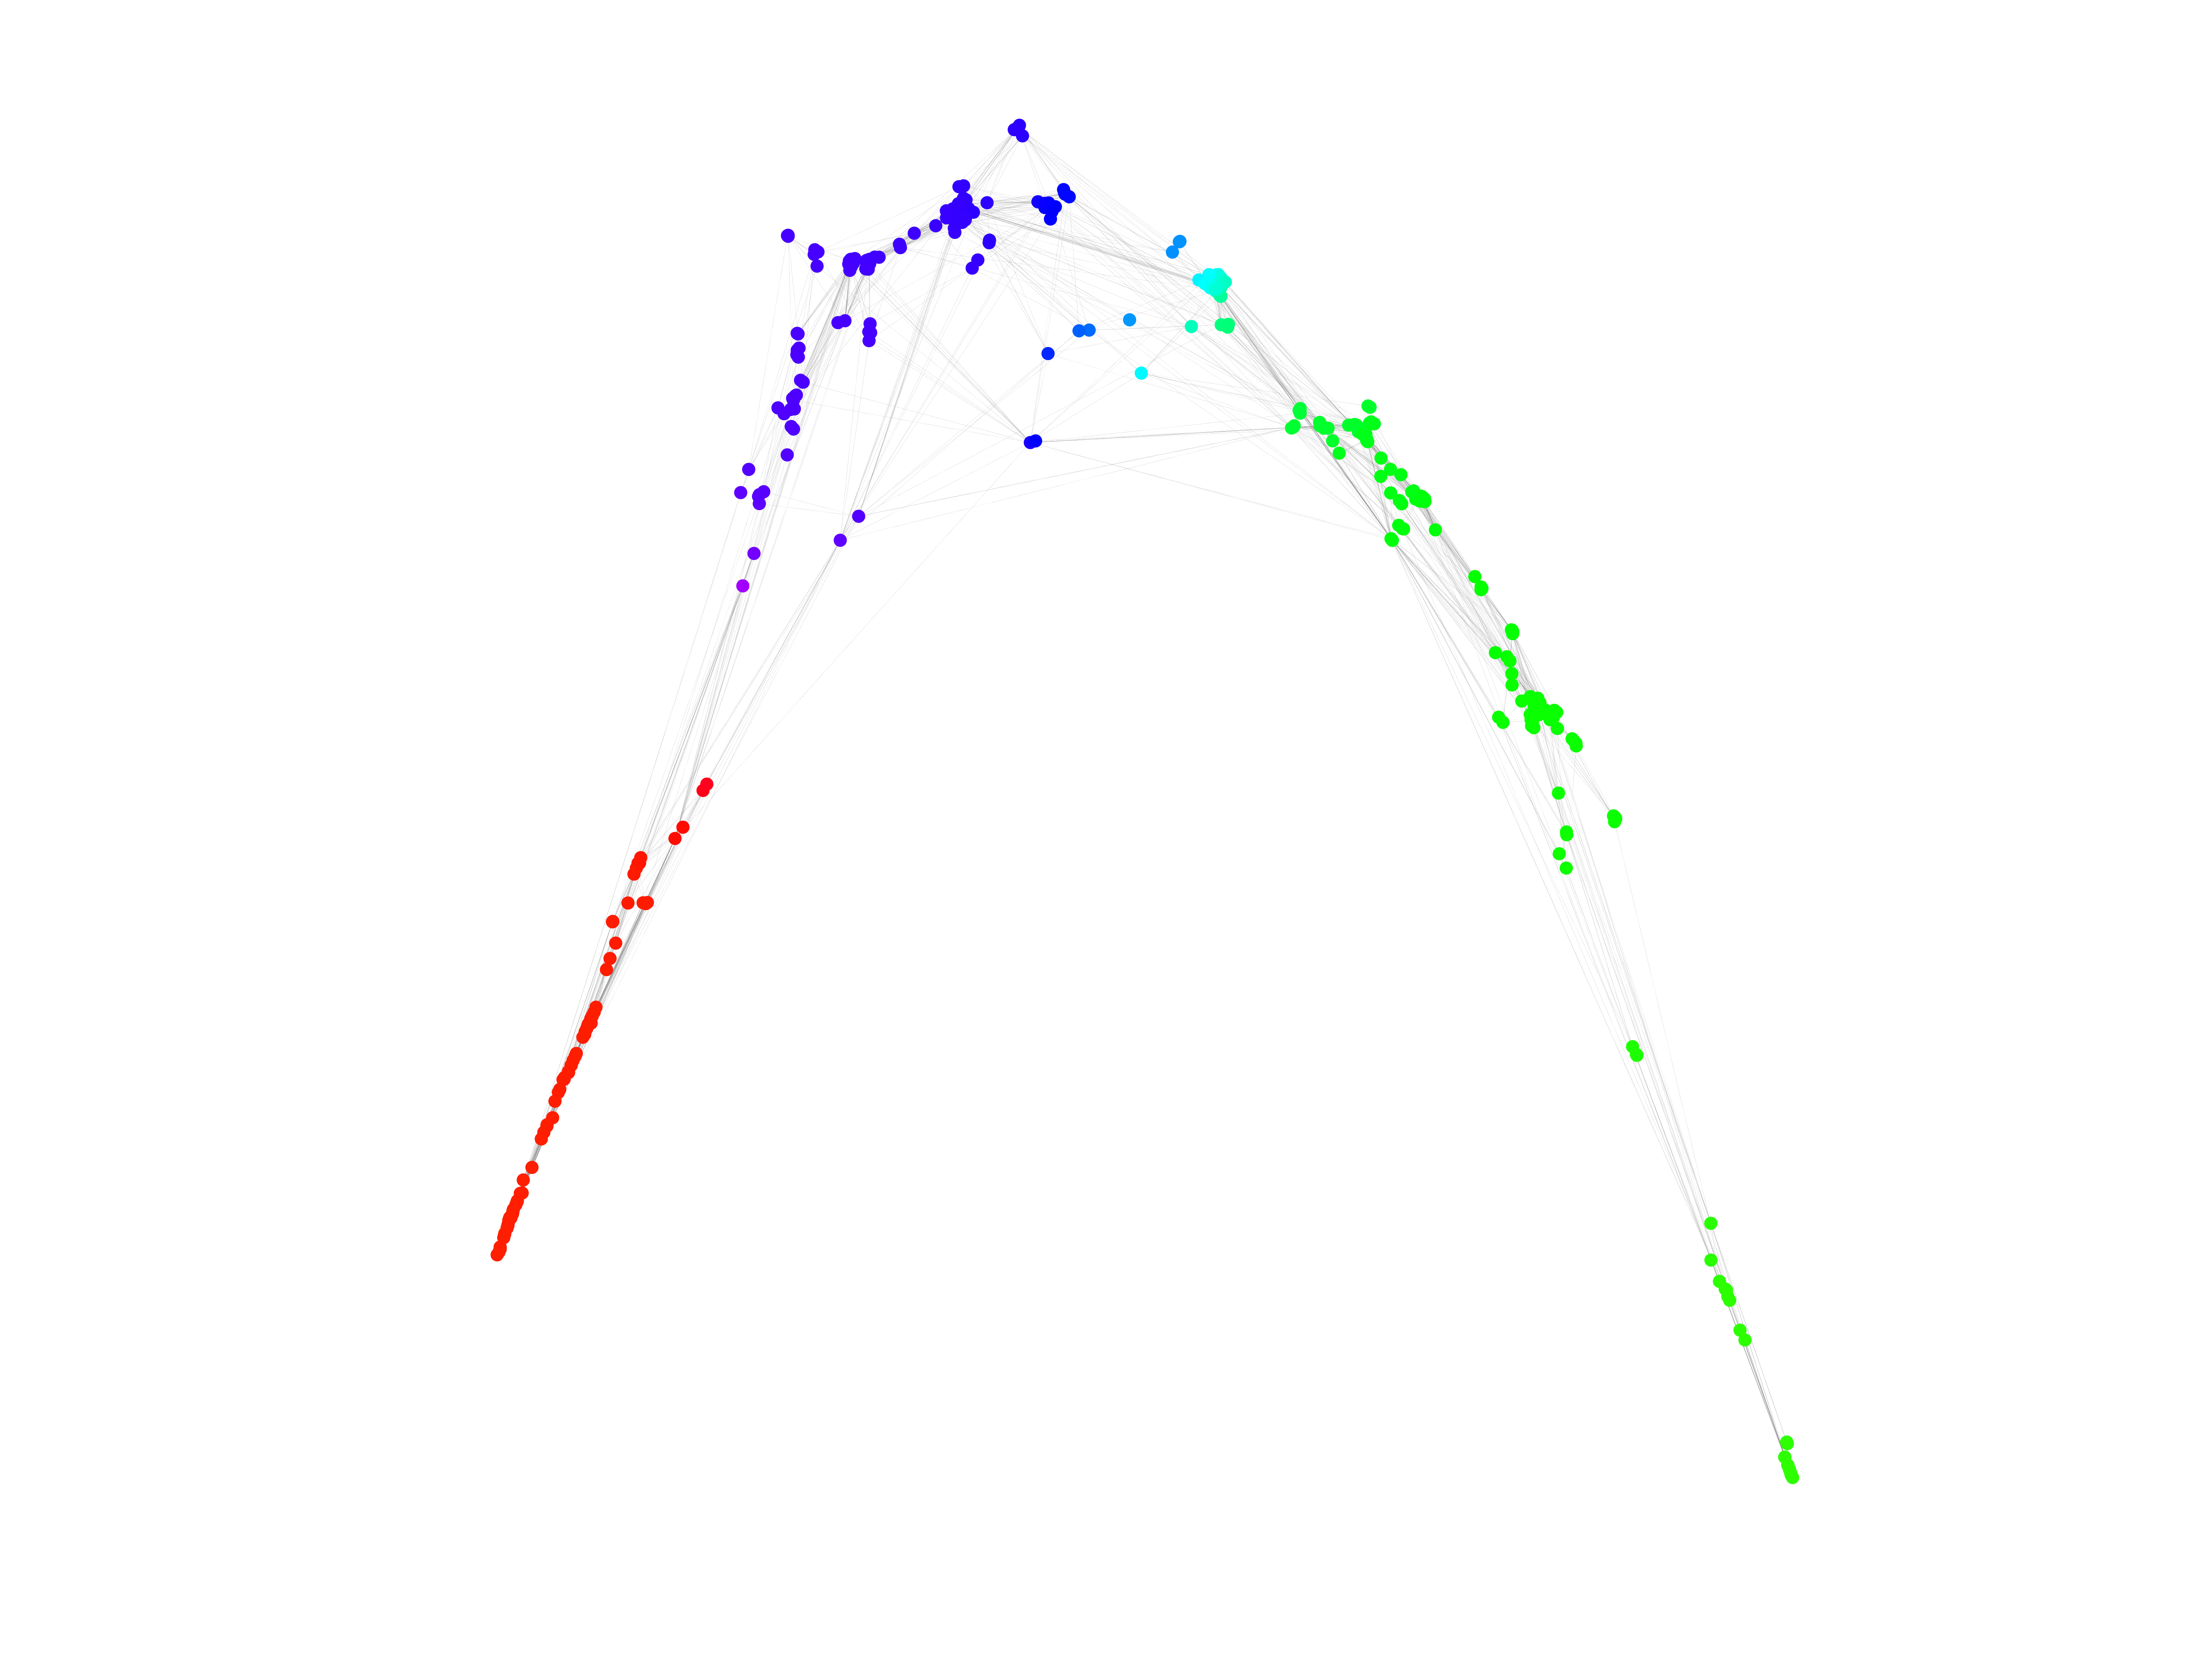
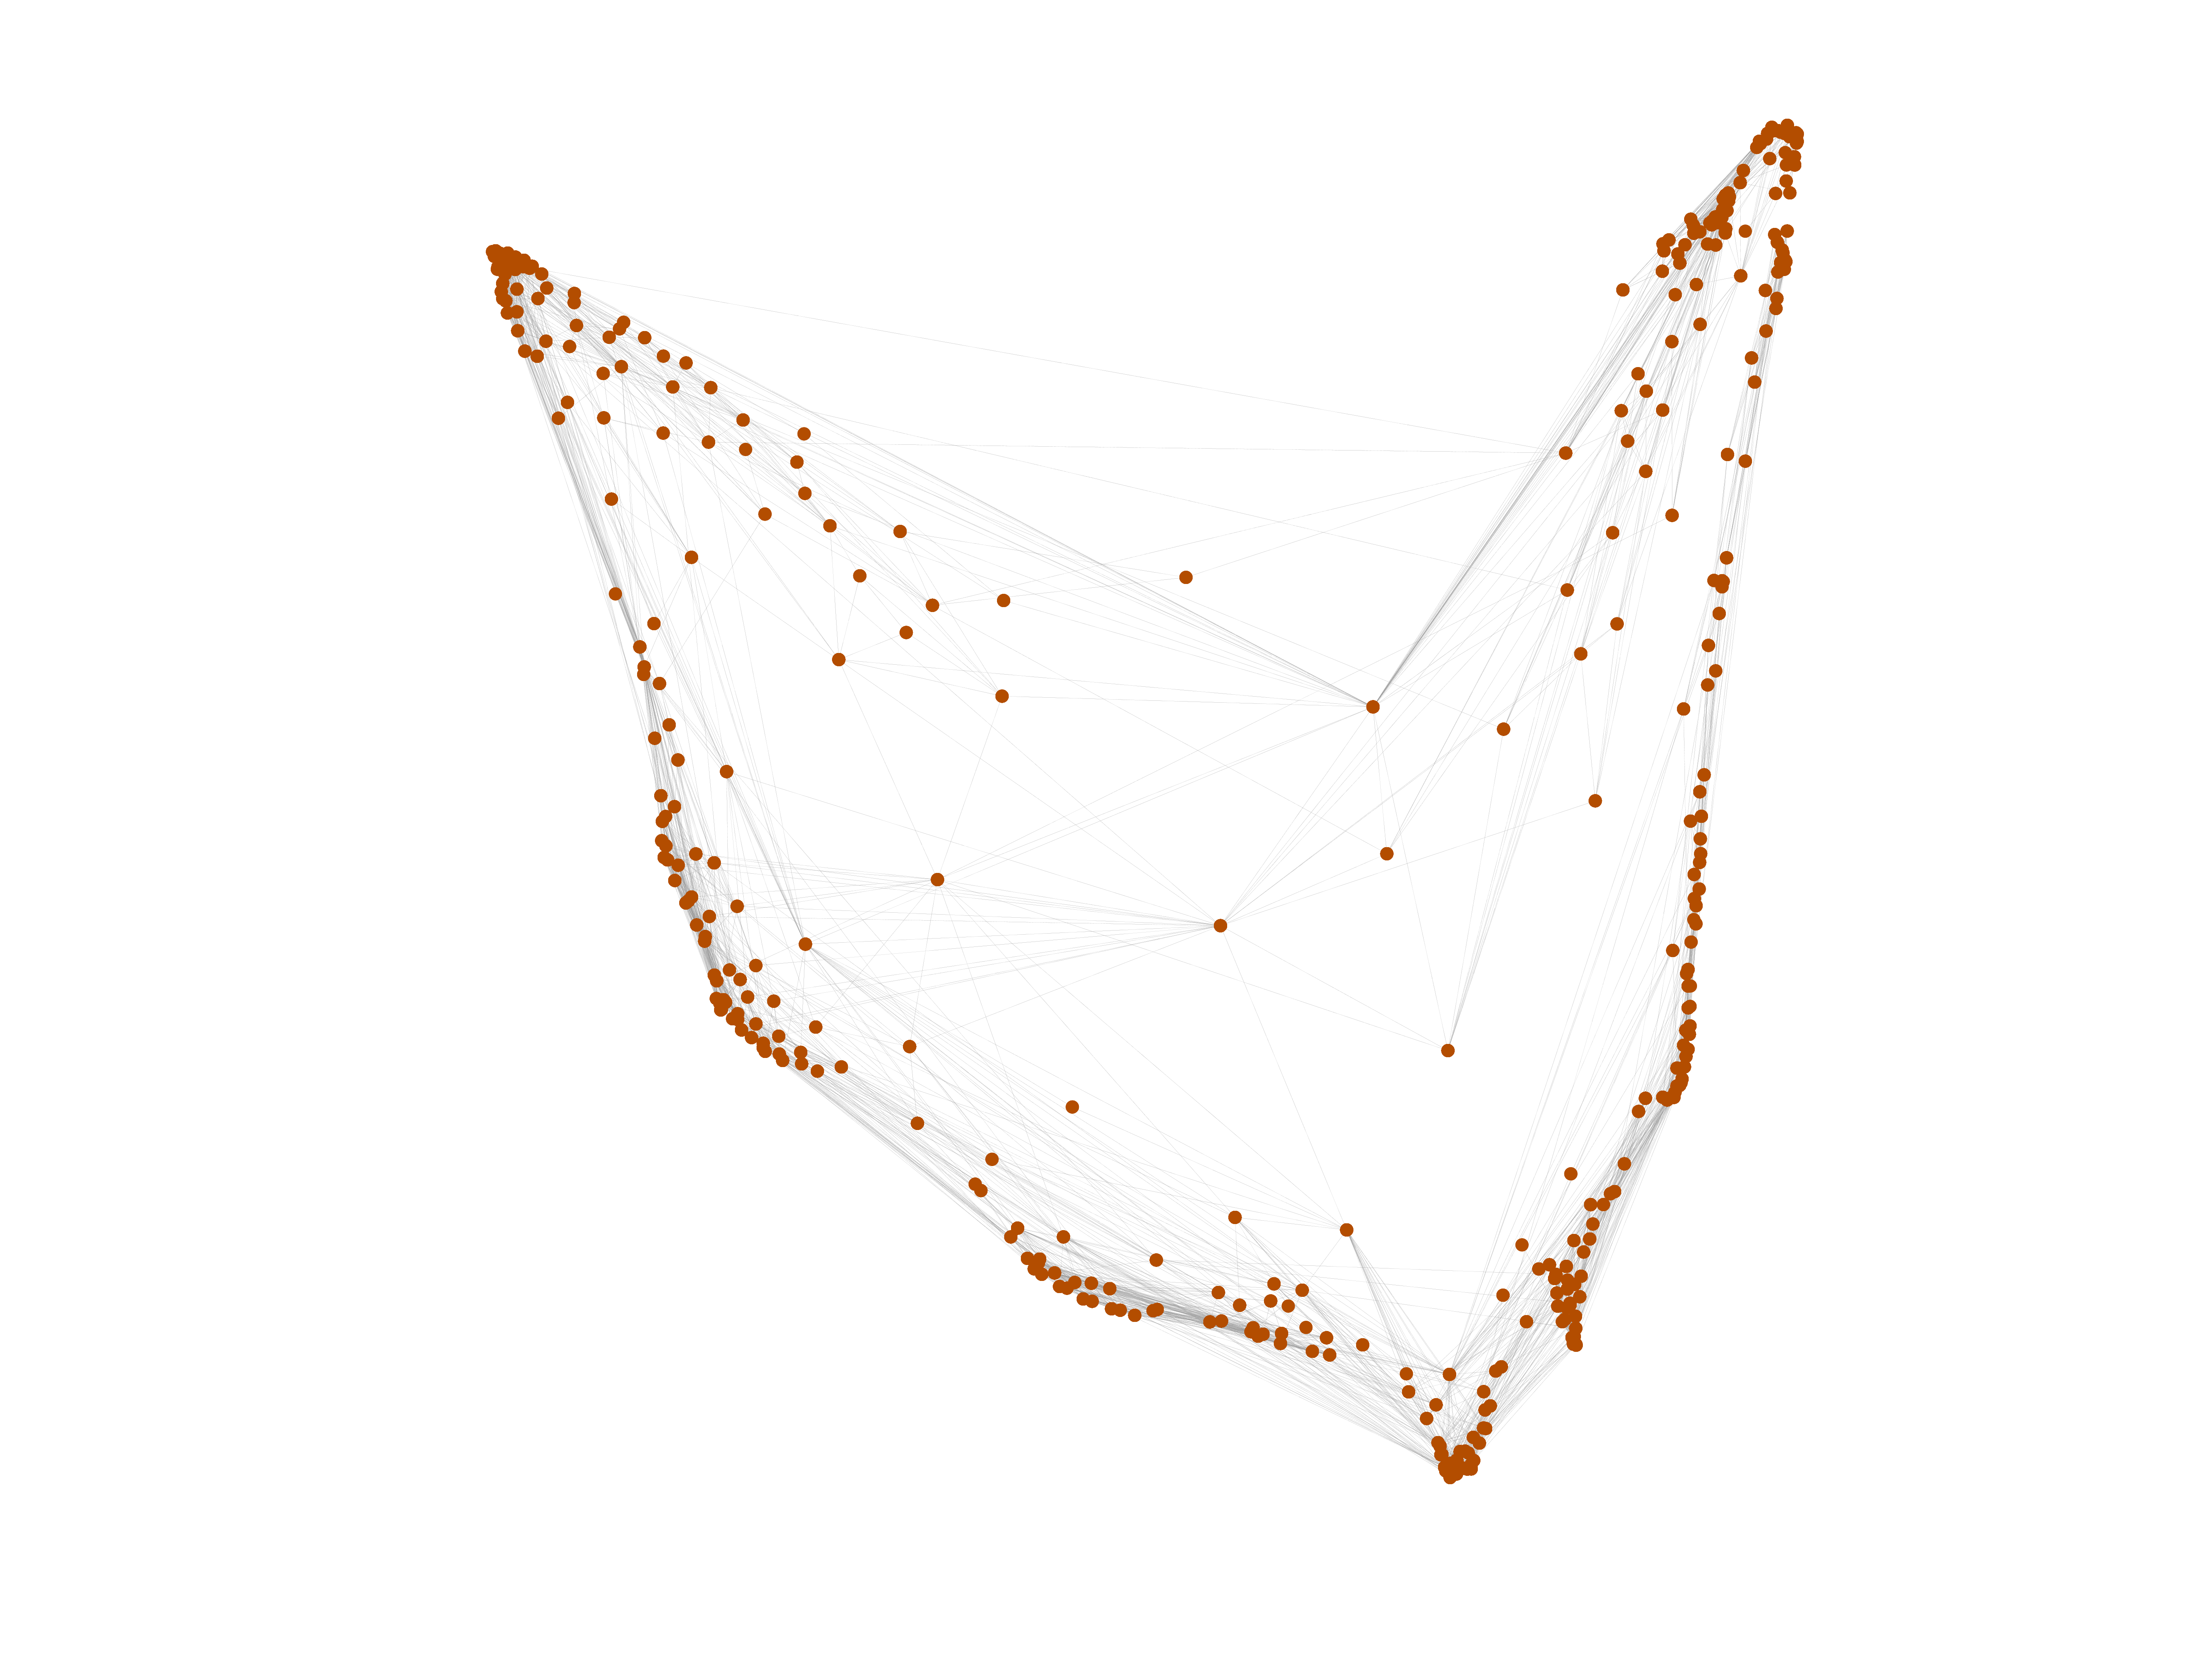
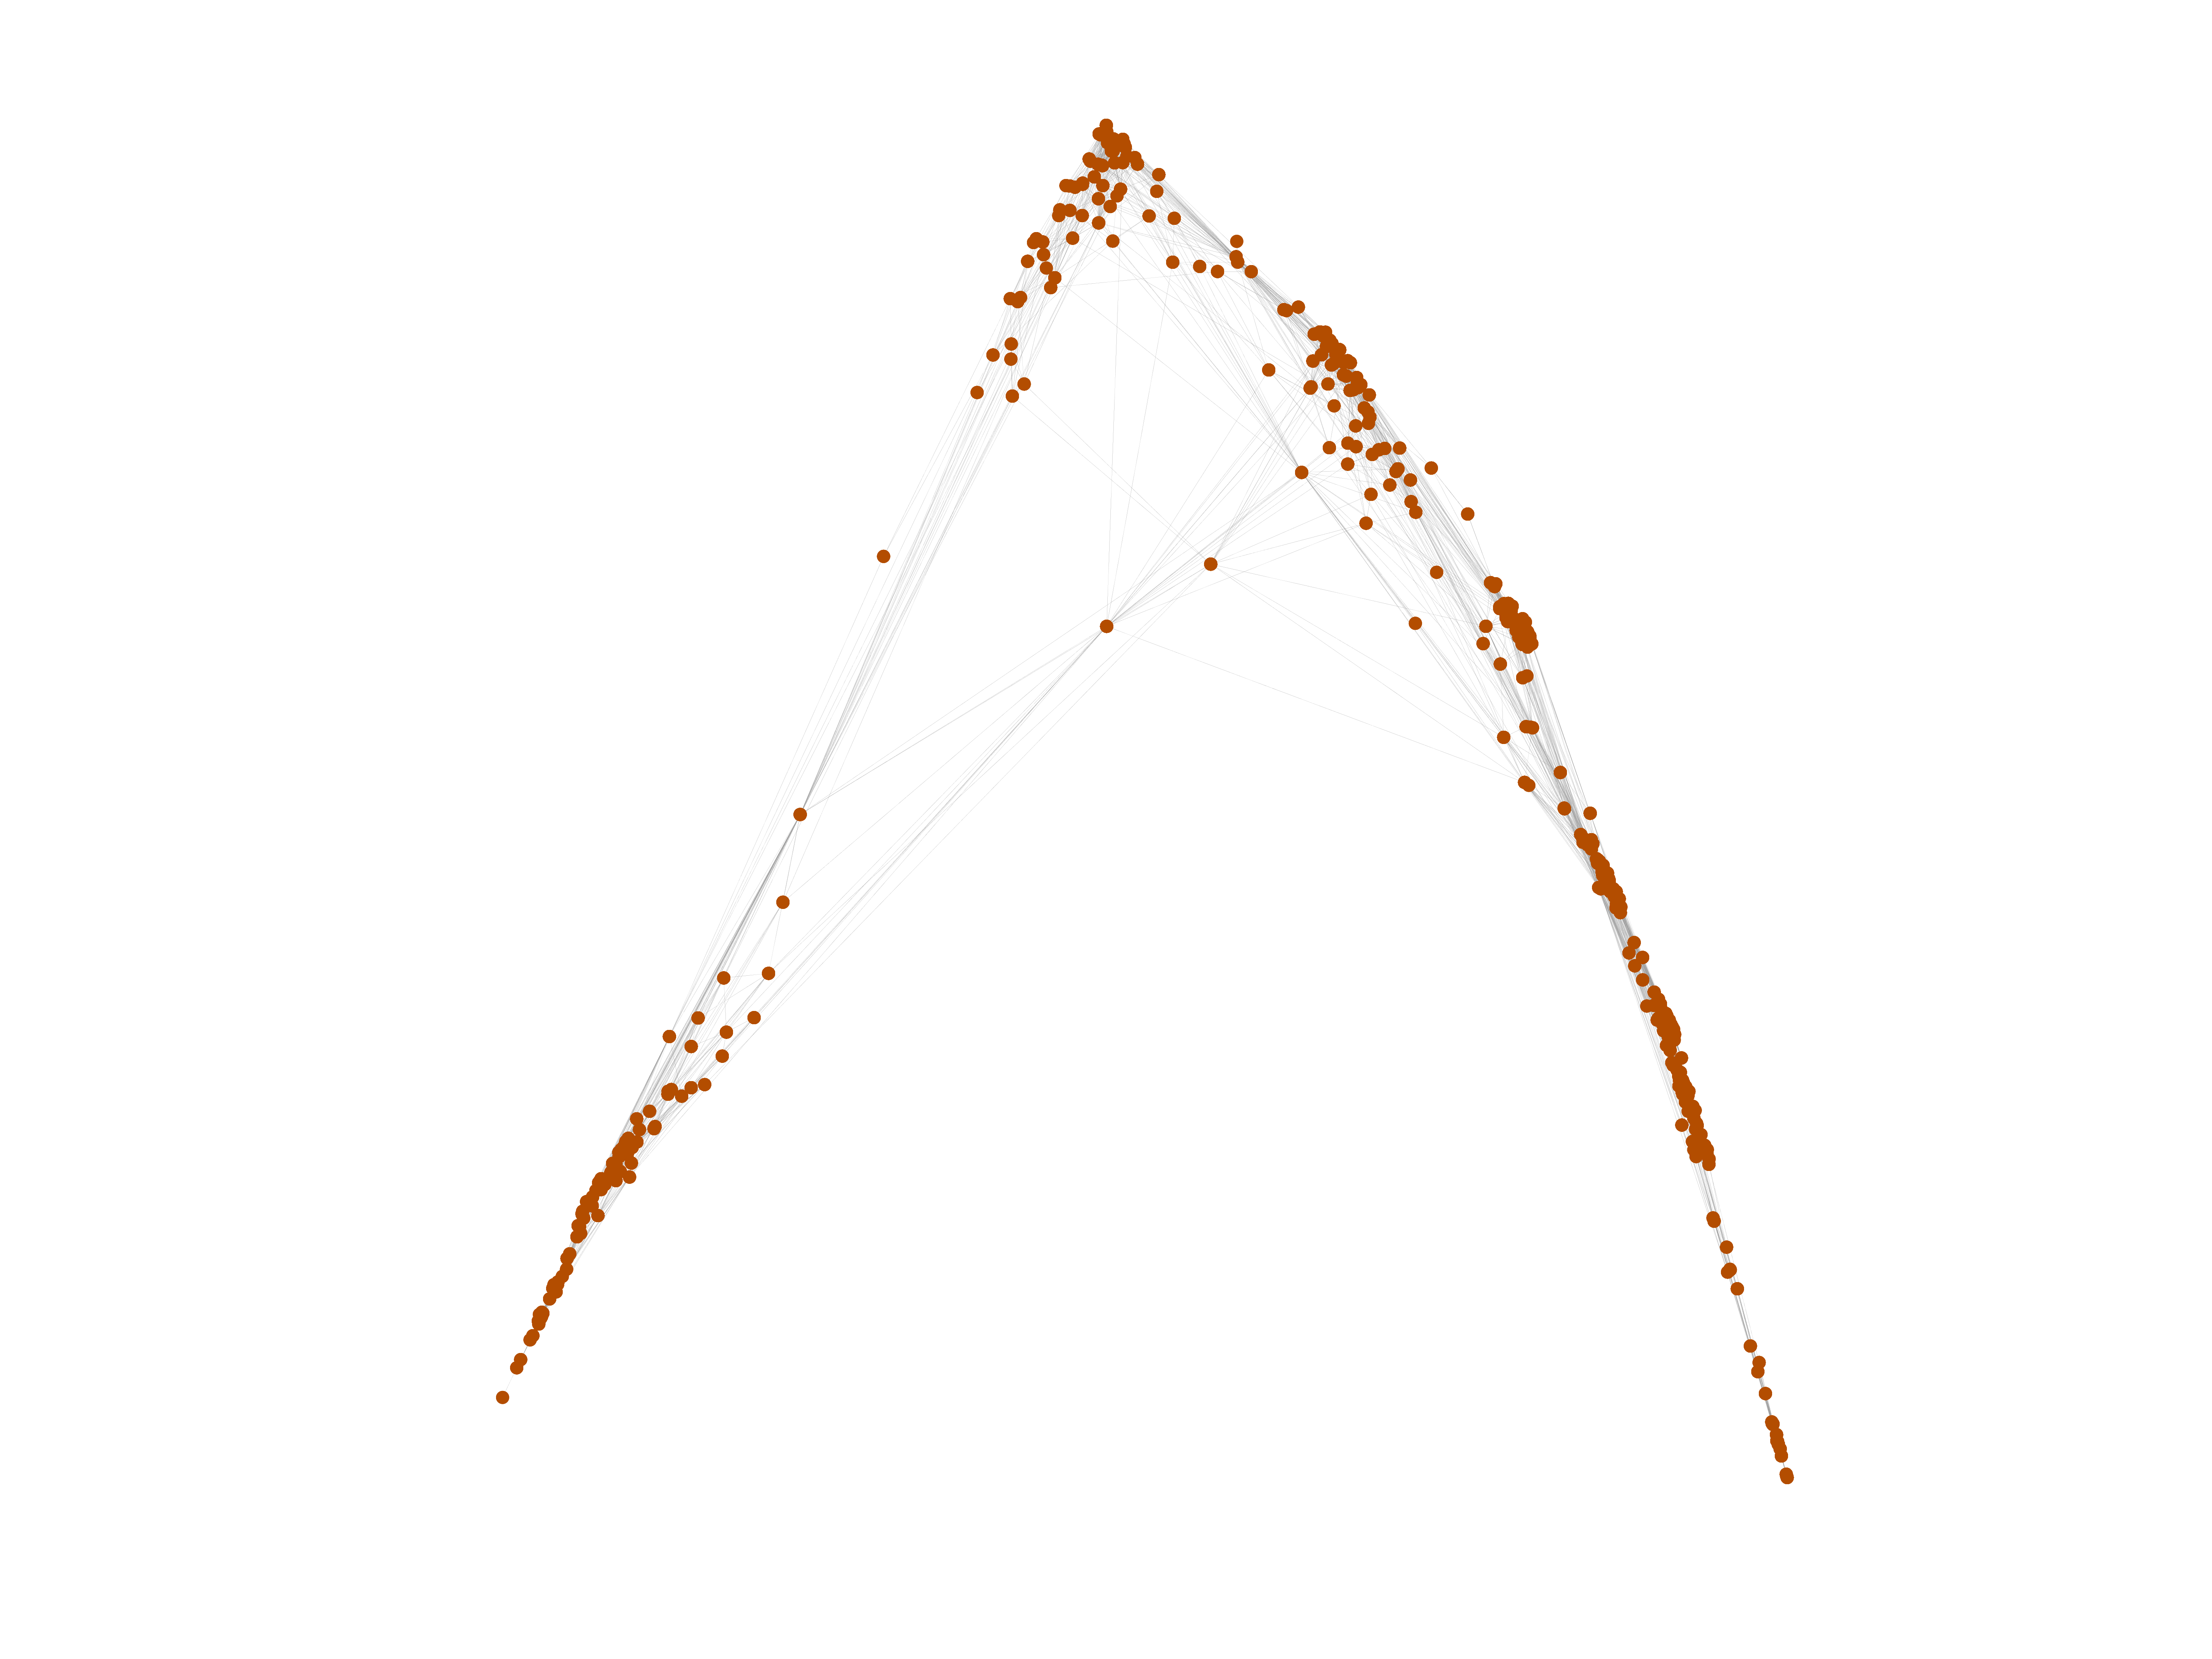
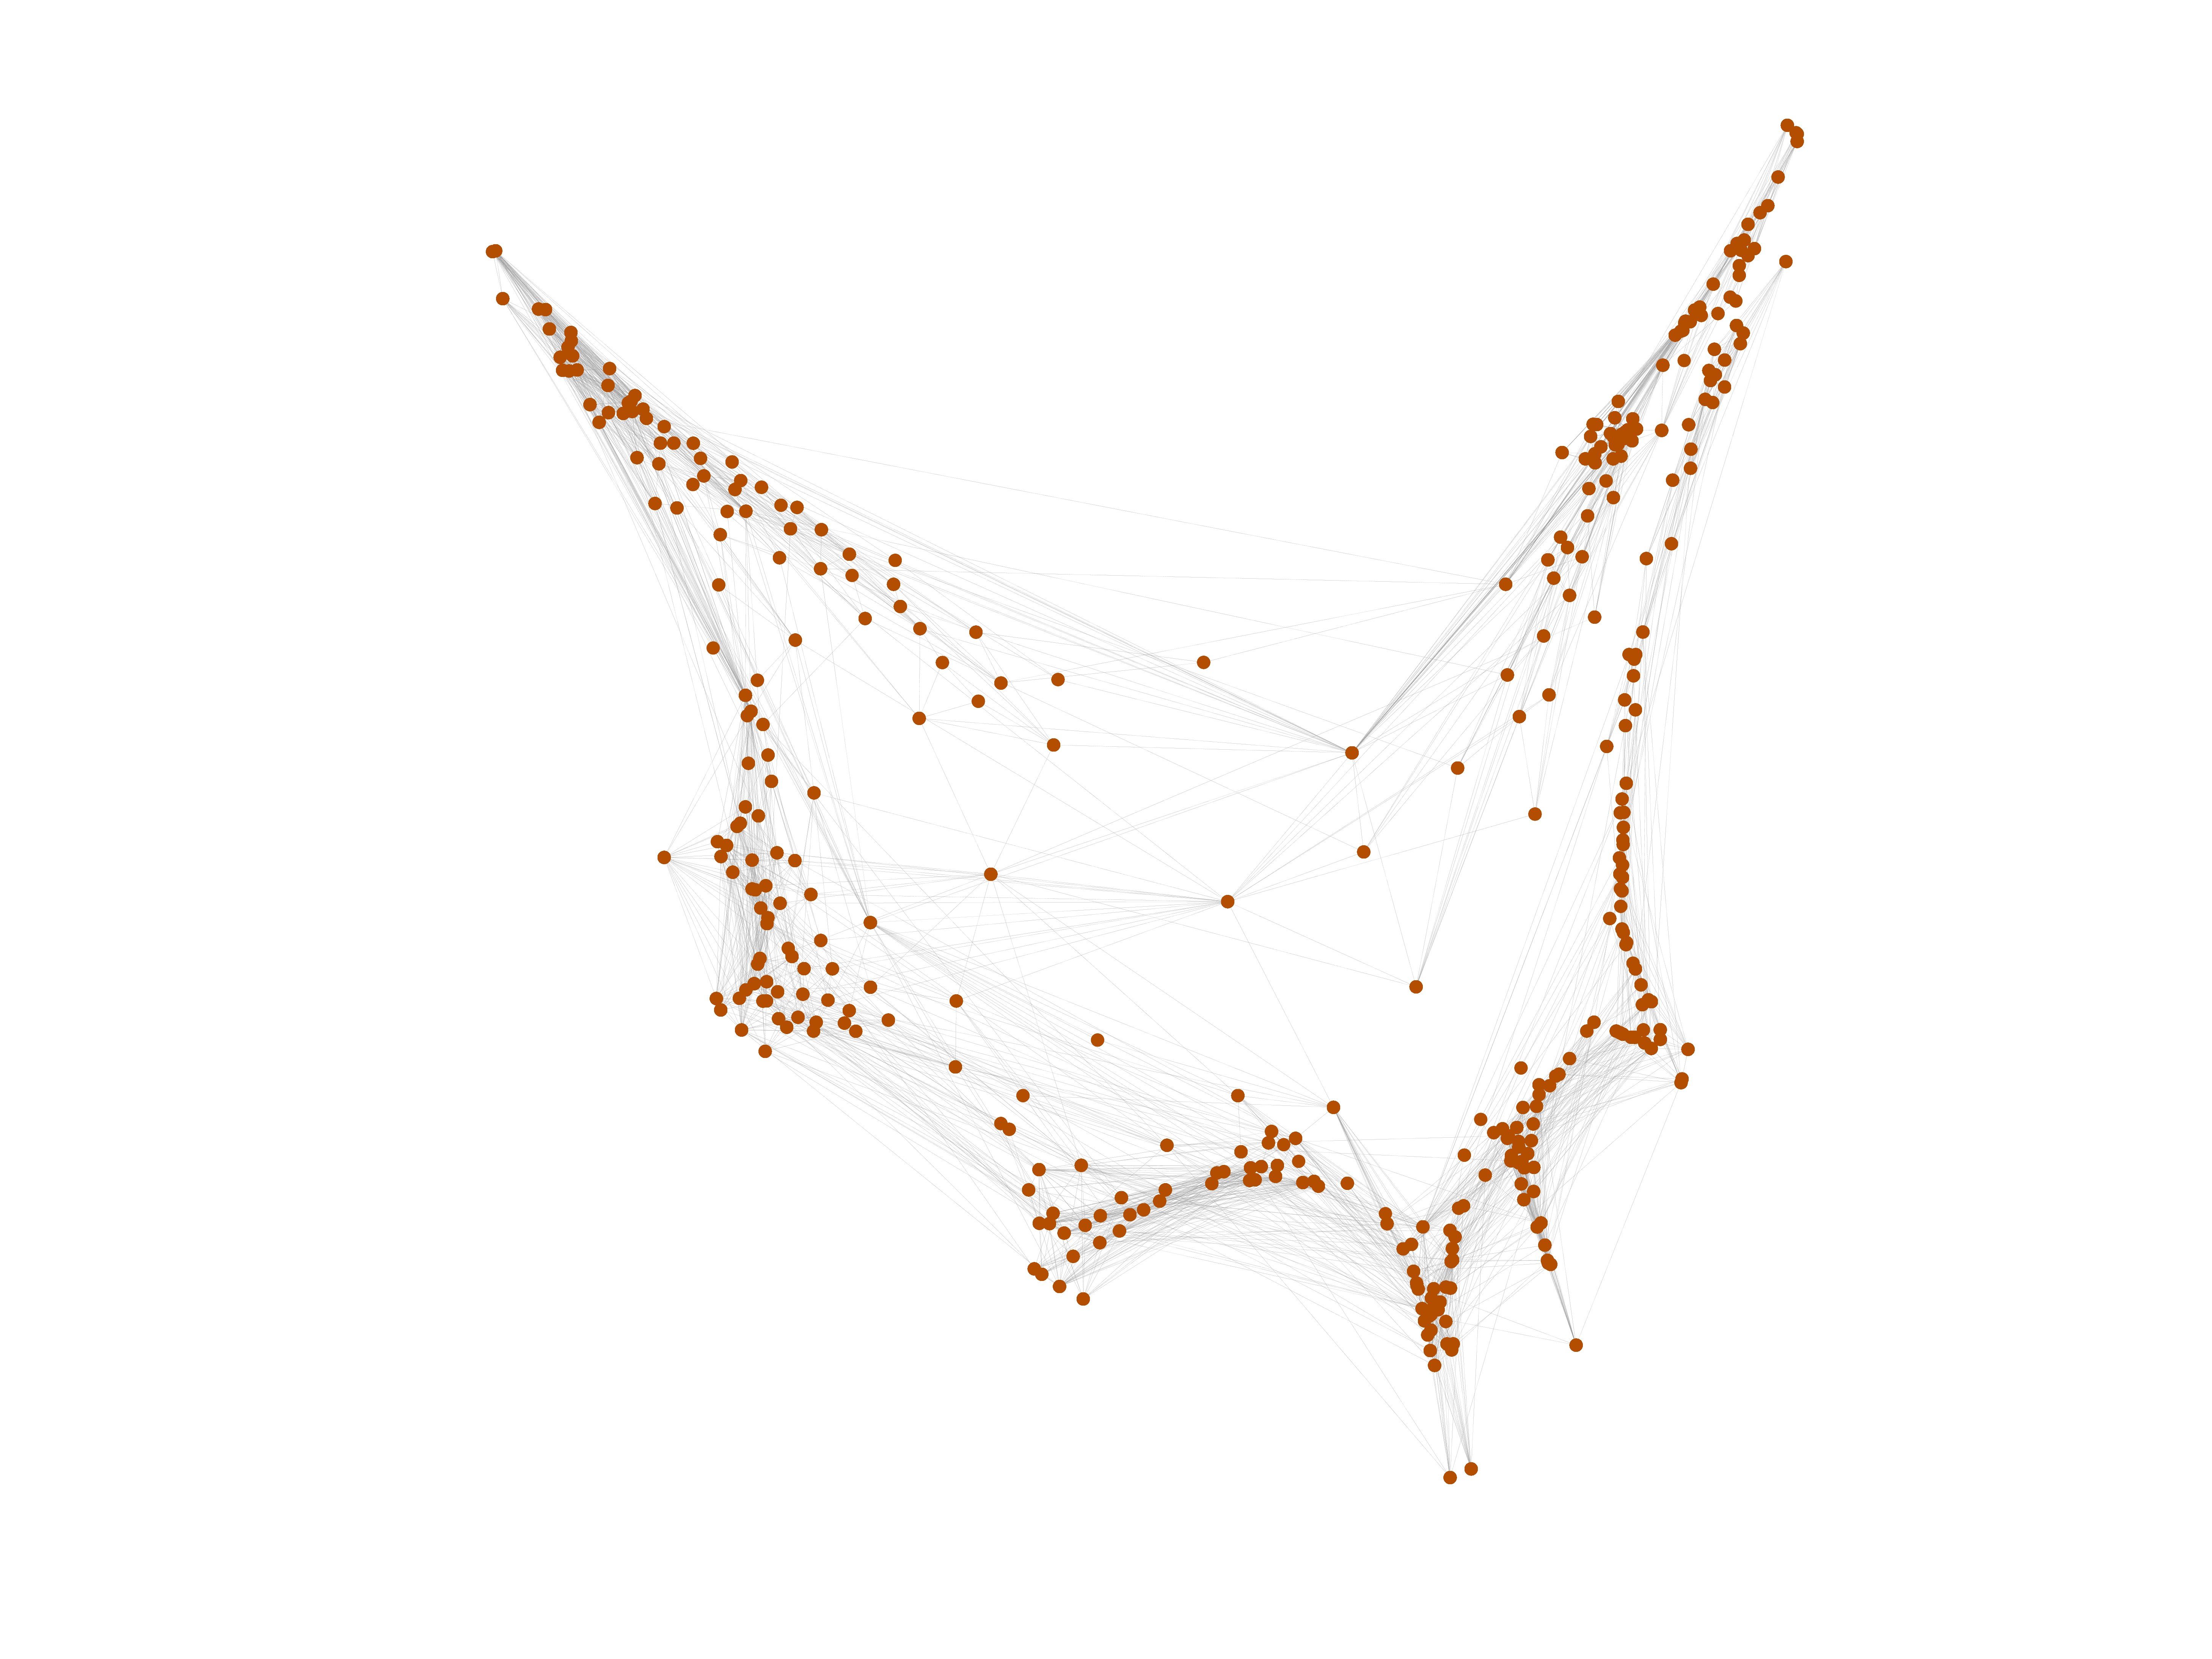
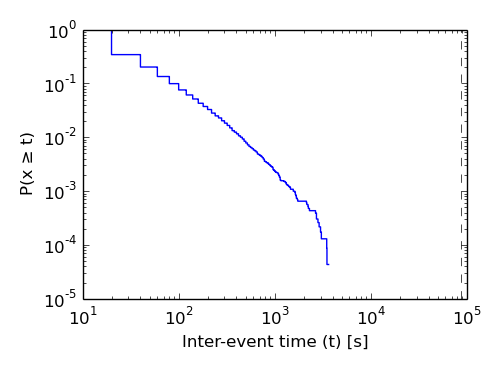
This network describes the face-to-face behavior of people during the exhibition INFECTIOUS: STAY AWAY in 2009 at the Science Gallery in Dublin. Nodes represent exhibition visitors; edges represent face-to-face contacts that were active for at least 20 seconds. Multiple edges between two nodes are possible and denote multiple contacts. The network contains the data from the day with the most interactions.

Metadata

CodeIf
Internal namesociopatterns-infectious
NameInfectious
Data sourcehttp://www.sociopatterns.org/
AvailabilityDataset is available for download
Consistency checkDataset passed all tests
Category
Human contact network
Dataset timestamp 2009-07-15
Node meaningVisitor
Edge meaningContact
Network formatUnipartite, undirected
Edge typeUnweighted, multiple edges
Temporal data Edges are annotated with timestamps
LoopsDoes not contain loops

Statistics

Size n =410
Volume m =17,298
Unique edge count m̿ =2,765
Loop count l =0
Wedge count s =48,984
Claw count z =347,591
Cross count x =2,141,809
Triangle count t =7,114
Square count q =81,287
4-Tour count T4 =851,762
Maximum degree dmax =294
Average degree d =84.380 5
Fill p =0.032 977 5
Average edge multiplicity m̃ =6.256 06
Size of LCC N =410
Diameter δ =9
50-Percentile effective diameter δ0.5 =3.019 32
90-Percentile effective diameter δ0.9 =4.783 01
Median distance δM =4
Mean distance δm =3.567 94
Gini coefficient G =0.389 742
Balanced inequality ratio P =0.358 481
Relative edge distribution entropy Her =0.967 681
Power law exponent γ =1.424 06
Tail power law exponent γt =6.421 00
Tail power law exponent with p γ3 =6.421 00
p-value p =0.879 000
Degree assortativity ρ =+0.225 752
Degree assortativity p-value pρ =7.673 17 × 10−65
Clustering coefficient c =0.435 693
Spectral norm α =210.048
Algebraic connectivity a =0.378 713
Spectral separation 1[A] / λ2[A]| =1.081 97
Non-bipartivity bA =0.084 991 9
Normalized non-bipartivity bN =0.364 710
Algebraic non-bipartivity χ =0.645 453
Spectral bipartite frustration bK =0.011 963 6
Controllability C =2
Relative controllability Cr =0.004 878 05

Plots

Fruchterman–Reingold graph drawing

Degree distribution

Cumulative degree distribution

Lorenz curve

Spectral distribution of the adjacency matrix

Spectral distribution of the normalized adjacency matrix

Spectral distribution of the Laplacian

Spectral graph drawing based on the adjacency matrix

Spectral graph drawing based on the Laplacian

Spectral graph drawing based on the normalized adjacency matrix

Degree assortativity

Zipf plot

Hop distribution

Double Laplacian graph drawing

Delaunay graph drawing

Edge weight/multiplicity distribution

Clustering coefficient distribution

Average neighbor degree distribution

Temporal distribution

Temporal hop distribution

Diameter/density evolution

SynGraphy

Inter-event distribution

Node-level inter-event distribution

Matrix decompositions plots

Downloads

References

[1] Jérôme Kunegis. KONECT – The Koblenz Network Collection. In Proc. Int. Conf. on World Wide Web Companion, pages 1343–1350, 2013. [ http ]
[2] Lorenzo Isella, Juliette Stehlé, Alain Barrat, Ciro Cattuto, Jean-François Pinton, and Wouter Van den Broeck. What's in a crowd? analysis of face-to-face behavioral networks. J. of Theoretical Biology, 271(1):166–180, 2011.