Ask Ubuntu
These are interactions from the StackExchange site "Ask Ubuntu". The network
is between users, and directed edges represent three types of interactions:
answering a question of another user, commenting on another user's question,
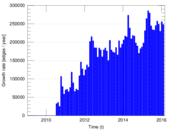
and commenting on another user's answer. The network is temporal. This
network is part of a series of network from multiple StackExchange sites.
Metadata
Statistics
| Size | n = | 159,316
|
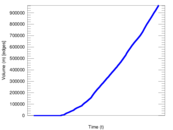
| Volume | m = | 964,437
|
| Unique edge count | m̿ = | 596,933
|
| Wedge count | s = | 188,156,256
|
| Claw count | z = | 252,705,958,594
|
| Cross count | x = | 249,885,857,271,550
|
| Triangle count | t = | 680,407
|
| Square count | q = | 71,698,775
|
| 4-Tour count | T4 = | 1,327,126,606
|
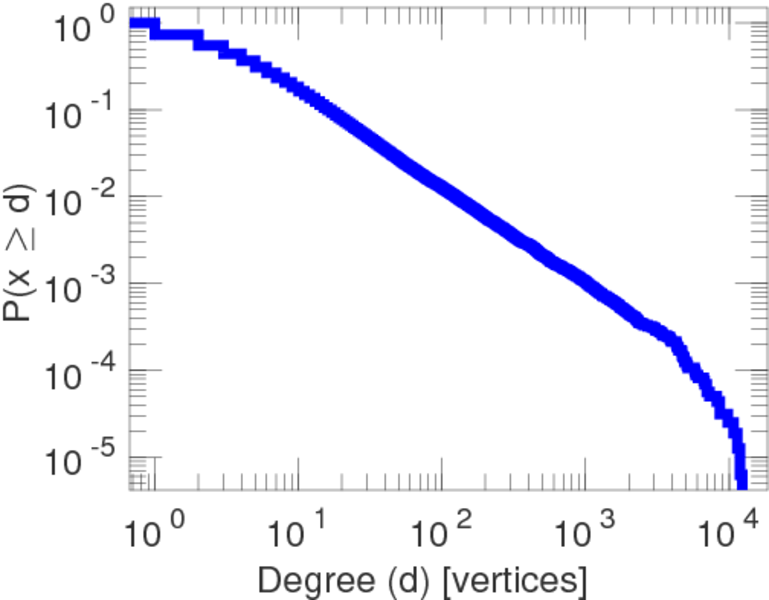
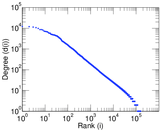
| Maximum degree | dmax = | 12,316
|
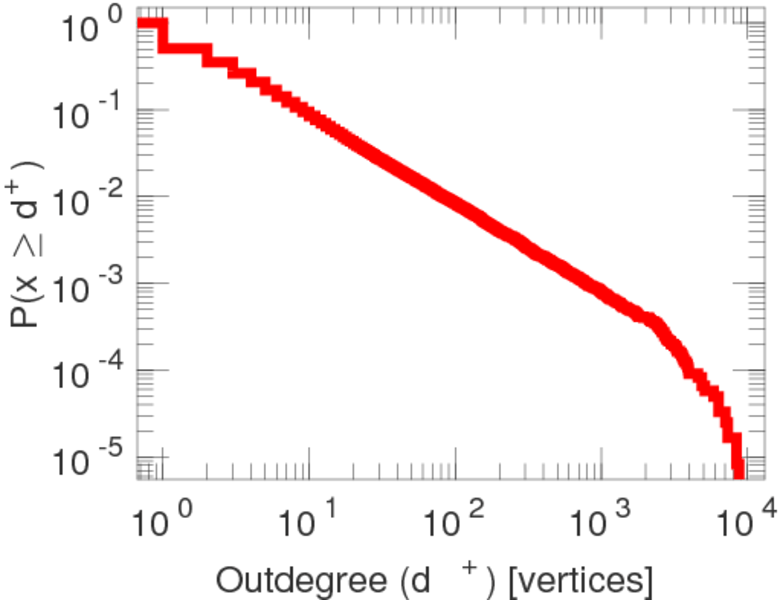
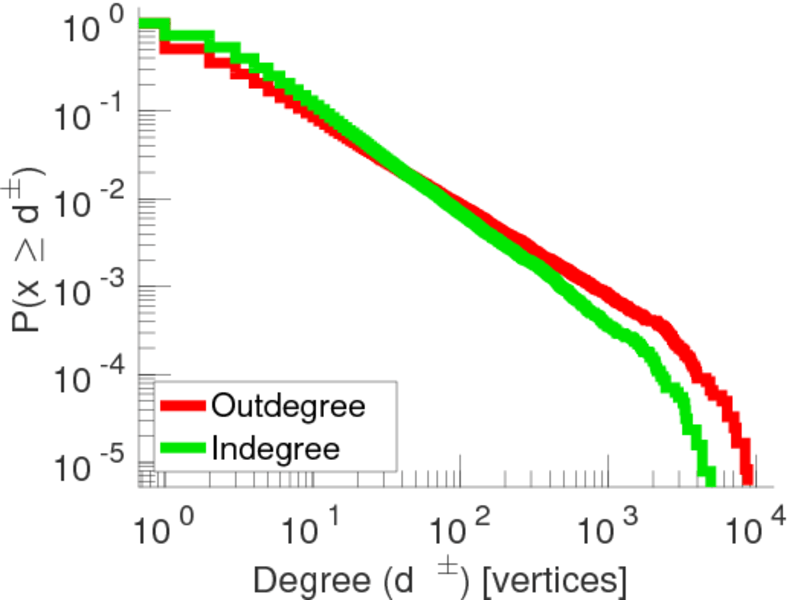
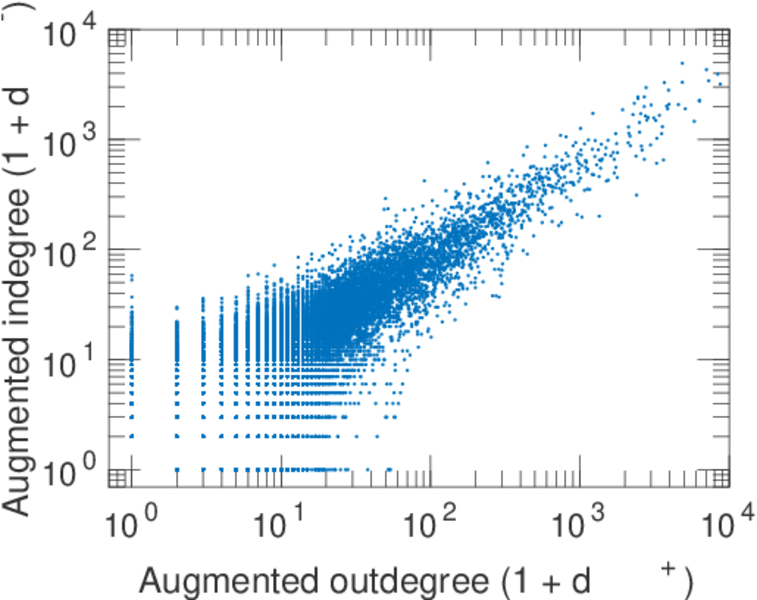
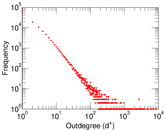
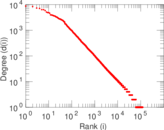
| Maximum outdegree | d+max = | 8,729
|
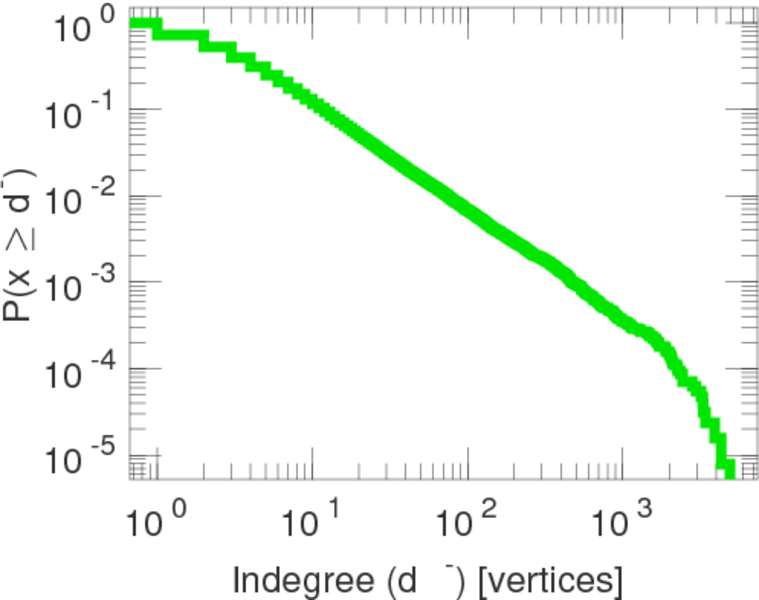
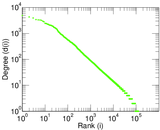
| Maximum indegree | d−max = | 4,926
|
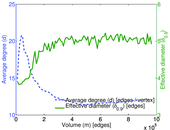
| Average degree | d = | 12.107 2
|
| Fill | p = | 2.351 83 × 10−5
|
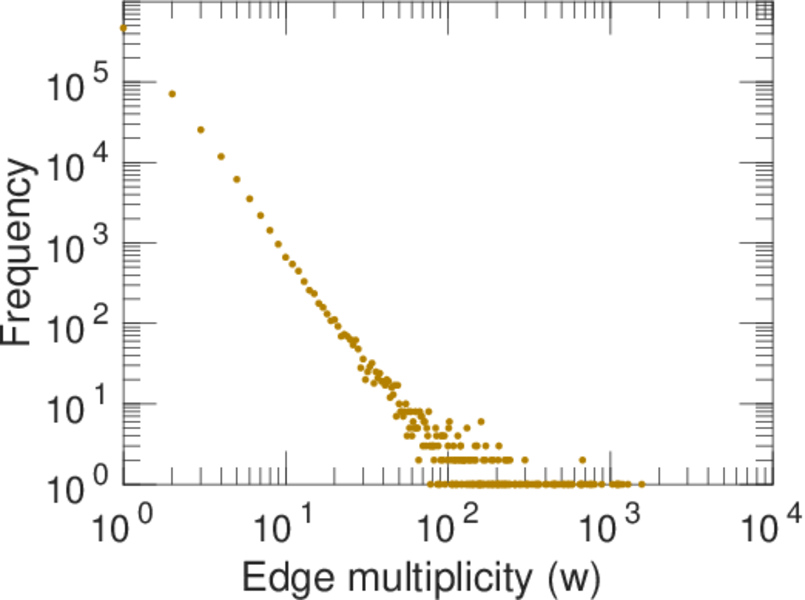
| Average edge multiplicity | m̃ = | 1.615 65
|
| Size of LCC | N = | 152,599
|
| Size of LSCC | Ns = | 59,813
|
| Relative size of LSCC | Nrs = | 0.375 436
|
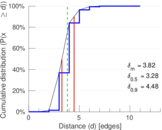
| Diameter | δ = | 13
|
| 50-Percentile effective diameter | δ0.5 = | 3.278 48
|
| 90-Percentile effective diameter | δ0.9 = | 4.482 80
|
| Median distance | δM = | 4
|
| Mean distance | δm = | 3.819 30
|
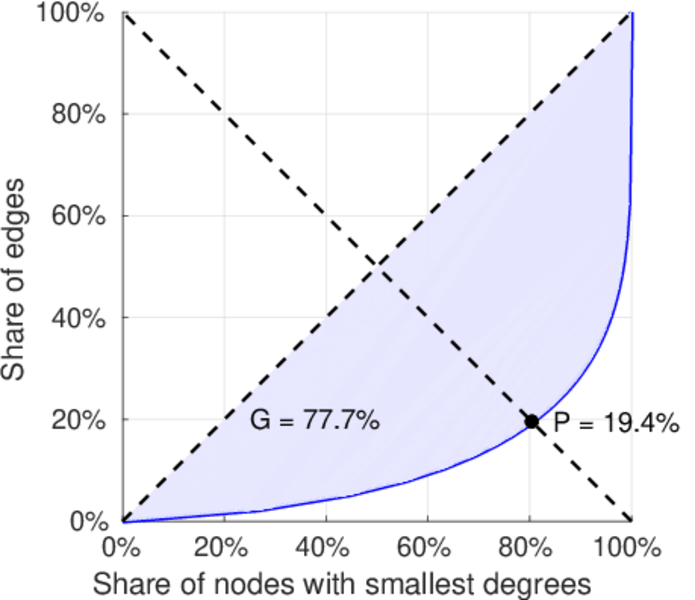
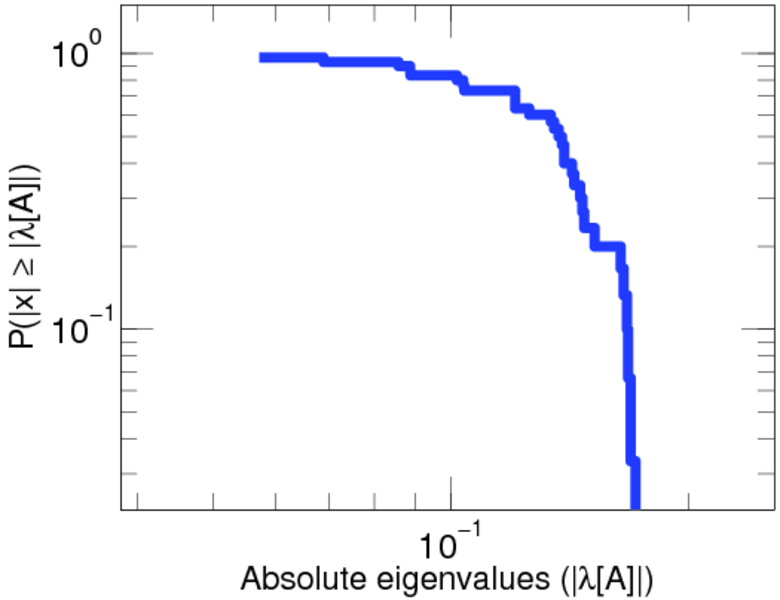
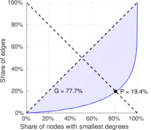
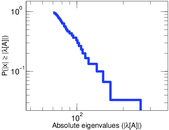
| Balanced inequality ratio | P = | 0.194 306
|
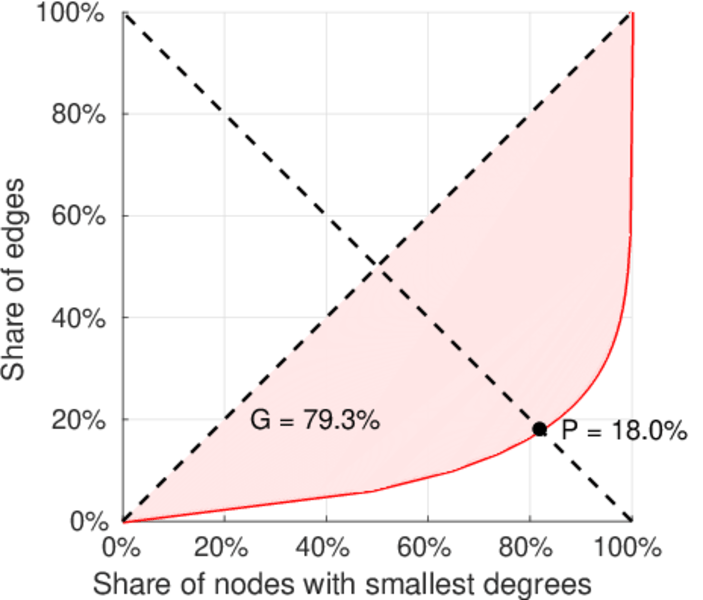
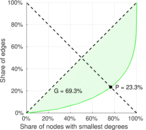
| Outdegree balanced inequality ratio | P+ = | 0.179 595
|
| Indegree balanced inequality ratio | P− = | 0.232 914
|
| Relative edge distribution entropy | Her = | 0.857 714
|
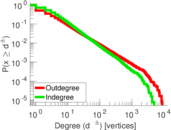
| Tail power law exponent | γt = | 2.141 00
|
| Tail power law exponent with p | γ3 = | 2.141 00
|
| p-value | p = | 0.367 000
|
| Outdegree tail power law exponent with p | γ3,o = | 2.001 00
|
| Outdegree p-value | po = | 0.822 000
|
| Indegree tail power law exponent with p | γ3,i = | 2.361 00
|
| Indegree p-value | pi = | 0.446 000
|
| Degree assortativity | ρ = | −0.155 792
|
| Degree assortativity p-value | pρ = | 0.000 00
|
| In/outdegree correlation | ρ± = | +0.654 317
|
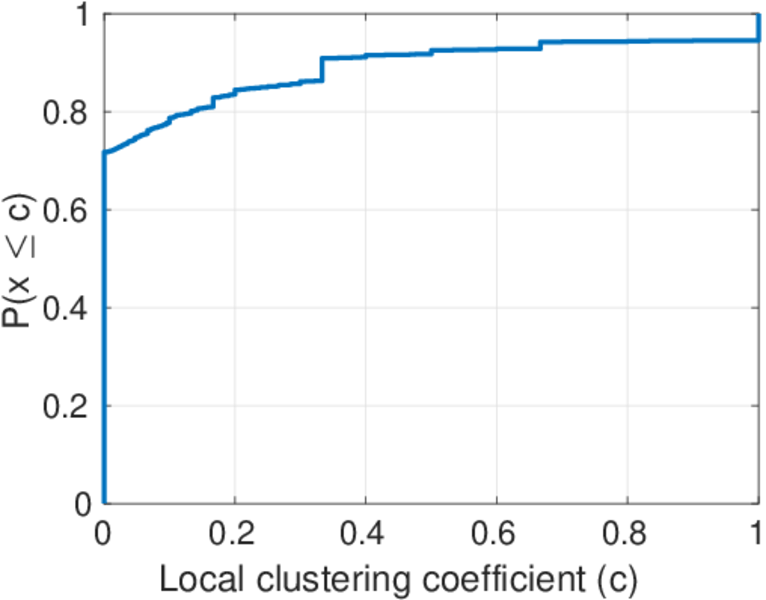
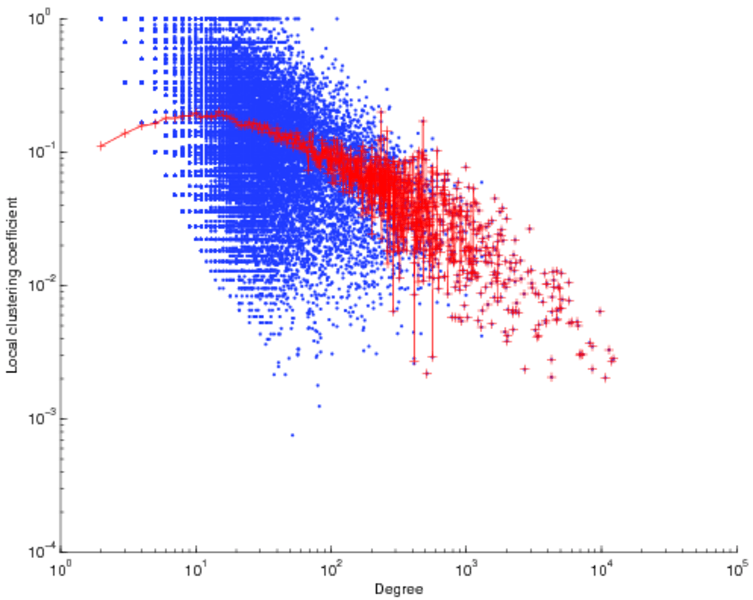
| Clustering coefficient | c = | 0.010 848 5
|
| Directed clustering coefficient | c± = | 0.013 786 8
|
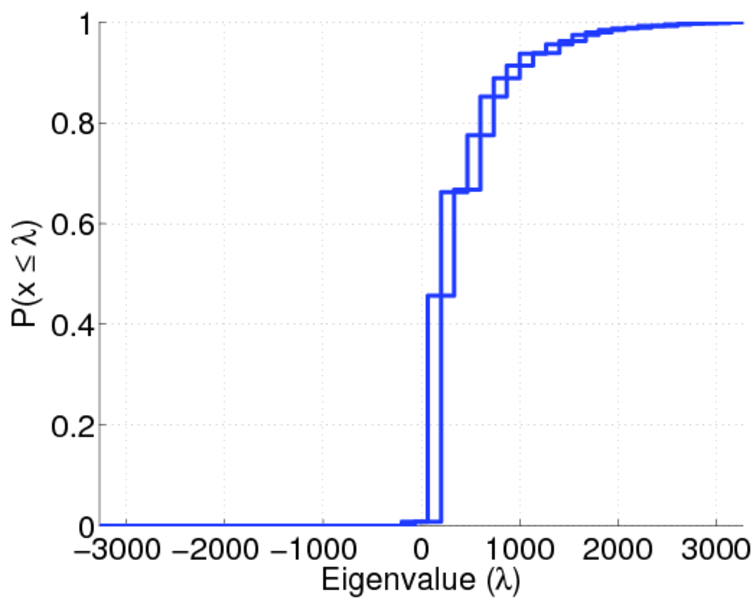
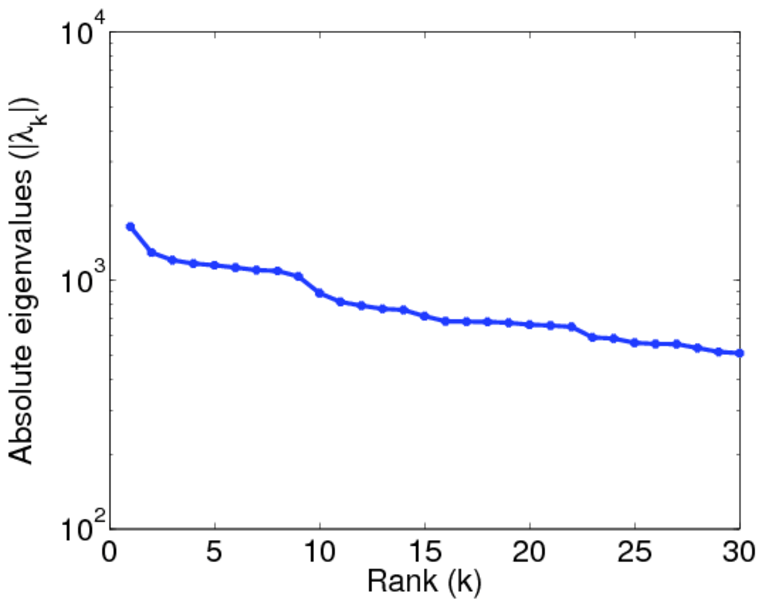
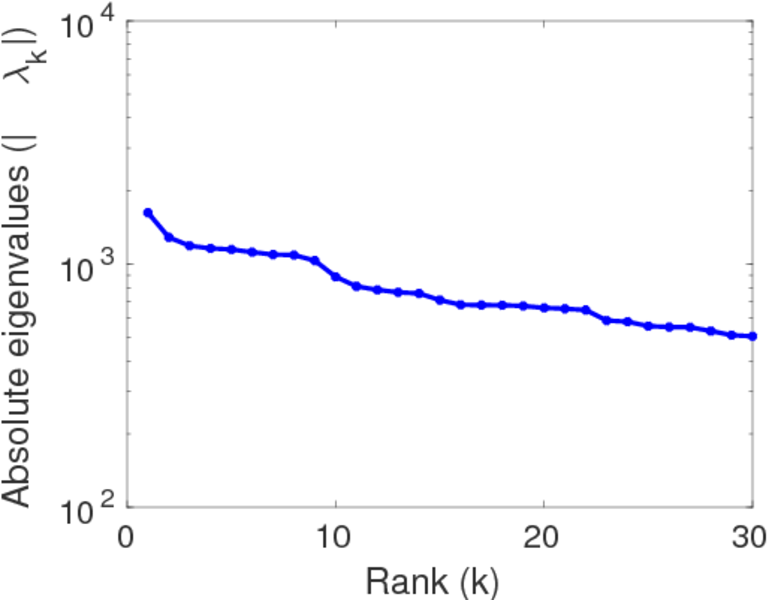
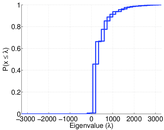
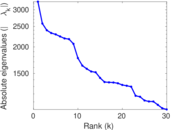
| Spectral norm | α = | 3,277.17
|
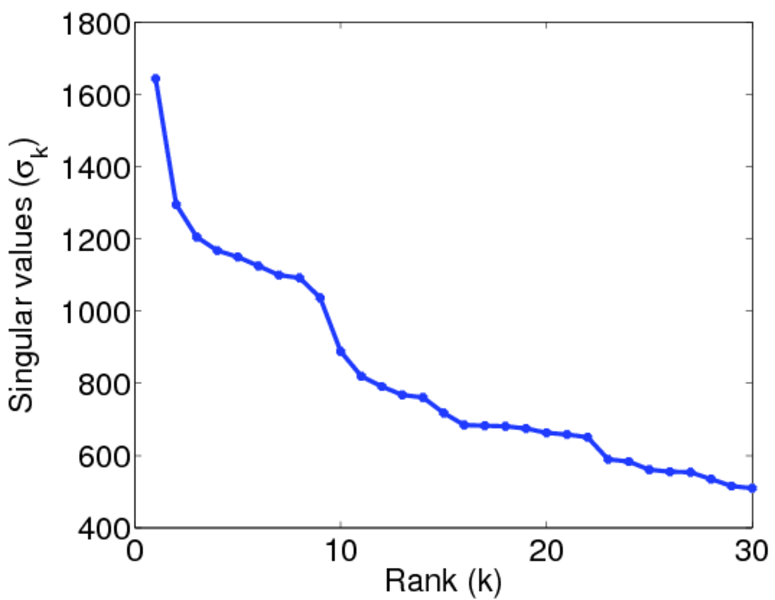
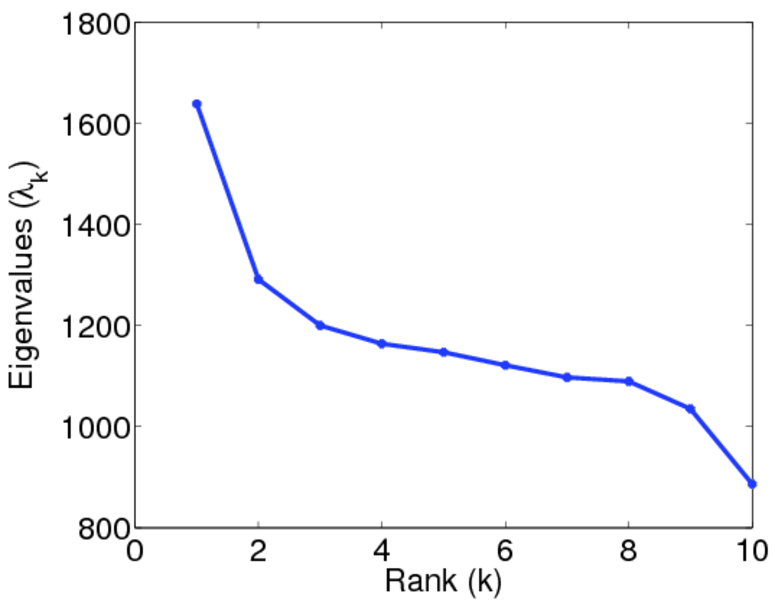
| Operator 2-norm | ν = | 1,643.72
|
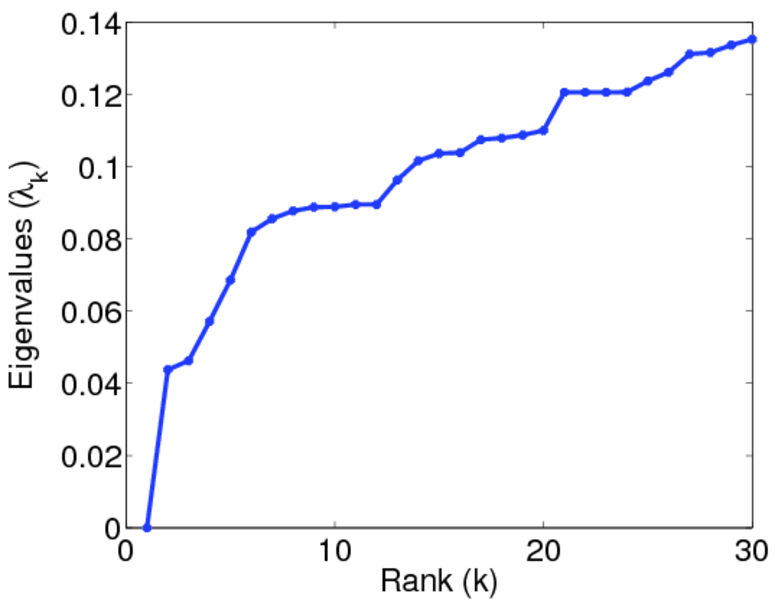
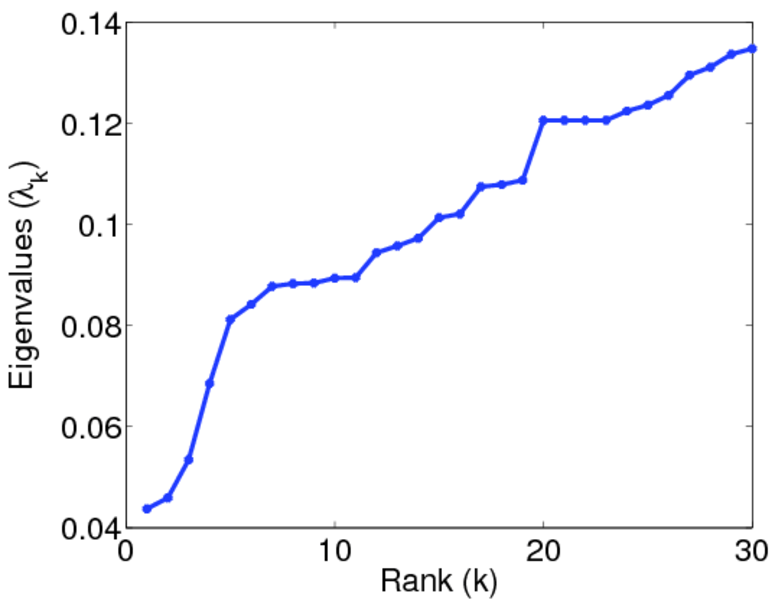
| Algebraic connectivity | a = | 0.043 786 1
|
| Reciprocity | y = | 0.385 591
|
| Normalized non-bipartivity | bN = | 0.027 748 7
|
| Spectral bipartite frustration | bK = | 0.001 856 31
|
| Controllability | C = | 78,044
|
| Relative controllability | Cr = | 0.489 869
|
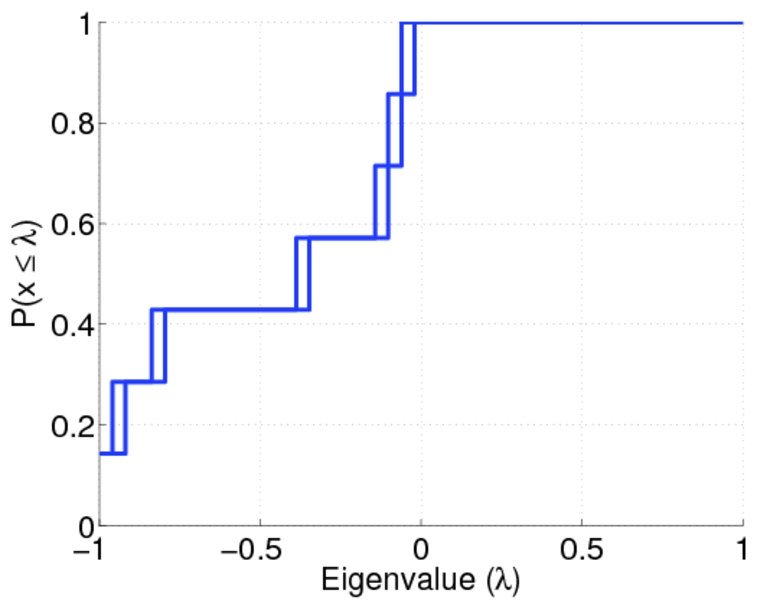
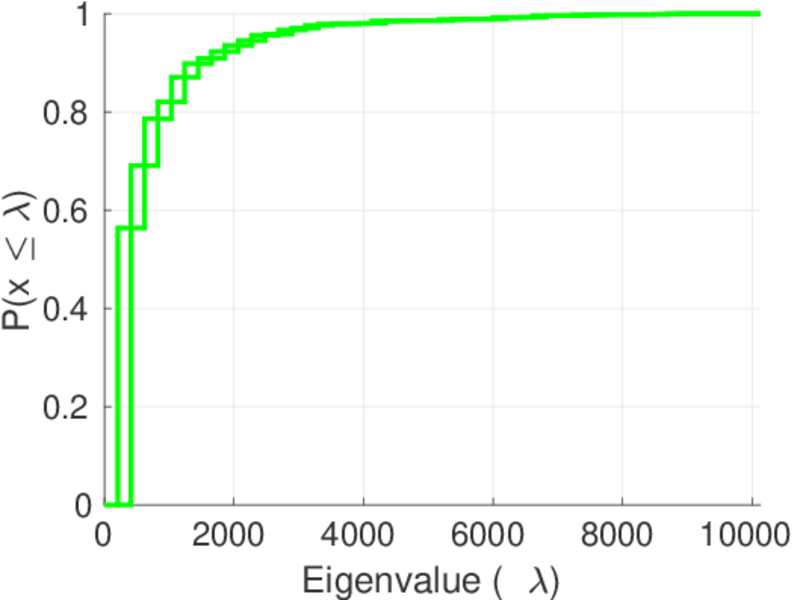
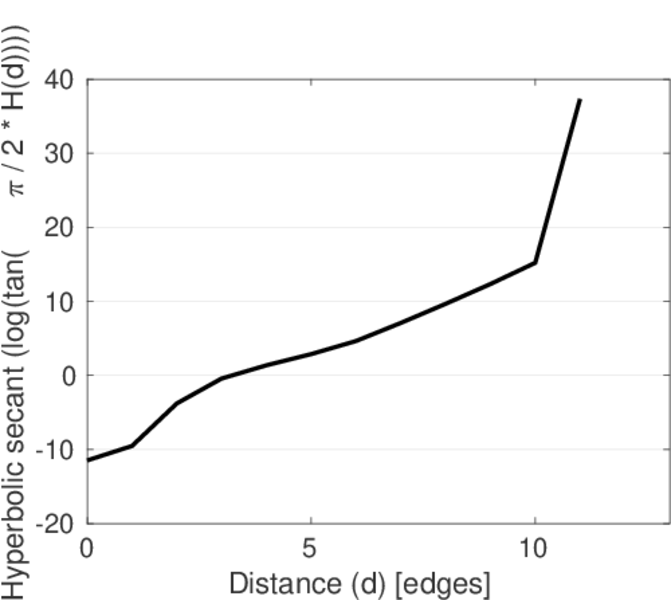
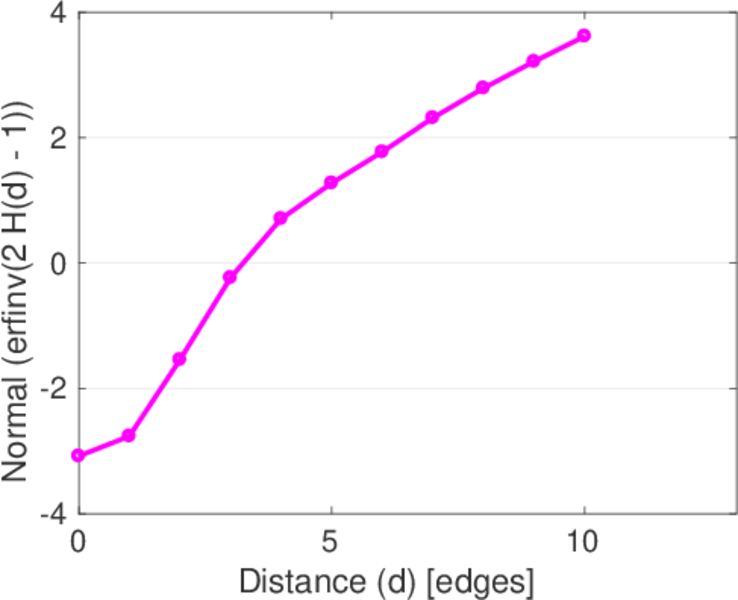
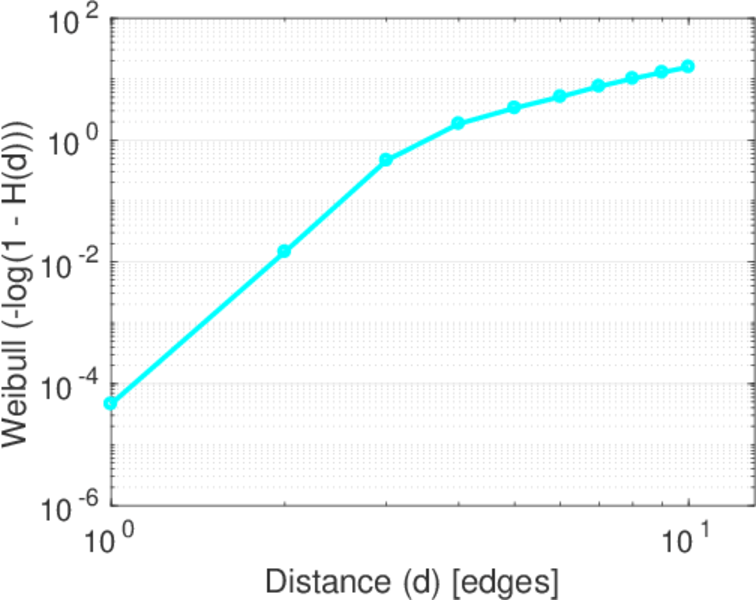
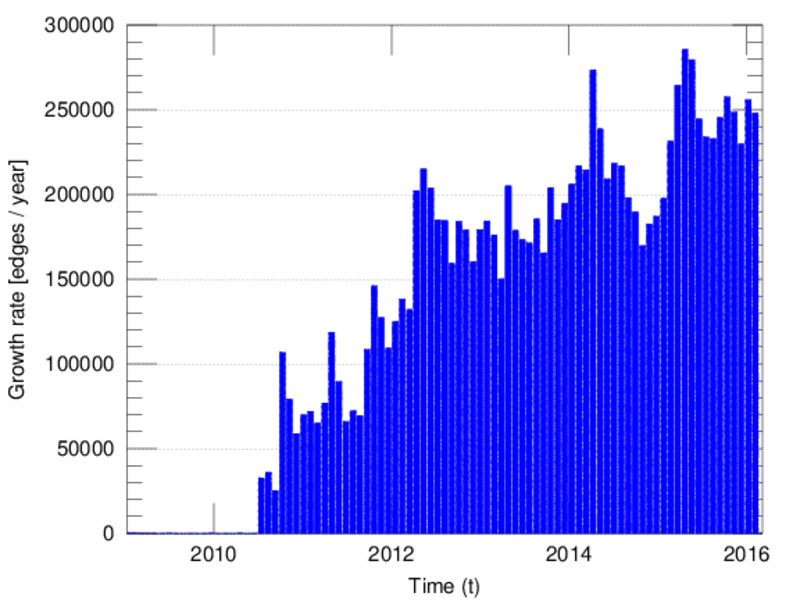
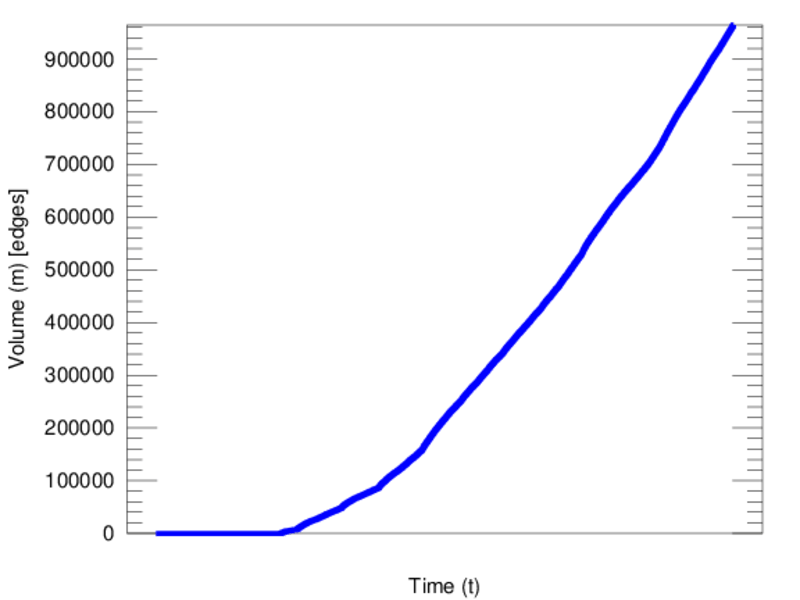
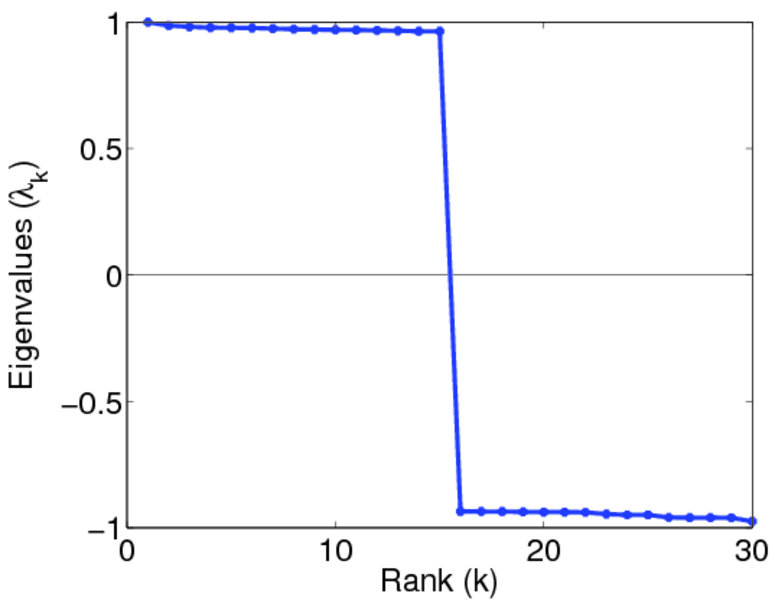
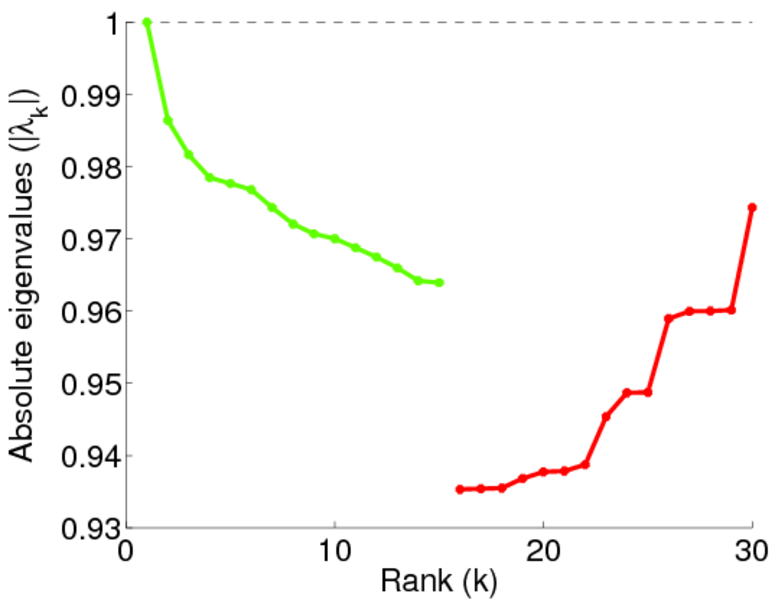
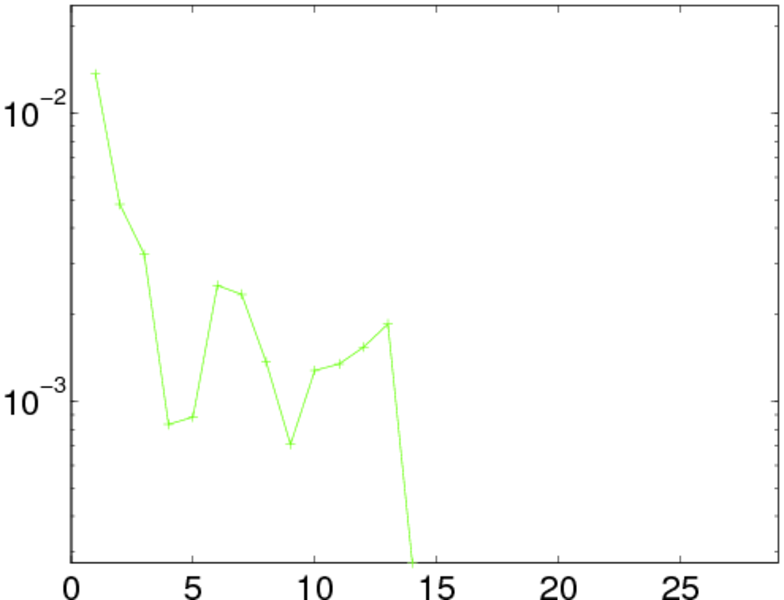
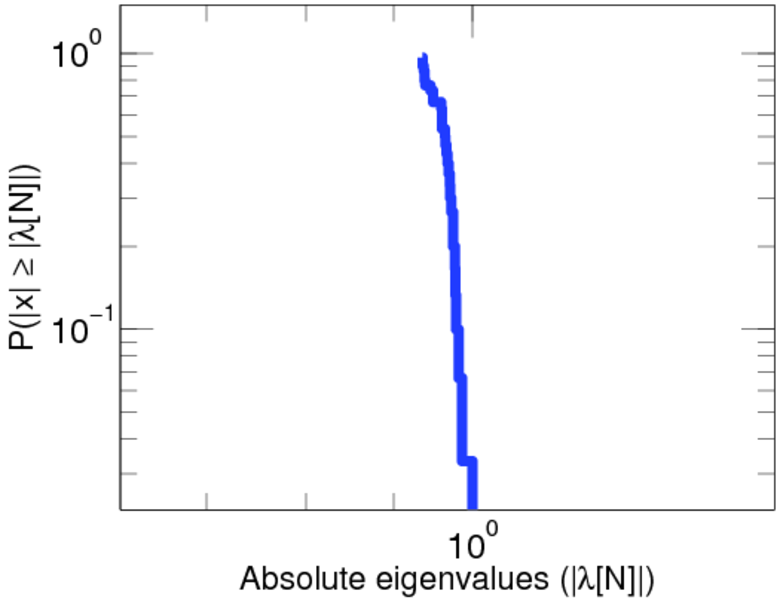
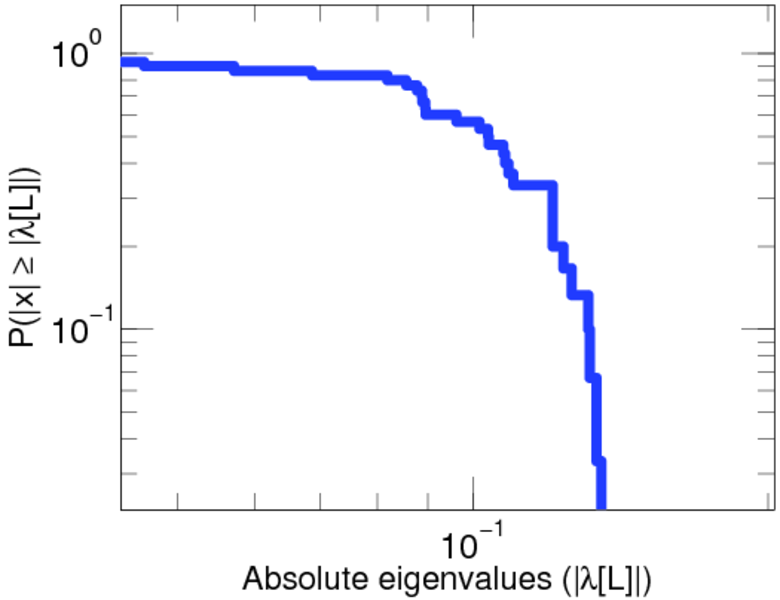
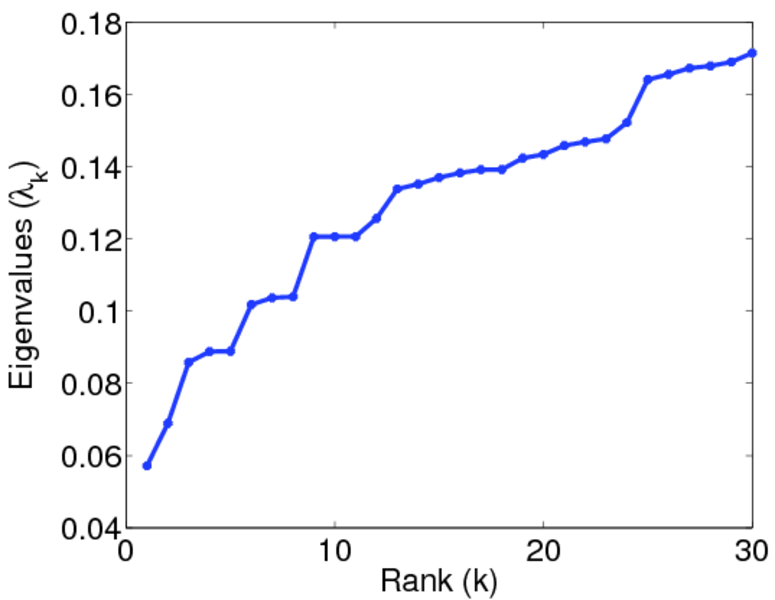
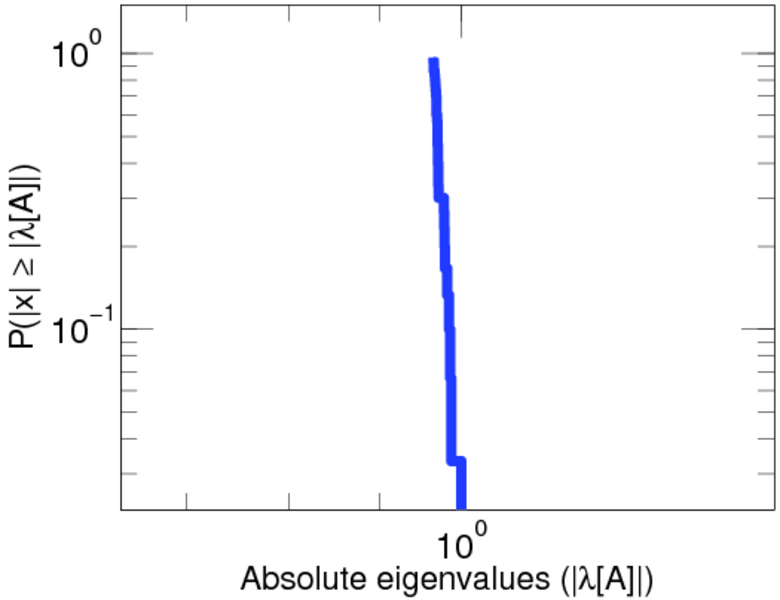
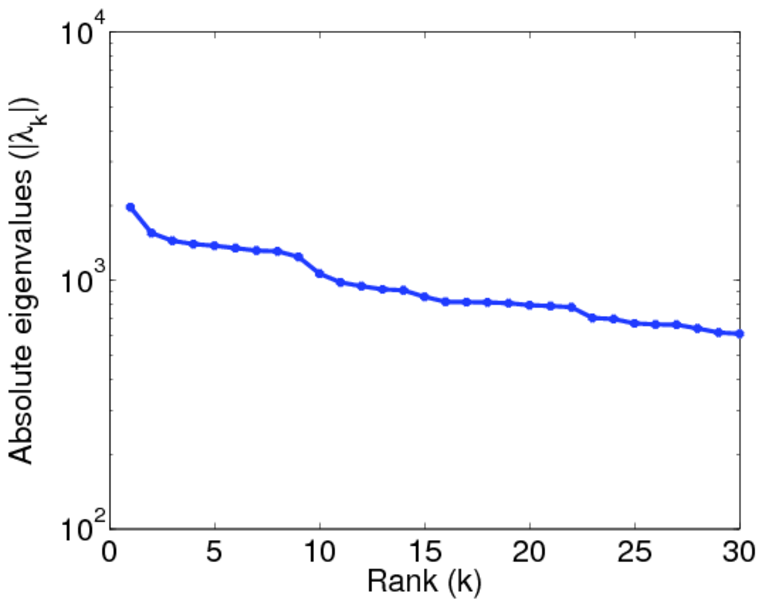
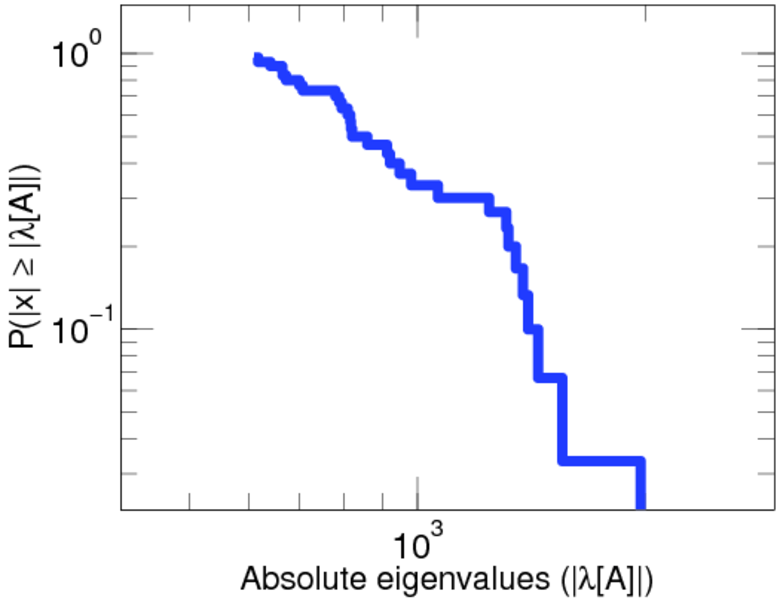
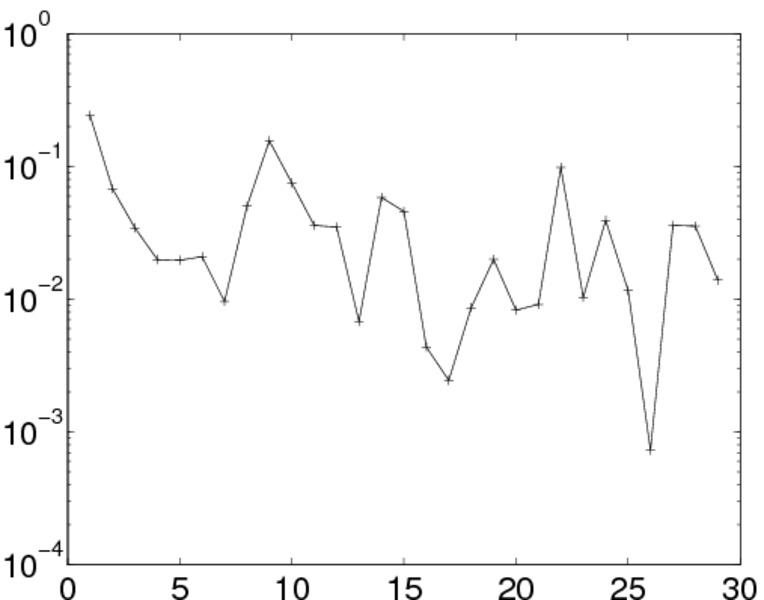
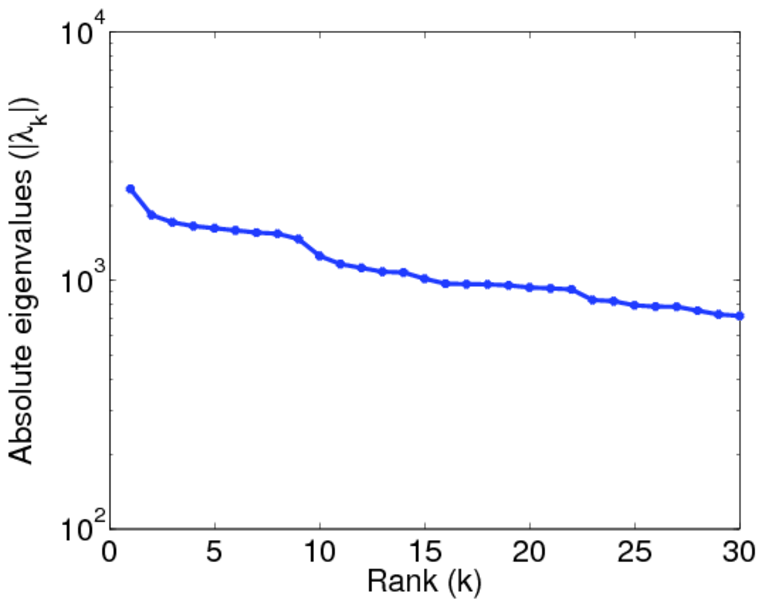
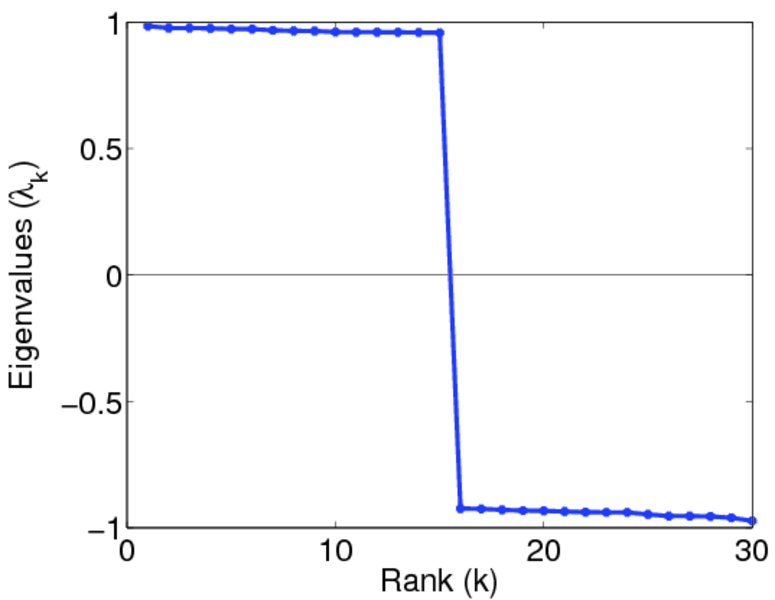
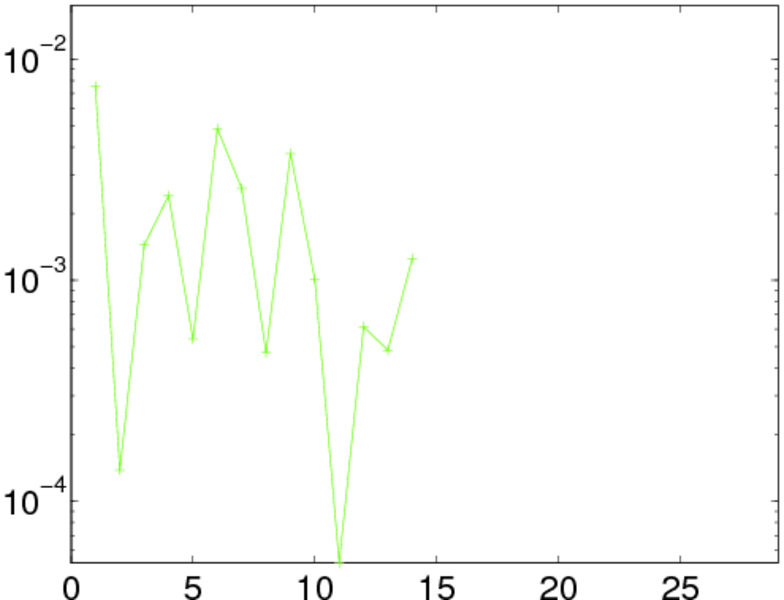
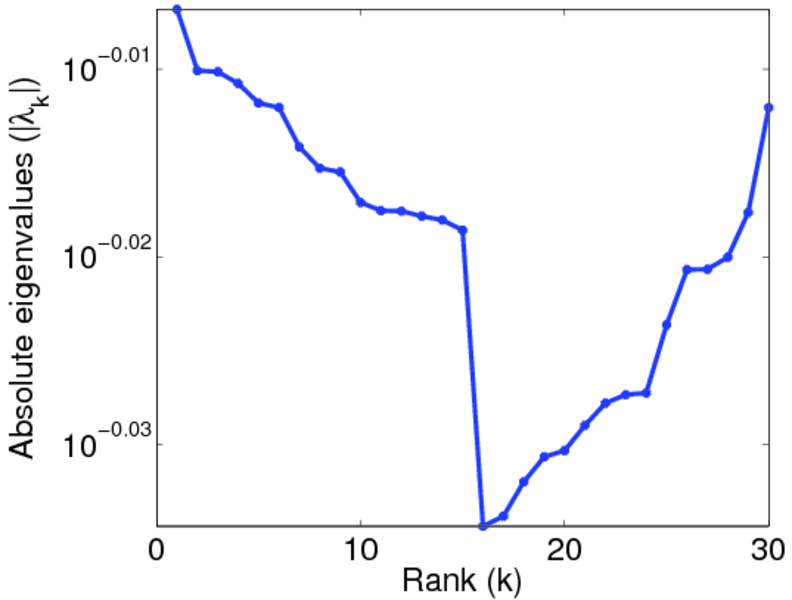
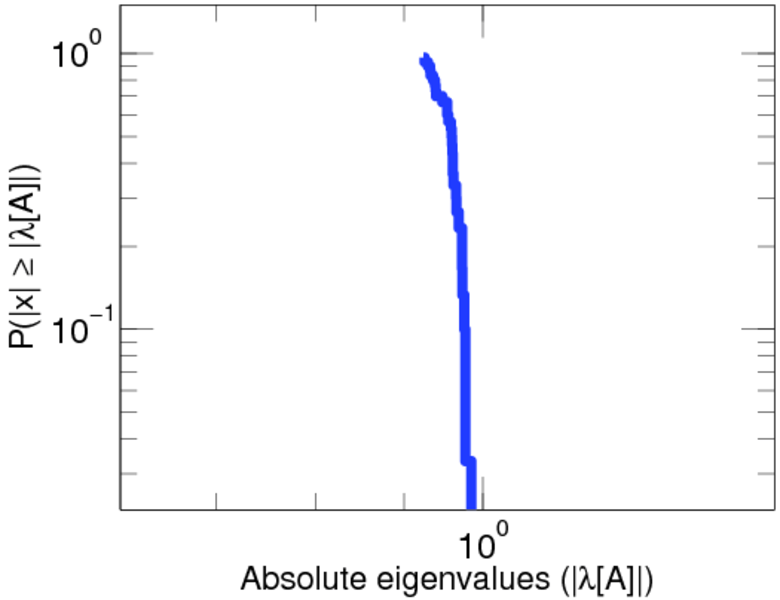
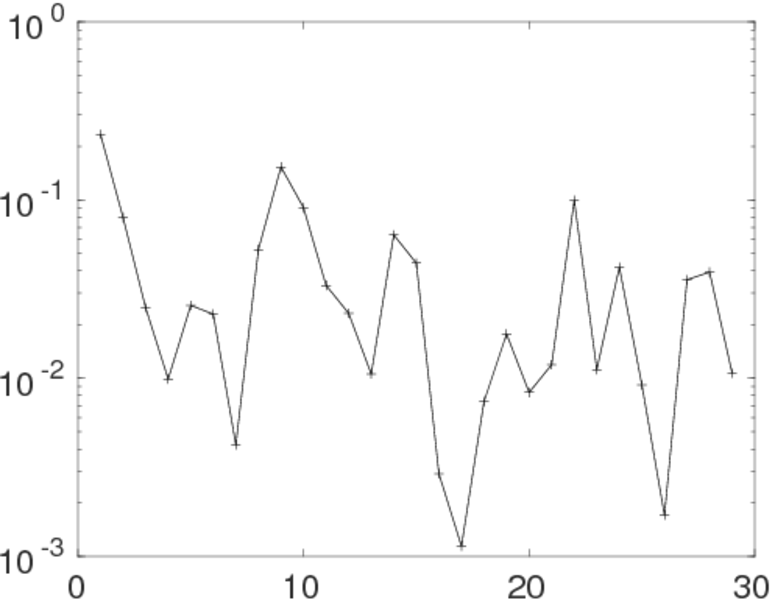
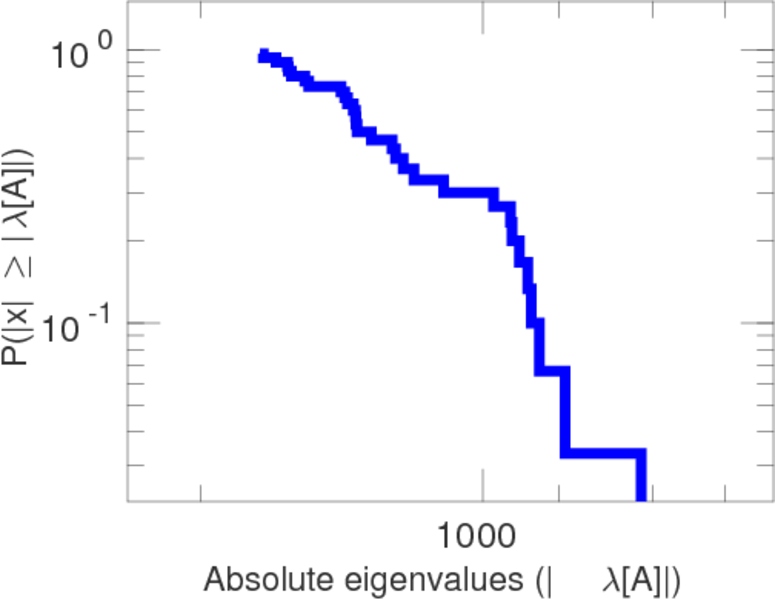
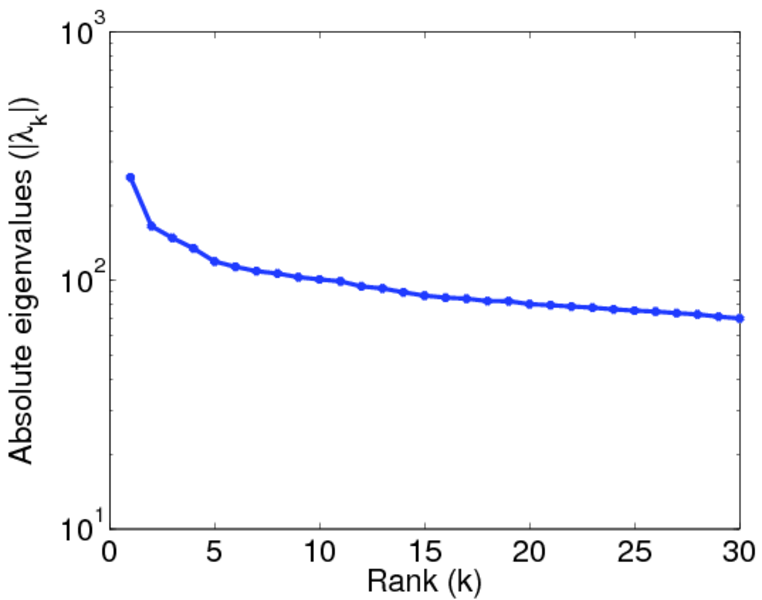
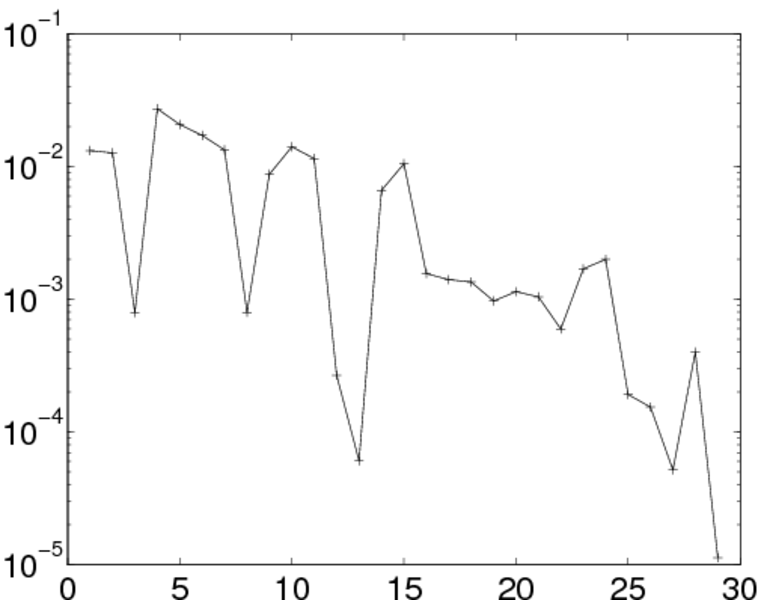
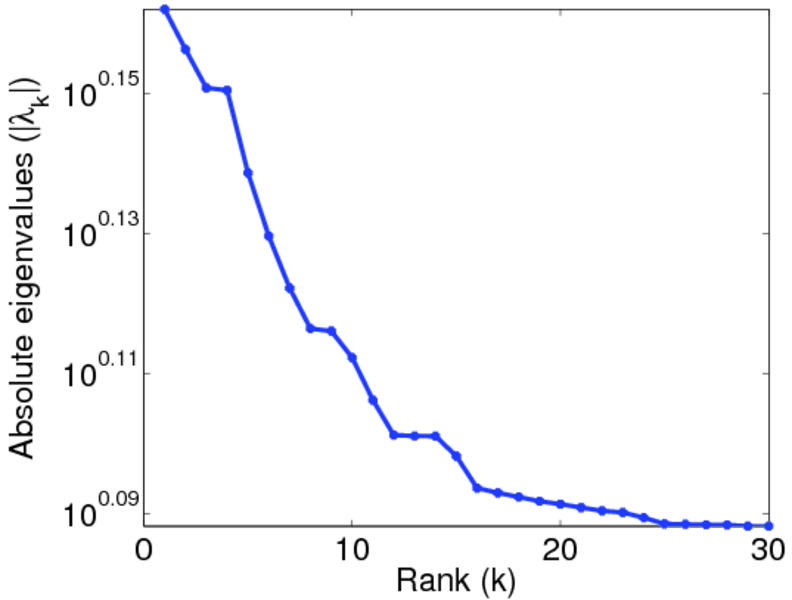
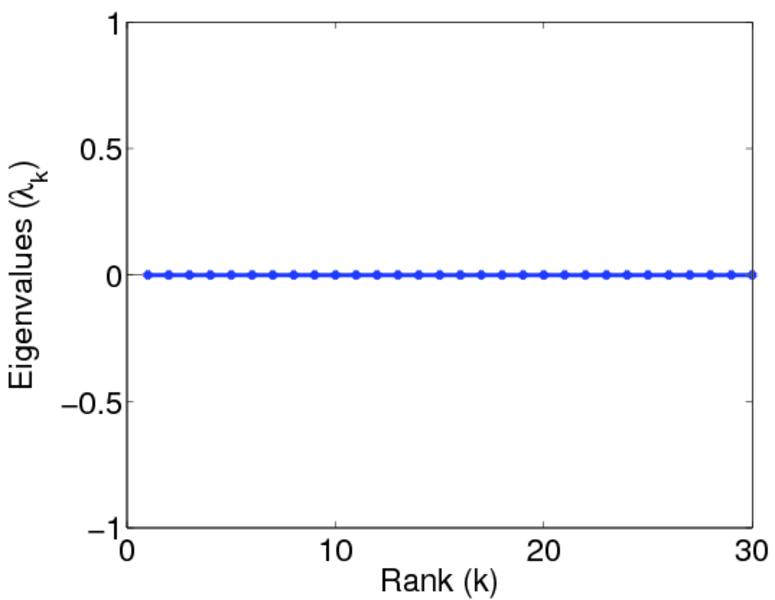
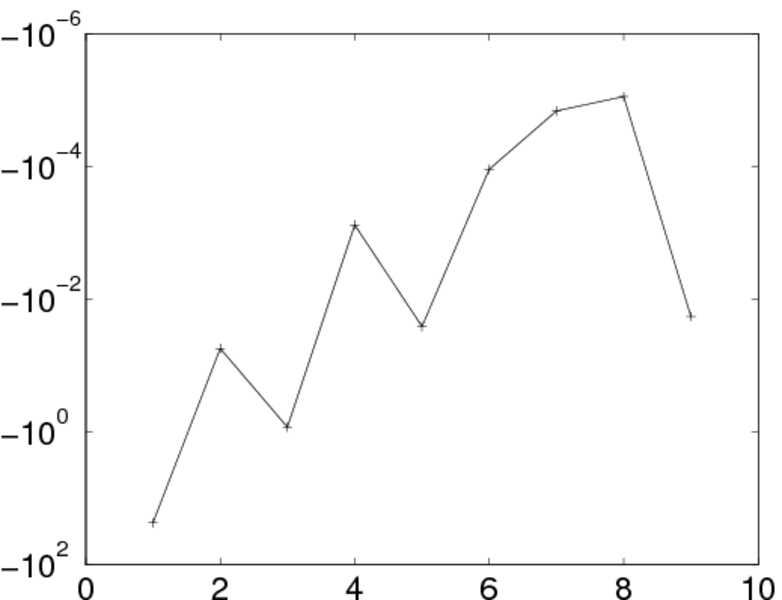
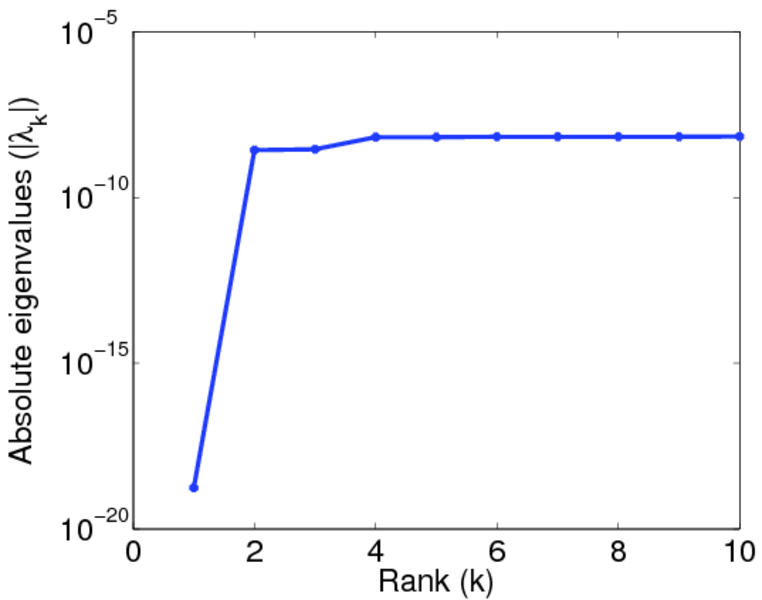
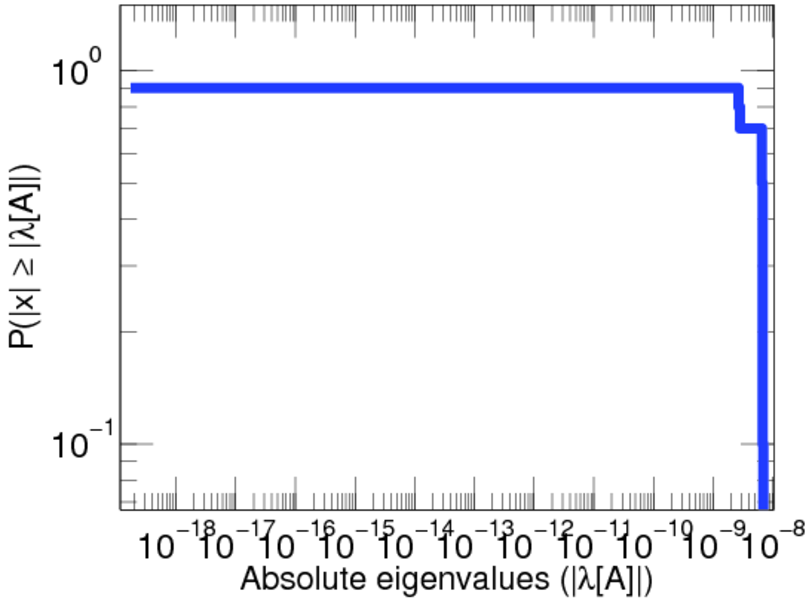
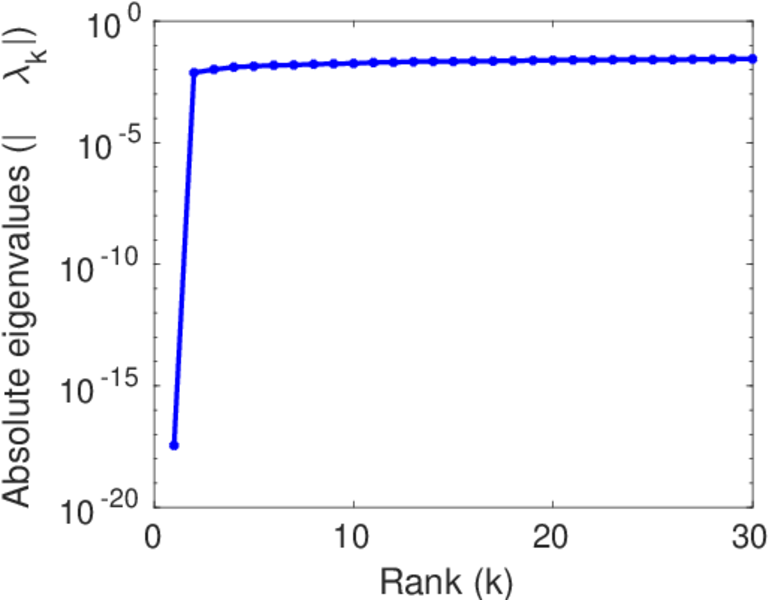
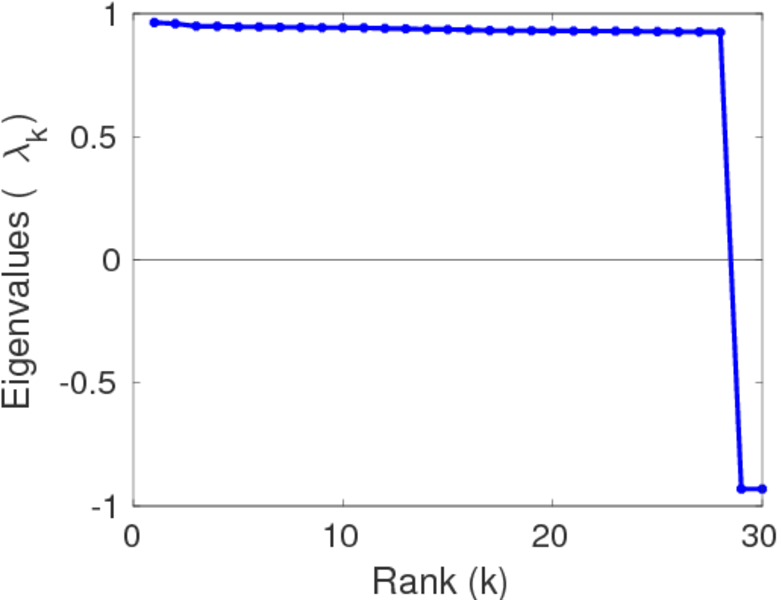
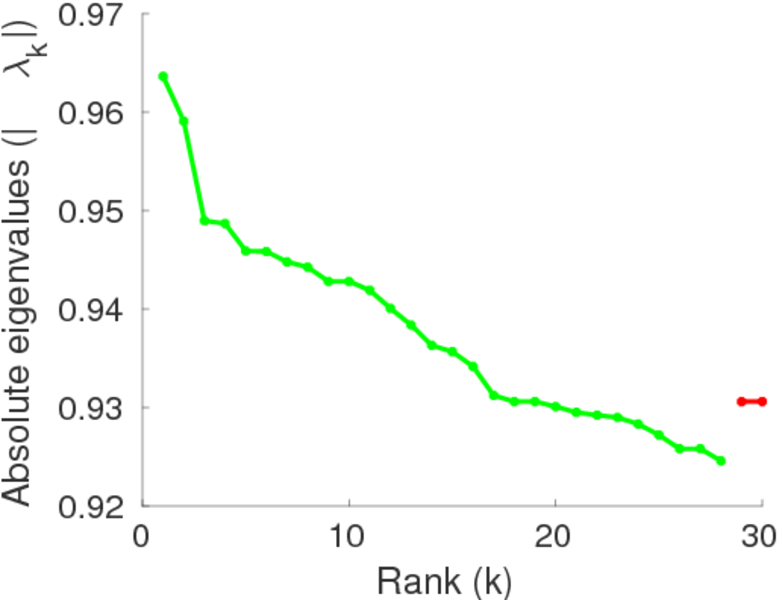
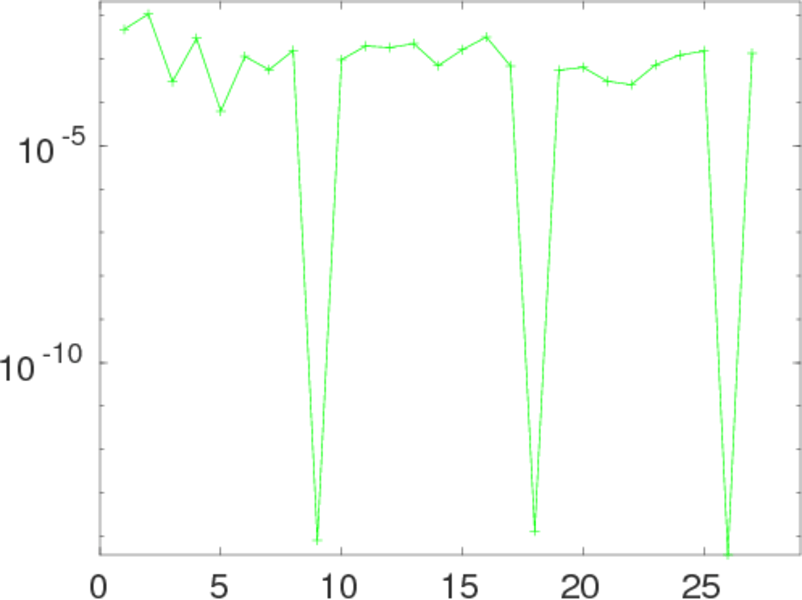
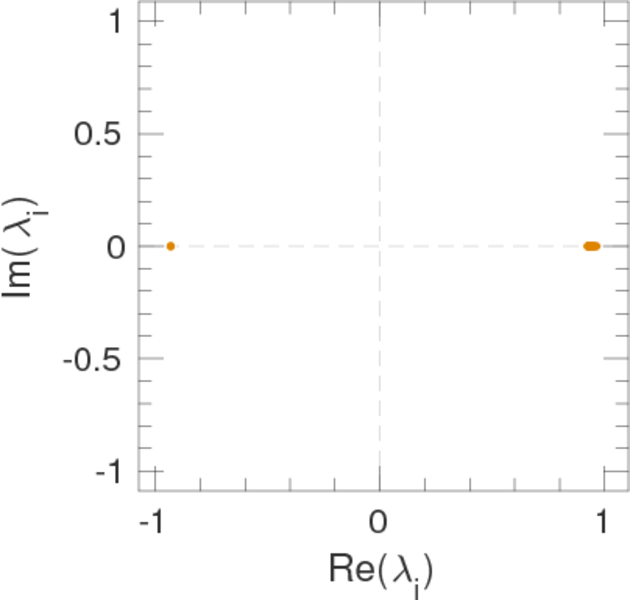
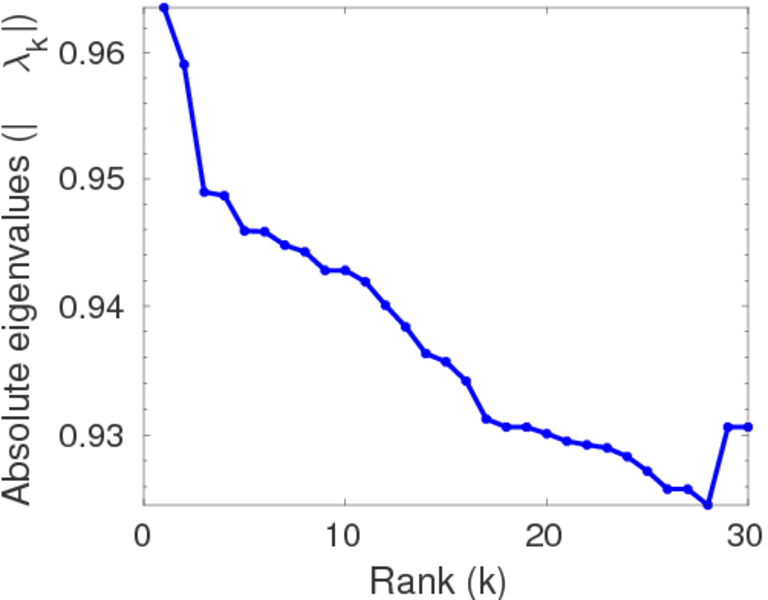
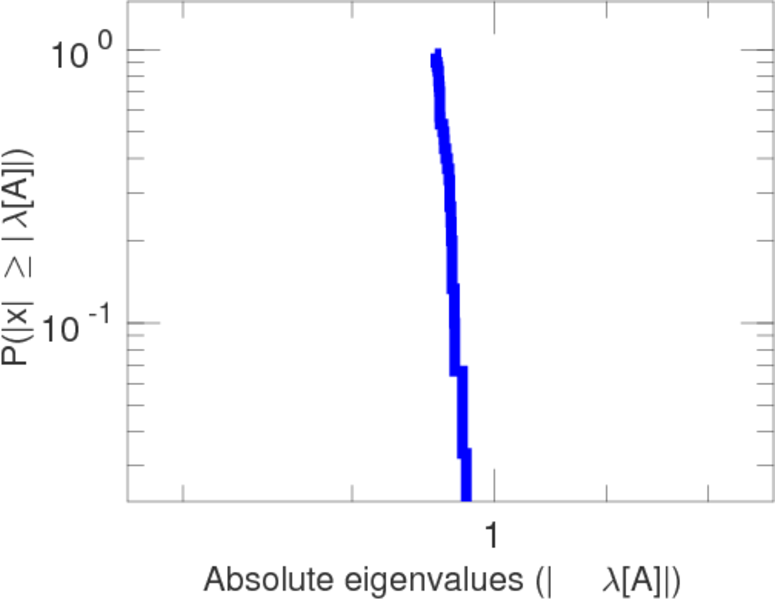
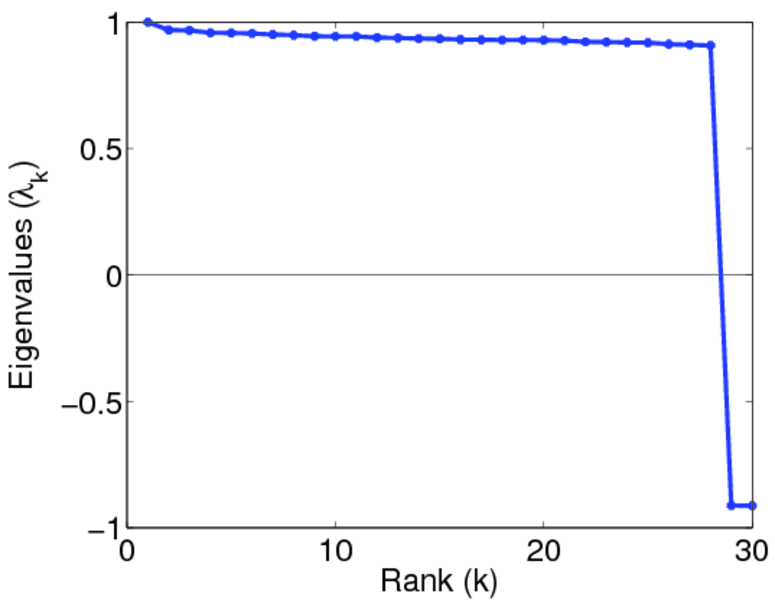
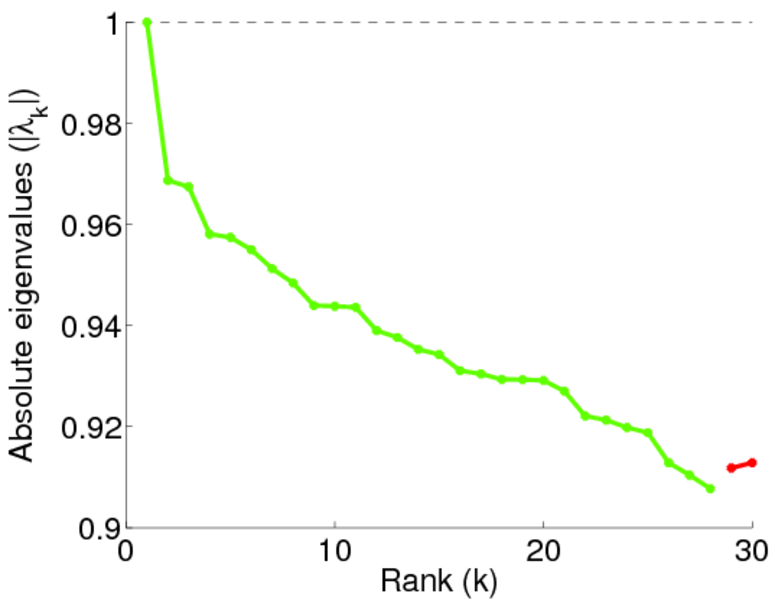
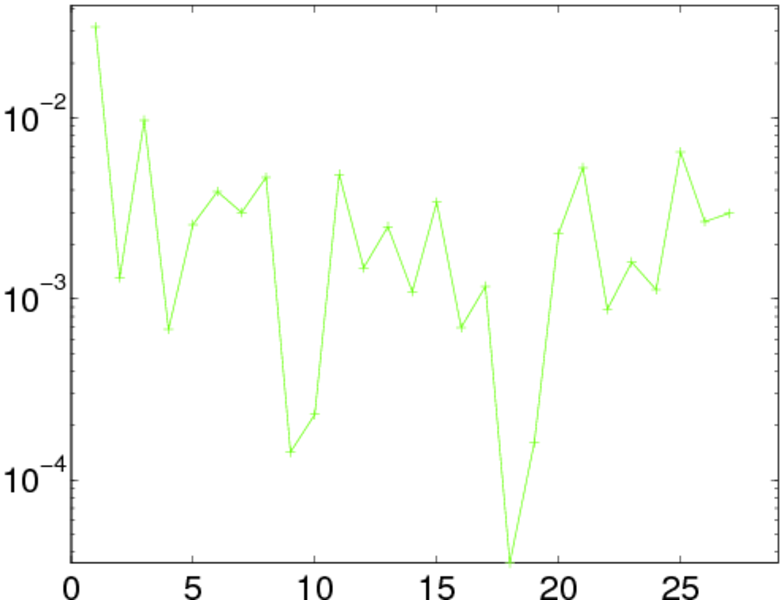
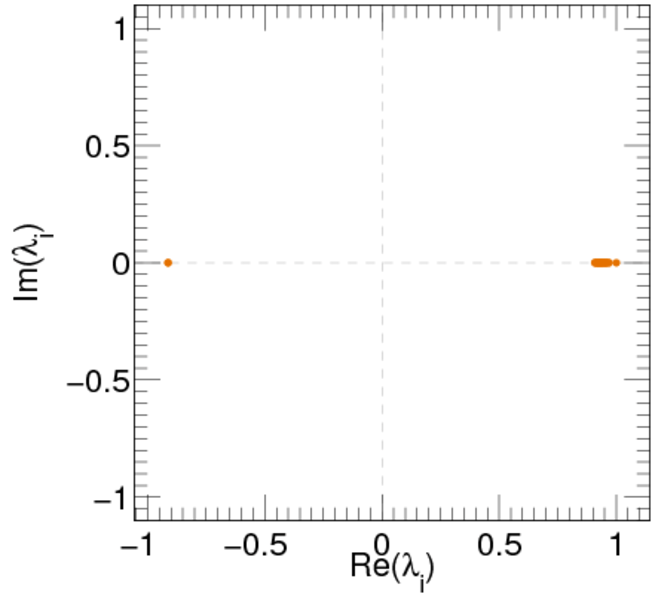
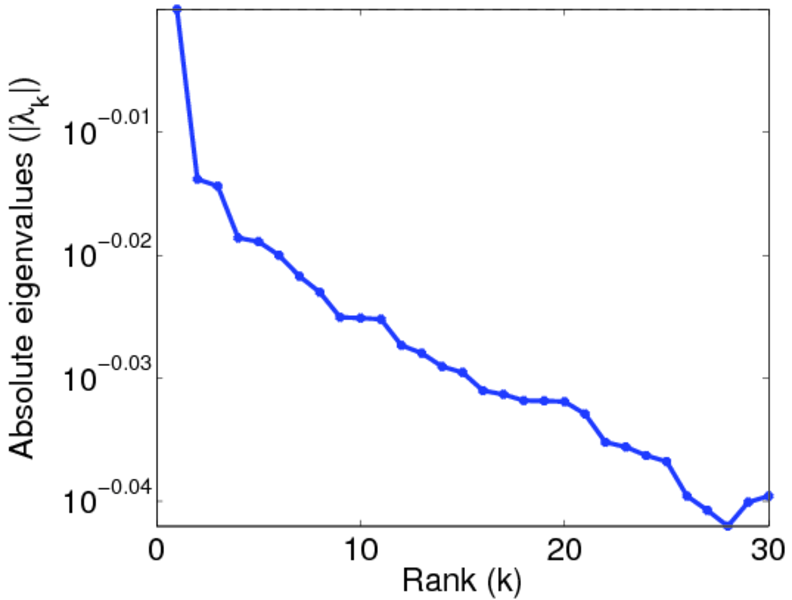
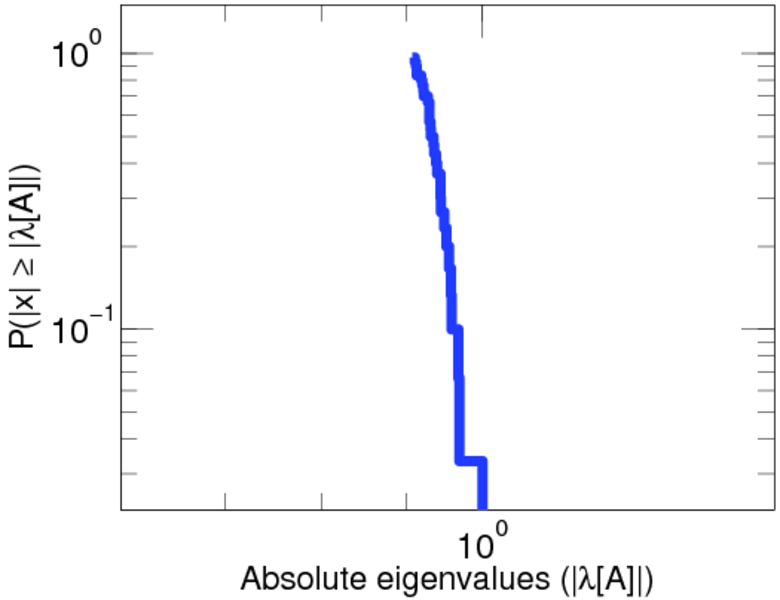
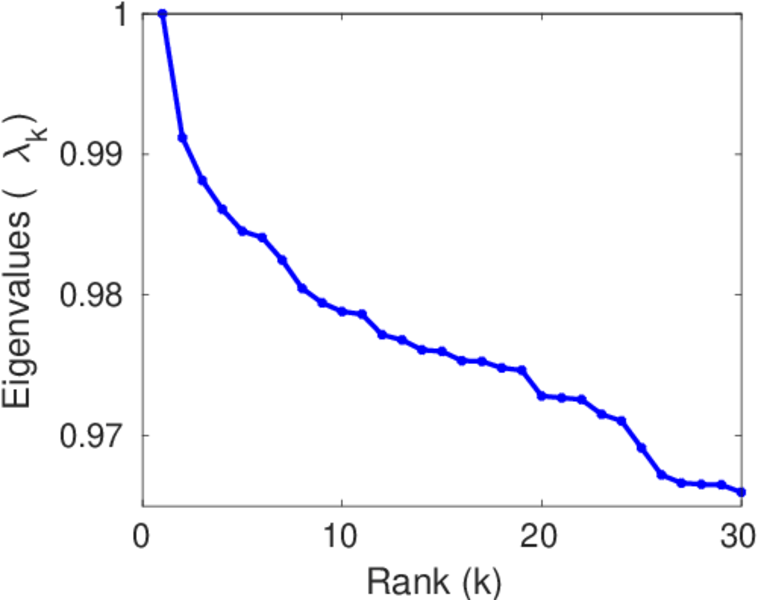
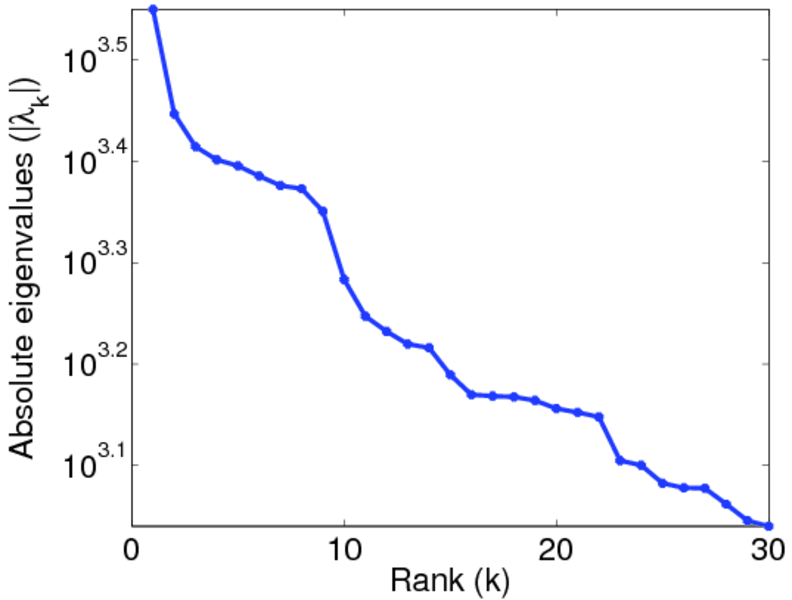
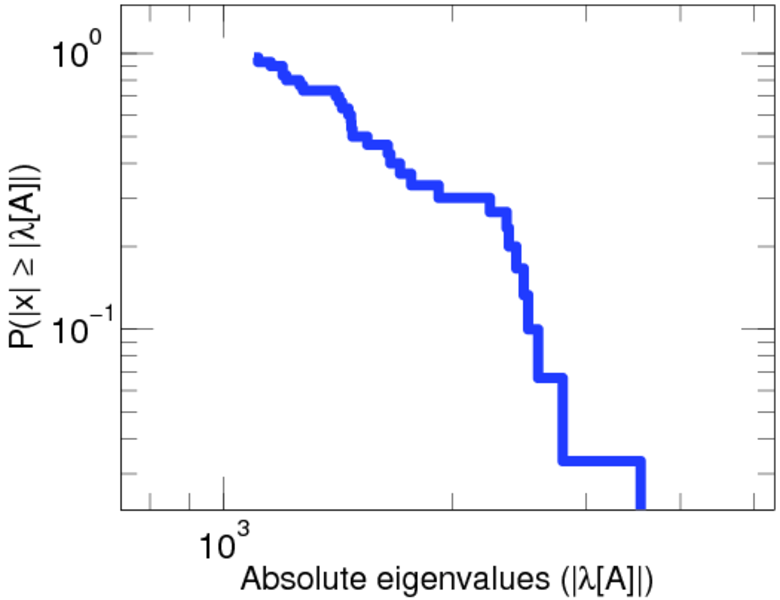
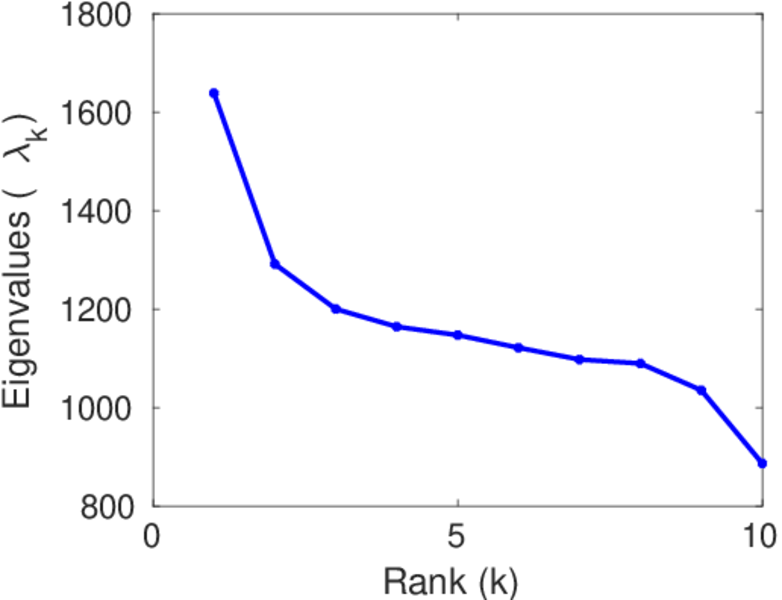
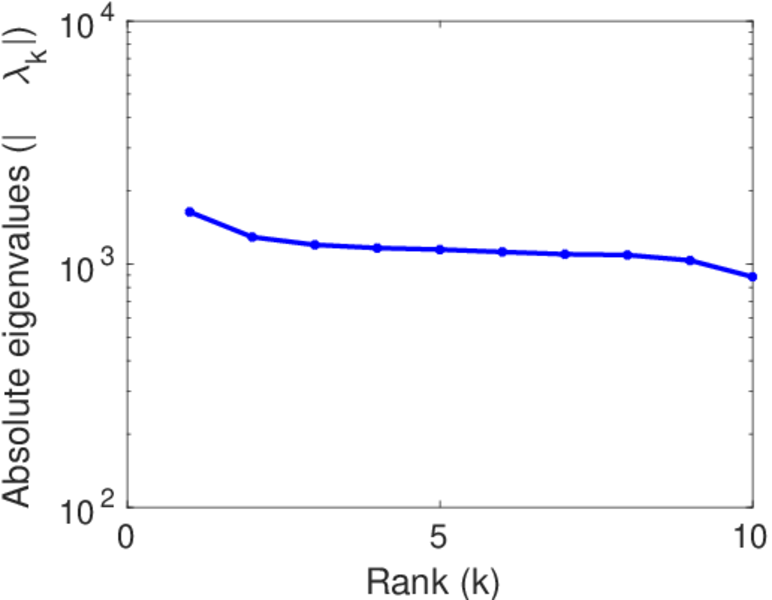
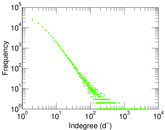
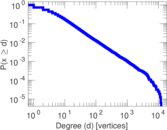
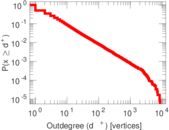
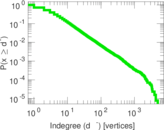
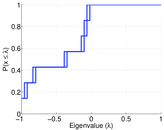
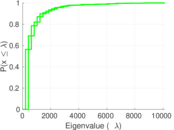
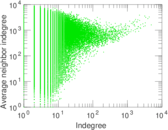
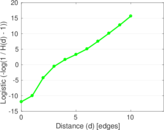
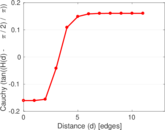
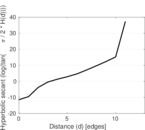
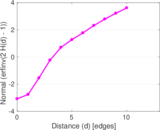
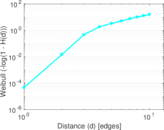
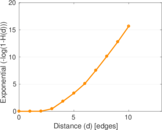
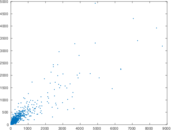
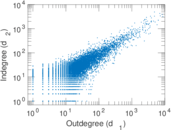
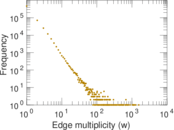
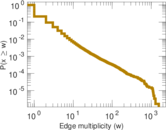
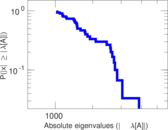
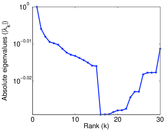
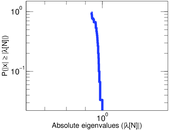
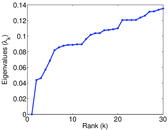
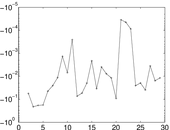
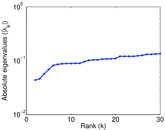
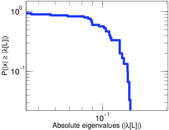
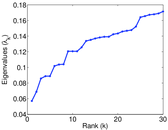
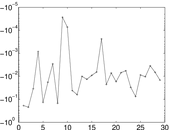
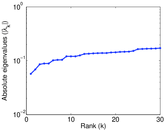
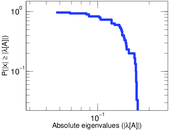
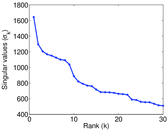
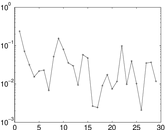
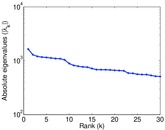
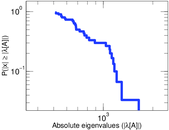
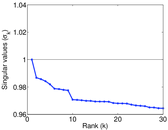
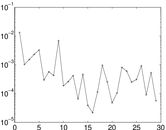
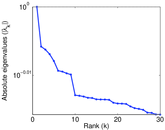
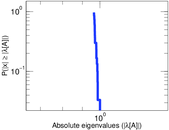
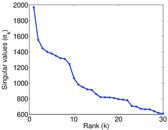
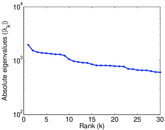
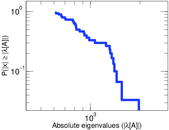
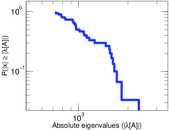
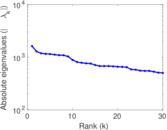
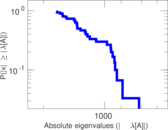
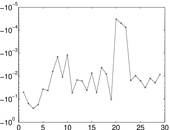
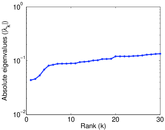
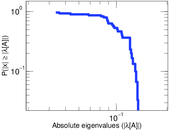
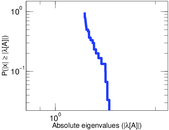
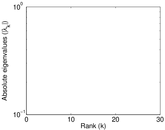
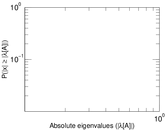
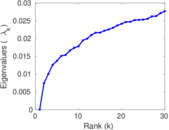
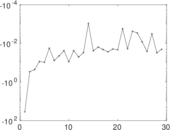
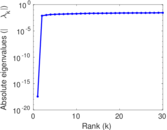
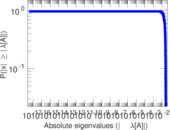
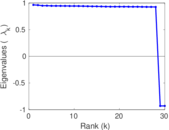
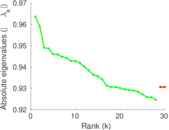
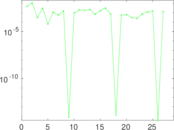
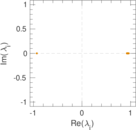
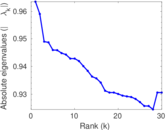
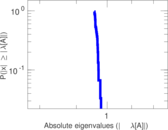
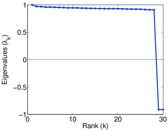
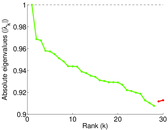
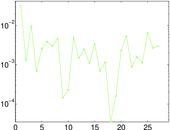
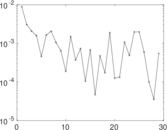
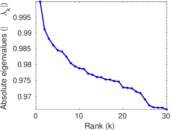
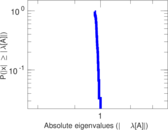
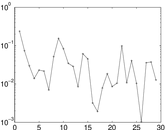
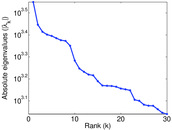
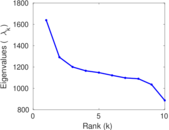
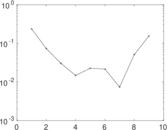
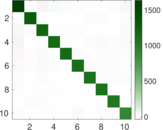
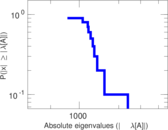
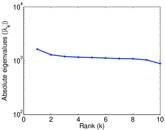
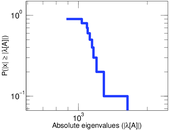
Plots


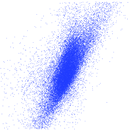


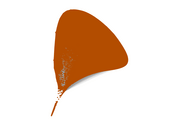


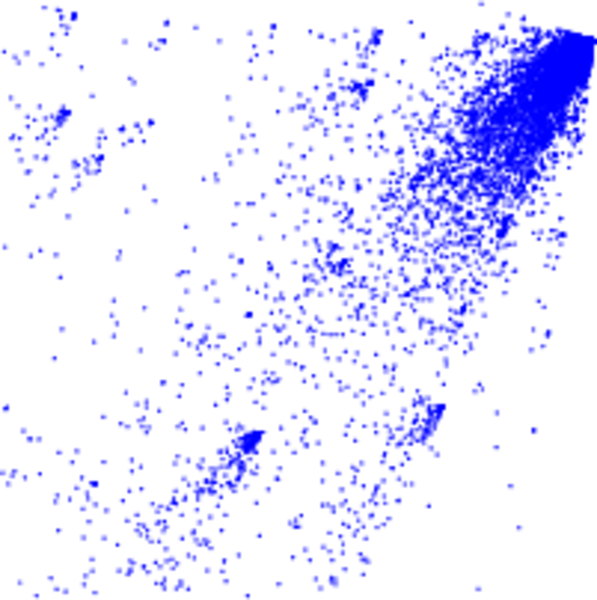
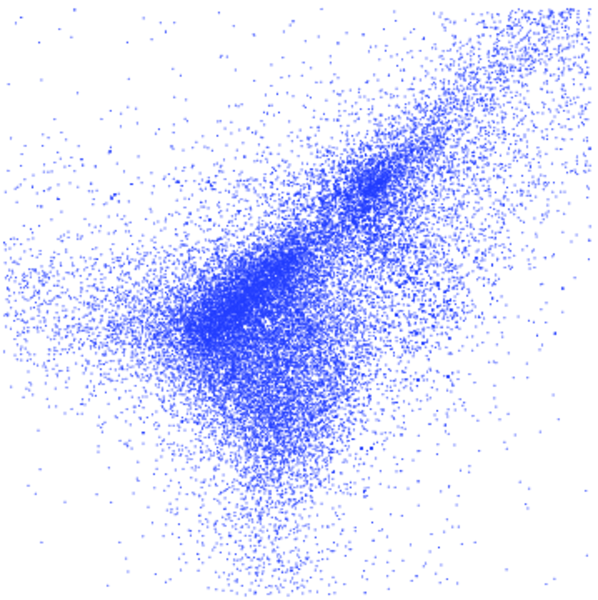
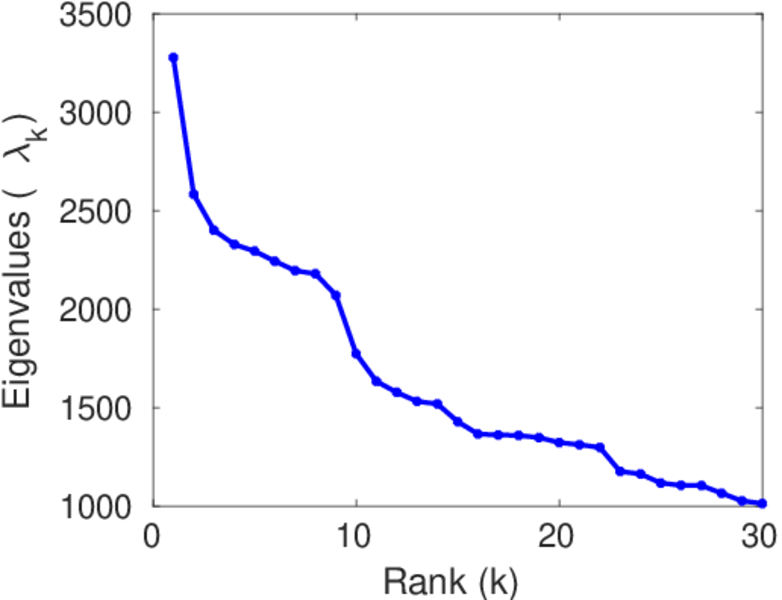
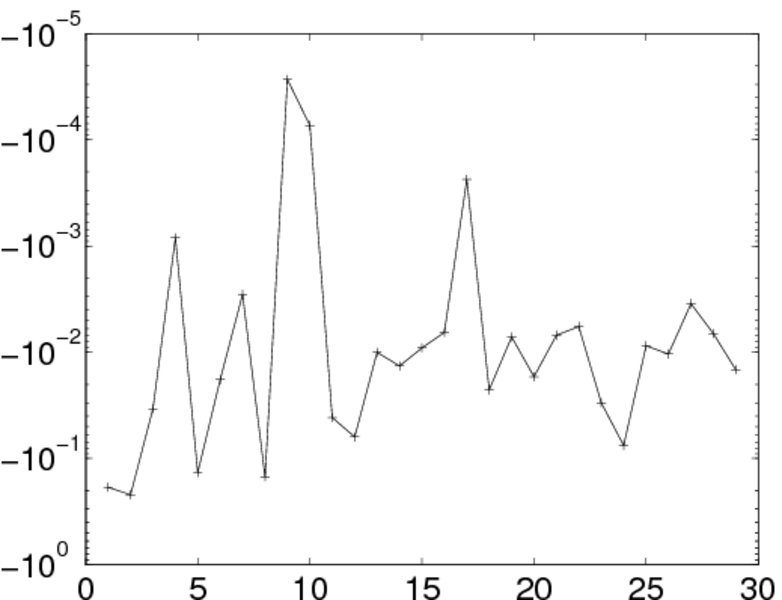
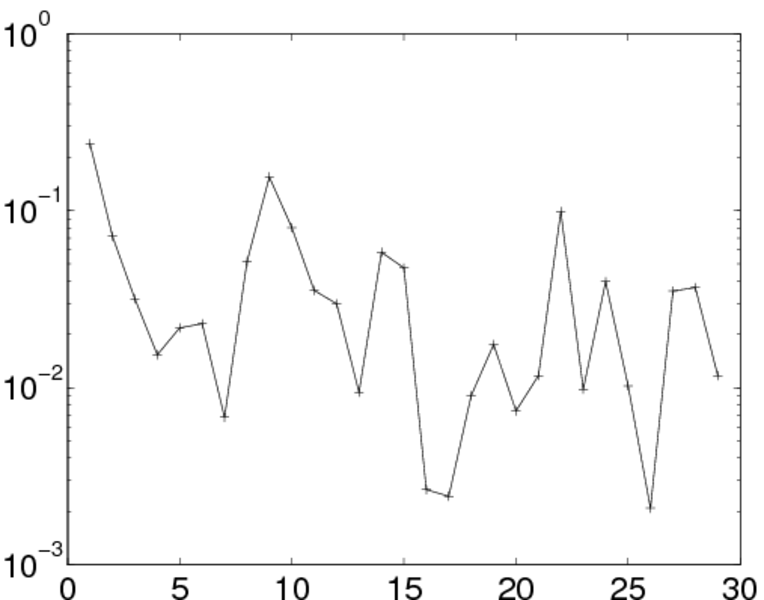
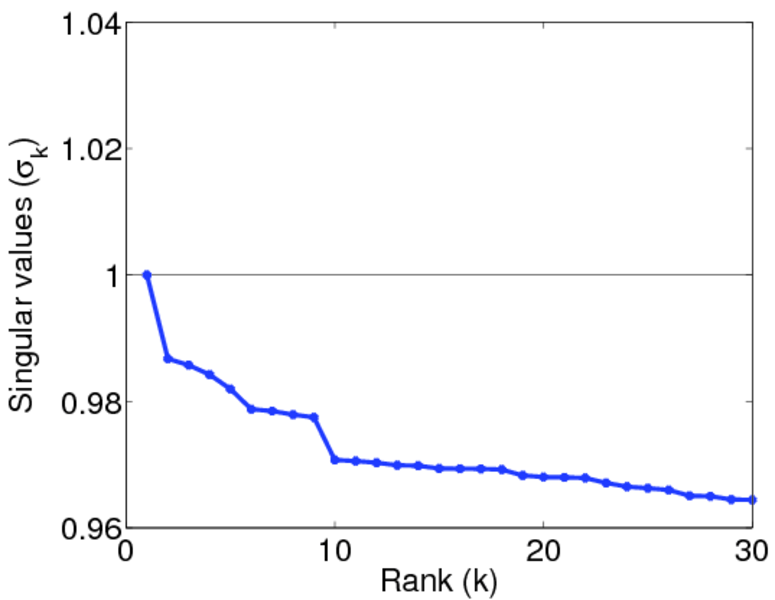
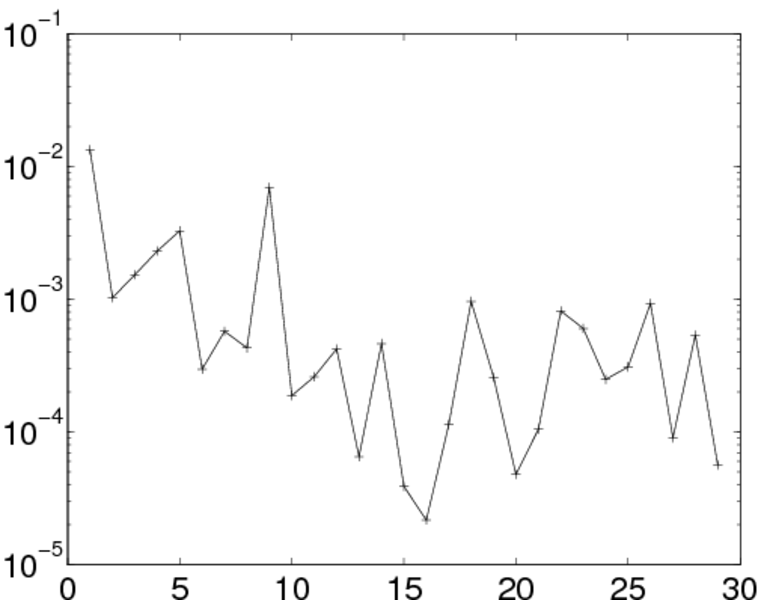
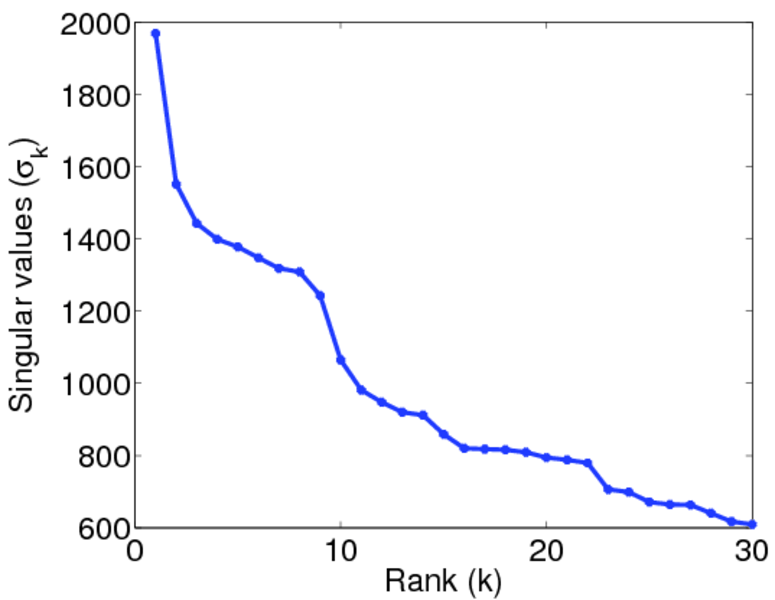
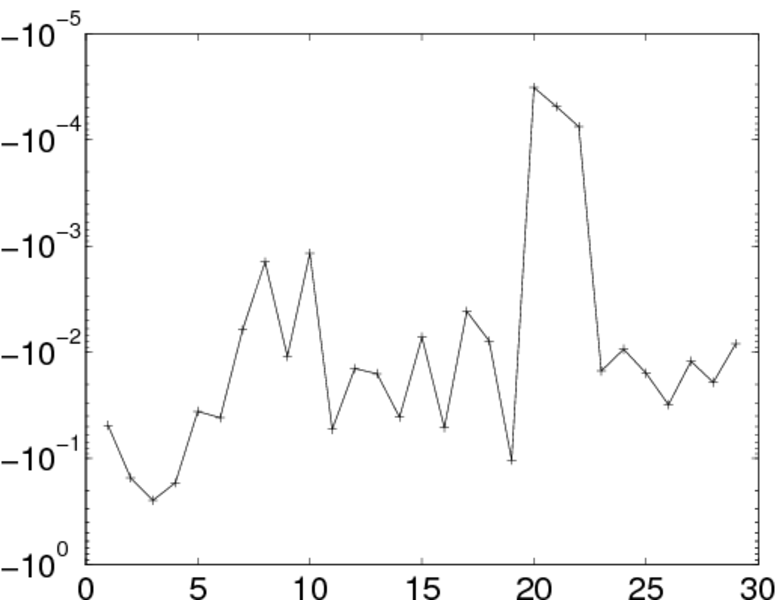
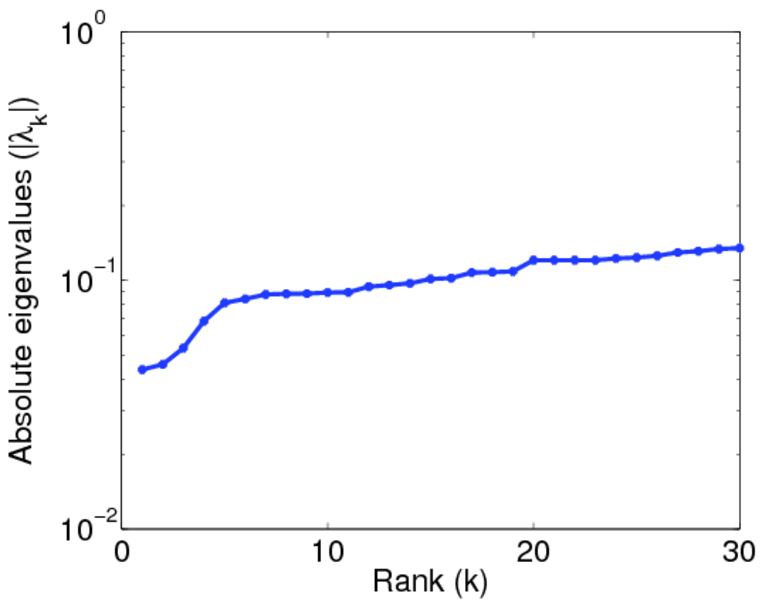
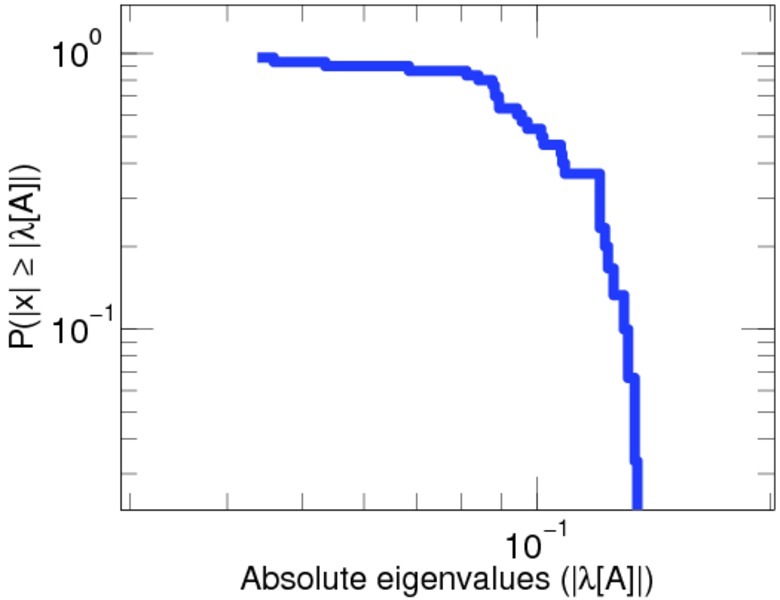
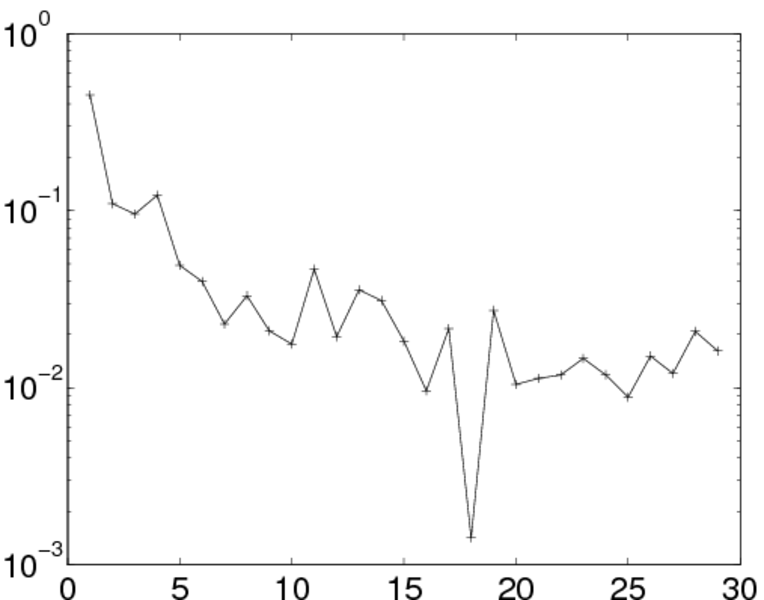
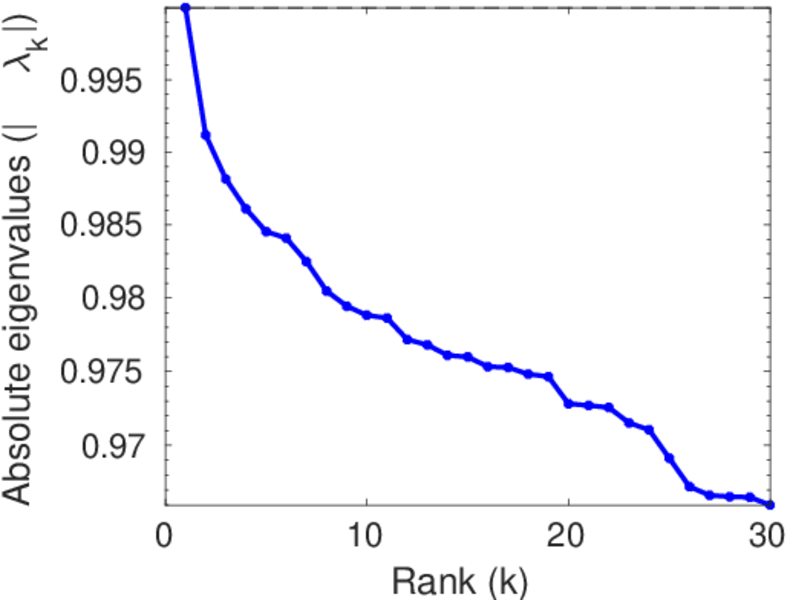
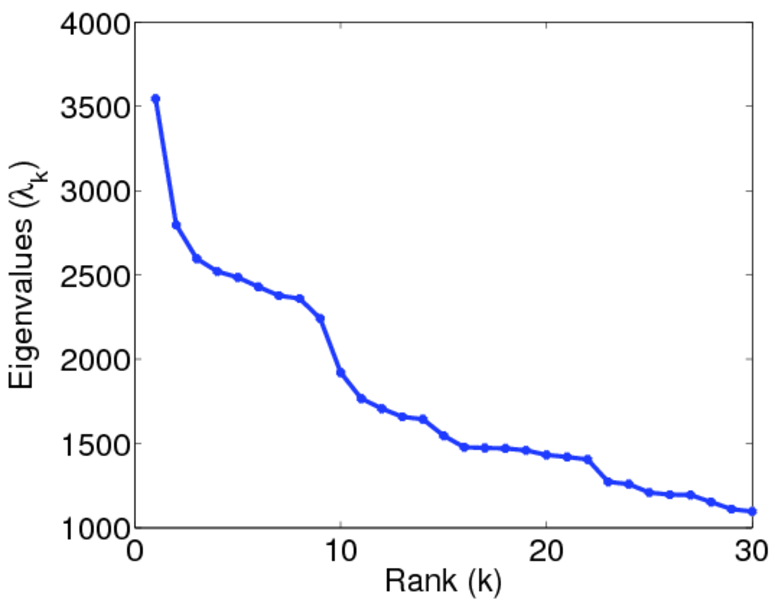
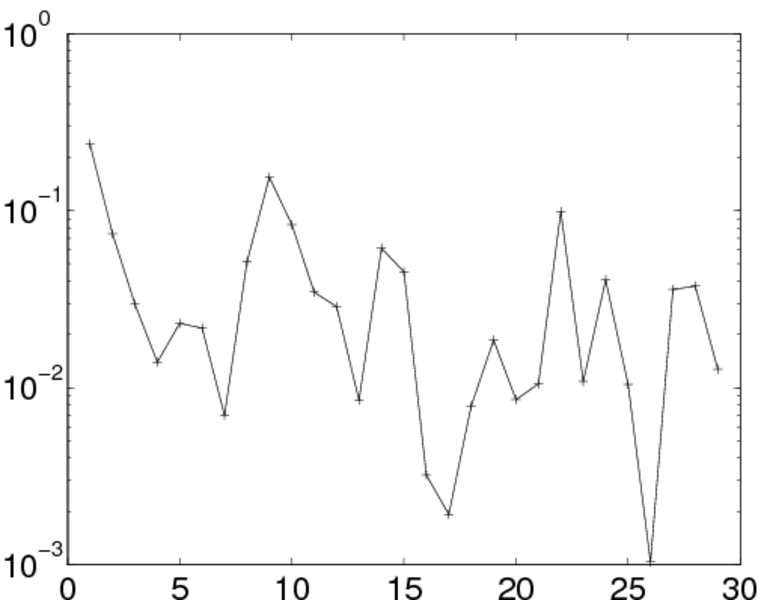
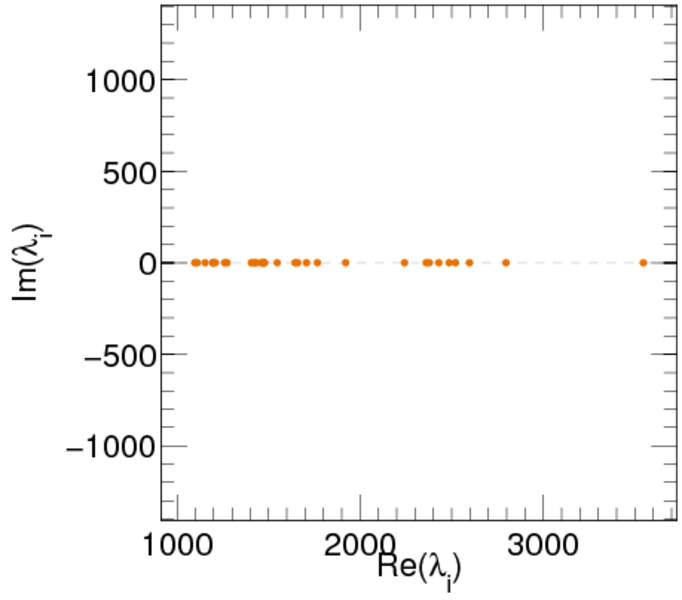
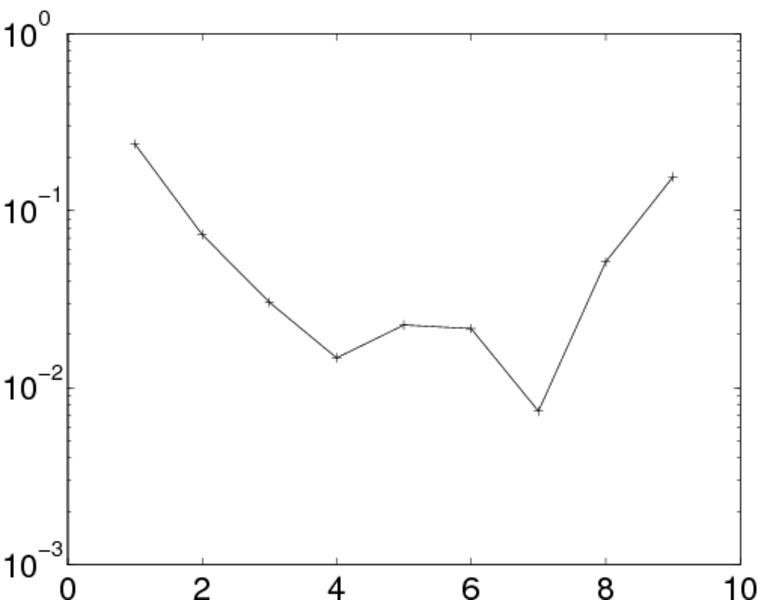
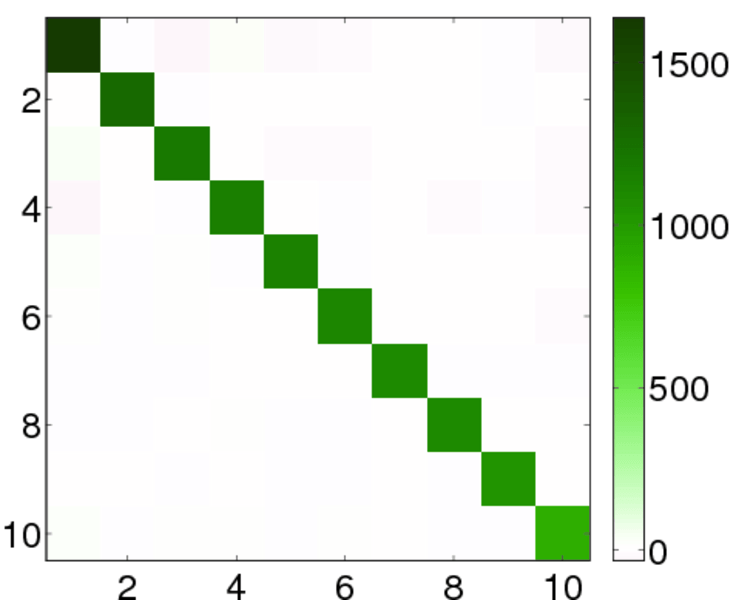
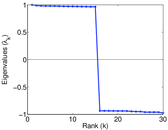
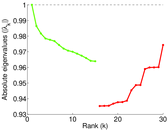
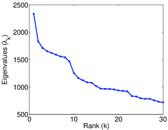
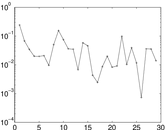
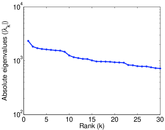
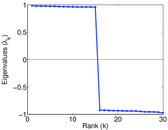
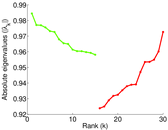
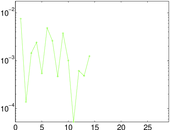
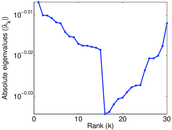
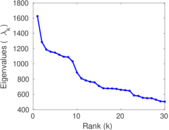
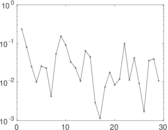
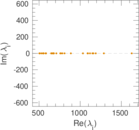
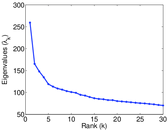
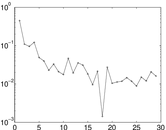
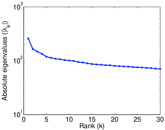
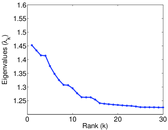
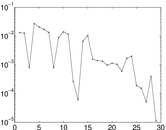
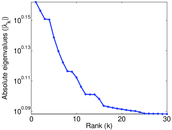
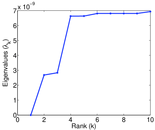
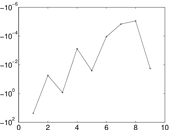
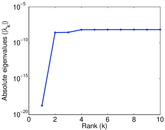
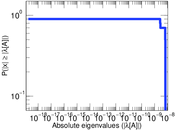
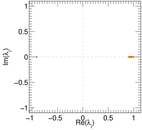
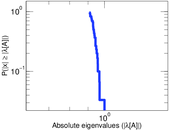
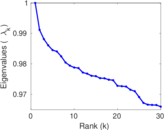
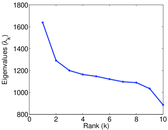
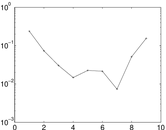
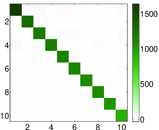
Matrix decompositions plots


Downloads
References
|
[1]
|
Jérôme Kunegis.
KONECT – The Koblenz Network Collection.
In Proc. Int. Conf. on World Wide Web Companion, pages
1343–1350, 2013.
[ http ]
|
|
[2]
|
Jure Leskovec.
Stanford Network Analysis Project.
http://snap.stanford.edu/, September 2014.
|
 KONECT ‣ Networks ‣
Buy Me a Coffee
KONECT ‣ Networks ‣
Buy Me a Coffee